Back to Journals » Clinical Epidemiology » Volume 14
Advancing an Algorithm for the Identification of Patients with High Data-Continuity in Electronic Health Records
Authors Merola D ![]() , Schneeweiss S
, Schneeweiss S ![]() , Jin Y
, Jin Y ![]() , Lii J, Lin KJ
, Lii J, Lin KJ ![]()
Received 9 April 2022
Accepted for publication 9 July 2022
Published 8 November 2022 Volume 2022:14 Pages 1339—1349
DOI https://doi.org/10.2147/CLEP.S370031
Checked for plagiarism Yes
Review by Single anonymous peer review
Peer reviewer comments 3
Editor who approved publication: Dr Eyal Cohen
David Merola,1,2 Sebastian Schneeweiss,1,2 Yinzhu Jin,1 Joyce Lii,1 Kueiyu Joshua Lin1,3
1Division of Pharmacoepidemiology and Pharmacoeconomics, Department of Medicine, Brigham and Women’s Hospital, Harvard Medical School, Boston, MA, USA; 2Department of Epidemiology, Harvard TH Chan School of Public Health, Boston, MA, USA; 3Department of Medicine, Massachusetts General Hospital, Harvard Medical School, Boston, MA, USA
Correspondence: Kueiyu Joshua Lin, Division of Pharmacoepidemiology and Pharmacoeconomics, Department of Medicine, Brigham and Women’s Hospital, Harvard Medical School, 1620 Tremont St. Suite 3030, Boston, MA, 02120, USA, Tel +1 617 278-0930, Fax +1 617 232-8602, Email [email protected]
Background: Identifying high data-continuity patients in an electronic health record (EHR) system may facilitate selecting cohorts with a lower degree of variable misclassification and promote study validity. We updated a previously developed algorithm for identifying patients with high EHR data-completeness by adding demographic and health utilization factors to improve adaptability to networks serving patients of diverse backgrounds. We also expanded the algorithm to accommodate data in the ICD-10 era.
Methods: We used Medicare claims linked with EHR data to identify individuals aged ≥ 65 years. EHR-continuity was defined as the proportion of encounters captured in EHR data relative to claims. We compared the model with additional demographic factors and their interaction terms with other predictors with the original algorithm and assessed the performance by area under the ROC curve (AUC) and net reclassification index (NRI).
Results: The study cohort consisted of 264,099 subjects. The updated prediction model had an AUC of 0.93 in the validation set. Compared to the previous model, the new model had an NRI of 37.4% (p< 0.001) for EHR-continuity classification. Interaction terms between demographic variables and other predictors did not improve the performance. Patients within the top 20% of predicted EHR-continuity had four times less misclassification of key variables compared to the remaining population.
Conclusion: Adding demographic and healthcare utilization variables significantly improved the model performance. Patients with high predicted EHR-continuity had less misclassification of study variables compared to the remaining population in both ICD-9 and 10 eras.
Keywords: electronic medical records, comparative effectiveness research, information bias, data continuity
Introduction
Electronic health record (EHR) systems are a promising resource to clinical investigators because they contain an abundance of patient-level, longitudinal health information that is instrumental to implementing comparative effectiveness research (CER) studies. Despite their utility, EHR data may be fraught with missing data. Although methodologies have been developed to address missing data challenges in some capacity (eg, multiple imputation and natural language processing),1 there is a great need for a formalized approach to handling data discontinuity.2
Excluding the small numbers of highly integrated healthcare systems, the typical US EHR systems do not comprehensively capture medical encounters across all care settings (eg ambulatory office, emergency room, hospitalizations, etc.) and may miss a substantial amount of information that characterizes the health state of its patient population. Data discontinuity arises when a patient seeks health care outside of the network that is captured by a particular EHR system. Medical conditions recorded at a facility outside of the EHR system accessible to the study team is a type of “missing data”. Because investigators often classify individuals without the recording of certain condition as “not having the condition” in the study, such kind of missing data is translated into misclassification of key variables. It has been shown that EHR discontinuity can lead to a substantial amount of bias.2 In contrast, for individuals with insurance coverage in the US healthcare system, because of strong financial incentives, billable medical encounters are expected to be recorded in the insurance claims data, regardless of the EHR systems providing the care.
Using the linked claims-EHR data as the reference standard, we have previously developed a prediction model to identify subjects with high levels of EHR-continuity.3,4 Restriction of the analyses to the high EHR continuity cohort has been shown to mitigate misclassification bias across several medications, confounders, and outcomes commonly used in drug safety and effectiveness studies.3,4 However, the published algorithm did not consider demographic information and some healthcare utilization factors, which may affect care continuity in an EHR system. Also, the prior model was based on only International Classification of Diseases version 9 (ICD-9) codes. Since there has been a substantial change in coding practices after the United States (US) switched to the ICD-10 system in 2015, we aimed to refine and validate the previously developed continuity prediction model with more recent data including the ICD-10 era and additional demographic and healthcare utilization predictors.4 The model can be utilized by clinical investigators to identify high-continuity subjects in EHR data-based studies and improve study validity.
Materials and Methods
Data Sources
We linked Medicare administrative claims and EHR from 2 networks. The first network (EHR system 1) consists of 1 tertiary hospital, 2 community hospitals, and 19 primary care centers. The second network (EHR system 2) includes 1 tertiary hospital, 1 community hospital, and 18 primary care centers. Consistent with our prior study, EHR system 1 was used for training and system 2 for validating the EHR-continuity prediction model.4 The EHR data was linked with claims data deterministically by insurance policy number, date of birth, and gender. The linkage success rate was 98.7%. The EHR database contains information on patient demographics, medical diagnoses, procedures, medications, and various clinical data. The Medicare claims data contain information on demographics, enrollment start- and end-dates, dispensed medications and performed procedures, and medical diagnoses.5 Collectively, the features of this linked dataset permit: 1) the development of a prediction model for data continuity; 2) evaluation of key variable misclassification (assuming claims data as a “reference standard” because it captures all medical activities provided across EHRs); and 3) measurement of the difference(s) in key variables between subjects with high vs low EHR continuity.
Study Population
Study subjects were selected on the basis of having (1) at least 365 days of continuous enrollment in Medicare Parts A (inpatient coverage), B (outpatient coverage), and D (pharmacy coverage); (2) at least 1 encounter in the EHR system during the 365-days of continuous enrollment in Medicare; and (3) being at least 65 years of age at cohort entry. To enhance the accuracy of the linkage between health records and claims, subjects were excluded if they had a different sex or date of birth listed between the databases. Subjects were followed from the first day at which they met all eligibility criteria (ie, henceforth the “index date”) to censoring, defined as the first day of the following: (1) end of continuous enrollment in Medicare Part A, B, or D; (2) death; or (3) administrative end of data, (December 31, 2017). The data were segmented into 365-day intervals following cohort entry and were truncated at the beginning of the interval at which censoring occurred.
EHR Continuity and Candidate Predictors
The statistical methods have been described in detail in our prior studies.4 Briefly, we defined a measure of EHR continuity as the mean proportion of inpatient and outpatient health record encounters captured in Medicare claims, calculated as follows:
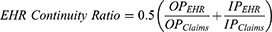
where “OP” and “IP” indicate the number of outpatient and inpatient encounters recorded, respectively. Because only billable encounters are expected to be recorded in the claims data, EHR encounters that could not be found in the Medicare encounters by admission and discharge dates were considered non-billable encounters and excluded. As patients tend to have more outpatient encounters than inpatient, we implicitly give greater weight to inpatient encounters by weighting them equally to outpatient encounters. Our reasoning for this is that diagnosis codes are generally recorded more accurately in the inpatient setting than in outpatient settings.6 The inpatient proportions in those without any inpatient encounter in the claims data cannot be calculated and thus ignored. Candidate predictors were all measured in the 365 days following cohort entry in the EHR database and included indicators for having a repeat encounter with the same physician, a general medical exam, body mass index (BMI) recorded, a pap smear or mammogram recorded, a colon cancer screening recorded, a vaccination encounter for pneumococcal or influenza, age at least 74 years (median age in our study cohort), and male sex. Additional categorical variables included number of diagnoses recorded (0, 1, 2+), number of physician office visits (1–2, 3–4, 5+), number of distinct drugs recorded (1–2, 3–4, 5–9, 10+), and race (white, black, others/unknown). All candidate predictors were considered for selection into the model, regardless of whether it was selected into our original model. The original model is displayed in Supplementary Table 1.
Model Development
In developing the prediction model for continuity, a 2-stage approach was undertaken. The first stage consisted of variable selection, where a Least Absolute Shrinkage and Selection Operator (LASSO) linear model was fit with 5-fold cross-validation in the training data by regressing EHR continuity ratio on all the candidate predictors described above. Variables selected by the model in the first stage were then placed into an ordinary linear regression for the second stage model, which was used for predicting continuity. In a sensitivity analysis, we added the product terms between dichotomized age (< vs ≥74, the median), gender, and race (white vs non-white) and all the other predictors in the initial LASSO regression for variable selection. The LASSO-selected variables were included in an ordinary linear regression as the model with consideration of demographic interactions. We compare model performance in original model (without demographic and health utilization factors), updated model (with additional factors) without interactions, vs updated model with interactions.
Model Performance Assessment
The model’s performance was then assessed in the validation data by calculating Spearman correlation coefficient for the observed vs predicted continuity ratio. Spearman correlation coefficient was used to measure the monotonicity of observed vs predicted continuity ratio and, more specifically, how well the model ranks each patient according to their observed continuity ratio. We assessed discrimination of the model using area under the receiver operator characteristic curve (AUROC) with a cutoff value of ≥0.6 (high continuity) vs <0.6, which, based on our prior work, separated patients with relatively good and poor misclassification. This was assessed as the percentage of all patient-pairs where the observed continuity ratio and model-predicted continuity ratio were concordant with respect to this binary classification. Given that the assessment of different models was done in the same study population, these areas under the curve are correlated. We therefore applied a hypothesis test proposed by DeLong et al to account for this correlation when comparing the AUROC of different models.7 Using the net reclassification improvement (NRI), we also compared the model’s ability to classify subjects into categories of low (<0.3), intermediate (0.3–0.59), and high (≥0.6) EHR continuity. These categories were informed by our prior study based on the extent of misclassification of essential variables.2 NRI quantifies the “improved reclassification” defined as moving the cases (patients with observed continuity ratio ≥0.6) into the higher continuity categories and the controls (patients with observed continuity ratio <0.6) into the lower continuity categories.
Variable Misclassification
We assessed misclassification of 40 selected variables commonly used as drug exposure (n = 15), and comorbidity/outcomes (n = 25) in CER (see Protocol and the Appendix for a list of the variables and their definitions). The misclassification was quantified by two metrics: (a) Sensitivity of positive coding in EHR when compared to coding in the linked claims-EHR data:

where “i” is indexing variable numbers 1 through 40. By design, because the reference standard was classification based on all available data, specificity was expected to be 100% for all variables but if the study EHR system did not capture medical information recorded in other healthcare networks, sensitivity could be low; (b) Standardized difference comparing the classification based on only EHR vs that based on the linked claims-EHR data: Standardized difference is a measure of distance between two group means standardized by their standard deviations. This metric is often used to assess balance of covariates for exposure groups under comparison.8 To have a reference point, it was suggested that a standardized difference of less than 0.1 indicates satisfactory balance of covariates in the context of achieving adequate confounding adjustment.9 Within deciles of predicted EHR Continuity Ratio, we computed mean sensitivity and mean standardized difference (MSD) over the 40 variables.
Representativeness Assessment
We compared the proportions of the combined comorbidity score (CCS)10 categories based on claims data in the top 20% vs lower 80% predicted EHR continuity cohort to see if those with high EHR-continuity had similar comorbidity profiles when compared to the remaining population. We used claims data for the representativeness assessment, assuming similar completeness of claims data across different levels of EHR-continuity.
All analyses were carried out using SAS v9.4 (SAS Institute, Inc., Cary, NC).
Results
Study Population
The attrition to the study cohort as each selection criterion was applied is displayed in Table 1. The overall study cohort consisted of 264,099 subjects, which were split into a training dataset (EHR system 1, n = 168,482; mean age = 74.0 [SD = 7.5], 59% women) and validation dataset (EHR system 2, n = 95,617; mean age = 73.2 [SD = 7.0], 62% women).
 |
Table 1 Attrition Table |
Model Coefficients
Parameter estimates from the final continuity prediction model are shown in Table 2 (adjusted R2 = 0.6625). Among the 14 variables selected into the model, all were positive contributors to predicted continuity with an exception for older age and having any emergency department (ED) visit. Male sex and non-white race were associated with higher EHR continuity. Healthcare utilization factors, including distinct drugs recorded in the EHR and number of hospitalization and office visits within the EHR, are predictive of high EHR continuity.
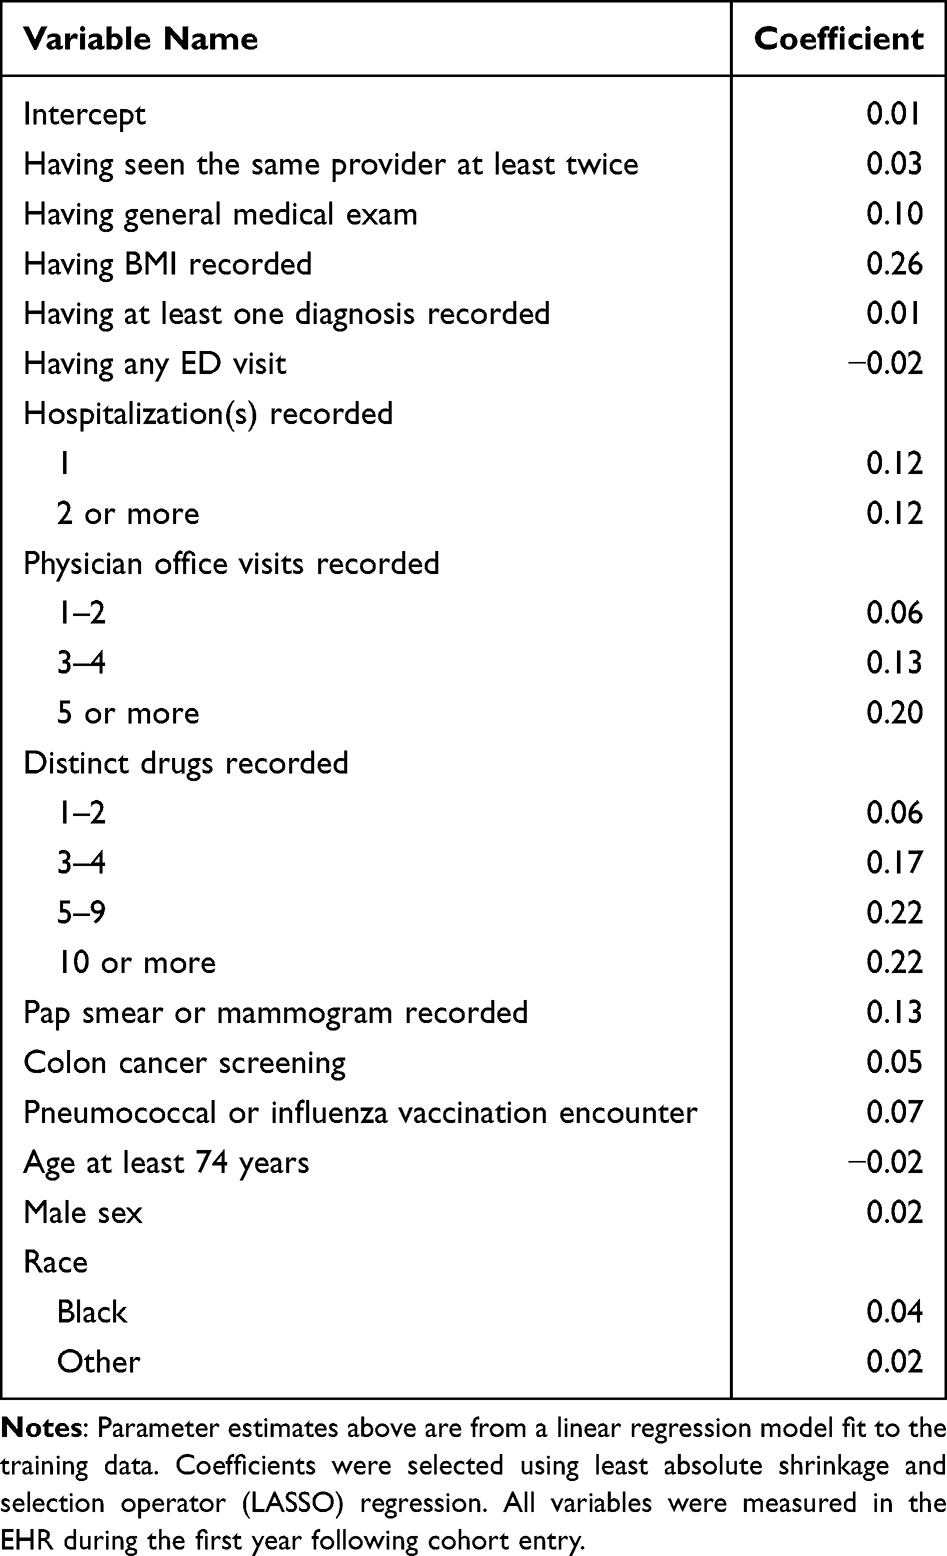 |
Table 2 Parameter Estimates from Continuity Prediction Model with Demographics |
Correlation and Discrimination
The Spearman correlation coefficient for the observed vs predicted continuity was 0.83 in the training and 0.85 in the validation dataset, which was similar to the original model without demographics ( ). The AUC was 0.92 in the training and 0.93 in the validation dataset, compared to 0.93 with the original model without demographic factors in the validation set (p=0.019).
Risk Reclassification and Calibration
Table 3 shows the performance in classifying patients into high, intermediate, low EHR discontinuity by the model with vs without demographics and health utilization factors. Relative to our previously developed model without demographics, the updated model with the additional factors reclassified a total of 14,057 high EHR continuity patients (57.3%) into higher continuity categories and 1152 low EHR continuity patients (1.6%) into lower continuity categories (net reclassification improvement, NRI = 37.4%, p<0.001) in the validation dataset. The calibration X-squared was 25,289 with the original model (p<0.001) and 11,922 with the updated model (p<0.001).
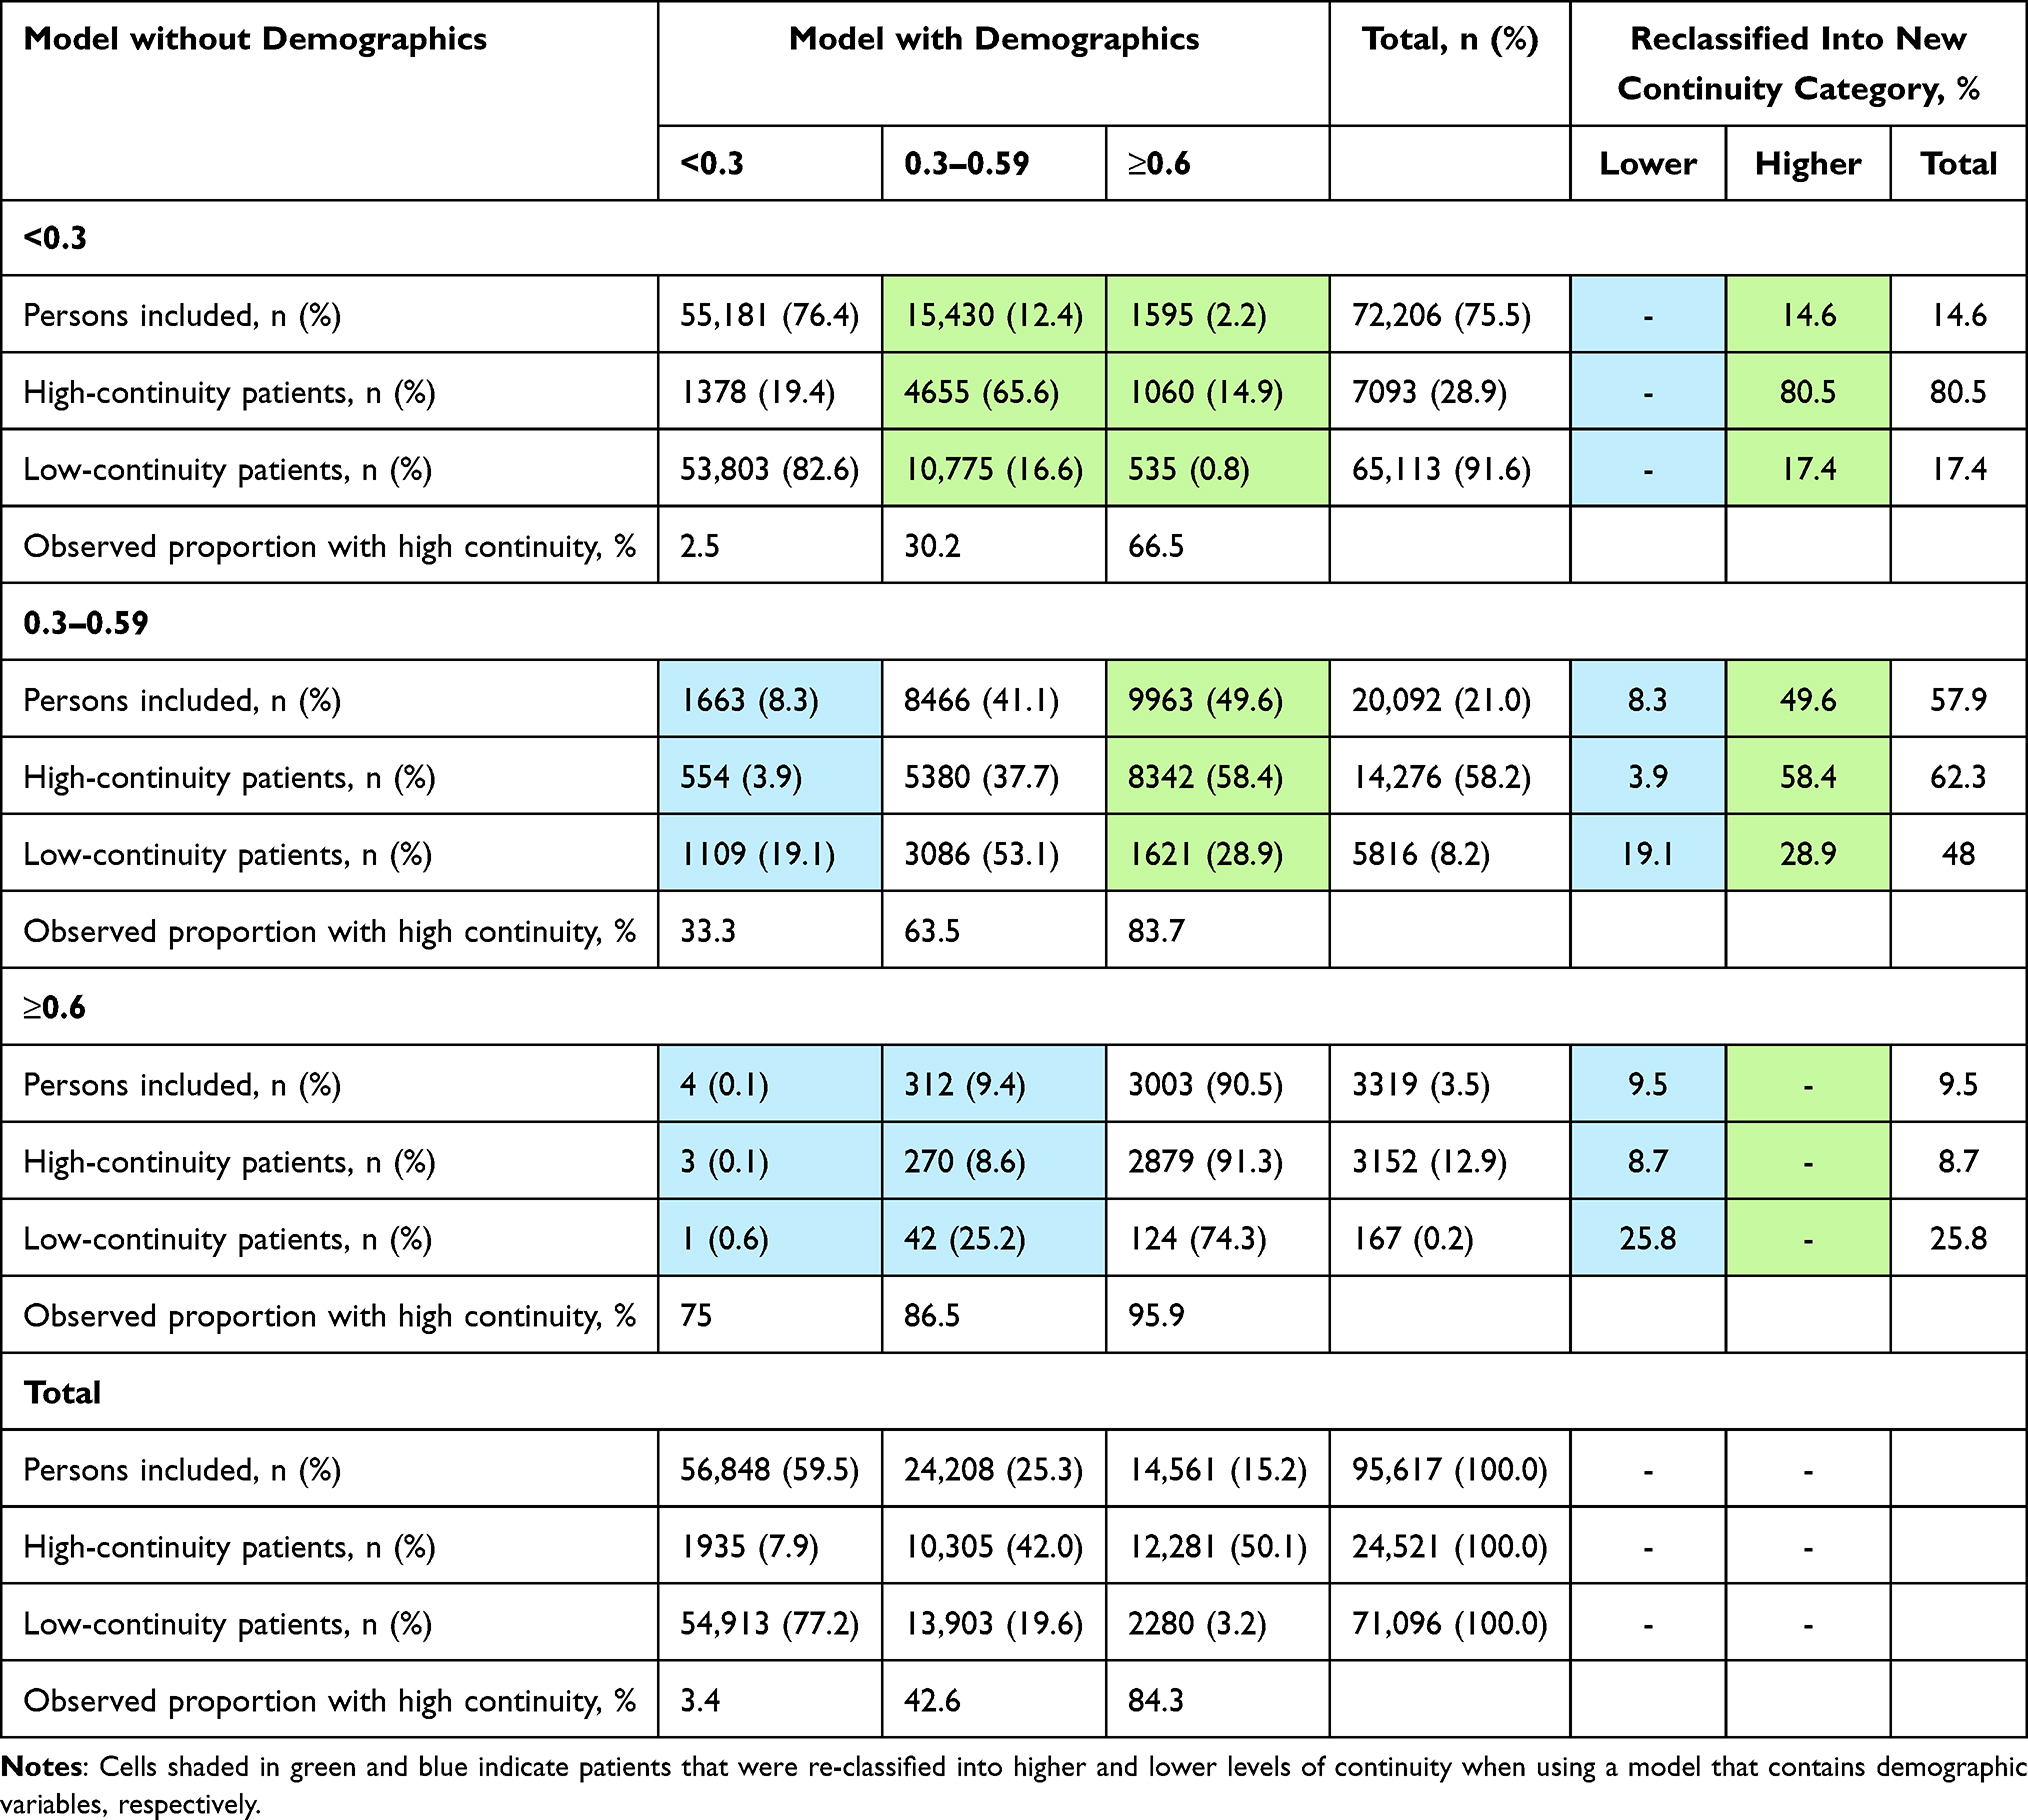 |
Table 3 Reclassification Table Comparing a Continuity Prediction Model with Demographics Terms versus Without Demographics Terms |
Misclassification of Key Variables
We observed a persistent trend that people with high EHR continuity has less misclassification quantified by sensitivity (Figure 1A and C) and MSD (Figure 1B and D). Based on a priori cut-off of MSD < 0.1, patients with top 20% of predicted continuity had acceptable mean MSD for the 40 CER-relevant variables. Those with top 20% of predicted EHR-continuity had substantially lower misclassification of the study variables compared to the remaining population across years after cohort entry. In the first year following the cohort-entry, the mean standardized difference in patients with top 20% of predicted EHR-continuity was 0.26 (95% CI: 0.25–0.26) times that in the remaining population in the validation set (Table 4).
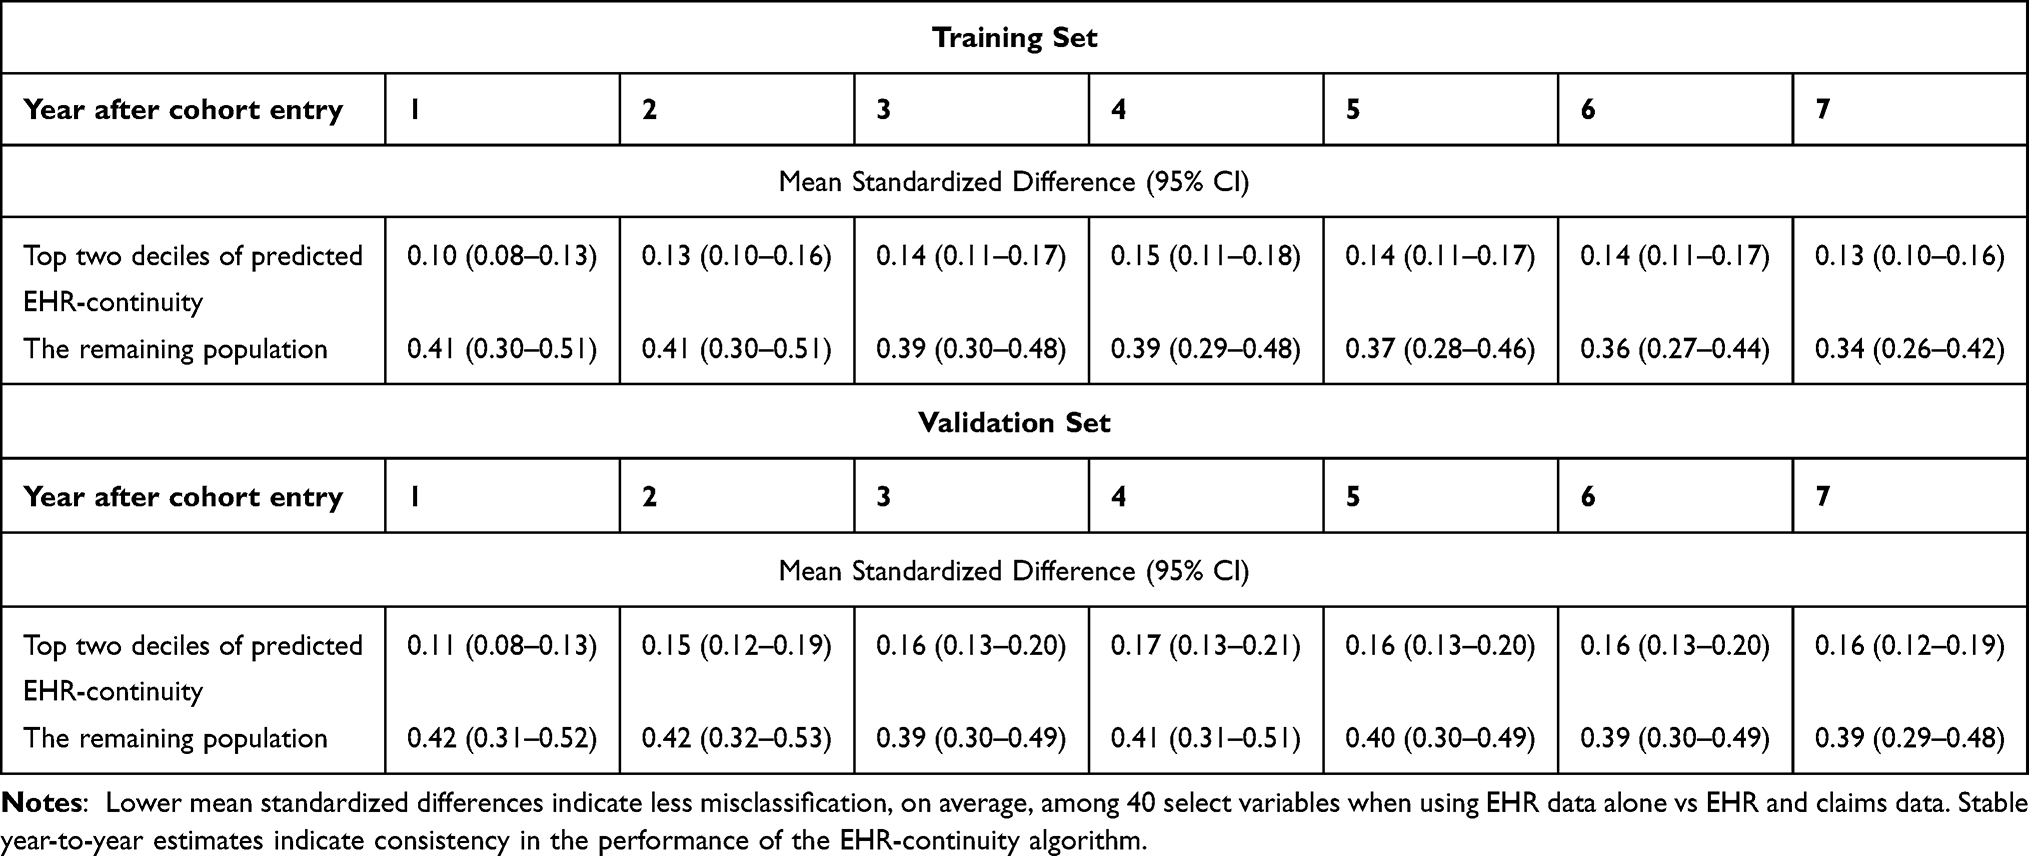 |
Table 4 Difference in Measuring 40 Selected Variables in EHR vs EHR + Claims Dataa |
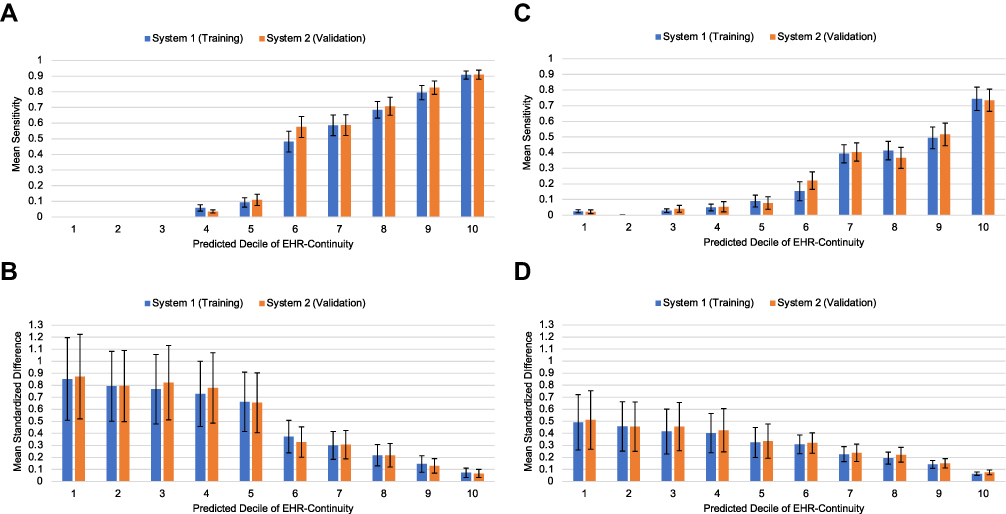 |
Figure 1 Misclassification among key variable groups by decile of predicted continuity. (A) Mean sensitivity for 15 medication use variables; (B) Mean standardized difference for 15 medication use variables; (C) Mean sensitivity for 25 comorbidity variables; (D) Mean standardized difference for 25 comorbidity variables. |
Representativeness Evaluation
We observed small differences between the distribution of CCS in the top two deciles of predicted EHR Continuity Ratio and in the rest of the population, with an overall MSD for all comorbidity score categories of 0.02 (Figure 2).
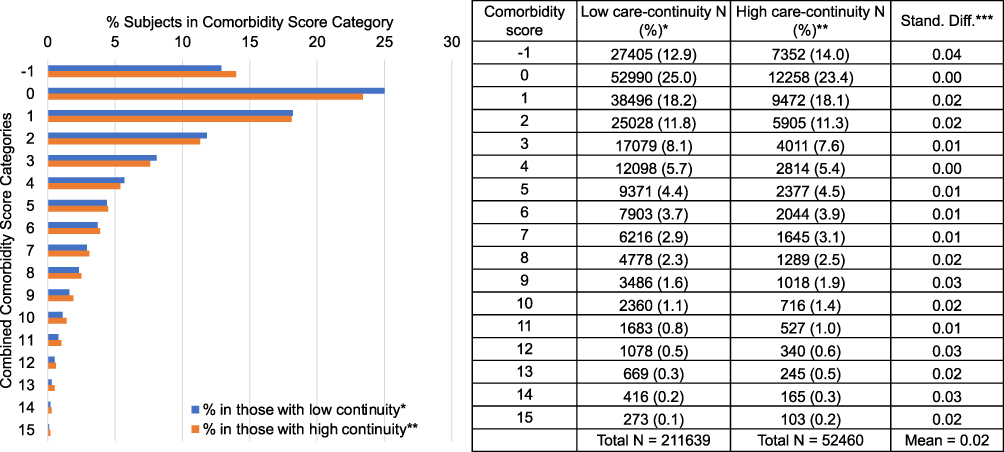 |
Figure 2 Representativeness: comparison of combined comorbidity score in those with high vs low data continuity. *Patients in the top 2 deciles of predicted care-continuity. **Patients in the remaining 8 deciles of predicted care-continuity. ***Stand diff: Standardized difference. Combined comorbidity score ranges between −2 to 26 with a higher score associated with higher mortality; smaller cell sizes were not presented here. |
Sensitivity Analysis
The introduction of interaction terms between demographic variables into the model yielded a Spearman correlation coefficient for the observed vs predicted continuity was 0.83 in the training and 0.85 in the validation dataset. The AUC was 0.922 in the training and 0.926 in the validation dataset. The reclassification table comparing the model with vs without interaction terms (both with demographics) did not demonstrate an improvement with the addition of interaction terms (NRI = –0.67%).
Discussion
We have expanded existing prediction models for EHR continuity by incorporating data in the ICD-10 era and demonstrated the model performance was robust to the changes in coding practice. Our results further strengthen the approach of using predicted EHR continuity to mitigate misclassification of key variables in comparative effectiveness studies using EHR data. We demonstrated that the addition of demographic variables to the prediction rule for continuity substantially improves classification of subjects into low (<0.3), intermediate (0.3–0.59), and high (≥0.6) continuity categories.
Our study cohort are individuals with the same medical insurance coverage (ie, Medicare fee-for-service coverage, which is the most common health insurance coverage for adults aged 65 years or older provided by the US governance). This is to ensure our study cohort has similar medical access in terms of insurance coverage on a population level, regardless of the EHR systems providing the care. Of note, because the EHR-continuity predictors were assessed based on the study EHR alone, the healthcare utilization variables (eg, number of hospitalizations, office visits, etc.) should not be interpreted as the actual health utilization for a particular patient but the medical care recorded in the given EHR system. It is possible that a particular patient may have high healthcare utilization, but it is recorded outside of the study EHR, in which case the low healthcare utilization recorded in the study EHR would signify a lower propensity of this patient having data-continuity within the system. This may explain why we observed a small difference in the co-morbidity score that incorporates a total of 20 medical conditions10 assessed by the claims data, when comparing those with high vs low predicted EHR-continuity (ie, those with low utilization of the study EHR reflected by low predicted EHR-continuity may have the claims diagnosis recorded due to care provided outside of study EHR, which indicates they are more likely to connected to other systems rather than having no medical needs). Yet, it should be noted that we did not assess all aspects of patient characteristics but only compared the comorbidity profiles based on administrative claims data and did not observe a substantial amount of difference between high and low-continuity cohort. The magnitude of such difference should be compared to potential misclassification due to EHR-discontinuity in those with low EHR-continuity. The observed mean standardized difference [MSD] of the combined comorbidity score between high vs low-continuity cohort was 0.02, which is about one-twentieth of the amount of misclassification when using the same metric to measure co-morbidities in the low EHR-continuity cohort [MSD=0.41].
When applying the predicted EHR continuity, it is also important for investigators to consider the possibility of introducing selection bias which may occur if being in the high EHR-continuity cohort is simultaneously associated with the exposure and outcome of interest in a given study. Although the combined co-morbidity score used to evaluate representativeness was highly correlated with mortality and a wide range of clinical endpoints,10 the relatively small difference in comorbidity profiles in those with high vs low EHR-continuity does not eliminate all possibility of selection bias. Consequently, investigators should consider such possibilities based on domain knowledge and the specific exposure and outcome of interest in each study.
Because predicting the absolute EHR capture rates can be challenging, we recommend using our algorithm to rank the study cohort in terms of the propensity of having high data EHR data-completeness. This approach was supported by our prior work showing that two geographically diverse EHR systems have very similar EHR capture rate distributions, which suggests that the two distinct EHR systems have similar capacity to keep ~20–30% as their “primary-care population.”3 The application of our algorithm should be context-specific. For instance, we found the patients with top 20% of the predicted EHR-continuity to have the acceptable variable classification, based on a cut-off suggested in the context of achieving adequate confounding adjustment8 (Table 2). However, if the study needs to estimate the prevalence of certain condition with sensitivity >0.7, those with top 10% of the predicted EHR-continuity may be required.
The strongest overall predictors in the model included having BMI recorded, having 5 or more physician office visits, and having 10 or greater distinct drugs recorded. This seems to suggest that subjects who are more engaged within a healthcare network are more likely to stay inside that network for their overall health care needs (ie, have greater continuity). The positive association between healthcare utilization and EHR continuity will inevitably select people with more medical needs into the EHR continuity cohort, cautioning generalizing findings based on high EHR continuity patients to those with minimal interactions with the healthcare system, either for health or access reasons. It is also interesting to note the relationship between key demographics and predicted continuity. Older age had a negative association with EHR continuity, while male sex and black and other races were positively correlated with the EHR continuity. While the relationship between these factors and EHR continuity discovered in the prediction models may not necessarily be causal, the mechanism underlying the observed associations could be multi-factorial. For example, people with more complex co-morbidities may not be able to meet all their medical needs within the same system, whereas people with limited medical access or resources may be more likely to be restricted to the same system. Our findings should be viewed as hypothesis generating and they call for further investigation to clarify the relationship between healthcare disparities and EHR continuity.11,12
Our work has several limitations. First, our prediction rule for EHR continuity was developed in a dataset that consisted of Medicare beneficiaries aged 65 years or older. Furthermore, the patients contained in the EHR system were seen within two academic health systems in the Boston, MA area. Thus, the results we obtained may not be applicable to patients of other health systems in different regions, patients of younger ages, or the uninsured population. Second, our definition of EHR continuity assumes that all healthcare encounters are captured in the linked claims and EHR data sources which is a reasonable assumption overall, but a small number of services are not captured by insurance data. Third, although restriction to a cohort of subjects with the greatest relative continuity has been shown to maintain generalizability with respect to a comorbidity score, the characteristics of a high EHR continuity cohort could differ with respect to an innumerable number of other characteristics not included in the comorbidity score relative to the greater study population. These characteristics may include variables not typically found in claims or structured EHR data, such as severity of certain comorbidities, lifestyle, socioeconomic status, and frailty. Fourth, the best way of implementing the EHR continuity rule is unclear. For instance, in a longitudinal cohort study that has discrete time intervals, collider stratification bias may arise if the continuity prediction rule is implemented during the same interval that the outcome is measured (eg, as an artificial censoring rule).13 Informative censoring may arise if there is a common cause of the outcome and a component of the prediction rule (eg, acute illness may cause a visit to the emergency department—a component of the prediction rule—and hospital readmission—a commonly used outcome in retrospective studies). Implementing the prediction rule in time intervals that precede outcome assessment and/or during a baseline period of a study may be a more viable alternative. Applying the rule in this manner and excluding patients with lower levels of continuity ratio may ensure a more precise capture of potential confounders in the study cohort. However, as previously stated, when applying the rule, care should be taken to examine the distribution of important prognosticators in the study population before and after application of the rule to ensure representativeness is maintained. Lastly, we note that patients with lower healthcare utilization tend to have sporadic medical encounter and it is difficult to assess their EHR-continuity reliably. Consequently, this becomes a challenging population to investigate with our approach. However, this may not be a tremendous limitation in comparative effectiveness investigations, in which pharmacotherapies are being assessed for the treatment of a medical condition. Patients with a medical condition(s) would generally be more engaged with the healthcare system and therefore be of interest in comparative effectiveness studies of medical treatments.
Conclusions
This expanded algorithm had a consistent performance in the ICD-10 era for identifying patients with high EHR-continuity. Patients with high predicted EHR-continuity has a representative comorbidity profile and much reduced misclassification in information on patient characteristics relevant for comparative effectiveness studies. Incorporating additional demographic and healthcare utilization variable significantly improved prior models but introduction of interaction terms between demographic variables and other predictors did not improve the performance. This generic algorithm may need to be adjusted to specialty care settings, eg, oncology or pediatrics. The general concept of continuity cohort, however, is highly valuable for conducting EHR-based clinical effectiveness studies.
Data Sharing Statement
Data supporting the results reported in this manuscript contain detailed, patient-level clinical information and therefore cannot be made available publicly to protect patient privacy.
Ethics Approval and Informed Consent
This research analyzed data retrospectively and was therefore exempt from review by the Institutional Review Board of Mass General Brigham.
Funding
This project was supported by NIH Grant R01LM012594. The study sponsor did not participate in any stages of this research, including study design, execution, or composition of this manuscript for publication.
Disclosure
Dr. Schneeweiss (ORCID# 0000-0003-2575-467X) is participating in investigator-initiated grants to the Brigham and Women’s Hospital from Boehringer Ingelheim unrelated to the topic of this study. He is a consultant to Aetion Inc., a software manufacturer of which he owns equity. His interests were declared, reviewed, and approved by the Brigham and Women’s Hospital in accordance with their institutional compliance policies. Dr. Merola owns equity in and is an employee of Aetion, Inc. The authors report no other conflicts of interest in this work.
References
1. Wells BJ, Chagin KM, Nowacki AS, Kattan MW. Strategies for handling missing data in electronic health record derived data. EGEMS. 2013;1(3):1035. doi:10.13063/2327-9214.1035
2. Lin KJ, Glynn RJ, Singer DE, Murphy SN, Lii J, Schneeweiss S. Out-of-system care and recording of patient characteristics critical for comparative effectiveness research. Epidemiology. 2018;29(3):356–363. doi:10.1097/EDE.0000000000000794
3. Lin KJ, Rosenthal GE, Murphy SN, et al. External validation of an algorithm to identify patients with high data-completeness in electronic health records for comparative effectiveness research. Clin Epidemiol. 2020;12:133–141. doi:10.2147/CLEP.S232540
4. Lin KJ, Singer DE, Glynn RJ, Murphy SN, Lii J, Schneeweiss S. Identifying patients with high data completeness to improve validity of comparative effectiveness research in electronic health records data. Clin Pharmacol Ther. 2018;103(5):899–905. doi:10.1002/cpt.861
5. Hennessy S. Use of health care databases in pharmacoepidemiology. Basic Clin Pharmacol Toxicol. 2006;98(3):311–313. doi:10.1111/j.1742-7843.2006.pto_368.x
6. Fang MC, Fan D, Sung SH, et al. Validity of using inpatient and outpatient administrative codes to identify acute venous thromboembolism: the CVRN VTE study. Med Care. 2017;55(12):e137–e143. doi:10.1097/MLR.0000000000000524
7. DeLong ER, DeLong DM, Clarke-Pearson DL. Comparing the areas under two or more correlated receiver operating characteristic curves: a nonparametric approach. Biometrics. 1988;44(3):837–845. doi:10.2307/2531595
8. Franklin JM, Rassen JA, Ackermann D, Bartels DB, Schneeweiss S. Metrics for covariate balance in cohort studies of causal effects. Stat Med. 2014;33(10):1685–1699. doi:10.1002/sim.6058
9. Austin PC. Balance diagnostics for comparing the distribution of baseline covariates between treatment groups in propensity-score matched samples. Stat Med. 2009;28(25):3083–3107. doi:10.1002/sim.3697
10. Gagne JJ, Glynn RJ, Avorn J, Levin R, Schneeweiss S. A combined comorbidity score predicted mortality in elderly patients better than existing scores. J Clin Epidemiol. 2011;64(7):749–759. doi:10.1016/j.jclinepi.2010.10.004
11. Brown LE, Burton R, Hixon B, et al. Factors influencing emergency department preference for access to healthcare. West J Emerg Med. 2012;13(5):410–415. doi:10.5811/westjem.2011.11.6820
12. Copeland VC. African Americans: disparities in health care access and utilization. Health Soc Work. 2005;30(3):265–270. doi:10.1093/hsw/30.3.265
13. Whitcomb BW, McArdle PF. Collider-stratification bias due to censoring in prospective cohort studies. Epidemiology. 2016;27(2):e4–e5. doi:10.1097/EDE.0000000000000432
 © 2022 The Author(s). This work is published and licensed by Dove Medical Press Limited. The
full terms of this license are available at https://www.dovepress.com/terms
and incorporate the Creative Commons Attribution
- Non Commercial (unported, 3.0) License.
By accessing the work you hereby accept the Terms. Non-commercial uses of the work are permitted
without any further permission from Dove Medical Press Limited, provided the work is properly
attributed. For permission for commercial use of this work, please see paragraphs 4.2 and 5 of our Terms.
© 2022 The Author(s). This work is published and licensed by Dove Medical Press Limited. The
full terms of this license are available at https://www.dovepress.com/terms
and incorporate the Creative Commons Attribution
- Non Commercial (unported, 3.0) License.
By accessing the work you hereby accept the Terms. Non-commercial uses of the work are permitted
without any further permission from Dove Medical Press Limited, provided the work is properly
attributed. For permission for commercial use of this work, please see paragraphs 4.2 and 5 of our Terms.