Back to Journals » Clinical Epidemiology » Volume 10
Adjusting for confounding by indication in observational studies: a case study in traumatic brain injury
Authors Cnossen MC, van Essen TA, Ceyisakar IE ![]() , Polinder S, Andriessen TM
, Polinder S, Andriessen TM ![]() , van der Naalt J, Haitsma I, Horn J, Franschman G, Vos PE, Peul WC, Menon DK, Maas AIR, Steyerberg EW
, van der Naalt J, Haitsma I, Horn J, Franschman G, Vos PE, Peul WC, Menon DK, Maas AIR, Steyerberg EW ![]() , Lingsma HF
, Lingsma HF ![]()
Received 18 October 2017
Accepted for publication 26 February 2018
Published 18 July 2018 Volume 2018:10 Pages 841—852
DOI https://doi.org/10.2147/CLEP.S154500
Checked for plagiarism Yes
Review by Single anonymous peer review
Peer reviewer comments 4
Editor who approved publication: Professor Vera Ehrenstein
Maryse C Cnossen,1 Thomas A van Essen,2,3 Iris E Ceyisakar,1 Suzanne Polinder,1 Teuntje M Andriessen,4 Joukje van der Naalt,5 Iain Haitsma,6 Janneke Horn,7 Gaby Franschman,8 Pieter E Vos,9 Wilco C Peul,2,3 David K Menon,10 Andrew IR Maas,11 Ewout W Steyerberg,1,12 Hester F Lingsma1
1Center for Medical Decision Making, Department of Public Health, Erasmus Medical Center Rotterdam, Rotterdam, the Netherlands; 2Neurosurgical Cooperative Holland, Department of Neurosurgery, Leiden University Medical Center, Leiden, the Netherlands; 3Department of Neurosurgery, Haaglanden Medical Center, The Hague, the Netherlands; 4Department of Psychology, RIVAS Healthcare Group, Gorinchem, the Netherlands; 5Department of Neurology, University Medical Center Groningen, Groningen, the Netherlands; 6Department of Neurosurgery, Erasmus Medical Center Rotterdam, Rotterdam, the Netherlands; 7Department of Intensive Care Medicine, Academic Medical Center, University of Amsterdam, Amsterdam, the Netherlands; 8Department of Anesthesiology, VU University Medical Center Amsterdam, Amsterdam, the Netherlands; 9Department of Neurology, Slingeland Hospital, Doetinchem, the Netherlands; 10Division of Anaesthesia, University of Cambridge/Addenbrooke’s Hospital, Cambridge, UK; 11Department of Neurosurgery, Antwerp University Hospital and University of Antwerp, Edegem, Belgium; 12Department of Medical Statistics and Bioinformatics, Leiden University Medical Center, Leiden, the Netherlands
Introduction: Observational studies of interventions are at risk for confounding by indication. The objective of the current study was to define the circumstances for the validity of methods to adjust for confounding by indication in observational studies.
Patients and methods: We performed post hoc analyses of data prospectively collected from three European and North American traumatic brain injury studies including 1,725 patients. The effects of three interventions (intracranial pressure [ICP] monitoring, intracranial operation and primary referral) were estimated in a proportional odds regression model with the Glasgow Outcome Scale as ordinal outcome variable. Three analytical methods were compared: classical covariate adjustment, propensity score matching and instrumental variable (IV) analysis in which the percentage exposed to an intervention in each hospital was added as an independent variable, together with a random intercept for each hospital. In addition, a simulation study was performed in which the effect of a hypothetical beneficial intervention (OR 1.65) was simulated for scenarios with and without unmeasured confounders.
Results: For all three interventions, covariate adjustment and propensity score matching resulted in negative estimates of the treatment effect (OR ranging from 0.80 to 0.92), whereas the IV approach indicated that both ICP monitoring and intracranial operation might be beneficial (OR per 10% change 1.17, 95% CI 1.01–1.42 and 1.42, 95% CI 0.95–1.97). In our simulation study, we found that covariate adjustment and propensity score matching resulted in an invalid estimate of the treatment effect in case of unmeasured confounders (OR ranging from 0.90 to 1.03). The IV approach provided an estimate in the similar direction as the simulated effect (OR per 10% change 1.04–1.05) but was statistically inefficient.
Conclusion: The effect estimation of interventions in observational studies strongly depends on the analytical method used. When unobserved confounding and practice variation are expected in observational multicenter studies, IV analysis should be considered.
Keywords: confounding, observational studies, traumatic brain injury, instrumental variable analysis, comparative effectiveness research
Introduction
RCTs have long been considered the cornerstone of evidence-based medicine.1 They are, however, not always feasible due to financial, ethical and practical constraints,2 and are criticized for the lack of external validity.1 Observational studies constitute the main alternative. A key challenge in observational studies of interventions is confounding by indication, a phrase that refers to a situation where patient characteristics, rather than the intervention, are independent predictors of outcome.3 As a consequence, patients exposed and not exposed to a particular intervention might not be comparable, hampering causal inference. World’s leading experts in this field have stressed the need for further development and testing statistical methods to handle confounding by indication.4–6
The epidemiological and statistical literature describes several analytical methods to account for confounding, among which covariate adjustment and propensity scores are probably the most commonly applied. In covariate adjustment, measured confounders are added as independent variables to the analytical model. This results in a risk-adjusted effect estimate.7,8 In propensity scores, the chance (“propensity”) of being exposed to the intervention, based on measured patient characteristics, is added as a covariate to the model or used to match patients exposed and not exposed.8 Propensity scores aim to balance factors influencing management decisions7,9,10 and are especially to be considered when there are few outcome events.8 These commonly applied methods, however, cannot adequately correct for unmeasured confounders. For example, a surgeon may decide to perform an operation because of his clinical intuition. Clinical intuition might be related to the patient’s prognosis but may not be adequately captured in the clinical data and thereby may leave residual confounding.3,11,12 A relatively new method to adjust for confounding is IV analysis. In IV analysis, a substitute variable, “the instrument” (e.g. hospital), is used as level of analysis. IV analysis is becoming more popular in CER and can theoretically adjust for unmeasured confounders.7,8,13 However, its validity depends on the degree to which the following three assumptions are met: The instrument should be strongly associated with the intervention under study (assumption 1), not related to the confounders (assumption 2) and not independently associated with the outcome under study (assumption 3).7,8,13
Clinical practice in patients with TBI is generally hypothesized to be prone to confounding by indication because treatment choice and outcome are highly dependent on injury severity and clinical status. In addition, the combination of a low evidence base and strong (cultural or eminence-based) beliefs of best practice leads to large practice variation between hospitals;14 for example, some hospitals have the general policy to treat TBI patients (regardless of patient characteristics) with a specific intervention, whereas this intervention may only be rarely used in other centers.15,16 This combination makes IV analysis of observational studies in TBI a promising approach. For the purpose of the current study, we selected three interventions that have been shown to be effective according to best available evidence and expert consensus meetings,17–21 with guidelines advocating these strategies,22–27 but have also shown extensive practice variation: ICP placement for ICP-directed therapies versus serial clinical and radiological assessment,28 to operate or not in mass lesions16 and primary versus secondary referral to specialized care.27
The objective of the current study was to define the circumstances for the validity of methods to adjust for confounding by indication using three selected interventions in TBI patients and a simulation study.
Patients and Methods
Study populations and interventions
Three TBI datasets were used. The POCON dataset consists of 557 consecutive patients with moderate and severe TBI (GCS score 3–13) from five level I trauma centers in the Netherlands (between 2008 and 2009). Detailed information on data collection, procedures and patients has been described previously.29 From the POCON dataset, we extracted 266 patients with an indication for ICP monitoring according to the 2007 Brain Trauma Foundation guidelines,30 that is, patients with a GCS score ≤8 and a CT Marshall score ≥2, or patients with a GCS score ≤8, CT Marshall score <2 and at least one of the following risk factors: 1) age >40 years; 2) hypotensive episode (systolic blood pressure <90 mmHg); and 3) motor score ≤3 (unilateral or bilateral motor posturing).
We further used the IMPACT dataset, which consists of data from prospective studies and Phase III trials in patients with moderate and severe TBI.31 The International and North American Tirilazad trial (86 hospitals, between 1992 and 1994) was selected from the IMPACT dataset because it comprises the requisite data to estimate the effectiveness of intracranial operations (craniotomy or craniectomy). From the 2,159 patients included in this trial, data of 677 patients with severe TBI, a mass lesion and a six-month outcome assessment were extracted.
We additionally selected the EBIC study (67 hospitals, in 1995) from the IMPACT dataset, which contains information on referral status of 822 patients. Referral and outcome were assessed in 782 patients, who were subsequently extracted. Detailed information on the IMPACT dataset has been comprehensively described in previous publications.31–33 The POCON, Tirilazad and EBIC studies were approved by the institutional review boards of the participating centers, and all patients provided informed consent. Data were made available for the current study after an agreement with the principal investigators of these studies.
Data collection
Collected patient variables in all datasets included age, sex, GCS (motor) score, pupillary reactivity (both pupils reactive, one pupil reactive, no pupil reactivity), hypoxic episode (at injury scene or emergency department), hypotensive episode (at injury scene or emergency department), admission glucose level (mmol/L) and admission Hb level (g/L). In all datasets, the initial CT scan was assessed using the Marshall score,34 and the presence of tSAHs and EDHs were scored.
To summarize patient characteristics, we calculated the probability of survival and favorable outcome (GOS score ≥4) for each patient based on the IMPACT laboratory model35 with all the above-mentioned demographic and clinical factors as predictors. These prognostic scores reflect chances on respectively survival and favorable outcome based on baseline characteristics.
Six-month outcome was assessed using the GOS-Extended in the POCON dataset and the GOS in the EBIC and Tirilazad trial datasets. Both scales were collapsed into a four-point ordinal scale: 1 = death or persistent vegetative state; 2 = severe disability; 3 = moderate disability; and 4 = good recovery.
Statistical analyses
Missing values in patient characteristics were imputed using single imputation. To assess differences in patient characteristics between patients exposed and not exposed to the interventions in the imputed datasets, we compared these characteristics in terms of clinical relevancy.
To examine the effectiveness of interventions, we used proportional odds logistic regression models with the four-point ordinal GOS as outcome variable. A proportional odds model increases statistical power in comparison to a conventional logistic regression model with a binary outcome.36 The OR derived from a proportional odds regression model could be interpreted as the average shift over the GOS caused by the intervention under study.36
As a reference, we estimated unadjusted effects of the interventions with patient (exposed to the intervention, yes/no) as the unit of analysis. To adjust for confounders, we performed covariate adjustment, propensity score matching and IV analysis. In the covariate-adjusted model, the variables from the IMPACT prognostic model35 (age, GCS motor score, pupillary reaction, hypoxia, hypotension, CT classification, tSAHs, EDHs, glucose and Hb) were added as independent variables. In a propensity score model, the propensity of being exposed to the intervention was computed using multivariable logistic regression with the intervention under study as dependent variable and all IMPACT variables as predictors. Propensity score matching was used to match patients who were exposed to the intervention to patients who were not exposed to the intervention with a maximum difference of 0.10 between propensity scores. An advantage of propensity score matching is that patients with nonoverlapping propensity scores are omitted from the analyses, increasing the comparability of those exposed and not exposed.7,9 In addition, propensity score matching is relatively robust and relies on fewer assumptions than other propensity score-based methods (e.g. propensity score adjustment).37
We used fixed-effect models for all patient-level analyses. The ORs and 95% CIs were obtained from the models, and the ORs indicated the odds of a more favorable outcome for patients who were exposed to the intervention compared to patients not exposed.
For the IV analyses, we entered the percentage exposed to the intervention in each hospital (the instrument) as an independent variable to the analyses, together with a random intercept for hospital to correct for other between-hospital differences than the intervention under study or between-hospital differences that existed by chance. All IMPACT prognostic variables were added as covariates to increase statistical power.38 To minimize the influence of chance, we only included hospitals with data on at least 20 patients in the IV analyses. The ORs were obtained from the models, and the corresponding 95% CIs were calculated using bootstrapping with 500 samples. The ORs indicated the odds of a more favorable outcome for a 10% increase in exposure to the intervention in a particular hospital. Assumptions of the IV approach were checked by calculating the partial F statistic, in line with recommendations.39 In addition, we checked associations with measured confounders by calculating Spearman’s correlation coefficients between the IVs and the prognostic scores of survival and favorable outcome. The third assumption (the IV is not independently associated with outcome) cannot be empirically verified but is captured in the random-effect model that we used.
The proportional odds analyses were performed in R (version 3.1.2) using the ordinal package.40 Other analyses were performed using the Statistical Package for the Social Sciences version 21.
Sensitivity analyses
As sensitivity analyses, we explored alternative methods for propensity score matching and IV analysis. Since propensity score matching may result in a nonrepresentative sample7 and a loss of statistical power,41 we also used propensity score adjustment and IPW to estimate the treatment effect. For propensity score adjustment, the linear predictor of the propensity score was added as a covariate to the proportional odds regression models. In IPW, the outcome of patients exposed to the intervention is extrapolated to the nonexposed patients with similar propensity scores; for every patient exposed with a probability of 0.20, there are four patients with the same probability who were not exposed. The outcome of the exposed patient is subsequently extrapolated to all other four patients with the same propensity score.42 We used standardized weights in which we divided the unadjusted chance of receiving the intervention in the total study population by the propensity score.43 Since this still resulted in large SEs, we winsorized our cohort by 95%; that is, patients below the 2.5th and above the 97.5th percentile received the scores belonging to the 2.5th and 97.5th quartile, respectively.
As an alternative to the IV approach used in this study, we divided hospitals into two groups based on their preference for the intervention. The mean percentage exposed to each intervention was calculated, and hospitals scoring above these means were classified as having a high preference, whereas hospitals scoring below the means were classified as having a low preference.
Since the percentage patients exposed to the intervention in each hospital can still be based on case mix (e.g. in a hospital with more severely injured patients, the percentage patients receiving aggressive interventions might be higher) and could also exist by chance, we estimated a random intercept for hospital from a model predicting exposure to the intervention (yes/no) adjusted for the IMPACT variables. This random intercept for exposure represents the chance of receiving the intervention in a specific hospital corrected for case mix and chance, and was subsequently used instead of the percentage exposed in the IV analyses. A disadvantage of this method is that the estimate obtained is hard to interpret and very uncertain due to the shrinkage of the between-hospital variation by the random-effects model.
Simulation study
In empirical data, “true” effects are never known, and as a consequence, estimating the validity of analytical methods remains difficult. Therefore, we performed a simulation study in which a true treatment effect was simulated in the data. The simulation study was built around the POCON dataset, which was inflated to 133,000 patients from 20 hospitals. We simulated a hypothetical intervention with a beneficial effect of OR = 1.65. For the association between the hypothetical intervention and confounders, we used the observed associations between ICP monitoring and confounders in the POCON dataset. We used six-month survival (yes/no) as outcome variable, which was generated based on a combination of the prognostic effect of the confounders and the effect of the hypothetical intervention.
We simulated four different scenarios and estimated the treatment effect using covariate adjustment, propensity score matching and IV analysis. In the first scenario, there were only measured confounders. We used motor score and pupillary reactivity as representing the measured confounders. In the second scenario, both measured and unmeasured characteristics comprised confounders. Marshall CT scores and the presence of a tSAH were used as unmeasured confounders. For both the first and second scenario, no between-hospital variation existed, which is comparable to a single-center study. The third and fourth scenarios were similar to the first and the second but included between-hospital variation in how often the hypothetical intervention was performed. Since the observed variation of ICP monitoring among hospitals ranged from 17% to 58%, every hospital received a random percentage within this range. The simulations were performed in R statistical software using the rms44 and lme445 packages.
Results
Patient characteristics
In the POCON dataset (n = 266), used for exploring the effects of ICP monitoring, patients who received an ICP monitor (n = 110) were generally younger, more often male, had a lower GCS motor score, less pupillary reactivity, less often hypoxia and hypotension and more often a mass lesion. In addition, patients receiving an ICP monitor more often had tSAHs and EDHs, and had on average a higher glucose level. These baseline differences resulted in a worse a priori prognosis for patients who received an ICP monitor compared to patients who did not receive an ICP monitor (n = 156; chance on survival 39% and 58%, respectively). Observed outcome was also less favorable in patients who received an ICP monitor.
In the Tirilazad dataset (n = 677), used for exploring the effects of intracranial surgery, patients who did (n = 579) and did not (n = 98) receive an intracranial operation did not differ in baseline characteristics except for hypotension (14% versus 21%) and the presence of an EDH (31% versus 10%), nor did the observed outcome differ.
In the EBIC dataset (n = 782), used for exploring the effects of referral policy, patients who were primary referred (n = 334) had higher blood glucose levels (8.1 versus 7.9 mmol/L) and more often a tSAH (47% versus 38%) compared to patients who were secondary referred (n = 448). There were no other clinically meaningful differences between groups (Table 1).
 | Table 1 Baseline, clinical and outcome characteristics of patients exposed and not exposed to three interventions Notes: This table presents values after data imputation. Values are presented as n (%) unless otherwise specified. P-values represent the differences between patients receiving and not receiving the intervention. *CT classification is based on the Marshall classification: diffuse II refers to CT abnormalities without swelling or shift; diffuse III refers to CT abnormalities with swelling (compressed cisterns); and diffuse IV refers to CT abnormalities with a shift. ‡Psurvival6 is the probability of six-month survival; Pfav6 is the probability of six-month favorable outcome (GOS score ≥4). The probabilities are based on the variables in the IMPACT lab model:35 age, GCS motor score, pupillary reaction, hypoxia, hypotension, CT classification, tSAHs, EDHs, glucose and hemoglobin. Abbreviations: CT, computed tomography; EBIC, European Brain Injury Consortium; EDH, extradural hematoma; GCS, Glasgow Coma Scale; GOS, Glasgow Outcome Scale; ICP+, patients receiving intracranial pressure monitoring; ICP−, patients not receiving intracranial pressure monitoring; IMPACT, International Mission for Prognosis and Analysis of Clinical Trials; Intr. Operation+, patients receiving intracranial operation (craniotomy or craniectomy); Intr. Operation−, patients not receiving intracranial operation (craniotomy or craniectomy); IQR, interquartile range; NA, not applicable; POCON, Prospective Observational Cohort Neurotrauma; Ref., referral; tSAH, traumatic subarachnoid hematoma. |
Covariate adjustment and propensity score matching
Unadjusted analyses showed that patients receiving an ICP monitor in the POCON dataset had a worse outcome than patients not receiving an ICP monitor (OR 0.51, 95% CI 0.32–0.81; Table 2). For intracranial operation and primary referral, as analyzed in the Tirilazad and EBIC datasets respectively, only minor differences were found between treated and non-treated patients. Covariate adjustment and propensity score matching resulted in imprecise estimates below 1, indicating that exposure to the interventions might have either a negative or no effect on outcome.
 | Table 2 Comparing analytical methods to adjust for confounding by indication in proportional odds logistic regression models with the Glasgow Outcome Scale as outcome Notes: *Model was adjusted for the following confounders: age, GCS motor score, pupillary reaction, hypoxia, hypotension, CT classification, tSAHs, EDHs, glucose and hemoglobin. **A propensity score was calculated based on the following variables: age, GCS motor score, pupillary reaction, hypoxia, hypotension, CT classification, tSAHs, EDHs, glucose and hemoglobin. For ICP monitoring, matching resulted in 67 patients receiving the intervention (propensity score 0.47, probability on survival 0.46, probability on favorable outcome 0.28) and 67 patients not receiving the intervention (propensity score 0.46, probability on survival 0.43, probability on favorable outcome 0.32). For craniotomy, matching resulted in 96 patients receiving the intervention (propensity score 0.83, probability survival 0.63, probability favorable outcome 0.42) and 96 patients not receiving the intervention (propensity score 0.83, probability survival 0.63, probability favorable outcome 0.42). For primary referral, matching resulted in 312 patients being primary referred (propensity score 0.46; probability survival 0.65; probability favorable outcome 0.49) and 312 patients being secondary referred (propensity score 0.47, probability survival 0.65, probability favorable outcome 0.48). ***Per 10% change; model was adjusted for the following confounders: age, GCS motor score, pupillary reaction, hypoxia, hypotension, CT classification, tSAHs, EDHs, glucose and hemoglobin. Abbreviations: CT, computed tomography; EBIC, European Brain Injury Consortium; EDHs, epidural haemorrhages; GCS, Glasgow Coma Scale; ICP, intracranial pressure; POCON, Prospective Observational Cohort Neurotrauma; tSAHs, traumatic subarachnoid hemorrhages. |
 Analyses in seven centers with a total of 172 patients.
  Analyses in 12 centers with a total of 350 patients.
IV analysis
In the POCON dataset, the percentage of patients who received an ICP monitor ranged from 17% to 58% between participating hospitals. All five hospitals included at least 20 patients (range 37–51 patients). For intracranial operation, only seven hospitals from the Tirilazad dataset included more than 20 patients, encompassing 172 patients. The percentage of patients receiving an intracranial operation ranged from 67% to 100% between hospitals. For primary referral, 12 hospitals from the EBIC dataset included more than 20 patients, reducing the sample size to 350 patients. The percentage primary referrals ranged from 17% to 83% between hospitals.
The instruments (percentage of patients exposed to the intervention in each hospital) were associated with the interventions under study (partial F statistic 6.96–65.9). In addition, correlations between the instruments and confounders were generally small (Table S1), indicating that the assumptions for IV analyses are met.
Using IV analysis, we found that patients treated in hospitals that performed 10% more ICP monitors had a 1.17 (95% CI 1.01–1.42) higher odds of favorable outcome, compared to patients treated in hospitals where ICP monitoring was less often employed (Table 2). For intracranial operation, a 10% increase resulted in higher odds of a favorable outcome, but this estimate was rather imprecise (OR 1.42, 95% CI 0.95–1.96). For primary referral, centers admitting more primary referred patients and less secondary referred patients had a slightly worse outcome (OR 0.91, 95% CI 0.81–1.03). More primary referrals and consequently less secondary referrals are indicative of less specialized neurocritical care, and therefore, an OR <1 was in line with expectations.
Sensitivity analyses
Propensity score adjustment and IPW resulted in similar effect estimates compared to covariate adjustment and propensity score matching (Table S2). The alternative hospital-level approaches resulted in effect estimates in the same direction as the IV analyses. CIs were however large, indicating a decrease of statistical efficiency.
Simulation study
The unadjusted analyses resulted in ORs ranging from 0.69 to 1.02 for the four different scenarios (Table 3). In the scenarios where the associations between intervention and outcome were influenced by measured confounders only (scenarios 1 and 3), covariate adjustment and propensity score matching resulted in ORs in the range of 1.46–1.67, broadly in line with the simulated effect (OR = 1.65). However, in the scenarios where unmeasured confounders also influenced the association between intervention and outcome (scenarios 2 and 4), the adjusted ORs in multivariable analyses were all close to the point of no effect (OR 0.99 and 1.03), whereas the ORs in the propensity score matching models were negatively directed (OR 0.90 and 0.94). IV analysis resulted in a positive and statistically significant effect (OR 1.04–1.05 per 10% change), indicating that patients admitted to hospitals that more often performed the hypothetical intervention had better odds of survival than patients admitted to hospitals where the intervention was less often performed. When transforming these ORs to a 100% change (meaning that all patients in a center would receive the hypothetical treatment), the effect estimate (OR = 1.05^10 = 1.63) is highly comparable to the simulated treatment effect. The SEs of the hospital-level analyses (SE 0.07) were however far larger than the SEs of the patient-level analyses (SE 0.01), indicating a substantial reduction in statistical efficiency (Table 4).
 | Table 3 Comparing analytical methods to adjust for confounding by indication in a simulation study with six-month survival as binary outcome Notes: *Scenario 1 = observed confounders, no hospital variation; scenario 2 = observed and unobserved confounders, no hospital variation; scenario 3 = observed confounders, hospital variation (17%–58%); scenario 4 = observed and unobserved confounders, hospital variation (17%–58%). **Per 10% change. Abbreviation: NA, not applicable. |
 | Table 4 Characteristics of analytical methods to adjust for confounding by indication based on our simulation and validation study Notes: *Statistical efficiency depends on the number of covariates and the number of patients with the outcome of interest (“events”). ‡In theory, instrumental variable analysis can correct for unmeasured confounders. |
Discussion
We compared analytical methods to adjust for confounding by indication in observational studies using three empirical case studies and a simulation study. The estimated effects strongly depended on the analytical method applied. As expected, the presence of unmeasured confounders makes covariate adjustment and propensity score matching invalid. IV analysis, although statistically inefficient and relying on strong assumptions, may then provide more valid estimates of the effectiveness of interventions.
Covariate adjustment and propensity score matching
Covariate adjustment and propensity score matching are commonly used in observational studies of interventions. We found that these methods could provide an unbiased estimate of the effect of the intervention, on the condition that all relevant confounders are measured and adjusted for. Covariate adjustment and propensity score matching cannot adjust for unmeasured confounders.3,7,11,12,41 In our simulation study, for example, the beneficial interventions appeared harmful or ineffective when analyzed with covariate adjustment or propensity score matching, due to residual confounding by indication.
IV analysis
IV analysis resulted in better estimates of the effect of interventions in our simulation study; the direction of the effect was congruent with the simulated effect. In our empirical case studies, the directions of effects were in line with how patients should be treated according to guidelines for TBI22–26 and best available evidence.17,26,27,46
IV analysis is becoming more popular in TBI research. Several recently published TBI studies analyzed effectiveness at the hospital level,47–50 and a large European CER study is planning to use hospital-level analysis to assess effectiveness of many TBI interventions.51 Previous studies typically divided hospitals into groups (e.g. tertiles47 or quartiles48) based on the percentage of patients treated. The percentage treated in each hospital can also be used as a continuous variable, which increases statistical power.
Nevertheless, IV analysis also has limitations that warrant comment. First, IV analysis is statistically inefficient compared to conventional analytical methods. Since the analyses are performed at the level of the hospital, the effective sample size decreases. As a consequence, a large number of centers and patients and substantial variability in exposure to interventions across centers are needed to reach a precise estimate in case of a true beneficial effect. The conduct of IV analysis might therefore be relatively expensive and resource-intensive. However, when compared to clinical trials, IV analysis of observational data is probably more economical since many research questions could be addressed using the same data.
Second, the interpretation of the OR differs from the conventional analyses. Rather than an estimate of the effect of interventions in individual patients, IV analysis provides information on whether patients’ outcome will improve when hospitals change their policy with respect to a specific intervention.7,9 The issue of interpretation is prominent for primary referral. Although primary referral on the patient level might be associated with more specialized neurocritical care, at the hospital level, a larger number of primary referrals and thus a lower number of secondary referrals are indicative of less specialized care. Therefore, for primary referral, a negative association between the instrument “percentage primary referrals” and outcome was expected, which was indeed found in the EBIC data. Third, the success of IV analysis depends on whether the underlying assumptions are met.9,52,53 Thus, IV analysis might not always be defendable. Between-hospital variation, caused by other variables than those in the model, could theoretically be captured by the random-effect model. Nevertheless, when correlations are strong (e.g. centers that often perform a particular intervention are all from the same geographic region that differs from other regions in many aspects), the statistical model will be unable to separate the effect of the intervention from the effect of the confounder. In these situations, one should consider other analytical methods or conclude that it is not possible to analyze the effectiveness of the particular intervention in the dataset.
Strengths and Limitations
A major strength of our study is that we included both empirical case studies and a simulation. The TBI examples show how the various analytical methods worked with actual patient data and demonstrated the influence of analytical method on effect estimate. The simulation study subsequently provided insight into the underlying mechanisms and thereby indicated which methods provided valid estimates of the treatment effect in different situations. A limitation of our simulation study is that we only examined four scenarios while there are many more possible interactions between treatment and confounders that might be of interest. A second limitation is that we used the observed range from one dataset (POCON), whereas the actual range might differ. Future simulation studies could address alternative scenarios and should further investigate how statistical power can be optimized when using IV analysis. Another limitation of the simulation study is that we included two variables as presenting the measured confounders and two variables as presenting the unmeasured confounders. As a consequence, the predictive value of our predictors is relatively modest which may have resulted in unstable estimates.
Our case studies also have several limitations. The data are relatively outdated (data were collected between 1992 and 2009) and analyzed post hoc. Therefore, the current study cannot be used to draw conclusions about the effectiveness of interventions. In addition, each intervention was measured in only one dataset, while it would be more interesting to demonstrate the different analytical methods for each intervention over different datasets. This was not possible in our study since not all interventions were measured in all three datasets. Furthermore, specific concerns exist in the data with regard to the three interventions. An ICP monitor is a diagnostic procedure and cannot influence outcome on itself, while it can cause complications. The actual comparison is between ICP-driven therapies versus clinical/radiological-driven therapies. With regard to the variable intracranial operation, the clinical applicability is unclear since the exposure and intervention in these data are not defined specifically (What kind of mass lesions? What intracranial operation?). More granular information on these interventions was unavailable inherent to the post hoc setup. For primary referral, we assumed that more primary referrals are associated with less specialized care. However, an alternative explanation would be that many primary referrals in a center are indicative that this center has a central location. Another limitation is that all three datasets were relatively modest in terms of number of hospitals and number of patients. The POCON dataset had only five hospitals, while the Tirilazad and EBIC datasets had only seven and 12 hospitals that included at least 20 patients, respectively. Therefore, differences among hospitals might also exist by chance; for instance, if a hospital included only 20 patients, these patients might not be representative for the general policy in the particular hospital. Therefore, we recommend future studies using IV analyses in TBI to include a larger number of hospitals and a large number of patients in each hospital. In addition, since the “percentage treated” in each hospital is based on data of the included patients, it might still be subject to confounding by indication. Alternatively, policies with regard to an intervention might be identified by (former) registry data or by an independent survey study completed by all the participating hospitals. Such an approach will be used in an ongoing TBI study.51 A further limitation may have been the use of an ordinal outcome measurement. Although ordinal outcome measurements are highly recommended in TBI research due to an increase of statistical power and precision,36 it is uncertain whether the results of this study are also generalizable to binary and continuous outcomes. Finally, it should be recognized that all covariates included in this study are measured only at admission, while the clinical situation of a patient may change over time (e.g. the GCS score may deteriorate), resulting in a different risk profile and also influencing treatment decisions. Allowing time-varying aspects may probably improve the predictive value of covariates and thereby may also improve the validity of patient-level analyses. This should be studied in future investigations, although it should be noted that only covariates that are known before the treatment decision is made are relevant, to avoid over adjustment.
Implications
IV analysis is emerging as an analytical method in many research fields, including oncology,54 cardiovascular disease55 and pharmaco-epidemiology.56 We demonstrated that IV analysis might provide a more valid estimate of the treatment effect compared to conventional analytical methods. In addition, IV analysis is not only suitable for analyzing the effectiveness of individual interventions but can also be applied to estimate the effectiveness of systems of care; for instance, Pezzin et al57 studied the influence of volume on breast cancer mortality using IV analysis. We showed that the percentage treated in each hospital might be a valid instrument. Notwithstanding, for interventions that show mainly between-region or between-country variation rather than between-hospital variation, for example prehospital trauma care, one might choose to analyze the results on the level of the region or country rather than the level of the hospital. Since all methods for causal inference have their strengths and limitations, it is nevertheless not desirable to regard one method as “correct”.58 Instead, alternative methods should be used simultaneously.58 In case alternative methods provide similar results, the credibility of the findings may strengthen. However, if findings are non-concordant, one has to determine which method is the most credible. Laborde-Casterot et al59 developed a flow chart to determine which method (IV versus patient-level methods) may provide the most valid results. Factors that could be taken into account when analyzing non-concordance of result include the risk of confounding by indication, the strength of the instrument, the validity of the instrument, the statistical power and concordance with RCTs on the same intervention (if available).59
Conclusion
The effect estimation of interventions in observational studies strongly depends on the analytical method used. When unobserved confounding and practice variation are expected in observational multicenter studies, IV analysis should be considered.
Abbreviations
CER, comparative effectiveness research
CT, computed tomography
EBIC, European Brain Injury Consortium
EDHs, epidural hemorrhages
GCS, Glasgow Coma Scale
GOS, Glasgow Outcome Scale
Hb, hemoglobin
IMPACT, International Mission for Prognosis and Analysis of Clinical Trials
ICP, intracranial pressure
IPW, inverse probability weighting
IV, instrumental variable
POCON, Prospective Observational Cohort Neurotrauma
RCT, randomized controlled trial
SE, standard error
TBI, traumatic brain injury
tSAHs, traumatic subarachnoid hemorrhages
Acknowledgments
This work was funded by the European Union PF 7th Framework Program (grant 602150) – CENTER TBI. In addition, the author TvE was funded by a grant from the Dutch Brain Foundation (Hersenstichting Nederland) for the Neurotraumatology Quality Registry (Net-QuRe) study. The funders had no role in study design, data collection and analysis, decision to publish or preparation of the manuscript.
Author contributions
HFL invented the idea for this paper. MCC, TAvE, IEC and HFL analyzed the data. MCC and TAvE wrote the manuscript. JvdN and PEV collected the data for the POCON study. AIRM, JvdN and PEV were involved in the data collection for the IMPACT study. All authors were involved in critically revising the manuscript and approved the final version of the manuscript. All authors contributed toward data analysis, drafting and revising the paper and agree to be accountable for all aspects of the work.
Disclosure
The authors report no conflicts of interest in this work.
References
Frieden TR. Evidence for health decision making – beyond randomized, controlled trials. N Engl J Med. 2017;377(5):465–475. | ||
Maas AI, Menon DK, Lingsma HF, Pineda JA, Sandel ME, Manley GT. Re-orientation of clinical research in traumatic brain injury: report of an international workshop on comparative effectiveness research. J Neurotrauma. 2012;29(1):32–46. | ||
Signorello LB, McLaughlin JK, Lipworth L, Friis S, Sorensen HT, Blot WJ. Confounding by indication in epidemiologic studies of commonly used analgesics. Am J Ther. 2002;9(3):199–205. | ||
Ioannidis JP, Khoury MJ. Improving validation practices in “omics” research. Science. 2011;334(6060):1230–1232. | ||
Normand SL, McNeila BJ. What is evidence? Stat Med. 2010;29(19):1985–1988. | ||
Methodology Committee of the Patient-Centered Outcomes Research Institute (PCORI); Basch E, Aronson N, Berg A, et al. Methodological standards and patient-centeredness in comparative effectiveness research: the PCORI perspective. JAMA. 2012;307(15):1636–1640. | ||
Stukel TA, Fisher ES, Wennberg DE, Alter DA, Gottlieb DJ, Vermeulen MJ. Analysis of observational studies in the presence of treatment selection bias: effects of invasive cardiac management on AMI survival using propensity score and instrumental variable methods. JAMA. 2007;297(3):278–285. | ||
Agoritsas T, Merglen A, Shah ND, O’Donnell M, Guyatt GH. Adjusted analyses in studies addressing therapy and harm: users’ guides to the medical literature. JAMA. 2017;317(7):748–759. | ||
Hiatky MA, Winkelmayer WC, Setoguchi S. Epidemiologic and statistical methods for comparative effectiveness research. Heart Fail Clin. 2013;9(1):29–36. | ||
Austin PC, Mamdani MM, Stukel TA, Anderson GM, Tu JV. The use of the propensity score for estimating treatment effects: administrative versus clinical data. Stat Med. 2005;24(10):1563–1578. | ||
Bosco JL, Silliman RA, Thwin SS, et al. A most stubborn bias: no adjustment method fully resolves confounding by indication in observational studies. J Clin Epidemiol. 2010;63(1):64–74. | ||
Sjoding MW, Luo K, Miller MA, Iwashyna TJ. When do confounding by indication and inadequate risk adjustment bias critical care studies? A simulation study. Crit Care. 2015;19(1):195. | ||
Brookhart MA, Schneeweiss S. Preference-based instrumental variable methods for the estimation of treatment effects: assessing validity and interpreting results. Int J Biostat. 2007;3(1):Article 14. | ||
Rayan N, Barnes S, Fleming N, et al. Barriers to compliance with evidence-based care in trauma. J Trauma Acute Care Surg. 2012;72(3):585–592; discussion 592–593. | ||
Cnossen MC, Huijben JA, van der Jagt M, et al; CENTER-TBI Investigators. Variation in monitoring and treatment policies for intracranial hypertension in traumatic brain injury: a survey in 66 neurotrauma centers participating in the CENTER-TBI study. Crit Care. 2017;21(1):233. | ||
van Essen TA, de Ruiter GC, Kho KH, Peul WC. Neurosurgical treatment variation of traumatic brain injury: evaluation of acute subdural hematoma management in Belgium and The Netherlands. J Neurotrauma. 2017;34(4):881–889. | ||
Yuan Q, Wu X, Sun Y, et al. Impact of intracranial pressure monitoring on mortality in patients with traumatic brain injury: a systematic review and meta-analysis. J Neurosurg. 2015;122(3):574–587. | ||
Chesnut RM, Bleck TP, Citerio G, et al. A consensus-based interpretation of the benchmark evidence from South American trials: treatment of intracranial pressure trial. J Neurotrauma. 2015;32(22):1722–1724. | ||
Mendelow AD, Gregson BA, Rowan EN, et al; STITCH(Trauma) Investigators. Early surgery versus initial conservative treatment in patients with traumatic intracerebral hemorrhage (STITCH[Trauma]): the first randomized trial. J Neurotrauma. 2015;32(17):1312–1323. | ||
Seelig JM, Becker DP, Miller JD, Greenberg RP, Ward JD, Choi SC. Traumatic acute subdural hematoma. Major mortality reduction in comatose patients treated within four hours. N Engl J Med. 1981;304(25):1511–1518. | ||
Arthur KR, Kelz RR, Mills AM, et al. Interhospital transfer: an independent risk factor for mortality in the surgical intensive care unit. Am Surg. 2013;79(9):909–913. | ||
Carney N, Totten AM, O’Reilly C, et al. Guidelines for the Management of Severe Traumatic Brain Injury, Fourth Edition. Neurosurgery. 2017;80(1):6–15. | ||
Bullock MR, Chesnut R, Ghajar J, et al; Surgical Management of Traumatic Brain Injury Author Group. Surgical management of traumatic parenchymal lesions. Neurosurgery. 2006;58(3 Suppl):S25–S46; discussion Si–Siv. | ||
Bullock MR, Chesnut R, Ghajar J, et al; Surgical Management of Traumatic Brain Injury Author Group. Surgical management of acute subdural hematomas. Neurosurgery. 2006;58(3 Suppl):S16–S24; discussion Si–Siv. | ||
Bullock MR, Chesnut R, Ghajar J, et al; Surgical Management of Traumatic Brain Injury Author Group. Surgical management of acute epidural hematomas. Neurosurgery. 2006;58(3 Suppl):S7–S15; discussion Si–Siv. | ||
National Institute for Health and Care Excellence (NICE). Head injury: assessment and early management, clinical guideline (cg 176). 2014. Available from: nice.org.uk/guidance/cg176. Accessed October 13, 2016. | ||
Härtl R, Gerber LM, Iacono L, Ni Q, Lyons K, Ghajar J. Direct transport within an organized state trauma system reduces mortality in patients with severe traumatic brain injury. J Trauma. 2006;60(6):1250–1256; discussion 1256. | ||
Bulger EM, Nathens AB, Rivara FP, Moore M, MacKenzie EJ, Jurkovich GJ; Brain Trauma Foundation. Management of severe head injury: institutional variations in care and effect on outcome. Crit Care Med. 2002;30(8):1870–1876. | ||
Andriessen TM, Horn J, Franschman G, et al. Epidemiology, severity classification, and outcome of moderate and severe traumatic brain injury: a prospective multicenter study. J Neurotrauma. 2011;28(10):2019–2031. | ||
Brain Trauma Foundation. Guidelines for the management of severe traumatic brain injury. 2007. Available from: http://online.liebertpub.com/doi/pdfplus/10.1089/neu.2007.9999. Accessed June 3, 2014. | ||
Marmarou A, Lu J, Butcher I, et al. IMPACT database of traumatic brain injury: design and description. J Neurotrauma. 2007;24(2):239–250. | ||
Murray GD, Butcher I, McHugh GS, et al. Multivariable prognostic analysis in traumatic brain injury: results from the IMPACT study. J Neurotrauma. 2007;24(2):329–337. | ||
Maas AI, Marmarou A, Murray GD, Teasdale SG, Steyerberg EW. Prognosis and clinical trial design in traumatic brain injury: the IMPACT study. J Neurotrauma. 2007;24(2):232–238. | ||
Marshall LF, Marshall SB, Klauber MR, et al. A new classification of head injury based on computerized tomography. J. Neurosurg. 1991;75:S14–S20. | ||
Steyerberg EW, Mushkudiani N, Perel P, et al. Predicting outcome after traumatic brain injury: development and international validation of prognostic scores based on admission characteristics. PLoS Med. 2008;5(8):e165; discussion e165. | ||
Roozenbeek B, Lingsma HF, Perel P, et al; IMPACT (International Mission on Prognosis and Clinical Trial Design in Traumatic Brain Injury) Study Group; CRASH (Corticosteroid Randomisation After Significant Head Injury) Trial Collaborators. The added value of ordinal analysis in clinical trials: an example in traumatic brain injury. Crit Care. 2011;15(3):R127. | ||
Williamson E, Morley R, Lucas A, Carpenter J. Propensity scores: from naive enthusiasm to intuitive understanding. Stat Methods Med Res. 2012;21(3):273–293. | ||
Roozenbeek B, Maas AI, Lingsma HF, et al; IMPACT Study Group. Baseline characteristics and statistical power in randomized controlled trials: selection, prognostic targeting, or covariate adjustment? Crit Care Med. 2009;37(10):2683–2690. | ||
Davies NM, Smith GD, Windmeijer F, Martin RM. Issues in the reporting and conduct of instrumental variable studies: a systematic review. Epidemiology. 2013;24(3):363–369. | ||
ordinal – Regression Models for Ordinal Data [computer program]. 2015. Available from: https://cran.r-project.org/web/packages/ordinal/ordinal.pdf. Accessed December 01, 2016. | ||
Heinze G, Juni P. An overview of the objectives of and the approaches to propensity score analyses. Eur Heart J. 2011;32(14):1704–1708. | ||
Halpern EF. Behind the numbers: inverse probability weighting. Radiology. 2014;271(3):625–628. | ||
Moodie EE, Stephens DA. Marginal Structural Models: unbiased estimation for longitudinal studies. Int J Public Health. 2011;56(1):117–119. | ||
Harrell FE. Package ‘rms’. 2017. Available from: https://cran.r-project.org/web/packages/rms/rms.pdf. Accessed December 01, 2016. | ||
Bates DM, Maechler M, Bolker BM, Walker S. lme4: linear mixed-effect models using Eigen and S4. R package version 1.1-8. 2015. Available from: https://cran.r-project.org/web/packages/lme4/lme4.pdf. Accessed December 01, 2016. | ||
Gregson BA, Rowan EN, Francis R, et al; STITCH(TRAUMA) Investigators. Surgical trial in traumatic intracerebral haemorrhage (STITCH): a randomised controlled trial of early surgery compared with Initial conservative treatment. Health Technol Assess. 2015;19(70):1–138. | ||
Dawes AJ, Sacks GD, Cryer HG, et al; Los Angeles County Trauma Consortium. Compliance with evidence-based guidelines and interhospital variation in mortality for patients with severe traumatic brain injury. JAMA Surg. 2015;150(10):965–972. | ||
Alali AS, Fowler RA, Mainprize TG, et al. Intracranial pressure monitoring in severe traumatic brain injury: results from the American College of Surgeons Trauma Quality Improvement Program. J Neurotrauma. 2013;30(20):1737–1746. | ||
Hartings JA, Vidgeon S, Strong AJ, et al; Co-Operative Studies on Brain Injury Depolarizations. Surgical management of traumatic brain injury: a comparative-effectiveness study of 2 centers. J Neurosurg. 2014;120(2):434–446. | ||
van Essen TA, Dijkman MD, Cnossen M, et al. Comparative effectiveness of surgery for acute subdural hematoma. J Neurotrauma. 2016;33:A-20. | ||
Maas AI, Menon DK, Steyerberg EW, et al; CENTER-TBI Participants and Investigators. Collaborative European NeuroTrauma Effectiveness Research in Traumatic Brain Injury (CENTER-TBI): a prospective longitudinal observational study. Neurosurgery. 2015;76(1):67–80. | ||
Hernan MA, Robins JM. Instruments for causal inference: an epidemiologist’s dream? Epidemiology. 2006;17(4):360–372. | ||
Swanson SA, Miller M, Robins JM, Hernan MA. Definition and evaluation of the monotonicity condition for preference-based instruments. Epidemiology. 2015;26(3):414–420. | ||
Xu JC, Shen J, Shao WZ, et al. The safety and efficacy of levetiracetam versus phenytoin for seizure prophylaxis after traumatic brain injury: a systematic review and meta-analysis. Brain Inj. 2016;30(9):1054–1061. | ||
Sanwald A, Schober T. Follow your heart: survival chances and costs after heart attacks – an instrumental variable approach. Health Serv Res. 2017;52(1):16–34. | ||
Brookhart MA, Rassen JA, Schneeweiss S. Instrumental variable methods in comparative safety and effectiveness research. Pharmacoepidemiol Drug Saf. 2010;19(6):537–554. | ||
Pezzin LE, Laud P, Yen TW, Neuner J, Nattinger AB. Reexamining the relationship of breast cancer hospital and surgical volume to mortality: an instrumental variable analysis. Med Care. 2015;53(12):1033–1039. | ||
Greenland S. For and against methodologies: some perspectives on recent causal and statistical inference debates. Eur J Epidemiol. 2017;32(1):3–20. | ||
Laborde-Casterot H, Agrinier N, Thilly N. Performing both propensity score and instrumental variable analyses in observational studies often leads to discrepant results: a systematic review. J Clin Epidemiol. 2015;68(10):1232–1240. |
Supplementary materials
 | Table S1 Assumptions for instrumental variable analysis Note: Psurvival = the probability of six-month survival; Pfavorable outcome = the probability of six-month favorable outcome (GOS >3). Abbreviation: ICP, intracranial pressure. |
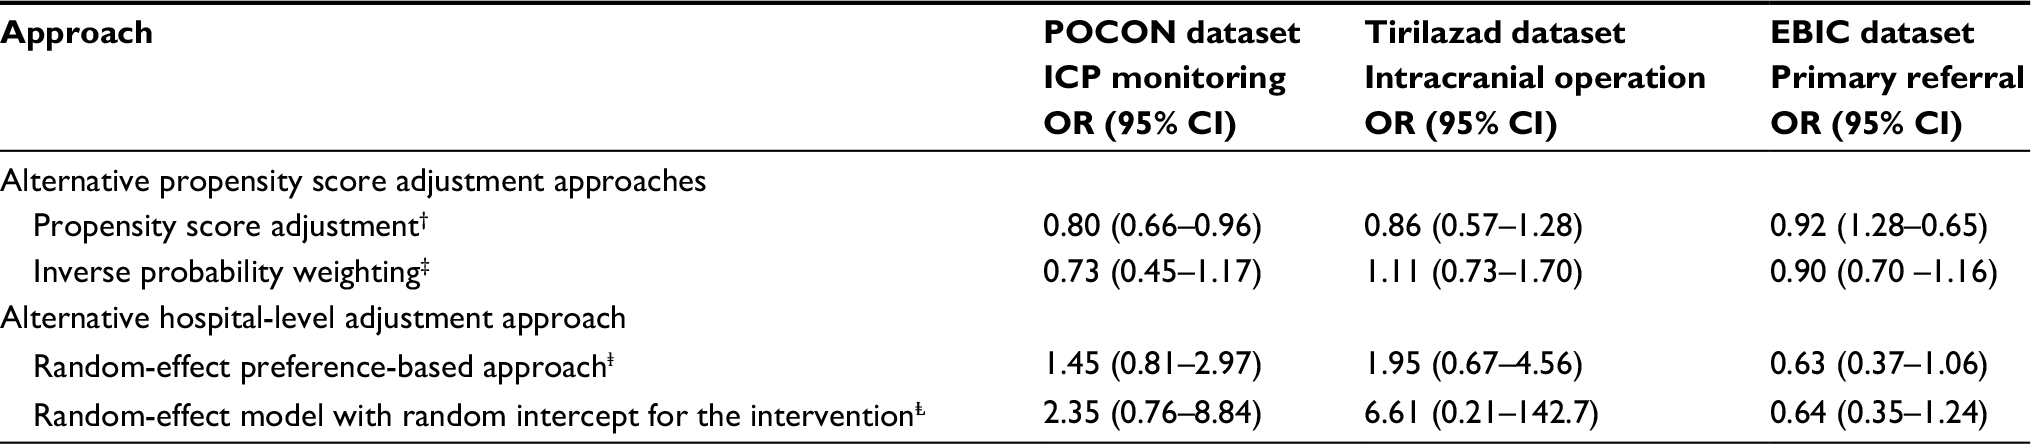 | Table S2 Results of sensitivity analyses: alternative methods to adjust for confounding by indication Notes: †The natural logarithm of the propensity score was added to the analytic model. ‡Results are presented for a 95% winsorized cohort. Abbreviations: EBIC, European Brain Injury Consortium; GOS, Glasgow Outcome Scale; ICP, intracranial pressure; IMPACT, International Mission for Prognosis and Analysis of Clinical Trials; POCON, Prospective Observational Cohort Neurotrauma. |
 © 2018 The Author(s). This work is published and licensed by Dove Medical Press Limited. The
full terms of this license are available at https://www.dovepress.com/terms
and incorporate the Creative Commons Attribution
- Non Commercial (unported, 3.0) License.
By accessing the work you hereby accept the Terms. Non-commercial uses of the work are permitted
without any further permission from Dove Medical Press Limited, provided the work is properly
attributed. For permission for commercial use of this work, please see paragraphs 4.2 and 5 of our Terms.
© 2018 The Author(s). This work is published and licensed by Dove Medical Press Limited. The
full terms of this license are available at https://www.dovepress.com/terms
and incorporate the Creative Commons Attribution
- Non Commercial (unported, 3.0) License.
By accessing the work you hereby accept the Terms. Non-commercial uses of the work are permitted
without any further permission from Dove Medical Press Limited, provided the work is properly
attributed. For permission for commercial use of this work, please see paragraphs 4.2 and 5 of our Terms.