Back to Journals » Diabetes, Metabolic Syndrome and Obesity » Volume 13
Adiposity Indicators as Cardio-Metabolic Risk Predictors in Adults from Country with High Burden of Obesity
Authors Kerkadi A, Suleman D, Abu Salah L, Lotfy C, Attieh G, Bawadi H ![]() , Shi Z
, Shi Z ![]()
Received 15 November 2019
Accepted for publication 10 January 2020
Published 21 January 2020 Volume 2020:13 Pages 175—183
DOI https://doi.org/10.2147/DMSO.S238748
Checked for plagiarism Yes
Review by Single anonymous peer review
Peer reviewer comments 2
Editor who approved publication: Prof. Dr. Antonio Brunetti
Abdelhamid Kerkadi, Dana Suleman, Lana Abu Salah, Christina Lotfy, Grace Attieh, Hiba Bawadi, Zumin Shi
Department of Human Nutrition, College of Health Sciences, QU-Health, Qatar University, Doha, Qatar
Correspondence: Abdelhamid Kerkadi Tel +974 4403 4806
Fax +974 4403 4801
Email [email protected]
Background: In Qatar more than 70% 0f the adults are overweight and obese. Different adiposity assessment methods have been proposed to identify individuals at cardio-metabolic risk.
Purpose: This study aimed to compare anthropometric indicators with Dual-energy X-ray absorptiometry (DXA) –derived adiposity indicators in predicting cardio-metabolic risk among Qatari adults.
Patients and Methods: A random sample of five hundred and fifty-eight (558) healthy Qatari adults (men and women) aged 20 to 50 years was obtained from Qatar Biobank survey data. Anthropometric data (weight, height, and waist circumference), the DXA-derived data, and cardio-metabolic (CM) risk parameters were analyzed. A Spearman partial correlation coefficient, Receiver Operating Characteristics (ROC) curve and an area under curve (AUC) were used to assess the predicting ability of adiposity indicators for CM risk factors.
Results: Adiposity indices (anthropometric and DXA) were significantly correlated with most of the CM indicators (r= − 0.292 to 0.486, p< 0.001). The AUC of waist to height ratio (WHtR) was significantly higher than that of body mass index (BMI) and waist circumference (WC) in the prediction of low high density lipoprotein (HDL) (AUC=0.65, AUC=0.59; AUC=0.64), high low density lipoprotein (LDL) (AUC=0.67; AUC=0.62; AUC=0.66), high cholesterol (AUC=0.66; AUC=0.63; AUC=0.63), and high Homeostatic Model Assessment- (HOMA) (AUC= 0.81; AUC= 0.78; AUC=0.78). Among DXA- parameters, trunk fat had the highest AUCs for total cholesterol (AUC= 0.64, CI=0.56, 0.73), triglycerides and glucose index (TyG) (AUC=0.69, CI=0.64, 0.74), and HOMA (AUC=0.78, CI= 0.73, 0.84).
Conclusion: Results of the present study show that adiposity indicators (WC and WHtR) are clinically valuable tools to identify individuals at risk of CVD compared to DXA–derived parameters, while DXA can provide more accurate estimates.
Keywords: Qatar Biobank, adiposity indices, cardiometabolic indicators, dual-energy x-ray absorptiometry
Background
The prevalence of obesity in Qatar is at an alarming rate. Results of the Stepwise survey conducted by the Supreme Council of Health (SCH) showed that the prevalence of overweight among Qatari was 28.7% (25.1% men and 32.2% women), and 41.1% were obese (43.2% men and 39.5% women).1 Several epidemiological studies have documented the strong association between obesity and the development of cardio-metabolic risks (CM) such as hypertension, insulin resistance, diabetes mellitus (T2DM), and dyslipidemia, which contribute to the development of cardiovascular diseases (CVD).2,3 The excess of adipose tissue is involved in the pathogenesis of hypertension, T2DM, and CVD.4,5 Elucidating the association between adiposity and CM risk factors is very important in the prevention of non-communicable diseases (NCD). Therefore, it is necessary to choose the ideal adiposity measure that can assist in predicting the development of diseases and identifying individuals at risk.
Several methods have been used in clinical practices to assess adiposity. Anthropometrics measurements, weight, height, BMI, WC, WHtR, and waist to hip ratio (WHR) have been used globally in researches. These methods are easy to adopt, inexpensive, and quick. Among these measures, BMI is the most used indicator of obesity, and has its limitations. BMI depends only on height and weight disregarding factors such as age, sex, ethnicity, and muscle mass.6 In addition, BMI does not take body fat distribution into consideration, which is an important factor as abdominal adiposity is strongly associated with high risk of CM diseases.7
Several studies reported that abdominal obesity, particularly, visceral obesity, is associated with a cluster of atherogenic metabolic abnormalities referred to as the metabolic syndrome.8–10 WC as a measure of central obesity was used, as an accurate indicator of CM risk compared to BMI.7 Different studies have revealed that WC is as effective as BMI because it does not take height into consideration and there can be under or over estimation of indicating CM risk in tall or short adults.11
However, anthropometric measures do not distinguish between either fat and lean mass or visceral fat tissue or subcutaneous adipose tissue within the abdomen.12 In order to overcome the weakness of anthropometric indices, a direct method was proposed to estimate body fat and fat distribution. DXA is considered as a gold standard to assess body composition. It is a valid technique for assessing body composition, as it is able to quantitate whole body and regional fat mass, lean mass, and bone mineral density.13 Its use in clinical practice and in research is limited as a result of its accessibility and cost.14,15 However, the selection of the best adiposity indices to predict CM risk is controversial. This research aim is to determine the best and most effective indicator in predicting high CM risk factors among Qatari adults.
Materials and Methods
Study Population
The study is a population based cross-sectional survey among Qatari adults (men and women) and long term residents (individuals living in the country for ≥ 15 years) aged ≥18 years. This study is within the framework of Qatar Biobank, which is the first Qatar national population based prospective cohort study that includes the collection of biological samples, with long-term storage of data and samples for future research.16 A random sample of eight hundred and ninety-two (892) Qatari adults (men and women) aged 20 to 50 years was obtained from Qatar Biobank survey data. Of those obtained, three hundred and thirty-four (334) were excluded because they were not involved in overnight fasting. Finally, a total of 558 participants were included in the present study. The totality of participants were not diagnosed with the following diseases diabetes, hypertension, dyslipidemia and cardiovascular diseases. They were not under any medical treatment that can affect cardiometabolic variables. All participants provided a written informed consent. The study was approved by the Institutional Review Board of Qatar Biobank. The identity of participants was not revealed, and an identification number was allocated to each participant and was used in whole data analysis.
Obesity Indicators: Anthropometric and DXA Derived Parameters
Trained staff in Qatar Biobank clinics using standard methods measured the anthropometric indicators. Body weight (kg) and height (cm) were measured in light clothing without shoes with a calibrated scale and a wall-mounted stadiometer. WC was determined at the midpoint between the last rib and the top of the iliac crest with stretch-resistant tape. BMI was calculated as weight (kg) divided by square of the height (m) waist to height ratio (WHtR) was calculated by dividing WC by height. Overall adiposity (total fat mass (g), total body fat (TBF%) and regional fat distribution (trunk, leg, android and gynoid fat mass (g) were performed with DEXA –Full body iDXA (GE) scan scanners. DXA derived parameters were used to calculate different ratios such as trunk/leg fat and android/gynoid fat ratio.
Data Collection
All measurements were performed by trained technicians and nurses at the Qatar Biobank clinic. Systolic and diastolic blood pressure (SBP and DBP) was determined in triplicate with the use of mercury sphygmomanometer, and the average of repeated measurements taken into analyses.
Blood samples were collected after overnight fasting and used to measure plasma glucose, glycated hemoglobin (HbA1C), high density lipoprotein cholesterol (HDL), insulin, and triglyceride levels using standard laboratory enzymatic methods. LDL was calculated using the Friedewald formula.17 TyG was calculated using the equation: Ln [TG (mg/dL) × glucose (mg/dL)/2.18,19 HOMA was calculated using the formula: fasting glucose 9mg/dL × fasting insulin (uU/mL)/405.20
Statistical Analysis
Data were analyzed using Statistical Package for the Social Sciences version 23 (SPSS Inc, Chicago). We used descriptive statistics with means and standard deviations (SD) for continuous variables or percentages for categorical variables to summarize characteristics of the study population. t -test and chi-square test (χ2) were used to compare body adiposity and CVD biomarkers between gender. Spearman partial correlation coefficient was used to evaluate the association between anthropometric, DXA, and CM risk parameters. ROC curves were conducted and the area under curve (AUC) was performed with a 95% confidence interval (95% CI) to assess the accuracy of adiposity indicators (trunk, legs, android, gynoid, trunk/leg, android/gynoid, %BF, total fat), and anthropometric indicators (BMI, WC, WHtR) for predicting abnormality of total cholesterol, LDL, HDL, TG, TC, HOMA, and TyG. Subjects at CM risks were identified according to the NCEP(ATP III) guidelines given as: SBP> 130 mmHg; DBP>85 mmHg; HDL< 1.04 mmol/L (male) and HDL<1.29 mmol/L (female);21 TG >1.7 mmol/L; LDL >3.5 mmol/L; TC>5.2 mmol/L; HbA1c≥6.1%; HOMA-IR ≥2.28,22 and TyG≥ 8.65.23
Results
Table 1 shows the anthropometric characteristics of the study population. Men and women in the sample were comparable in terms of mean age, BMI, WHtR, trunk fat, and android. Men had higher WC, total body fat, trunk fat to leg fat ratio, and android, while women had higher % body fat, trunk fat, legs fat and gynoid. The prevalence of general and abdominal obesity was significantly higher among women compared to men (28.6% vs 15.8% and 15.8% vs 7.7%), respectively.
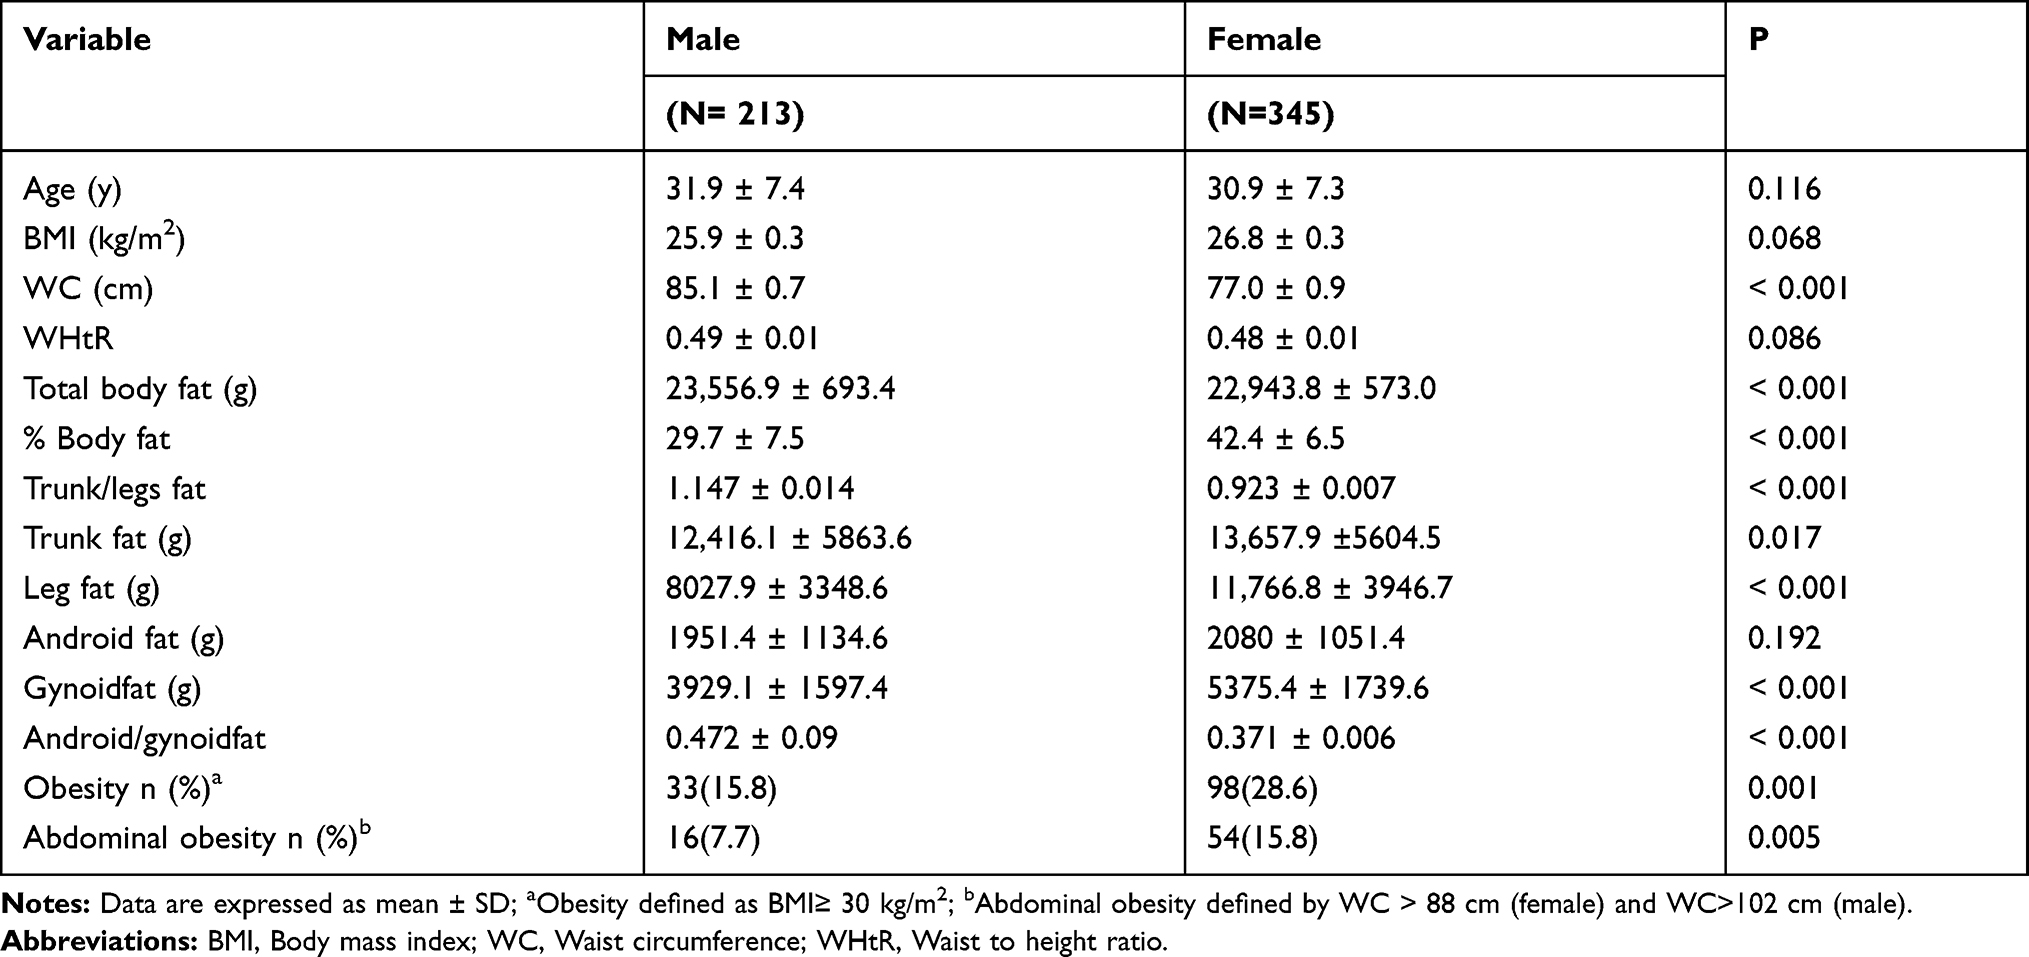 |
Table 1 Anthropometric Characteristics of the Study Population |
Table 2 shows the cardio-metabolic risk parameters. Results indicated that men had significantly greater mean SBP, DBP, LDL, TG, glucose, TyG index, and TG/HDL, while women had significantly higher mean of HDL, insulin and HOMA-IR. There were no significant differences in total cholesterol and HbA1C between men and women, respectively. The prevalence of participants with low HDL, high LDL, high TG, and HOMA-IR was not statistically different between men and women. The rate of participants with high TyG was significantly higher for women than men (11.6% vs 15.1%, P=0.002). The prevalence of prediabetes among total population was 3.3% and the highest rate was observed among men (2.2% vs 1.1%, p=0.022).
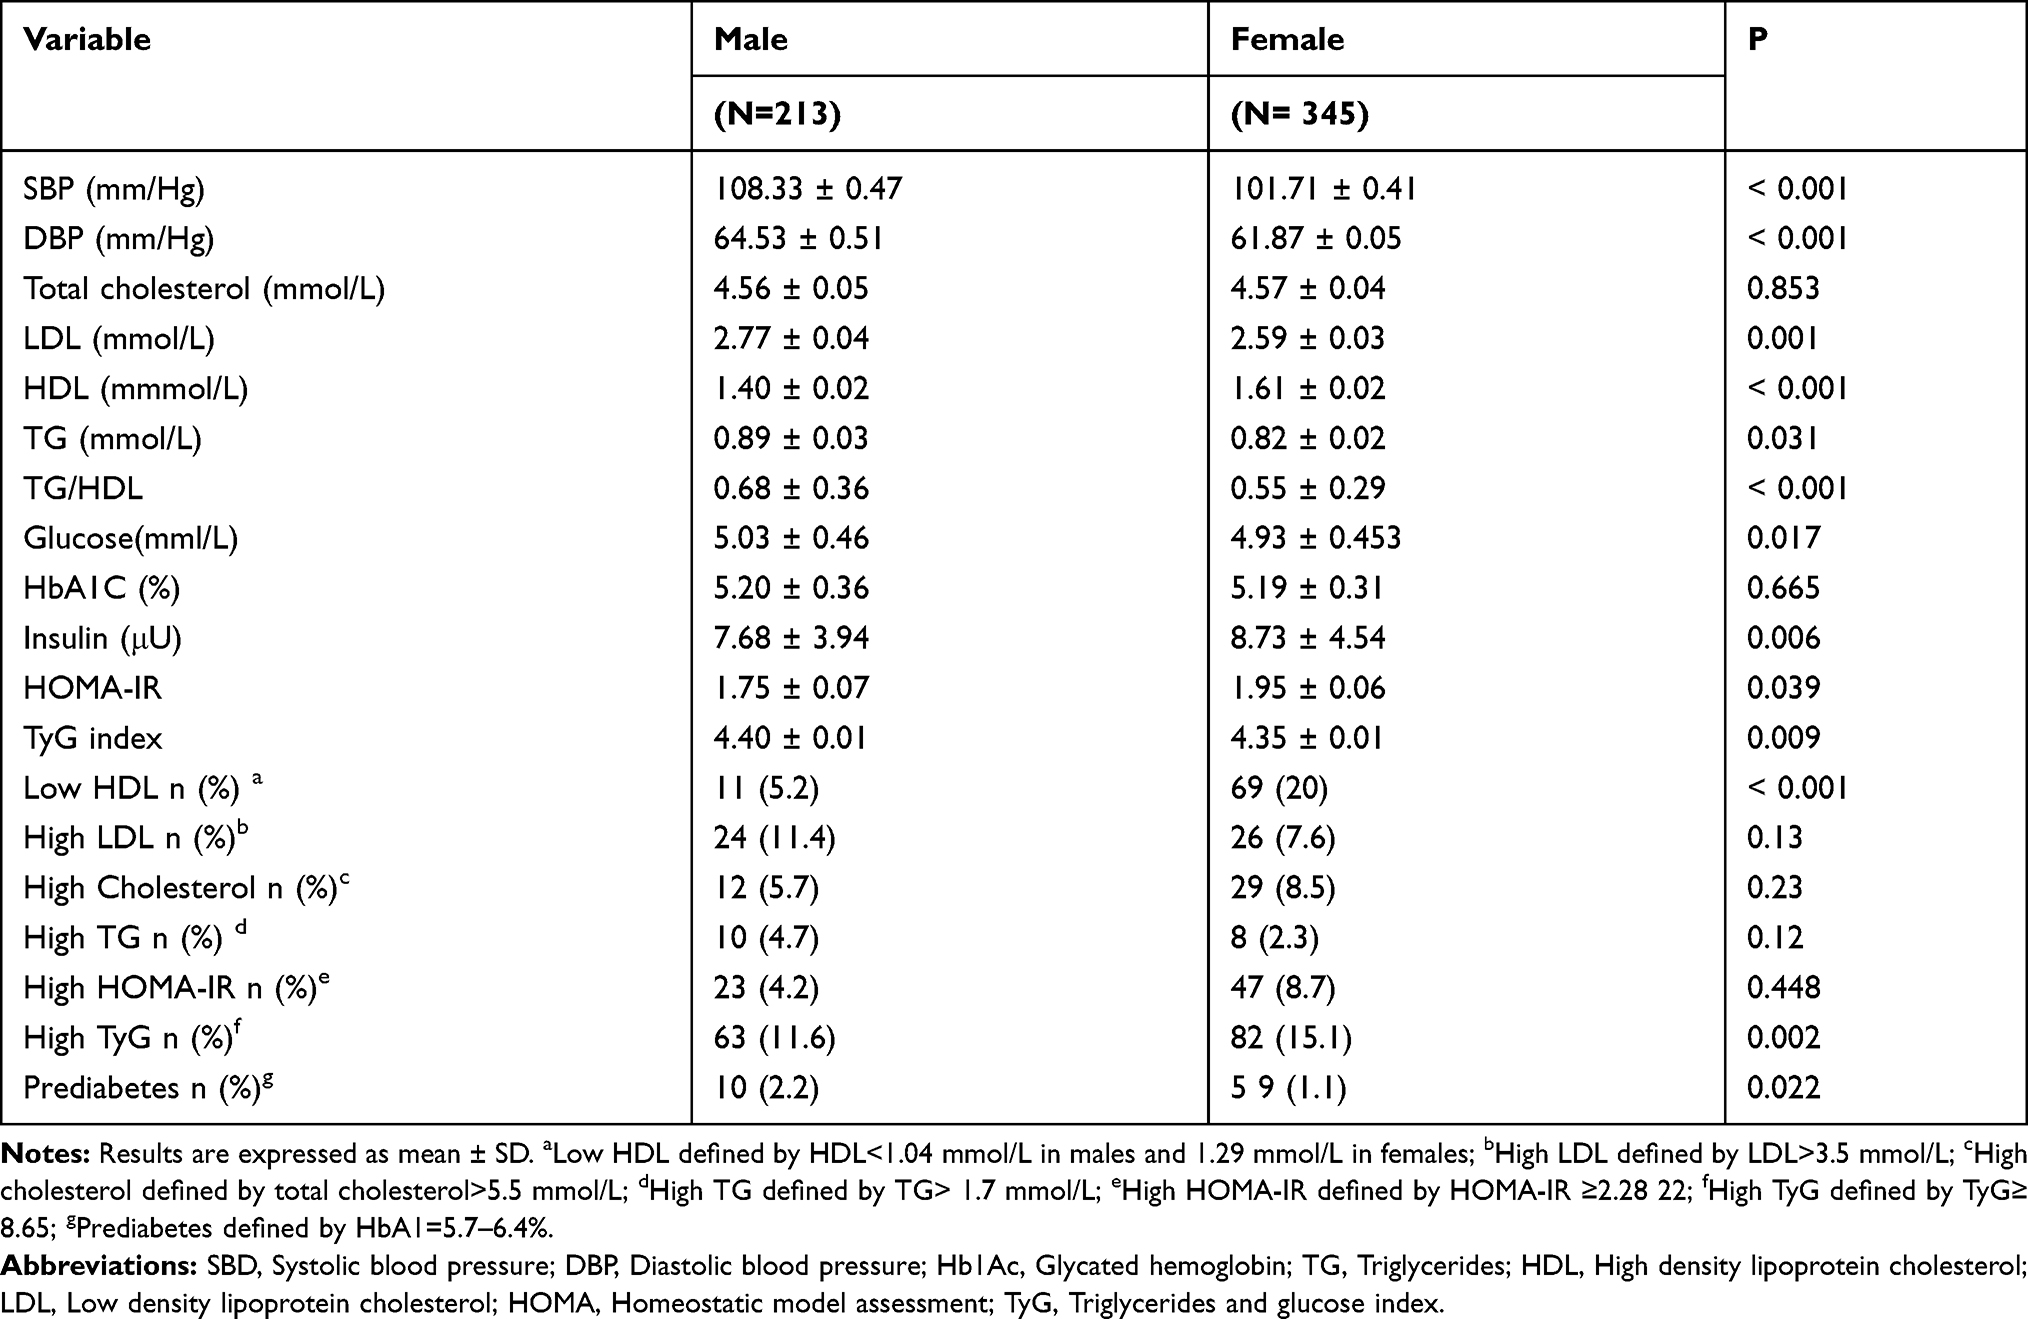 |
Table 2 Cardio-Metabolic Risk Parameters of the Study Population |
Partial correlation coefficients between adiposity indices and CM risk parameters after adjusting for age and gender are presented in Table 3. In general, adiposity indices (anthropometric and DXA) were significantly correlated with most of the CM indicators (r= −0.292 to 0.486, p< 0.001). Within the anthropometric indices, BMI had the weakest correlation with most CM parameters except for LDL. WC was strongly correlated with all CM parameters except for LDL, SBP (r=0.311, P< 0.001), glucose (r=0.317, P< 0.001), and HDL (r=−0.266, P< 0.001). WC and WHtR had the highest correlation coefficients with HOMA and insulin (r= 0.483 and 0.481; r=0.4831 and 0.486, P< 0.001), respectively. A weak correlation between DBP, LDL and anthropometric indices was observed. Results of the DXA–derived indicators demonstrated that they were significantly correlated with all CM parameters (P< 0.001). High significant correlations were also observed between the android fat and SBP, and DBP. Trunk fat was significantly correlated to TG, glucose, LDL, HOMA, TyG, and insulin. Moreover, it was observed within the DXA-indicators, that the ratios of fatness (trunk/leg fat and android/gynoid fat) showed higher correlation with Hb1Ac and HDL as compared to the measures of specific fat areas (trunk fat, leg fat alone). In general, DXA-derived indicators were highly correlated with most CM indicators than anthropometric indicators.
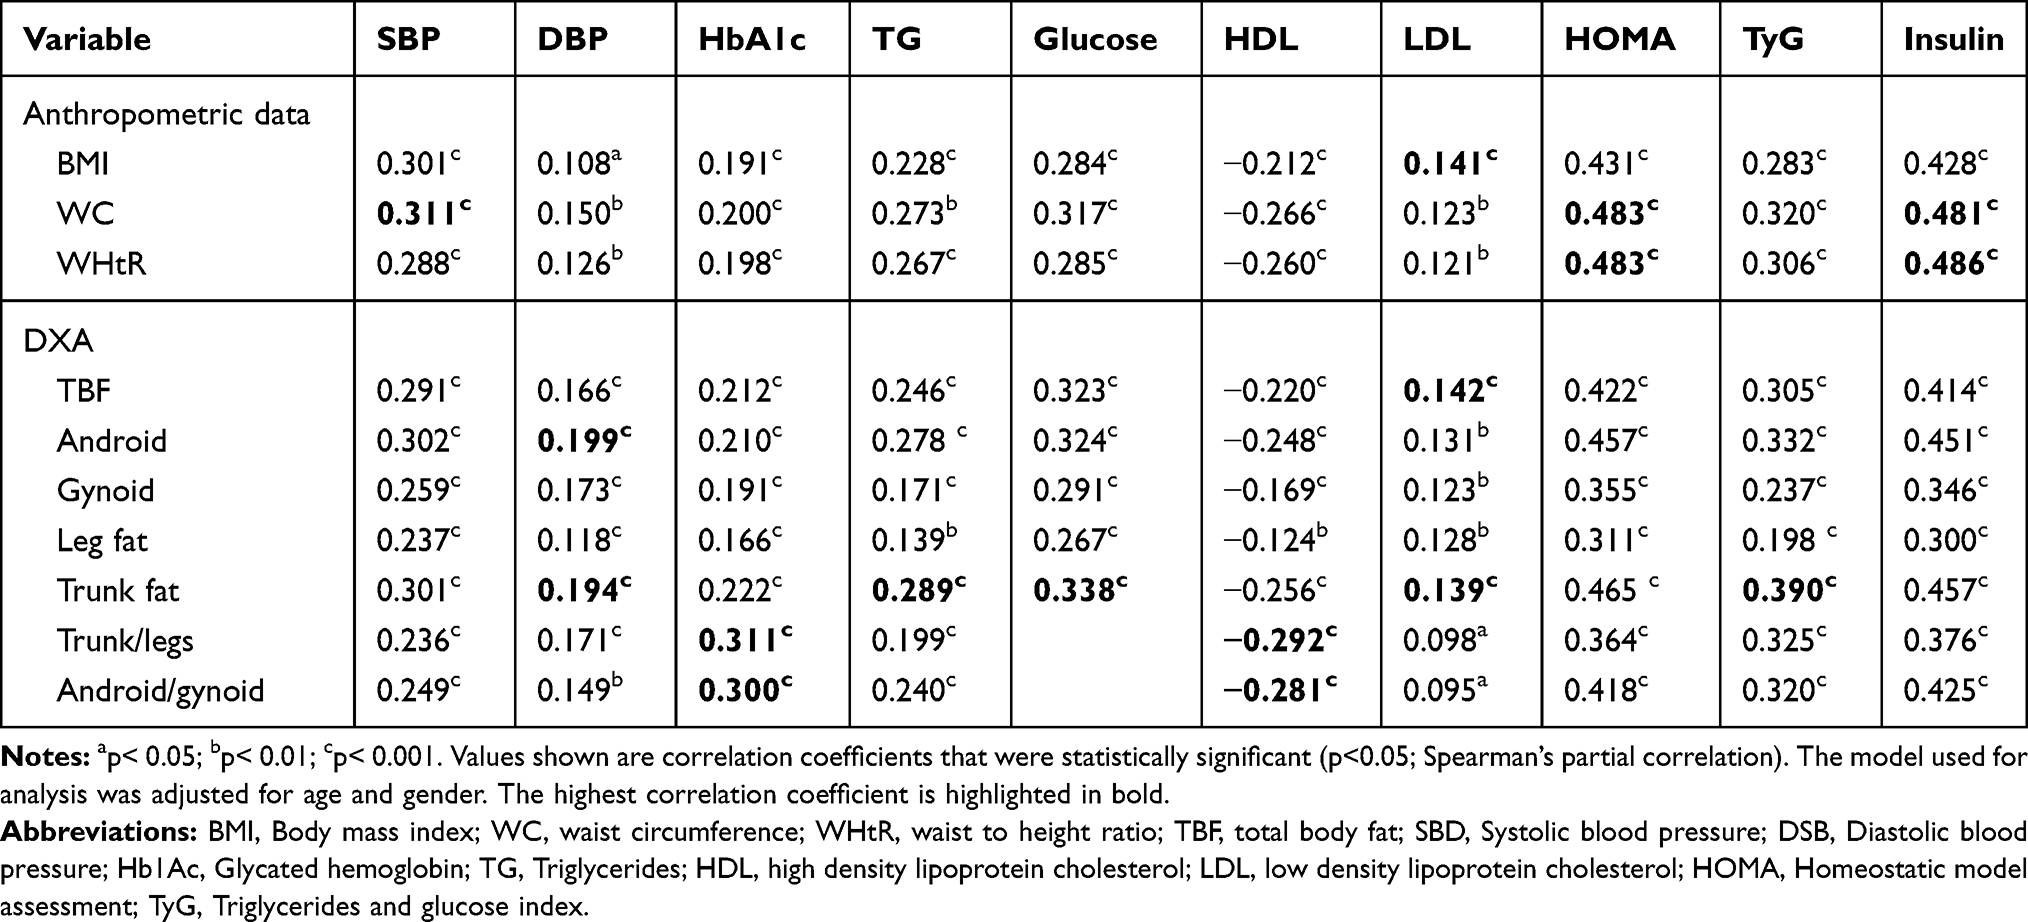 |
Table 3 Partially Adjusted Correlations of the Different Adiposity Indicators with Cardiometabolic Risk Parameters |
Figure 1 shows the AUC’s of anthropometric indices and DXA –derived indicators in the prediction of cardio-metabolic risk factors. Results demonstrated that the ability of adiposity indicators to identify CM risk varies, with AUCs ranging from 0.31 to 0.83. Among the anthropometric indices, the AUC of WHtR was significantly higher than that of BMI and WC in the prediction of low HDL, high LDL, high cholesterol, and high HOMA. WC had the highest AUC for TG. BMI had the lowest AUC for all CM risk factors. Among the DXA-derived indicators, fat percentage has the highest AUC to predict low HDL. Android to gynoid ratio has the highest AUCs for high LDL, high TG and high TyG. While trunk fat had the highest AUCs for total cholesterol, high HDL, and high HOMA. In general, anthropometric indices showed equally ability to predict abnormality for CM risk factors as DXA-derived indicators.
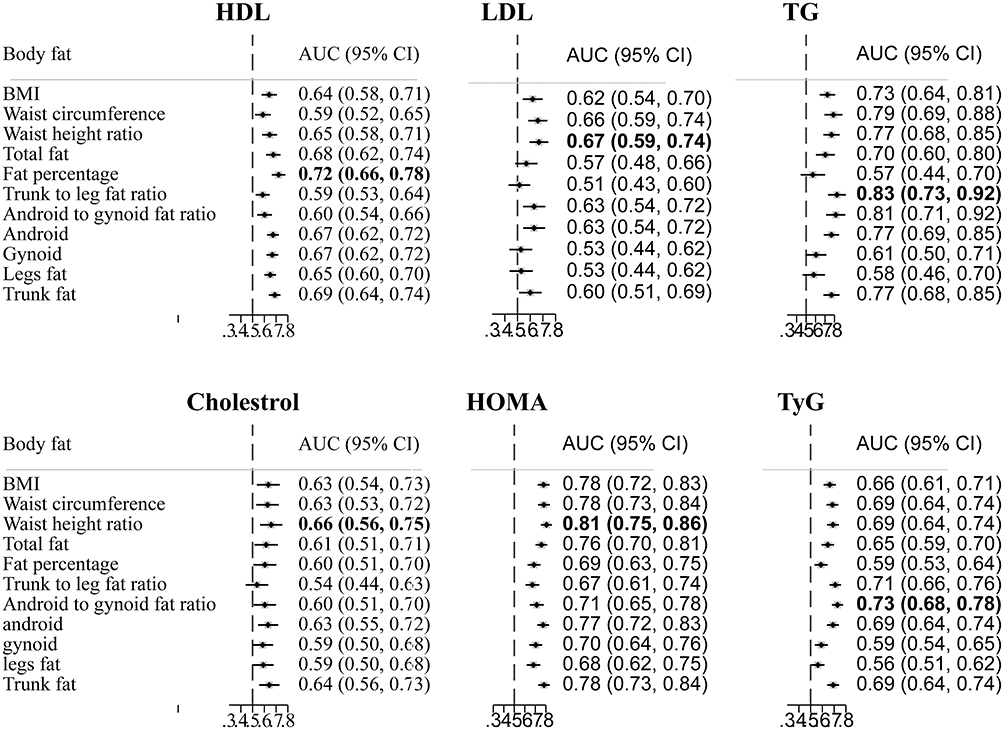 |
Figure 1 Adjusted area under the ROC curve for body adiposity indicators for predicting selected CM risk factors. Notes: The model used for analysis was adjusted for age and gender. The highest value for each CM risk is highlighted in bold. Abbreviations: AUC, Under area receiver operating characteristic (ROC) curve; CM, cardiometabolic; CI, confidence interval; BMI, Body mass index; TG, Triglycerides; HDL, High density lipoprotein cholesterol; LDL, low density lipoprotein cholesterol; HOMA, Homeostatic model assessment; TyG, triglycerides and glucose index. |
Discussion
The present study is the first report on the CM risk associated with obesity indices using Qatar Biobank data. The objective of this study was to compare the ability of different obesity indicators (anthropometric indicators and DXA –derived parameters) to predict CM risk among Qatari adults.
Evidence from numerous studies demonstrated the association between adiposity and the risk of certain non-communicable diseases.24–28 Different body adiposity indicators were associated with CM risk.12,29–37
The major anthropometric indicators used to predict the CM risk include BMI, WHtR, and WC. BMI is the most widely used measure to diagnose overweight and obesity, whereas WC and WHtR better indicator of intra-abdominal fat, have been suggested to be more accurate to predict CM than BMI.24,25,27,38–40
Results of the current study demonstrated a significant correlation between most of the anthropometric indicators of adiposity and CM risk parameters. The strongest associations were observed with WHtR and WC. This finding is in line with other studies.39,41 Konieczna et al reported a poor association between anthropometric indicators and CM risk parameters. Results of ROC analysis confirmed the superiority of WHtR and to a lesser degree WC based on the greatest AUC in predicting CM risk.12 Similar results have been reported by other studies.24,25,27,41 Recently, several meta-analysis have been published comparing BMI, WC and WHtR with BMI to elucidate their association with CM.38,42,43 In a meta-analysis, Ashwell et al reported the superiority of WHtR over WC and BMI for detecting CM risk factors in both sexes.38 Results from the CARRS study conducted in India and Pakistan revealed that WC and WHtR were the most useful indices for identifying South Asian adults with prevalent diabetes and hypertension.24
Results of a study targeting Arab adults indicated that WC and WHtR were strongly associated with SBP and DBP, respectively. They also reported a statistically significant association between WC, WHtR and glucose (r=0.34 and 0.33), respectively. The correlation coefficients of total cholesterol and LDL were 0.28, 0.24, 0.14 and 0.15 for WC and WHtR, respectively. Results revealed a weak association between WC, WHtR, and HDL (−0.06 and 0.006), respectively. Comparing WC and WHtR, AUC’s analysis have shown that WC was the most sensitive adiposity index for diabetes mellitus, CVD, hypertension and metabolic syndrome (AUC=0.6960, AUC=0.795; AUC= 0.589; AUC=0.813, respectively).4,12,15,44
The results are in line with other studies.4,12,15,45,46 It is well known that regional fat distribution is strongly associated with CM risk compared to total fat.47,48 Aparisi et al reported a high correlation between HDL and % total fat mass (r=−0.501) for only men, while for TG, the highest correlation was from the ratio trunk to leg fat mass for men (r=0.457) and women (r=0.421), respectively.45 Results of a study targeting postmenopausal women revealed that central adiposity indices (android fat, trunk fat, android/gynoid fat mass, trunk/leg fat mass) were significantly correlated with HOMA, TG, and inversely correlated with HDL.44
Wiklund et al reported on the association between abdominal and gynoid fat mass with CM risk factors. Results revealed a high significantly correlation between abdominal fat and TG for men (r=0.31) and women (r=0.33), respectively. The ratio abdominal to gynoid was highly correlated with cholesterol for men (r=0.32) and a weak correlation was noted for women (r=0.12). The highest correlation was observed for abdominal fat and DBP for men (r=0.34).15 Results of a cross sectional analysis revealed a statistically significant relationship between trunk/leg fat, Hb1Ac (r=0.118), TyG (r= 1.160), and TG (r=0.126). The correlation was negative with HDL (r= −0.132) and no significant correlations were observed between the DXA indices, SBP, DBP, and LDL.12
The effect of adipose tissue on the development of non–communicable diseases (NCD) such as cardiovascular diseases, hypertension, and diabetes mellitus (T2DM) is well established.49–51 Identifying individuals and population at risk of NCD constitutes the health priority for clinicians and public health authorities. Different researches have been conducted to compare the accuracy of different body adiposity indices in predicting CM risks.2,33,52,53 Results of different studies comparing anthropometric indices with DXA-derived indicators to select the best adiposity indices to predict CM risk were controversial.
Results of this study indicated that DXA- derived measurements did not offer advantages over traditional anthropometric indicators in predicting CM risk. Abdominal obesity indicators (WC and WHtR) showed better ability to predict dyslipidemia (high cholesterol, high LDL), while DXA-derived parameters (BF% and trunk/leg fat) were more accurate to predict low HDL and high TG, respectively. Our results were consistent with previous studies.4,29,54 In a study aimed to compare DXA derived parameters with anthropometric measures to predict the abdominal aortic calcification (AAC), strong marker of atherosclerosis among elderly, Shang et al reported that WC and WHR were the best predictors of AAC severity among male and female.54
Another study conducted did not find any advantages using DXA, as a routine assessment tool, to identify CM risks associated with obesity.29 Results of a study comparing the association between adiposity measured by DXA, BMI and skinfolds and risk markers for CVD and diabetes in adult males, indicated that BMI was as performant as DXA parameters and skinfolds. Strongest correlations for BMI compared to DXA indicators were observed for HDL (R=−0.31, P< 0.001), TG (R=0.41, P< 0.001), SBP (R=0.31, P< 0.001), and DBP (R=0.31, P< 0.001), respectively.4
Controversial findings were reported in different studies. In a cross sectional analysis, Konieczna et al reported that DXA measures and regional adiposity were the strongest predictors of CM risks than conventional anthropometric measurements.12 Results of AUC’s analysis indicated that trunk/leg fat had the highest AUC for TG (AUC=0.556, 95% CI 0.523–0.589), HDL (AUC=0.556, 95% CI 0.523–0.588), and TG/HDL (AUC=0.581, 95% CI 0.546–0.617), respectively. A significant relationship was also observed between visceral adiposity (VAT) and Type 2 diabetes indicators. The highest AUC’s were observed for VAT/total fat and HbA1c (AUC=0.629, 95% CI 0.567–0.690), and VAT for Tyr (AUC=0.626, 95% CI 0.578–0.674).12 Vasan et al showed a strong association between android fat, visceral fat, impaired fasting glucose, and hypertriglyceridemia.55 The Odds ratio (ORs) for impaired fasting glucose, android fat, and visceral fat were (OR= 1.93, 95% CI 1.30, 2.88) and (OR= 1.69, 95% CI 1.36, 2.11), respectively. For hypertriglyceridemia, ORs were (OR=5.01, 95% CI 3.25, 7.69), and (OR=3.64, 95% CI 2.82, 4.70) for android fat and visceral fat, respectively.55
Wiklund et al studied the association between abdominal and gynoid fat mass with the CM risk factors among adults. It was concluded that abdominal fat and the ratio of abdominal to gynoid fat were better in predicting CM risks factors than BMI. We noted that this study compared DXA parameters only with BMI.15 Similar results have been reported by other researchers.45,46
The present study had some strengths and limitations. The Qatar Biobank data included all variables on biomarkers, DXA and anthropometric measurements. The study population was composed of homogenous and healthy individuals. This study is limited because the cross-sectional nature of the study does not allow causality between the study variables and the outcomes. Another limitation may be attributed to the relative low sample size.
Conclusions
Results of the present study show that adiposity indicators (WC and WHtR) are clinically valuable tools used to identify individuals at risk of CVD. The use of DXA can provide more in depth data.
Abbreviations
BMI, Body mass index; WC, Waist circumference; WHtR, Waist to height ratio; CM, Cardiometabolic; TG, Triglycerides; LDL, Low density liporotein; HDL, High density lipoprotein; CVD, Cardiovascular diseases; ROC, Receiver operating characteristics; AUC, Area under curve; TyG, Triglycerides and glucose index; DXA, Dual-energy x-ray absorptiometry; HOMA-IR, HOMA- Homeostatic Model Assessment- Insulin resistance; DBP, Diastolic blood pressure; SBP, Systolic blood pressure.
Ethics Approval
The study was approved by the Institutional Review Board of Qatar Biobank (Ex-2018-RES-ACC-0117-0059).
Data Sharing Statement
The datasets generated and/or analyzed during the current study are not publicly available due Qatar Biobank policy but are available from the corresponding author on reasonable request.
Acknowledgment
The authors would like to thank Qatar Biobank for providing the data.
Author Contributions
All authors contributed to data analysis, drafting and revising the manuscript. All authors approved the final version to be published, and agree to be accountable for all aspects of the work.
Disclosure
The authors declare that they have no competing interests in this work.
References
1. Haj Bakri A-TA. Chronic Disease Risk Factor Surveillance: Qatar STEPS Report 2012. Qatar: The Supreme Council of Health;2013. Retrieved from: https://www.who.int/ncds/surveillance/steps/Qatar_FactSheet_2012.pdf.
2. Liu J, Tse LA, Liu Z, et al. Predictive values of anthropometric measurements for cardiometabolic risk factors and cardiovascular diseases among 44 048 Chinese. J Am Heart Assoc. 2019;8(16):e010870. doi:10.1161/JAHA.118.010870
3. Bastien M, Poirier P, Lemieux I, Despres JP. Overview of epidemiology and contribution of obesity to cardiovascular disease. Prog Cardiovasc Dis. 2014;56(4):369–381. doi:10.1016/j.pcad.2013.10.016
4. Hariri AA, Oliver NS, Johnston DG, Stevenson JC, Godsland IF. Adiposity measurements by BMI, skinfolds and dual energy X-ray absorptiometry in relation to risk markers for cardiovascular disease and diabetes in adult males. Dis Markers. 2013;35(6):12. doi:10.1155/2013/763907
5. Whitlock G, Lewington S, Sherliker P, Clarke R, Emberson J, Peto R. Body-mass index and cause-specific mortality in 900 000 adults: collaborative analyses of 57 prospective studies. Lancet. 2009;373(9669):1083–1096. doi:10.1016/S0140-6736(09)60318-4
6. Millar SR, Perry IJ, Phillips CM. Assessing cardiometabolic risk in middle-aged adults using body mass index and waist-height ratio: are two indices better than one? A cross-sectional study. Diabetol Metab Syndr. 2015;7:73. doi:10.1186/s13098-015-0069-5
7. Cornier MA, Despres JP, Davis N, et al. Assessing adiposity: a scientific statement from the American Heart Association. Circulation. 2011;124(18):1996–2019. doi:10.1161/CIR.0b013e318233bc6a
8. Hwang YC, Hayashi T, Fujimoto WY, et al. Visceral abdominal fat accumulation predicts the conversion of metabolically healthy obese subjects to an unhealthy phenotype. Int J Obes (Lond). 2015;39(9):1365–1370. doi:10.1038/ijo.2015.75
9. Lim KI, Yang SJ, Kim TN, et al. The association between the ratio of visceral fat to thigh muscle area and metabolic syndrome: the Korean Sarcopenic Obesity Study (KSOS). Clin Endocrinol (Oxf). 2010;73(5):588–594. doi:10.1111/j.1365-2265.2010.03841.x
10. Rothney MP, Catapano AL, Xia J, et al. Abdominal visceral fat measurement using dual-energy X-ray: association with cardiometabolic risk factors. Obesity (Silver Spring). 2013;21(9):1798–1802. doi:10.1002/oby.20223
11. Browning LM, Hsieh SD, Ashwell M. A systematic review of waist-to-height ratio as a screening tool for the prediction of cardiovascular disease and diabetes: 0.5 could be a suitable global boundary value. Nutr Res Rev. 2010;23(2):247–269. doi:10.1017/S0954422410000144
12. Konieczna J, Abete I, Galmes AM, et al. Body adiposity indicators and cardiometabolic risk: cross-sectional analysis in participants from the PREDIMED-Plus trial. Clin Nutr. 2019;38(4):1883–1891. doi:10.1016/j.clnu.2018.07.005
13. Diano D, Ponti F, Guerri S, et al. Upper and lower limbs composition: a comparison between anthropometry and dual-energy X-ray absorptiometry in healthy people. Arch Osteoporos. 2017;12(1):78. doi:10.1007/s11657-017-0374-8
14. Peppa M, Koliaki C, Hadjidakis DI, et al. Regional fat distribution and cardiometabolic risk in healthy postmenopausal women. Eur J Intern Med. 2013;24(8):824–831. doi:10.1016/j.ejim.2013.07.001
15. Wiklund P, Toss F, Weinehall L, et al. Abdominal and gynoid fat mass are associated with cardiovascular risk factors in men and women. J Clin Endocrinol Metab. 2008;93(11):4360–4366. doi:10.1210/jc.2008-0804
16. Al Kuwari H, Al Thani A, Al Marri A, et al. The Qatar Biobank: background and methods. BMC Public Health. 2015;15:1208. doi:10.1186/s12889-015-2522-7
17. Friedewald WT, Levy RI, Fredrickson DS. Estimation of the concentration of low-density lipoprotein cholesterol in plasma, without use of the preparative ultracentrifuge. Clin Chem. 1972;18(6):499–502.
18. Unger G, Benozzi SF, Perruzza F, Pennacchiotti GL. Triglycerides and glucose index: a useful indicator of insulin resistance. Endocrinol Nutr. 2014;61(10):533–540. doi:10.1016/j.endonu.2014.06.009
19. Simental-Mendia LE, Rodriguez-Moran M, Guerrero-Romero F. The product of fasting glucose and triglycerides as surrogate for identifying insulin resistance in apparently healthy subjects. Metab Syndr Relat Disord. 2008;6(4):299–304. doi:10.1089/met.2008.0034
20. Bonora E, Targher G, Alberiche M, et al. Homeostasis model assessment closely mirrors the glucose clamp technique in the assessment of insulin sensitivity: studies in subjects with various degrees of glucose tolerance and insulin sensitivity. Diabetes Care. 2000;23(1):57–63. doi:10.2337/diacare.23.1.57
21. Expert Panel on Detection, E., & Treatment of High Blood Cholesterol in, A. Executive summary of the third report of the national cholesterol education program (ncep) expert panel on detection, evaluation, and treatment of high blood cholesterol in adults (Adult Treatment Panel III). JAMA. 2001;285(19):2486–2497. doi:10.1001/jama.285.19.2486
22. Navarro-Gonzalez D, Sanchez-Inigo L, Pastrana-Delgado J, Fernandez-Montero A, Martinez JA. Triglyceride-glucose index (TyG index) in comparison with fasting plasma glucose improved diabetes prediction in patients with normal fasting glucose: the Vascular-Metabolic CUN cohort. Prev Med. 2016;86:99–105. doi:10.1016/j.ypmed.2016.01.022
23. Shashaj B, Luciano R, Contoli B, et al. Reference ranges of HOMA-IR in normal-weight and obese young Caucasians. Acta Diabetol. 2016;53(2):251–260. doi:10.1007/s00592-015-0782-4
24. Patel SA, Deepa M, Shivashankar R, et al. Comparison of multiple obesity indices for cardiovascular disease risk classification in South Asian adults: the CARRS Study. PLoS One. 2017;12(4):e0174251. doi:10.1371/journal.pone.0174251
25. Zhang K, Zhao Q, Li Y, et al. Feasibility of anthropometric indices to identify dyslipidemia among adults in Jilin Province: a cross-sectional study. Lipids Health Dis. 2018;17(1):16. doi:10.1186/s12944-017-0648-6
26. Tran NTT, Blizzard CL, Luong KN, et al. The importance of waist circumference and body mass index in cross-sectional relationships with risk of cardiovascular disease in Vietnam. PLoS One. 2018;13(5):e0198202. doi:10.1371/journal.pone.0198202
27. Li WC, Chen IC, Chang YC, Loke SS, Wang SH, Hsiao KY. Waist-to-height ratio, waist circumference, and body mass index as indices of cardiometabolic risk among 36,642 Taiwanese adults. Eur J Nutr. 2013;52(1):57–65. doi:10.1007/s00394-011-0286-0
28. Wang H, Liu A, Zhao T, et al. Comparison of anthropometric indices for predicting the risk of metabolic syndrome and its components in Chinese adults: a prospective, longitudinal study. BMJ Open. 2017;7(9):e016062. doi:10.1136/bmjopen-2017-016062
29. Katzmarzyk PT, Heymsfield SB, Bouchard C. Clinical utility of visceral adipose tissue for the identification of cardiometabolic risk in white and African American adults. Am J Clin Nutr. 2013;97(3):480–486. doi:10.3945/ajcn.112.047787
30. Swainson MG, Batterham AM, Tsakirides C, Rutherford ZH, Hind K. Prediction of whole-body fat percentage and visceral adipose tissue mass from five anthropometric variables. PLoS One. 2017;12(5):e0177175. doi:10.1371/journal.pone.0177175
31. InterAct C, Langenberg C, Sharp SJ, et al. Long-term risk of incident type 2 diabetes and measures of overall and regional obesity: the EPIC-InterAct case-cohort study. PLoS Med. 2012;9(6):e1001230. doi:10.1371/journal.pmed.1001230
32. Fujita M, Sato Y, Nagashima K, Takahashi S, Hata A. Predictive power of a body shape index for development of diabetes, hypertension, and dyslipidemia in Japanese adults: a retrospective cohort study. PLoS One. 2015;10(6):e0128972. doi:10.1371/journal.pone.0128972
33. Zaid M, Ameer F, Munir R, et al. Correction to: anthropometric and metabolic indices in assessment of type and severity of dyslipidemia. J Physiol Anthropol. 2017;36(1):40. doi:10.1186/s40101-017-0155-5
34. Li Y, Wang H, Wang K, et al. Optimal body fat percentage cut-off values for identifying cardiovascular risk factors in Mongolian and Han adults: a population-based cross-sectional study in Inner Mongolia, China. BMJ Open. 2017;7(4):e014675. doi:10.1136/bmjopen-2016-014675
35. Kizer JR, Biggs ML, Ix JH, et al. Measures of adiposity and future risk of ischemic stroke and coronary heart disease in older men and women. Am J Epidemiol. 2011;173(1):10–25. doi:10.1093/aje/kwq311
36. Huxley R, James WP, Barzi F, Patel JV, Lear SA, Suriyawongpaisal P, Obesity in Asia, C. Ethnic comparisons of the cross-sectional relationships between measures of body size with diabetes and hypertension. Obes Rev. 2008;9(Suppl 1):53–61. doi:10.1111/j.1467-789X.2007.00439.x
37. Zhang Y, Gu Y, Wang N, et al. Association between anthropometric indicators of obesity and cardiovascular risk factors among adults in Shanghai, China. BMC Public Health. 2019;19(1):1035. doi:10.1186/s12889-019-7366-0
38. Ashwell M, Gunn P, Gibson S. Waist-to-height ratio is a better screening tool than waist circumference and BMI for adult cardiometabolic risk factors: systematic review and meta-analysis. Obes Rev. 2012;13(3):275–286. doi:10.1111/j.1467-789X.2011.00952.x
39. Kabat GC, Heo M, Van Horn LV, et al. Longitudinal association of anthropometric measures of adiposity with cardiometabolic risk factors in postmenopausal women. Ann Epidemiol. 2014;24(12):896–902. doi:10.1016/j.annepidem.2014.10.007
40. Amirabdollahian F, Haghighatdoost F. Anthropometric indicators of adiposity related to body weight and body shape as cardiometabolic risk predictors in british young adults: superiority of waist-to-height ratio. J Obes. 2018;2018:8370304. doi:10.1155/2018/8370304
41. Park SH, Choi SJ, Lee KS, Park HY. Waist circumference and waist-to-height ratio as predictors of cardiovascular disease risk in Korean adults. Circ J. 2009;73(9):1643–1650. doi:10.1253/circj.cj-09-0161
42. van Dijk SB, Takken T, Prinsen EC, Wittink H. Different anthropometric adiposity measures and their association with cardiovascular disease risk factors: a meta-analysis. Neth Heart J. 2012;20(5):208–218. doi:10.1007/s12471-011-0237-7
43. Savva SC, Lamnisos D, Kafatos AG. Predicting cardiometabolic risk: waist-to-height ratio or BMI. A meta-analysis. Diabetes Metab Syndr Obes. 2013;6:403–419. doi:10.2147/DMSO.S34220
44. Al-Daghri NM, Al-Attas OS, Wani K, et al. Sensitivity of various adiposity indices in identifying cardiometabolic diseases in Arab adults. Cardiovasc Diabetol. 2015;14:101. doi:10.1186/s12933-015-0265-5
45. Aparisi Gomez MP, Ponti F, Mercatelli D, et al. Correlation between DXA and laboratory parameters in normal weight, overweight, and obese patients. Nutrition. 2019;61:143–150. doi:10.1016/j.nut.2018.10.023
46. Miazgowski T, Krzyzanowska-Swiniarska B, Dziwura-Ogonowska J, Widecka K. The associations between cardiometabolic risk factors and visceral fat measured by a new dual-energy X-ray absorptiometry-derived method in lean healthy Caucasian women. Endocrine. 2014;47(2):500–505. doi:10.1007/s12020-014-0180-7
47. Tchernof A, Despres JP. Pathophysiology of human visceral obesity: an update. Physiol Rev. 2013;93(1):359–404. doi:10.1152/physrev.00033.2011
48. Ferreira I, Snijder MB, Twisk JW, et al. Central fat mass versus peripheral fat and lean mass: opposite (adverse versus favorable) associations with arterial stiffness? The Amsterdam Growth and Health Longitudinal Study. J Clin Endocrinol Metab. 2004;89(6):2632–2639. doi:10.1210/jc.2003-031619
49. Luo J, Hendryx M, Laddu D, et al. Racial and ethnic differences in anthropometric measures as risk factors for diabetes. Diabetes Care. 2019;42(1):126–133. doi:10.2337/dc18-1413
50. Song X, Jousilahti P, Stehouwer CD, et al. Cardiovascular and all-cause mortality in relation to various anthropometric measures of obesity in Europeans. Nutr Metab Cardiovasc Dis. 2015;25(3):295–304. doi:10.1016/j.numecd.2014.09.004
51. Deng G, Yin L, Liu W, Liu X, Xiang Q, Qian Z, China Investigator, t. Associations of anthropometric adiposity indexes with hypertension risk: A systematic review and meta-analysis including PURE-China. Medicine (Baltimore). 2018;97(48):e13262. doi:10.1097/MD.0000000000013262
52. Melmer A, Lamina C, Tschoner A, et al. Body adiposity index and other indexes of body composition in the SAPHIR study: association with cardiovascular risk factors. Obesity (Silver Spring). 2013;21(4):775–781. doi:10.1002/oby.20289
53. Wei J, Liu X, Xue H, Wang Y, Shi Z. Comparisons of visceral adiposity index, body shape index, body mass index and waist circumference and their associations with diabetes mellitus in adults. Nutrients. 2019;11(7). doi:10.3390/nu11071580
54. Shang X, Scott D, Hodge A, et al. Adiposity assessed by anthropometric measures has a similar or greater predictive ability than dual-energy X-ray absorptiometry measures for abdominal aortic calcification in community-dwelling older adults. Int J Cardiovasc Imaging. 2016;32(9):1451–1460. doi:10.1007/s10554-016-0920-2
55. Vasan SK, Osmond C, Canoy D, et al. Comparison of regional fat measurements by dual-energy X-ray absorptiometry and conventional anthropometry and their association with markers of diabetes and cardiovascular disease risk. Int J Obes (Lond). 2018;42(4):850–857. doi:10.1038/ijo.2017.289
 © 2020 The Author(s). This work is published and licensed by Dove Medical Press Limited. The
full terms of this license are available at https://www.dovepress.com/terms
and incorporate the Creative Commons Attribution
- Non Commercial (unported, 3.0) License.
By accessing the work you hereby accept the Terms. Non-commercial uses of the work are permitted
without any further permission from Dove Medical Press Limited, provided the work is properly
attributed. For permission for commercial use of this work, please see paragraphs 4.2 and 5 of our Terms.
© 2020 The Author(s). This work is published and licensed by Dove Medical Press Limited. The
full terms of this license are available at https://www.dovepress.com/terms
and incorporate the Creative Commons Attribution
- Non Commercial (unported, 3.0) License.
By accessing the work you hereby accept the Terms. Non-commercial uses of the work are permitted
without any further permission from Dove Medical Press Limited, provided the work is properly
attributed. For permission for commercial use of this work, please see paragraphs 4.2 and 5 of our Terms.