Back to Journals » International Journal of Women's Health » Volume 9
Adiposity and hyperleptinemia during the first trimester among pregnant women with preeclampsia
Authors Yeboah FA ![]() , Ngala RA, Bawah AT
, Ngala RA, Bawah AT ![]() , Asare-Anane H, Alidu H
, Asare-Anane H, Alidu H ![]() , Hamid AWM
, Hamid AWM ![]() , Wumbee JDK
, Wumbee JDK
Received 7 February 2017
Accepted for publication 9 May 2017
Published 16 June 2017 Volume 2017:9 Pages 449—454
DOI https://doi.org/10.2147/IJWH.S134088
Checked for plagiarism Yes
Review by Single anonymous peer review
Peer reviewer comments 2
Editor who approved publication: Professor Elie Al-Chaer
Francis Agyemang Yeboah,1 Robert Amadu Ngala,1 Ahmed Tijani Bawah,2 Henry Asare-Anane,3 Huseini Alidu,2 Abdul-Wahab Mawuko Hamid,2 Joshua Dokurugu Kwame Wumbee4
1Department of Molecular Medicine, Kwame Nkrumah University of Science and Technology, Kumasi, 2Department of Medical Laboratory Science, University of Health and Allied Sciences, Ho, 3Department of Chemical Pathology, School of Biomedical and Allied Health Sciences, University of Ghana, Accra, 4Internal Quality Control Unit, Quality Control Directorate, Kumasi Technical University, Kumasi, Ghana
Background: Leptin levels start increasing from the early stages of pregnancy, irrespective of the maternal body mass index. Leptin levels are increased in pregnant women with preeclampsia (PE) and may precede the clinical onset of the disease, with peaks occurring around 28 weeks of gestation. This study was aimed at determining whether serum leptin concentration and body fat percentage are significantly altered during the first trimester in pregnancies that subsequently develop PE and whether such changes are useful in predicting the disease.
Materials and methods: This was a prospective longitudinal study conducted among pregnant women in Ho municipality. A cohort of 314 pregnant women was monitored from the first antenatal visit to delivery period at the Volta Regional Hospital, Ho, Ghana. Maternal serum leptin and lipid profile were analyzed and body fat percentage determined during first trimester. Body mass index was also calculated.
Results: First trimester serum leptin level (P<0.0001) and body fat percentage (P<0.0001) were significantly higher in those who developed PE than those who did not; while triglycerides (P=0.8600), total cholesterol (P=0.5620), high-density lipoprotein (P=0.5880), low-density lipoprotein (P=0.4870) and very low-density lipoprotein (P=0.6540) did not show any significant difference between those with PE and those without PE.
Conclusion: Leptin levels are increased significantly during the first trimester of pregnancy in obese women with PE, and these increases precede the onset of PE.
Keywords: bioelectrical impedance analysis, dyslpidemia, body mass index, hypertension
Introduction
Leptin, discovered in 1994, is a product of the ob gene and has a molecular weight of 16 kDa.1 The name leptin is derived from the Greek word “leptos” meaning thin because it leads to an increase in energy expenditure and acts on satiety signals in the hypothalamus reducing food intake.2,3 It modulates pancreatic β-cell function resulting in improved peripheral insulin sensitivity.4 In obesity, though there may be intact leptin receptors, high leptin levels fail to stimulate weight reduction. This phenomenon is referred to as leptin resistance.4 Leptin regulates gonadotrophin releasing hormone secretion during pregnancy, promotes implantation,5 induces human chorionic gonadotrophin production in trophoblast cells, regulates placental growth, enhances mitogenesis and stimulates amino acid uptake.5 Leptin levels increase progressively from the early stages of pregnancy irrespective of maternal weight gain,6 reaching its peak levels at ~28 weeks of gestation and then it decreases to pregravid concentrations immediately after delivery.7
Evidence has shown that the placenta, rather than maternal adipose tissue alone, contributes a substantial part to the rise in maternal leptin concentrations during pregnancy8 and that human placental leptin gene has a specific promoter region, further suggesting that placental leptin is differentially regulated as compared to leptin originating from the adipose tissue.9
Leptin levels are increased in pregnant women with preeclampsia (PE)10 and levels are increased before the clinical onset of the disease,11,12 with peaks occurring at ~28 weeks of gestation.7 Therefore, leptin may be involved in the pathophysiology of the disease. Some authors have, however, reported decreased13 or unchanged14 circulating levels in patients with PE.
Bioelectrical impedance analysis (BIA) produces a close estimate of fat mass in a wide range of body compositions.15 The common indicators for obesity such as body mass index (BMI), waist circumference, waist-to-height ratio and waste-to-hip ratio are not able to determine body fat percentage (%BF), making BIA a very useful tool for estimating the %BF, especially in large epidemiological studies. This method is useful in determining the percentage of body water, muscle mass, bone density and the amount of calories available in the body. The main aim of this study was to determine whether in the first trimester of pregnancy, serum concentration of leptin and %BF are altered in pregnancies that subsequently develop PE and whether these changes are significant enough in determining which pregnancies are likely to develop PE. It is against this background we sought to examine how leptin together with measurements of adiposity can be adequately used to aid in better prognosis of pregnancy outcomes, so as to elicit early interventions to save the mother and the baby.
Materials and methods
This study involved participants who were purposively selected from a longitudinal study of 314 pregnant women for pregnancy complications at the Volta Regional Hospital, Ho, Ghana. The participants consisted of those attending their first routine antenatal visit. Questionnaires were administered and information on maternal characteristics and medical history of participants was obtained.
Written informed consent was obtained from each participant and ethical clearance (CHRPE/AP350/14) was obtained from the joint Committee on Human Research Publication and Ethics of the School of Medical Science, Kwame Nkrumah University of Science and Technology and the Komfo Anokye Teaching Hospital, Kumasi. Blood pressure was measured using a mercury sphygmomanometer and stethoscope. Measurements were taken from the left upper arm after the subjects were made to sit for at least 5 min in accordance with the guidelines of the American Heart Association.16 Triplicate measurements were taken with at least 5 min rest interval between measurements and the mean blood pressure was recorded to the nearest 2.0 mmHg. Height was measured without shoes with a wall-mounted ruler to the nearest 0.5 cm with the study participants standing upright and heels put together and the head in the horizontal plane. Weight was measured in kilograms with light clothing using the bioimpedance analyzer (BIA; BSD01, Pure Pleasure, a division of the Stingray Group, Capetown, South Africa: www.purepleasure.co.za). The BIA was used to obtain BMI, %BF, percentage of muscle mass, water, bone and calories, according to the manufacturer’s instruction. Body weight, height and blood samples were taken and also bioimpedance analysis conducted between 7:00 am and 8:00 am.
Biochemical analysis
Fasting blood samples were taken and sera and plasma separated and stored in several aliquots at −21°C. Leptin levels were measured in 26 cases who subsequently developed PE and 286 unaffected participants. Maternal serum leptin concentration was measured quantitatively by sandwich enzyme-linked immunosorbent assay technique using Leptin (human LEP) kit (Elabscience Biotechnology Co. Ltd, Wu Han, People’s Republic of China). The lowest limit of detection of the assay was 0.094 ng/mL. The intra-assay and interassay coefficients of variation ranged from 2.5% to 9.5% and from 4.7% to 8.3%, respectively. Lipid profile was done using the Vitros dry chemistry analyzer (Ortho-Clinical Diagnostics, Johnson & Johnson, High Wycombe, UK). None of the samples in this study were previously thawed and refrozen.
Diagnosis of PE
Blood pressure measurement was repeated and urine protein determined after 20 weeks of gestation. Urine protein was determined using the dip-stick qualitative/semi-quantitative method (Urit Medical Electronic Co., Ltd, Guangxi, People’s Republic of China) following manufacturer’s instructions. The urine strip was dipped into early morning urine collected in clean dry plastic containers. The strip was inserted up to the test area for not more than 2 seconds. The edge of the strip was drawn along the brim of the vessel to remove excess urine, making sure the test area did not touch the vessel. The strip was held vertical and the tip tapped on an absorbent paper to remove any remaining urine. The test strip was held horizontally and compared with the color chart on the vial label under good light. The intensity of the blue green color was proportional to the amount of protein in the urine sample.
Diagnosis of PE was based on systolic blood pressure of 140 mmHg or more, diastolic blood pressure of 90 mmHg or more (or both) and proteinuria of 2+ or 3+ or more on semi-quantitative examination.
Statistical analysis
Data were first entered into Microsoft Office Excel 2007 and GraphPad Prism 3.02 program was used to analyze the data. The values were expressed as mean ± standard deviation (mean ± SD). Student’s t-test was used for comparison of means of variables between case and control subjects. The level of statistical significance was set at P<0.05 for all tests and at 95% confidence interval.
Results
A total of 314 subjects were recruited for this study, out of whom 26 developed PE with data on two participants missing. When the baseline demographics, lipids and leptin characteristics were stratified by PE (Tables 1 and 2), the mean age of those with PE was significantly higher than those without PE (34.50±5.20 vs 28.60±5.70 years; P<0.001); BMI was also significantly higher in those who developed PE than in those who did not (32.3±2.7 vs 25.1±4.1 kg/m2; P<0.0001). There was no significant difference in the bone density of the PE group and the controls (P=0.167). The mean first trimester systolic blood pressure and diastolic blood pressure also did not show significant difference between the PE group and those without PE. There were, however, significant differences in the body fat % (P<0.0001), body water % (P<0.0001), muscle mass %, (P<0.0001) and body calories (P=0.003) when the PE group was compared to those without PE. The performance of BMI as a screening tool in determining PE was also examined. The receiver operating characteristic curve presented in Figure 1 shows that the curve is closer to the upper left corner and far away from the reference line, indicating high capacity to accurately determine PE (P=0.0001). In essence, at a criterion value of 28.8 kg/m2, the area under the curve of BMI was 0.931 with a sensitivity and specificity of 96.15% and 88.81%, respectively.
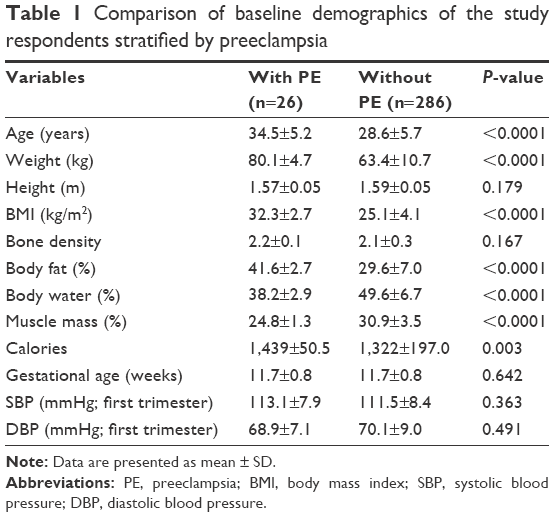 | Table 1 Comparison of baseline demographics of the study respondents stratified by preeclampsia |
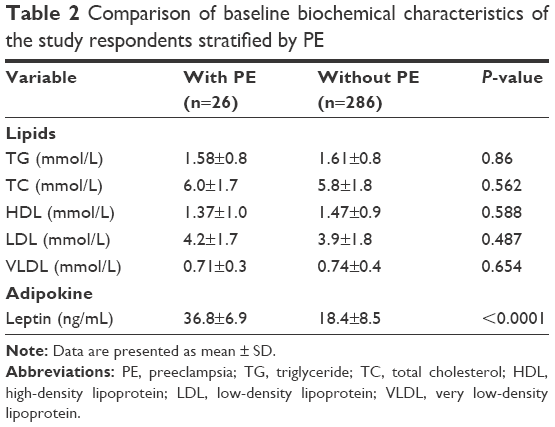 | Table 2 Comparison of baseline biochemical characteristics of the study respondents stratified by PE |
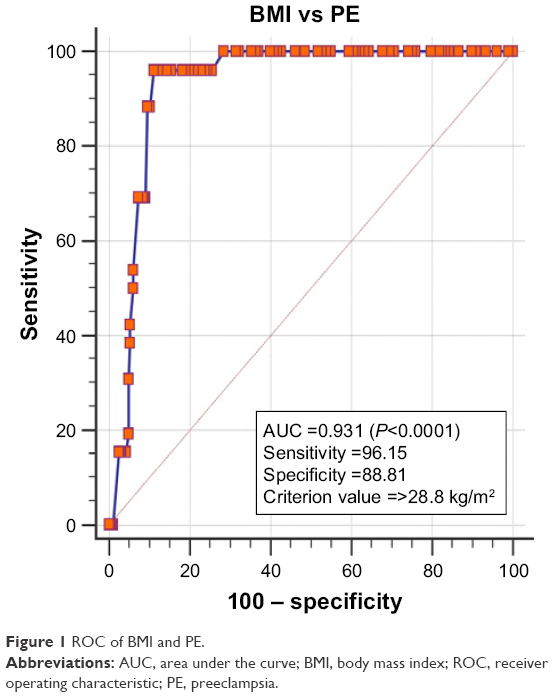 | Figure 1 ROC of BMI and PE. |
The lipid profile parameters did not show any significant difference between the PE group and those without PE. However, the leptin level was significantly higher (36.8±6.9 vs 18.4±8.5 ng/mL, P<0.0001) in the PE group compared to those without PE. When analysis of variance comprising pre-pregnancy family history and maternal characteristics with PE was done (Table 3), advanced maternal age and high BMI showed strong relationship with PE (P<0.0001). Furthermore, family history with hypertension, previous cesarean operation and previous stillbirth did not show any significant relationship with PE. There were, however, associations between the number of children (P=0.013), number of pregnancies (P=0.004) and previous miscarriages (P=0.013) and PE.
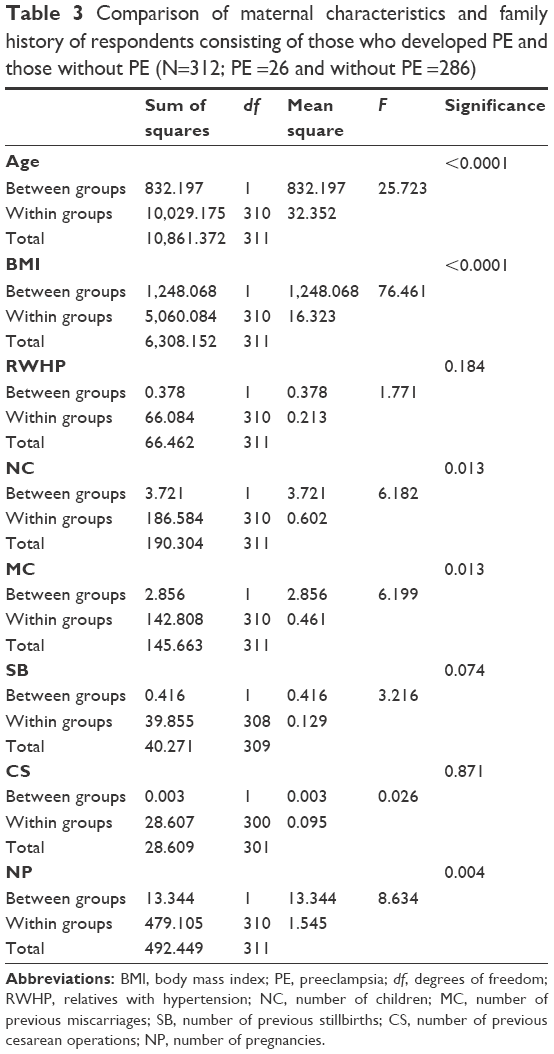 | Table 3 Comparison of maternal characteristics and family history of respondents consisting of those who developed PE and those without PE (N=312; PE =26 and without PE =286) |
Discussion
Our study showed that significantly higher leptin levels existed between those who subsequently developed PE compared to their counterparts. This finding is similar to a report suggesting an imbalance between adiponectin and leptin in the plasma of preeclamptic women resulting in elevated leptin levels and reduced adiponectin levels and a possible involvement of these two adipokines in the pathogenesis of PE.17 Similarly, leptin has been demonstrated to increase by 78% at 13 weeks of gestation in women with subsequent development of PE, compared to normal pregnant controls.18 Elevated first trimester leptin levels (≥25 ng/mL) increase the risk of PE about 18.8 fold, compared with that of pregnant women whose first trimester leptin level is <25 ng/mL.19 This study also agrees with other studies which indicated that leptin rises before the clinical onset of the disease.11,12 This observation suggests the involvement of leptin in the pathogenesis of PE, rather than an increase in leptin as a result of reduced clearance by the kidneys. Leptin has been shown to increase arterial blood pressure in rodents.20 The possible pathophysiological mechanisms underpinning the increase in blood pressure in response to hyperleptinemia, especially among obese pregnant women, may be probably due to connections between endothelial dysfunction, sympathetic activity and leptin, leading to leptin resistance. Leptin resistance in obese women increases renal tubular reabsorption of sodium.21 This then leads to water retention culminating in hypertension. Also, nitric oxide (NO), a vasorelaxation molecule, is induced by leptin, whose receptors are expressed in vascular endothelial cells. There is evidence that administration of leptin improves serum NO concentrations. Furthermore, when the synthesis of NO is inhibited, increased administration of leptin increases the arterial blood pressure significantly. This, therefore, suggests that augmented synthesis of NO is likely to be antagonistic to the hypertensive effects of leptin-induced sympathetic stimulation.22 Obesity causes endothelial dysfunction and impaired NO release; consequently, obese women with hyperleptinemia are more likely to suffer from hypertensive disorders such as PE, compared to their normal weight counterparts.
This study did not demonstrate significant differences in lipid profile parameters between women who subsequently developed PE compared to their counterparts who did not. The findings of this study are contrary to what was reported by researchers in Brazil where significant differences in triglyceride (TG)-rich proteins – very low-density lipoprotein 1 and low-density lipoprotein III – were found between women with PE and normal pregnant women.23 The difference could be due to differences in sample size and the period of gestation during which sampling was done. Whereas their sample size was eight each for controls and samples, our study involved 26 cases with PE and 286 without PE. Also, our samples were taken before the onset of PE. Furthermore, our research did not measure those specific TG-rich proteins, and this could also be the reason for the differences in our findings and what they reported. Other studies have also reported lipid abnormalities in preeclamptic women, compared to their normotensive counterparts.23–25 Our study showed general dyslipidemia in both pregnant women with and without PE, though no significant differences existed between them. The fact that first trimester lipids did not show any significant difference between those who subsequently developed PE and those who did not suggests that the atherogenic lipid profile generally seen in pregnant women may be insufficient in predicting pregnancies that are likely to develop PE.
Our study indicated that obese women have greater risk of developing PE during the course of their pregnancy and corroborates earlier studies which indicated that the risk of women developing PE increases with obesity.26,27 Higher BMI (≥28.8 kg/m2) has been demonstrated in this study to have high accuracy of determining pregnancies that are likely to develop PE. This suggests that excessive fat accumulation in the body contributes substantially to the pathogenesis of PE. Furthermore, this study also agrees with a previous report indicating that the risk factor for PE is maternal age of 35 years and above.28 Family history of PE has been reported to triple the risk of PE;29,30 however, we did not find a significant relationship between PE and family history of hypertension, probably due to the fact that this study looked at the family history of hypertension in general and not PE, and also, the sample size representing PE was only 26 out of a total of 314 participants.
Conclusion
The observed elevation of leptin in the first trimester before the clinical diagnosis of PE could be explored as a predictive index in the management of possible preeclamptic conditions. Dyslipidemia observed in normal pregnancies is not significantly different from that seen in PE. BMI and %BF are the important risk factors in determining pregnancies that are likely to develop PE.
Acknowledgment
The researchers are grateful to the maternity and laboratory departments of the Volta Regional Hospital, Ho, Ghana for granting them permission to carry out the project in the facility.
Disclosure
The authors report no conflicts of interest in this work.
References
Miehle K, Stepan H, Fasshauer M. Leptin, adiponectin and other adipokines in gestational diabetes mellitus and pre-eclampsia. Clin Endocrinol (Oxf). 2012;76(1):2–11. | ||
Kennedy A, Gettys TW, Watson P, et al. The metabolic significance of leptin in humans: gender-based differences in relationship to adiposity, insulin sensitivity, and energy expenditure 1. J Clin Endocrinol Metab. 1997;82(4):1293–1300. | ||
Webber J. Energy balance in obesity. Proc Nutr Soc. 2003;62(02):539–543. | ||
Rabe K, Lehrke M, Parhofer KG, Broedl UC. Adipokines and insulin resistance. Mol Med. 2008;14(11–12):741–751. | ||
Hauguel-de Mouzon S, Guerre-Millo M. The placenta cytokine network and inflammatory signals. Placenta. 2006;27(8):794–798. | ||
Henson MC, Castracane VD. Leptin in pregnancy: an update. Biol Reprod. 2006;74(2):218–229. | ||
Schubring C, Englaro P, Siebler T, et al. Longitudinal analysis of maternal serum leptin levels during pregnancy, at birth and up to six weeks after birth: relation to body mass index, skinfolds, sex steroids and umbilical cord blood leptin levels. Horm Res. 1998;50(5):276–283. | ||
Masuzaki H, Ogawa Y, Sagawa N, et al. Nonadipose tissue production of leptin: leptin as a novel placenta-derived hormone in humans. Nat Med. 1997;3(9):1029–1033. | ||
Bi S, Gavrilova O, Gong DW, Mason MM, Reitman M. Identification of a placental enhancer for the human leptin gene. J Biol Chem. 1997;272(48):30583–30588. | ||
Hendler I, Blackwell SC, Mehta SH, et al. The levels of leptin, adiponectin, and resistin in normal weight, overweight, and obese pregnant women with and without preeclampsia. Am J Obstetr Gynecol. 2005;193(3):979–983. | ||
Anim-Nyame N, Sooranna SR, Steer PJ, Johnson MR. Longitudinal analysis of maternal plasma leptin concentrations during normal pregnancy and pre-eclampsia. Hum Reprod. 2000;15(9):2033–2036. | ||
Chappell LC, Seed PT, Briley A, et al. A longitudinal study of biochemical variables in women at risk of preeclampsia. Am J Obstet Gynecol. 2002;187(1):127–136. | ||
Haugen F, Ranheim T, Harsem NK, Lips E, Staff AC, Drevon CA. Increased plasma levels of adipokines in preeclampsia: relationship to placenta and adipose tissue gene expression. Am J Physiol Endocrinol Metab. 2006;290(2):E326–E333. | ||
Martinez-Abundis E, Gonzalez-Ortiz M, Pascoe-Gonzalez S. Serum leptin levels and the severity of preeclampsia. Arch Gynecol Obstet. 2000;264(2):71–73. | ||
Deurenberg P, Weststrate JA, Seidell JC. Body mass index as a measure of body fatness: age-and sex-specific prediction formulas. Br J Nutr. 1991;65(2):105–114. | ||
Kirkendall WM, Burton AC, Epstein FH, Freis ED. Recommendations for human blood pressure determination by sphygmomanometers. Circulation. 1967;36(6):980–988. | ||
Ouyang Y, Chen H, Chen H. Reduced plasma adiponectin and elevated leptin in pre-eclampsia. Int J Gynecol Obstet. 2007;98(2):110–114. | ||
Ning Y, Williams M, Muy-Rivera M, Leisenring W, Luthy D. Relationship of maternal plasma leptin and risk of pre-eclampsia: a prospective study. J Matern Fetal Neonatal Med. 2004;15(3):186–192. | ||
Samolis S, Papastefanou I, Panagopoulos P, Galazios G, Kouskoukis A, Maroulis G. Relation between first trimester maternal serum leptin levels and body mass index in normotensive and pre-eclamptic pregnancies–role of leptin as a marker of pre-eclampsia: a prospective case–control study. Gynecol Endocrinol. 2010;26(5):338–343. | ||
Shek EW, Brands MW, Hall JE. Chronic leptin infusion increases arterial pressure. Hypertension. 1998;31(1 Pt 2):409–414. | ||
Hall JE, Hildebrandt DA, Kuo J. Obesity hypertension: role of leptin and sympathetic nervous system. Am J Hypertens. 2001;14(6 Pt 2):103S–115S. | ||
Frühbeck G. Pivotal role of nitric oxide in the control of blood pressure after leptin administration. Diabetes. 1999;48(4):903–908. | ||
Lima VJ, Andrade CR, Ruschi GE, Sass N. Serum lipid levels in pregnancies complicated by preeclampsia. Sao Paulo Med J. 2011;129(2):73–76. | ||
Belo L, Caslake M, Gaffney D, et al. Changes in LDL size and HDL concentration in normal and preeclamptic pregnancies. Atherosclerosis. 2002;162(2):425–432. | ||
Sattar N, Bendomir A, Berry C, Shepherd J, Greer IA, Packard CJ. Lipoprotein subfraction concentrations in preeclampsia: pathogenic parallels to atherosclerosis. Obstet Gynecol. 1997;89(3):403–408. | ||
Bodnar LM, Ness RB, Markovic N, Roberts JM. The risk of preeclampsia rises with increasing prepregnancy body mass index. Ann Epidemiol. 2005;15(7):475–482. | ||
Cedergren MI. Maternal morbid obesity and the risk of adverse pregnancy outcome. Obstet Gynecol. 2004;103(2):219–224. | ||
Conde-Agudelo A, Belizán JM. Risk factors for pre-eclampsia in a large cohort of Latin American and Caribbean women. BJOG. 2000;107(1):75–83. | ||
Arngrimsson R, Björnsson S, Geirsson RT, Björnsson H, Walker JJ, Snaedal G. Genetic and familial predisposition to eclampsia and pre-eclampsia in a defined population. Br J Obstet Gynaecol. 1990;97(9):762–769. | ||
Cincotta R, Brennecke S. Family history of pre-eclampsia as a predictor for pre-eclampsia in primigravidas. Int J Gynecol Obstet. 1998;60(1):23–27. |
 © 2017 The Author(s). This work is published and licensed by Dove Medical Press Limited. The
full terms of this license are available at https://www.dovepress.com/terms
and incorporate the Creative Commons Attribution
- Non Commercial (unported, 3.0) License.
By accessing the work you hereby accept the Terms. Non-commercial uses of the work are permitted
without any further permission from Dove Medical Press Limited, provided the work is properly
attributed. For permission for commercial use of this work, please see paragraphs 4.2 and 5 of our Terms.
© 2017 The Author(s). This work is published and licensed by Dove Medical Press Limited. The
full terms of this license are available at https://www.dovepress.com/terms
and incorporate the Creative Commons Attribution
- Non Commercial (unported, 3.0) License.
By accessing the work you hereby accept the Terms. Non-commercial uses of the work are permitted
without any further permission from Dove Medical Press Limited, provided the work is properly
attributed. For permission for commercial use of this work, please see paragraphs 4.2 and 5 of our Terms.