Back to Journals » Diabetes, Metabolic Syndrome and Obesity » Volume 14
Adipose Tissue Insulin Resistance is Closely Associated with Metabolic Syndrome in Northern Chinese Populations
Authors Zhang K, Pan H ![]() , Wang L, Yang H, Zhu H, Gong F
, Wang L, Yang H, Zhu H, Gong F ![]()
Received 10 November 2020
Accepted for publication 23 February 2021
Published 12 March 2021 Volume 2021:14 Pages 1117—1128
DOI https://doi.org/10.2147/DMSO.S291350
Checked for plagiarism Yes
Review by Single anonymous peer review
Peer reviewer comments 3
Editor who approved publication: Prof. Dr. Juei-Tang Cheng
Kun Zhang,1,2 Hui Pan,1 Linjie Wang,1 Hongbo Yang,1 Huijuan Zhu,1 Fengying Gong1
1Key Laboratory of Endocrinology of National Health Commission, Department of Endocrinology, Peking Union Medical College Hospital, Chinese Academy of Medical Science and Peking Union Medical College, Beijing, People’s Republic of China; 2Department of Endocrinology, Shijiazhuang People’s Hospital, The People Affiliated Hospital of Hebei Medical University, Shijiazhuang, Hebei, People’s Republic of China
Correspondence: Huijuan Zhu; Fengying Gong
Key Laboratory of Endocrinology of National Health Commission, Department of Endocrinology, Peking Union Medical College Hospital, Chinese Academy of Medical Science and Peking Union Medical College, 1# Shuai Fu Yuan Hu Tong, Dong Dan, Beijing, 100730, People’s Republic of China
Tel +86-10-69155100
Fax +86-10-69155073
Email [email protected]; [email protected]
Objective: Adipose tissue insulin resistance is a common feature of obesity-related metabolic diseases. However, the relationship between adipose tissue insulin resistance and metabolic syndrome (MS) has not been fully elucidated. Here, we explored the relationship between the adipose tissue insulin resistance index (Adipo-IR) (fasting insulin × free fatty acids) and MS and the predictive power of Adipo-IR for MS in northern Chinese populations.
Methods: A total of 312 subjects, 186 subjects with MS, 80 nonmetabolic syndrome (NMS) subjects with central obesity, and 46 normal controls were recruited. The general clinical information, biochemical measurements, and oral glucose tolerance tests were evaluated. Serum adiponectin levels were determined using enzyme linked immunosorbent assay (ELISA).
Results: Adipo-IR was 2.32-fold higher in NMS subjects and 2.62-fold higher in MS subjects than in normal controls in male subjects; in female subjects, it was 1.75-fold and 3.58-fold higher, respectively (P < 0.05). Female subjects with MS had higher Adipo-IR than male subjects (P < 0.001). Adipo-IR was independently positively correlated with waist circumference, triglyceride, aspartate aminotransferase, and fasting blood glucose and negatively correlated with adiponectin (P < 0.05). Subjects with the highest Adipo-IR tertile had a 2.758-fold higher risk of MS than subjects with the lowest tertile after adjusting for potential confounders (95% confidence interval: 1.552– 9.096; P = 0.003). Receiver operating characteristic curve analysis showed that the predictive power of Adipo-IR for MS was 73.1% and 79.2% in male and female subjects, respectively, with optimal cutoff values of 3.84 and 5.92 mU/L×mmol/L.
Conclusion: Adipo-IR provides a simple method to study adipose tissue insulin sensitivity. Adipo-IR is associated with MS and is an important predictor of MS.
Keywords: adipose tissue insulin resistance, Adipo-IR, metabolic syndrome, obesity
Introduction
Adipose tissue is one of the main target tissues for insulin action. Insulin can effectively inhibit the hydrolysis of triglyceride (TG) and release of free fatty acid (FFA) into the circulation in adipocytes.1 However, the suppressive role of insulin on lipolysis is weakened in obese individuals.2 This impaired antilipolytic effect of insulin in adipose tissue is called adipose tissue insulin resistance. Adipose tissue insulin resistance causes adipose tissue to release excessive FFA into the bloodstream, leading to increased diacylglycerol (DAG) and triacylglycerol (TAG) synthesis in muscle cells and hepatocytes, resulting in ectopic fat deposition. DAG can activate the theta isoform of protein kinase C (PKCθ) in muscle and epsilon isoform of PKC (PKCε) in the liver, inhibit insulin signaling, promote skeletal muscle and liver insulin resistance,3 resulting in systemic insulin resistance and various metabolic disorders, including hyperglycemia,4 hypertension,3 dyslipidemia,5 and non-alcoholic fatty liver (NAFLD).6–8 Therefore, adipose tissue insulin resistance is a common feature of obesity-related metabolic diseases.9
To date, several methods can be used to assess adipose tissue insulin resistance, but no consensus exists on which method should be recommended.10 The multistep pancreatic clamp technique is considered the gold standard for measuring adipose tissue insulin sensitivity in vivo.10–12 However, it is complex, expensive, and time-consuming and unsuitable for large-sample observational or epidemiological studies. In recent years, the adipose tissue insulin resistance index (Adipo-IR) has been established to assess adipose tissue insulin sensitivity. Adipo-IR is calculated by multiplying the fasting insulin (FINS) by the fasting FFA, similar to the homeostatic model assessment of insulin resistance (HOMA-IR).13,14 Adipo-IR is strongly correlated with the insulin concentration required to inhibit 50% lipolysis (IC50) measured by the multistep pancreatic clamp technique (r=0.86).11 Therefore, Adipo-IR is a simple and robust method to measure adipose tissue insulin sensitivity and has been applied to various large-scale clinical studies.4,12,15–18
Several population-based studies have separately investigated the relationship between Adipo-IR and obesity-related metabolic diseases.4,5,15,17,18 Obese people have higher Adipo-IR than normal-weight people, and central obesity is a good clinical marker to predict Adipo-IR.18 Adipo-IR progressively increases from normal glucose tolerance (NGT) to impaired glucose tolerance (IGT) to type 2 diabetes mellitus (T2DM) in both adults4 and youth15 and is associated with abnormal glucose tolerance.4,17 Additionally, Adipo-IR progressively increases as hepatic steatosis worsens in NAFLD patients.8 A study of healthy lean Japanese men showed that adipose tissue insulin resistance is associated with increased TG and decreased high-density lipoprotein cholesterol (HDL-C).5 Therefore, Adipo-IR is associated with various metabolic disorders. However, the relationship between Adipo-IR and metabolic syndrome (MS) in northern Chinese populations has not been elucidated. The predictive power and optimal cutoff values of Adipo-IR for MS are also unclear. Clarifying these important issues may help to identify people at high risk for MS early and provide direct evidence for adipose tissue insulin resistance as a new target for the treatment of MS.
The objectives of this study were (1) to investigate the changes in Adipo-IR in normal controls, nonmetabolic syndrome (NMS) subjects with central obesity, and MS subjects, (2) to explore the associations between Adipo-IR and MS, and (3) to evaluate the predictive power and optimal cutoff values of Adipo-IR for MS.
Subjects and Methods
Study Subjects and Definitions
The study cohort included 266 subjects with central obesity from the obesity clinic of our hospital and 46 normal controls from the physical examination center. There were 46 who were normal controls (normal waist circumference (WC) + no metabolic abnormality), 80 who were NMS (central obesity + 0–1 metabolic abnormality), and 186 who were MS (central obesity + ≥2 metabolic abnormalities). Obesity was defined as body mass index (BMI) ≥28 kg/m2. All the obese subjects had primary obesity. The bodyweight was stable in the past three months (±2 kg), and none of the subjects took any medication that affected lipids, blood pressure, or glucose.
Central obesity was defined as WC ≥90 cm in male subjects and ≥80 cm in female subjects. Systolic blood pressure (SBP) ≥140 mmHg and/or diastolic blood pressure (DBP) ≥90 mmHg was recognized as hypertension. Dyslipidemia was diagnosed as total cholesterol (TC) ≥5.2 mmol/L or TG ≥1.7 mmol/L or HDL- C ≤1.0 mmol/L according to the Joint Committee based on Chinese Adult guidelines for Prevention and Treatment of Dyslipidemia. Hyperglycemia was described as fasting blood glucose (FBG) ≥6.1 mmol/L and/or 2-h postprandial blood glucose (2h PBG) ≥7.8 mmol/L.19 MS was diagnosed according to the 2005 International Diabetes Federation (IDF) criteria:20 central obesity and at least two of the following metabolic abnormalities: TG ≥1.7 mmol/L (150 mg/dL); HDL-C ≤1.03 mmol/L (40 mg/dL) in male subjects or HDL-C ≤1.29 mmol/L (50 mg/dL) in female subjects; SBP ≥130 mmHg or DBP ≥85 mmHg; FBG ≥5.6 mmol/L. HOMA-IR was calculated as [FBG (mmol/L) × FINS (mU/L)]/22.5.21 The homeostasis model assessment-adiponectin (HOMA-AD) was calculated as [FBG (mmol/L) × FINS (mU/L)]/[22.5×adiponectin (μg/mL)].22 Adipo-IR was calculated as [FINS (mU/L) × FFA (mmol/L)].4
This study was approved by the Ethics Committee of Peking Union Medical College Hospital. All the subjects signed an informed consent form before participating in the trial.
Anthropometric and Blood Sample Measurements
After a 10-hour overnight fast, all the subjects had undergone physical examination, biochemical measurements, and oral glucose tolerance tests (75 g glucose). The subjects wore light clothes and no shoes for weight measurement, and the weight and height were accurate to 0.1 kg and 0.1 cm, respectively. WC was measured at the umbilicus level using an inelastic tape in the standing position. Blood pressure was measured under resting conditions. These anthropometric indices were measured three times, and the average values were recorded.
The biochemical index was measured using an automatic biochemical analyzer (Beckman Company AU5800, USA). The FINS was determined using the Siemens Centaur XP system. The serum adiponectin levels (USCNK Life Science Inc. Wuhan, China) were assayed using commercially available ELISA kits. All the samples were assayed in duplicate and random order. The intra-assay and interassay coefficients of variation were 2.4% and 4.5% for FFA, 5.8% and 8.4% for FINS, and 4.4% and 8.3% for adiponectin, respectively.
Data Analysis
Normal continuous variables were expressed as means ± standard deviation (SD), nonnormal continuous variables were expressed as medians (interquartile range, IQR), and categorical variables were expressed as frequencies (percentage). Nonnormal distributed continuous variables were logarithmically transformed. Multiple groups were compared by one-way ANOVA and Bonferroni post hoc analysis. Differences in the continuous and categorical variables were tested by Student’s t test and Pearson’s χ2, respectively. Correlations between Adipo-IR and clinical parameters were evaluated by Spearman correlation coefficient. Multiple linear regression analysis was used to explore the independent influencing factors of Adipo-IR. Binary logistic regression analysis was performed to explore the relationship between Adipo-IR and MS. Receiver operating characteristic (ROC) curve analysis was used to estimate the predictive power of Adipo-IR, HOMA-IR, and HOMA-AD for MS. Statistical analysis was performed using SPSS 22.0 (SPSS Inc., Chicago, IL, USA) and MedCalc version 16.8 (MedCalc, Mariakerke, Belgium). The significance level of the P-value was 5%.
In this study, the statistical power using the available number of participants was estimated. Our final analysis included 46 control, 80 NMS, and 186 MS subjects. The mean concentrations of Adipo-IR were 2.8, 5.5, and 7.6 mU/L×mmol/L in the control, NMS, and MS groups, respectively, with nearly equal standard deviations of 3.0 mU/L×mmol/L. The sample size provided a power larger than 99% with a two‐sided alpha level of 0.05.
Results
General Clinical Characteristics of the Study Subjects
As shown in Table 1, 2h PBG, Adipo-IR, HOMA-IR, and HOMA-AD were progressively and significantly higher from the control to NMS to MS groups in both male and female subjects (P<0.05). In both genders, MS subjects had significantly higher TG, FFA, and FBG and lower HDL-C than all other groups (P<0.05); and higher BMI, WC, DBP, alanine aminotransferase (ALT), uric acid (UA), and FINS and lower adiponectin than normal controls (P<0.05).
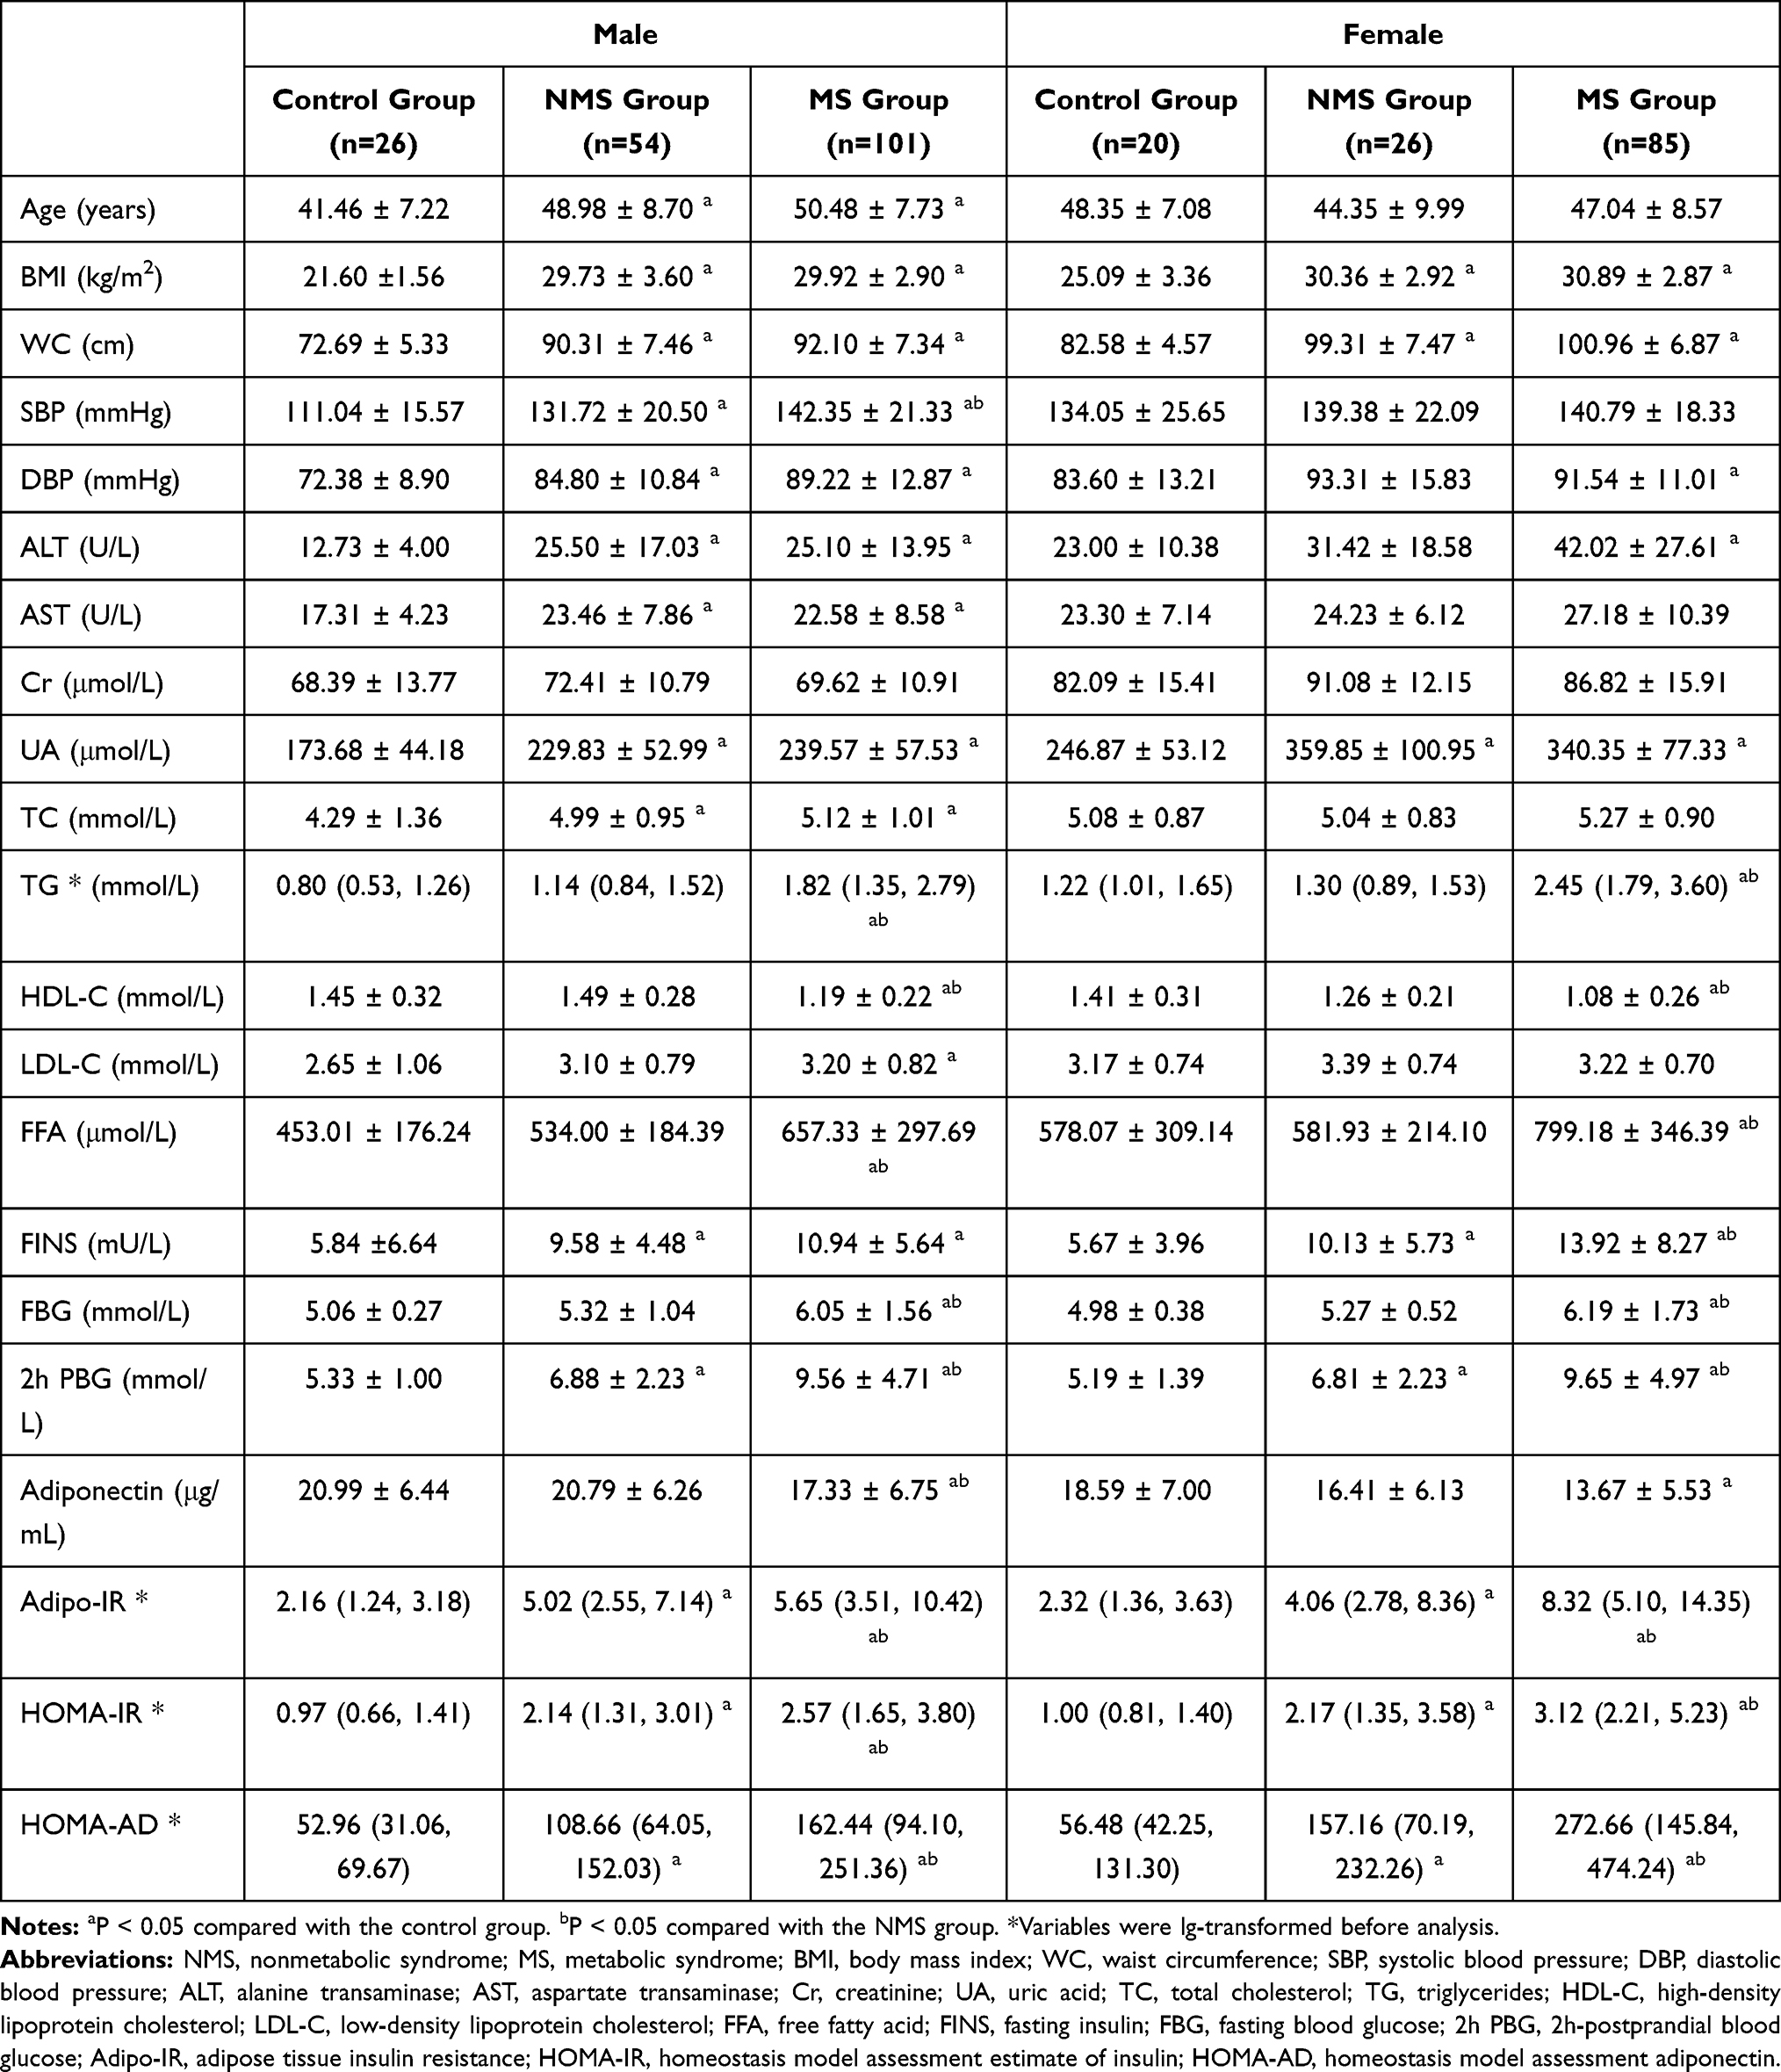 |
Table 1 Clinical Characteristics of Participants Categorized by Sex and Metabolic Syndrome |
Sex Differences in Adipo-IR, FINS, and FFA in the MS, NMS and Control Groups
The Adipo-IR of female subjects was 44.8% higher than that of male subjects (6.76 [3.48, 11.41] vs 4.67 [2.54, 8.21], P=0.001) (Figure 1A). Adipo-IR increased significantly and progressively from the control to NMS to MS groups in both male and female subjects (P<0.05) (Figure 1B). Adipo-IR was 2.32-fold higher in NMS and 2.62-fold higher in MS than in normal controls in male subjects; in female subjects, it was 1.75-fold and 3.58-fold higher, respectively (P < 0.05) (Table 1). The FINS (Figure 1C) and fasting FFA (Figure 1E) were higher in female subjects than in male subjects (P<0.05). Female subjects with MS had higher Adipo-IR (Figure 1B), FINS (Figure 1D), and FFA (Figure 1F) than their male counterparts (P<0.05). However, the sex differences in Adipo-IR, FINS, and FFA were not significant in the control and NMS groups.
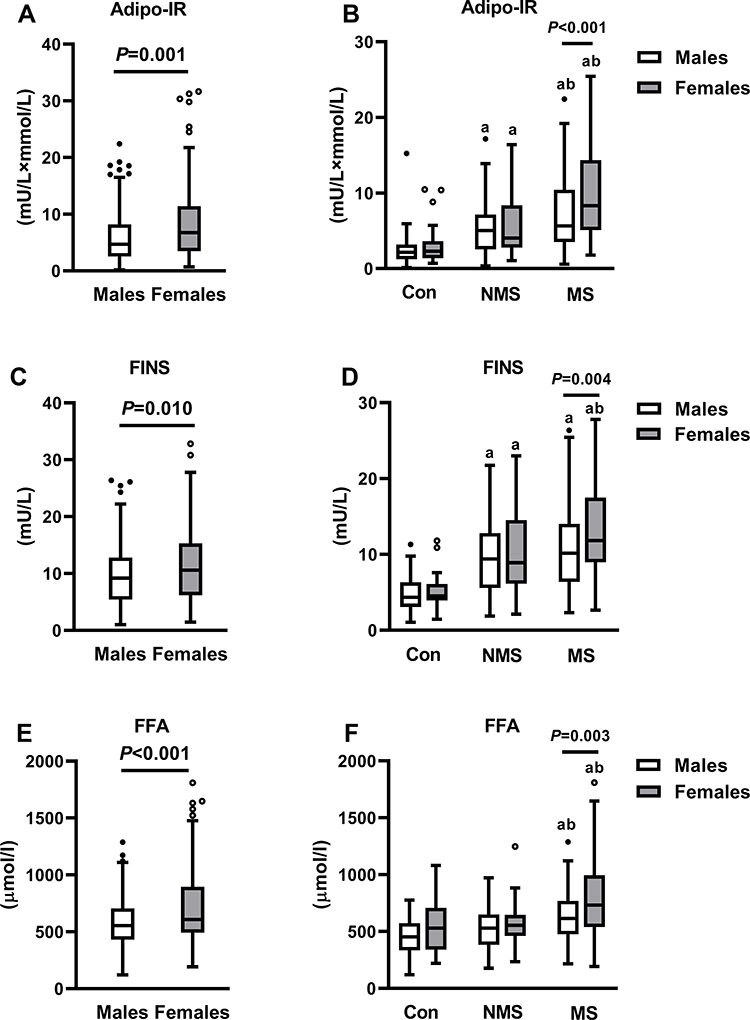 |
Figure 1 Sex differences of Adipo-IR (A and B), FINS (C and D), and FFA (E and F) in all subjects and subgroups. Adipo-IR, adipose tissue insulin resistance; FINS, fasting insulin; FFA, free fatty acids; Con, control group; NMS, nonmetabolic syndrome; MS, metabolic syndrome. aP < 0.05 compared with the control group. bP < 0.05 compared with the NMS group. |
Association of Adipo-IR with Clinical Parameters in All Subjects, Male Subjects, and Female Subjects
As shown in Table 2, Adipo-IR was positively correlated with BMI, WC, ALT, AST, UA, TG, FBG, 2h PBG, HOMA-IR, and HOMA-AD and negatively correlated with HDL-C and adiponectin in both male and female subjects (P<0.05). In multivariate regression analysis, age, sex, WC, SBP, AST, FBG, TC, TG, HDL-C, and adiponectin were independent variables and the base 10 logarithm of Adipo-IR (Lg (Adipo-IR)) was the dependent variable. After adjusting for age and sex, WC (β=0.394), TG (β=0.248), AST (β=0.123), and FBG (β=0.101) were independently positively correlated with Adipo-IR, while adiponectin (β=−0.183) was negatively correlated (Figure 2).
 |
Table 2 Correlation Between Adipo-IR and Clinical Parameters in All Subjects, Male and Female Subjects |
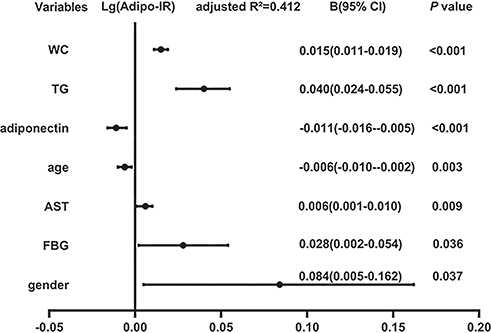 |
Figure 2 Multiple linear regression analysis of variables independently related to Adipo-IR in all subjects. Abbreviations: Adipo-IR, adipose tissue insulin resistance; B, regression coefficients; 95% CI, 95% confidence interval; WC, waist circumference; TG, triglycerides; AST, aspartate transaminase; FBG, fasting blood glucose; Lg (Adipo-IR), base 10 logarithm of Adipo-IR. |
Relationship Between Adipo-IR and MS in All Subjects
All the subjects were stratified into trisections according to Adipo-IR tertiles (lowest: ≤3.86 mU/L×mmol/L; median: 3.87–7.96 mU/L×mmol/L; highest: ≥7.96 mU/L×mmol/L). The number of MS subjects increased progressively from the lowest to median to highest Adipo-IR tertiles (37.5% vs 58.7% vs 82.7%; P<0.05) (Figure 3). Consistent with MS, more subjects had central obesity, hypertension, dyslipidemia, and hyperglycemia in the highest Adipo-IR tertile than in the lowest tertile (96.2% vs 65.4%, 68.3% vs 51.0%, 91.3% vs 64.0%, and 61.5% vs 24.0%, respectively; P<0.05).
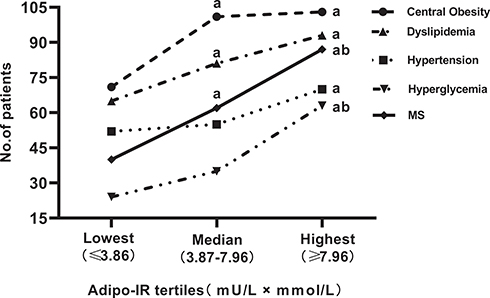 |
Figure 3 Number of subjects with different metabolic diseases in the tertiles of Adipo-IR. aP < 0.05 compared with the lowest tertile. bP < 0.05 compared with the median tertile. Abbreviations: Adipo-IR, adipose tissue insulin resistance; MS, metabolic syndrome. |
Logistic regression analysis was used to explore the association between Adipo-IR and MS. In Table 3, the MS probability in the highest Adipo-IR tertile was 6.84-fold higher than that in the lowest tertile (univariate: odds ratio (OR) = 7.840 (4.112–14.951), P<0.001). This increased MS probability in the highest tertile remained after further adjusting for age, sex, and BMI (Model 1: OR = 5.455 (2.643–11.257); P<0.001) and AST, SBP, UA, TC, and HDL-C based on Model 1 (Model 2: OR = 4.212 (1.768–10.039); P<0.001), and adiponectin based on Model 2 (Model 3: OR = 3.758 (1.552–9.096); P=0.003).
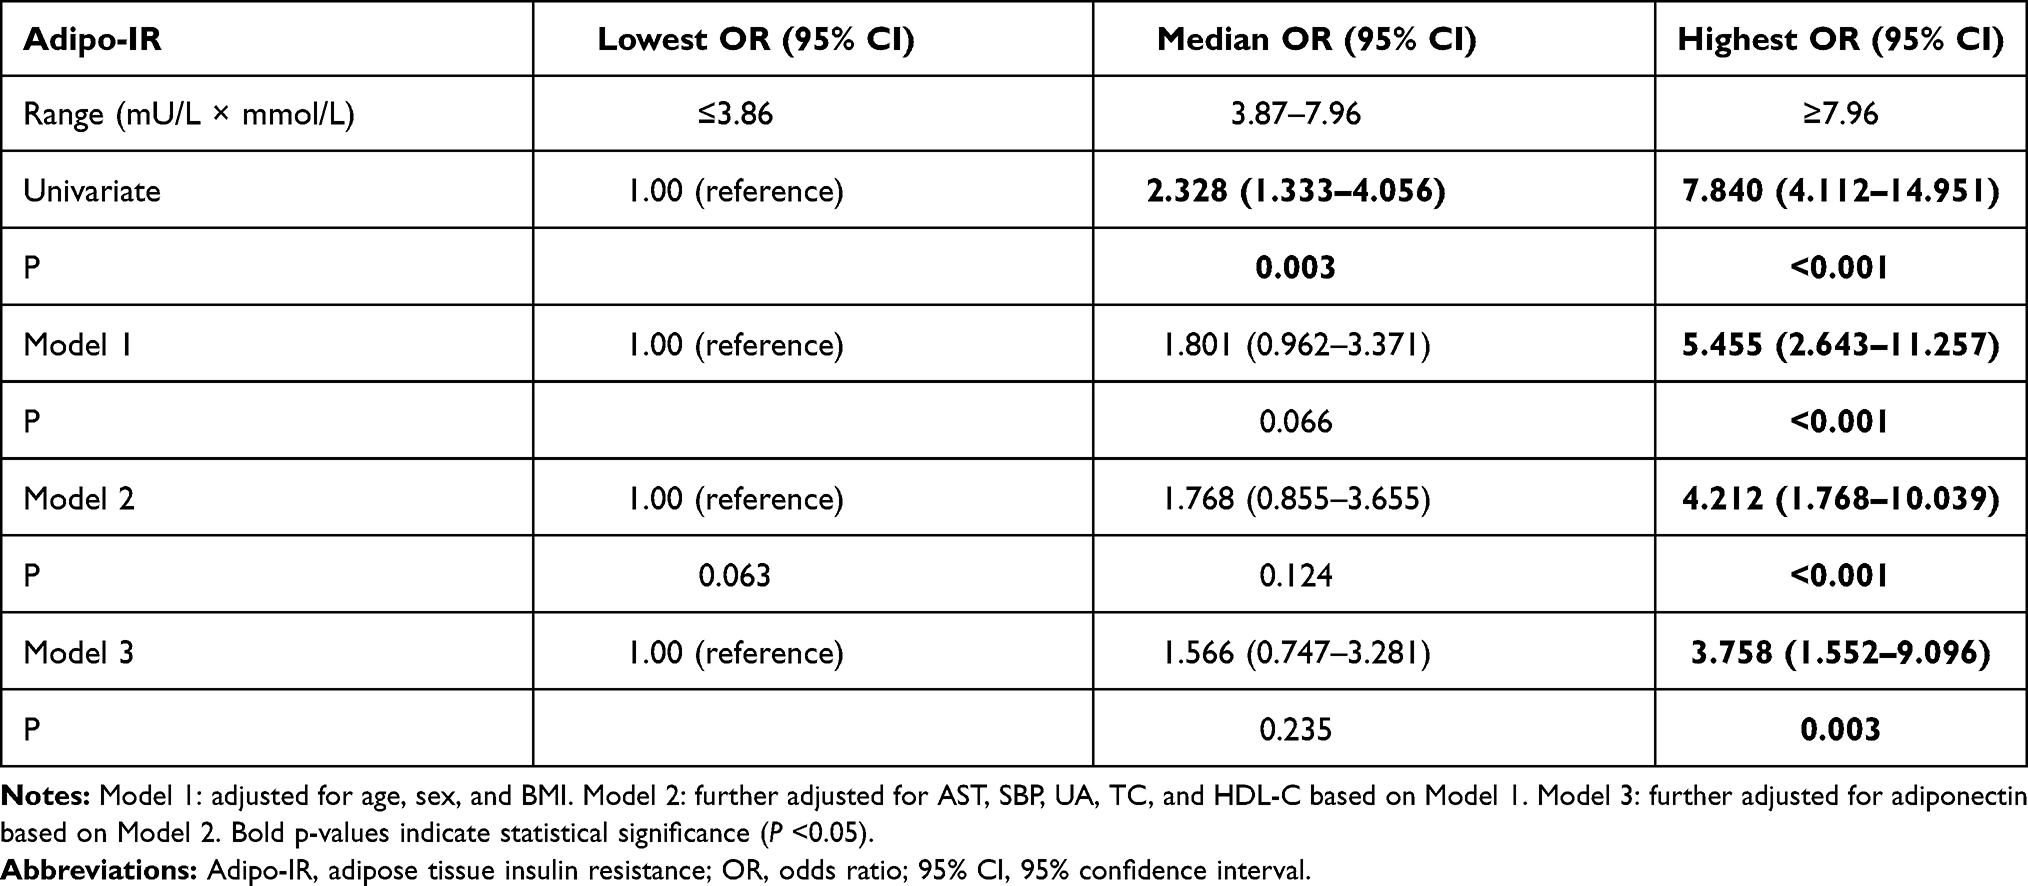 |
Table 3 Logistic Regression Analysis of the Risk of MS in the Tertiles of Adipo-IR |
Diagnostic Value of Adipo-IR for MS
ROC curve analysis was used to evaluate the diagnostic value of Adipo-IR for MS, and the area under the ROC curve (AUC) was 0.731 (95% confidence interval (CI): 0.660–0.794; P<0.001) for male subjects and 0.792 (95% CI: 0.713–0.858; P<0.001) for female subjects (Figure 4). The optimal cutoff value of Adipo-IR in male subjects was 3.84 mU/L×mmol/L with a sensitivity of 65.4% and a specificity of 76.3%; in female subjects, it was 5.92 mU/L×mmol/L with a sensitivity of 89.4% and a specificity of 63.0%. The AUCs for HOMA-IR and HOMA-AD in male subjects were 0.692 and 0.678; in female subjects, they were 0.788 and 0.794, respectively. Comparing the AUCs of Adipo-IR, HOMA-IR, and HOMA-AD using the DeLong method, they did not differ significantly, indicating that the predictive power of Adipo-IR for MS was similar to that of HOMA-IR and HOMA-AD.
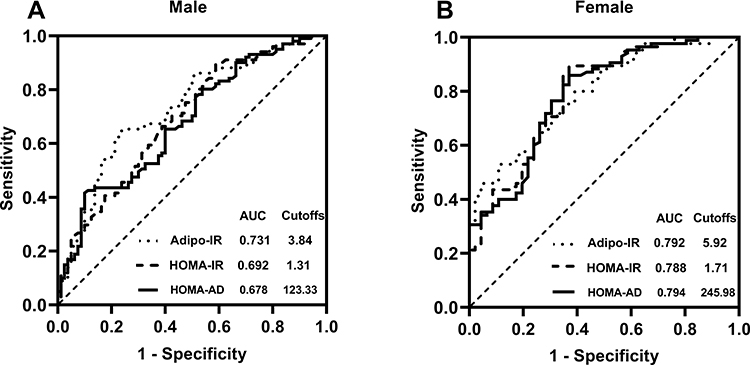 |
Figure 4 ROC curves of Adipo-IR, HOMA-IR, and HOMA-AD to distinguish between metabolic syndrome in male (A) and female (B) subjects in the study population. Abbreviations: ROC, receiver operating characteristic; AUC, area under the curve; Adipo-IR, adipose tissue insulin resistance; HOMA-IR, homeostasis model assessment estimate of insulin; HOMA-AD, homeostasis model assessment adiponectin. |
Discussion
We used Adipo-IR to assess adipose tissue insulin sensitivity and found that it was closely associated with MS, with optimal cutoff values of 3.84 mU/L×mmol/L in male subjects and 5.92 mU/L×mmol/L in female subjects. To our best knowledge, this is the first study on the relationship between Adipo-IR and MS in northern Chinese populations and first to evaluate the predictive power of Adipo-IR and optimal cutoff value. These observations justify the use of Adipo-IR to assess adipose tissue insulin sensitivity in large-scale MS observational studies, and Adipo-IR is an effective strategy for screening MS.
Insulin inhibits lipolysis and FFA release, and the plasma FFA concentration is closely related to the rate of peripheral lipolysis. Groop et al first proposed the hyperbolic relationship between insulin and FFA.2 Therefore, the Adipo-IR index reflects the resistance of adipose tissue to the antilipolytic action of insulin. Adipo-IR is elevated in obese people,12 but its changes in the development of normal weight to central obesity to MS have not been studied. We found that Adipo-IR progressively deteriorated from normal controls to NMS to MS. From the control to NMS groups, FINS increased significantly with weight gain, but the fasting FFA concentration remained unchanged. The result is consistent with a previous study, with no difference in the baseline FFA concentrations between lean and obese youth.23 The possible explanation is that adipose tissue insulin sensitivity in the NMS group decreased, and our body inhibited FFA release by increasing insulin secretion, maintaining serum FFA consistent with normal controls. However, with the progressive aggravation of metabolic abnormalities from the NMS to MS groups, even if the FINS levels in the MS group were further increased compared with those in the NMS group, it could not effectively inhibit the release of FFA into the bloodstream, leading to an increase in the fasting FFA levels, indicating that adipose tissue insulin resistance in the MS group was further aggravated and in a decompensated state. Adipo-IR was already significantly elevated before FFA elevation in the NMS group. Therefore, early intervention in the NMS population to maintain Adipo-IR within the normal range will be an effective strategy to reduce the incidence of MS.
In the present study, Adipo-IR was positively correlated with BMI and WC and independently correlated with WC. Consistent with our results, Horst et al found that Adipo-IR was significantly increased in overweight or obese subjects.12 The research by Gastaldelli et al showed that Adipo-IR was independently correlated with BMI.4 Kim et al found a significantly positive correlation between Adipo-IR and BMI and abdominal adipose tissue in youth.15 A recent study in a Chinese population showed that WC in male subjects and BMI in female subjects are the main markers of adipose tissue insulin resistance.18 WC is an indicator of the diagnosis of central obesity, which, in turn, is an essential component of the IDF criteria for the diagnosis of MS. Because of the close relationship between Adipo-IR and central obesity,18 using the IDF diagnostic criteria of MS in this study may better reveal the potential role of Adipo-IR in MS.
Two recent studies have demonstrated a positive correlation between Adipo-IR and hyperglycemia.4,15 Gastaldelli et al showed that Adipo-IR had an increasing trend from NGT to IGT to T2DM, and the Matsuda index was independently negatively correlated with Adipo-IR.4 Similar results were found in youth.15 Although the above studies have well established the role of Adipo-IR in the natural development history of T2DM, the impact of Adipo-IR on abnormal glucose metabolism in the MS population has not been elucidated. In this study, we found that Adipo-IR was positively correlated with FBG, 2h PBG, HOMA-IR, and HOMA-AD, and independently correlated with FBG. These results indicate that, in the MS population, Adipo-IR plays an important role in abnormal glucose metabolism.
Additionally, we found that Adipo-IR was positively correlated with TC and TG, and negatively correlated with HDL-C. After adjusting for age and sex, TG was an independent contributor to Adipo-IR. In line with our results, Kim et al found that Adipo-IR was positively correlated with TC, TG, LDL, and very-low-density lipoprotein, and negatively correlated with HDL-C.15 A recent study of healthy lean Japanese men showed that adipose tissue insulin resistance was closely related to the increase in TG and decrease in HDL-C.5 These findings indicate that Adipo-IR may be involved in lipid metabolism. In addition, we found that Adipo-IR was positively correlated with ALT and AST. In line with our findings, a study performed by Kelsey et al also found a positive correlation between Adipo-IR and ALT.23 However, Sugimoto et al studied in healthy Japanese men showed no association between adipose tissue insulin resistance and ALT and AST. The differences in the weight may partially explain the differences in this correlation. ALT and AST are important biomarkers of NAFLD,24 which is the liver manifestation of MS. Rosso et al showed that Adipo-IR was closely related to liver fibrosis and its degree in subjects with NAFLD.16 Adipo-IR can be improved after the treatment of NAFLD.25 Adipo-IR may participate in the ectopic deposition of fat in the liver by releasing extensive FFA.26 Therefore, Adipo-IR plays a key role in the pathogenesis and development of NAFLD. These results suggest that Adipo-IR is associated with multiple obesity-related metabolic disorders. However, metabolic diseases often coexist, and MS is a collection of various metabolic diseases. Thus, we speculated that Adipo-IR was associated with MS. As expected, in this study, the number of MS subjects increased progressively with increasing Adipo-IR tertile levels. Subjects in the highest Adipo-IR tertile had a 2.758-fold higher risk of MS than subjects in the lowest tertile. Our results provide direct evidence for elucidating the relationship between Adipo-IR and MS.
In the present study, we found that adiponectin was negatively related to Adipo-IR. Adiponectin stimulates FFA oxidation and reduces insulin resistance, resulting in a decline in FFA and insulin.27 HOMA-AD is the correction of HOMA-IR by adiponectin. Compared with HOMA-IR, HOMA-AD has a stronger correlation with insulin resistance as measured by the hyperinsulinemic-euglycemic clamp.28 However, we compared the predictive power of Adipo-IR, HOMA-IR, and HOMA-AD for MS and found that they were similar. Vilela et al also found that HOMA-IR and HOMA-AD had a similar predictive ability for MS.28 From this result, integrating adiponectin in HOMA-IR does not improve the predictive power but rather increases the cost. Therefore, it may be more reasonable to use Adipo-IR and HOMA-IR to predict MS. HOMA-IR reflects hepatic tissue and muscle tissue insulin resistance, while Adipo-IR represents adipose tissue insulin resistance, and they are usually consistent.29 However, Song et al found that they were inconsistent in some groups.30 People with elevated Adipo-IR but normal HOMA-IR have more visceral fat and higher triglycerides. MS is closely related to central obesity and hypertriglyceridemia. Therefore, it is speculated that Adipo-IR may be more sensitive to diagnose MS than HOMA-IR, but our result shows that they had a similar predictive ability for MS, and further research is needed to verify this assumption. Additionally, the diagnostic criteria for MS are complex, and an urgent need exists for more convenient clinical indices to screen for MS. Adipo-IR has the advantages of low cost and convenient measurement. Thus, it is an excellent alternative method for screening MS. The establishment of the optimal cutoff value of Adipo-IR for MS helps the early screening of MS high-risk groups in the clinic. In the future, longitudinal intervention studies of large cohorts are needed to verify the effectiveness of Adipo-IR in predicting MS.
In the present study, there was a sex difference in Adipo-IR, and the Adipo-IR of female subjects was higher than that of male subjects. This result is consistent with previous studies.4,15,18 Possible reasons for this sex difference include the following: (1) the body fat of female subjects is significantly higher than that of male subjects with similar BMI, and body fat is closely related to insulin resistance;31 (2) the insulin sensitivity of female subjects is lower than that of male subjects;32 (3) FFA released by female subjects is approximately 40% higher than that by male subjects. Thus, female subjects have higher FFA than male subjects in vivo.33 Additionally, we compared the Adipo-IR of different sexes in each subgroup. Interestingly, only in the MS group did female subjects have higher Adipo-IR than male subjects. Kim et al showed that female subjects with abnormal blood glucose had higher Adipo-IR than male subjects, whereas no sex difference was found in Adipo-IR in NGT subjects.15 Zeitler et al found that female subjects using metformin plus rosiglitazone were more effective than male subjects in controlling blood glucose.34 Therefore, more prospective studies are needed to confirm whether differences in the treatment response between sexes are associated with more severe Adipo-IR in female subjects.
Our research has some limitations. First, as a cross-sectional study, we cannot infer the causal relationship between Adipo-IR and MS. Second, we measured the total adiponectin level, but adiponectin has different multimolecular forms, among which high-molecular-weight adiponectin (HMWAD) is considered a better predictor of MS than total adiponectin.35 Therefore, we should further compare the predictive power of Adipo-IR and HOMA-HMWAD for MS. Third, our research included only a small sample size of the Chinese population. The optimal cutoff value of Adipo-IR for MS is difficult to promote to other ethnic groups.
Conclusion
In summary, Adipo-IR is significantly increased in MS subjects. Adipo-IR is closely related to MS and can be used as a good clinical indicator for screening MS. We should strive to explore intervention measures against adipose tissue insulin resistance to maintain Adipo-IR within an appropriate range and reduce the incidence of MS.
Human and Animal Rights
All procedures performed in studies involving human participants were in accordance with the ethical standards of the institutional research committee and with the 1964 Helsinki Declaration and its later amendments or comparable ethical standards.
Abbreviations
MS, metabolic syndrome; NMS, nonmetabolic syndrome; DAG, diacylglycerol; TAG, triacylglycerol; PKC, protein kinase C; NAFLD, non-alcoholic fatty liver; NGT, normal glucose tolerance; IGT, impaired glucose tolerance; T2DM, type 2 diabetes mellitus; IDF, International Diabetes Federation; BMI, body mass index; WC, waist circumference; SBP, systolic blood pressure; DBP, diastolic blood pressure; ALT, alanine transaminase; AST, aspartate transaminase; Cr, creatinine; UA, uric acid; TC, total cholesterol; TG, triglycerides; HDL-C, high-density lipoprotein cholesterol; LDL-C, low-density lipoprotein cholesterol; FFA, free fatty acid; FINS, fasting insulin; FBG, fasting blood glucose; 2h PBG, 2h-postprandial blood glucose; Adipo-IR, adipose tissue insulin resistance; HOMA-IR, homeostasis model assessment estimate of insulin; HOMA-AD, homeostasis model assessment adiponectin; IQR, interquartile range; SD, standard deviation; ROC, receiver operating characteristic; AUC, area under the curve; OR, odds ratio; HMWAD, high-molecular-weight adiponectin.
Data Sharing Statement
The datasets generated for the present study are available on request to the corresponding author Huijuan Zhu and Fengying Gong.
Ethical Approval
This study was approved by the Ethics Committee of Peking Union Medica College Hospital.
Informed Consent
Each subject gave written informed consent before participating.
Acknowledgments
We would like to thank all the subjects, doctors, nurses, and technicians who participated in the study.
Author Contributions
All authors made a significant contribution to the work reported, whether that is in the conception, study design, execution, acquisition of data, analysis and interpretation, or in all these areas; took part in drafting, revising or critically reviewing the article; gave final approval of the version to be published; have agreed on the journal to which the article has been submitted; and agree to be accountable for all aspects of the work.
Funding
The study was supported by grants from the Beijing Natural Science Foundation (Grant Nos. 7182130), the National Natural Science Foundation of China (Grant Nos. 81370898 and 81471024), the Chinese Academy of Medical Science Innovation Fund for Medical Science (Grant Nos. 2016-I2M-1-002 and 2017-I2M-1-011), and the National Key Program of Clinical Science (Grant Nos. WBYZ2011-873).
Disclosure
The authors declared no conflicts of interest.
References
1. Saponaro C, Gaggini M, Carli F, Gastaldelli A. The subtle balance between lipolysis and lipogenesis: a critical point in metabolic homeostasis. Nutrients. 2015;7(11):9453–9474. doi:10.3390/nu7115475
2. Groop LC, Bonadonna RC, DelPrato S, et al. Glucose and free fatty acid metabolism in non-insulin-dependent diabetes mellitus. Evidence for multiple sites of insulin resistance. J Clin Invest. 1989;84(1):205–213. doi:10.1172/JCI114142
3. Shulman GI. Ectopic fat in insulin resistance, dyslipidemia, and cardiometabolic disease. N Engl J Med. 2014;371(12):1131–1141. doi:10.1056/NEJMra1011035
4. Gastaldelli A, Gaggini M, DeFronzo RA. Role of adipose tissue insulin resistance in the natural history of type 2 diabetes: results from the san antonio metabolism study. Diabetes. 2017;66(4):815–822. doi:10.2337/db16-1167
5. Sugimoto D, Tamura Y, Takeno K, et al. Clinical features of nonobese, apparently healthy, japanese men with reduced adipose tissue insulin sensitivity. J Clin Endocrinol Metab. 2019;104(6):2325–2333. doi:10.1210/jc.2018-02190
6. Lomonaco R, Ortiz-Lopez C, Orsak B, et al. Effect of adipose tissue insulin resistance on metabolic parameters and liver histology in obese patients with nonalcoholic fatty liver disease. Hepatology. 2012;55(5):1389–1397. doi:10.1002/hep.25539
7. Armstrong MJ, Hazlehurst JM, Hull D, et al. Abdominal subcutaneous adipose tissue insulin resistance and lipolysis in patients with non-alcoholic steatohepatitis. Diabetes Obes Metab. 2014;16(7):651–660. doi:10.1111/dom.12272
8. Lomonaco R, Bril F, Portillo-Sanchez P, et al. Metabolic impact of nonalcoholic steatohepatitis in obese patients with type 2 diabetes. Diabetes Care. 2016;39(4):632–638. doi:10.2337/dc15-1876
9. Jensen MD, Haymond MW, Rizza RA, Cryer PE, Miles JM. Influence of body fat distribution on free fatty acid metabolism in obesity. J Clin Invest. 1989;83(4):1168–1173. doi:10.1172/JCI113997
10. Sondergaard E, Jensen MD. Quantification of adipose tissue insulin sensitivity. J Investig Med. 2016;64(5):989–991. doi:10.1136/jim-2016-000098
11. Sondergaard E, Espinosa De Ycaza AE, Morgan-Bathke M, Jensen MD. How to Measure Adipose Tissue Insulin Sensitivity. J Clin Endocrinol Metab. 2017;102(4):1193–1199. doi:10.1210/jc.2017-00047
12. Ter Horst KW, van Galen KA, Gilijamse PW, et al. Methods for quantifying adipose tissue insulin resistance in overweight/obese humans. Int J Obes. 2017;41(8):1288–1294. doi:10.1038/ijo.2017.110
13. Gastaldelli A, Harrison SA, Belfort-Aguilar R, et al. Importance of changes in adipose tissue insulin resistance to histological response during thiazolidinedione treatment of patients with nonalcoholic steatohepatitis. Hepatology. 2009;50(4):1087–1093. doi:10.1002/hep.23116
14. Matthews DR, Hosker JP, Rudenski AS, Naylor BA, Treacher DF, Turner RC. Homeostasis model assessment: insulin resistance and beta-cell function from fasting plasma glucose and insulin concentrations in man. Diabetologia. 1985;28(7):412–419. doi:10.1007/BF00280883
15. Kim JY, Bacha F, Tfayli H, Michaliszyn SF, Yousuf S, Arslanian S. Adipose tissue insulin resistance in youth on the spectrum from normal weight to obese and from normal glucose tolerance to impaired glucose tolerance to type 2 diabetes. Diabetes Care. 2019;42(2):265–272. doi:10.2337/dc18-1178
16. Rosso C, Kazankov K, Younes R, et al. Crosstalk between adipose tissue insulin resistance and liver macrophages in non-alcoholic fatty liver disease. J Hepatol. 2019;71(5):1012–1021. doi:10.1016/j.jhep.2019.06.031
17. Wen J, Cai X, Zhang J, et al. Relation of adipose tissue insulin resistance to prediabetes. Endocrine. 2020;68(1):93–102. doi:10.1007/s12020-020-02186-8
18. Jiang J, Cai X, Pan Y, et al. Relationship of obesity to adipose tissue insulin resistance. BMJ Open Diabetes Res Care. 2020;8(1):1. doi:10.1136/bmjdrc-2019-000741
19. American Diabetes Association. Classification and diagnosis of diabetes: standards of medical care in diabetes-2018. Diabetes Care. 2018;41(Suppl 1):S13–s27. doi:10.2337/dc18-S002
20. Alberti KG, Zimmet P, Shaw J. The metabolic syndrome–a new worldwide definition. Lancet. 2005;366(9491):1059–1062. doi:10.1016/S0140-6736(05)67402-8
21. Vatier C, Fellahi S, Karelis AD, et al. Comparison of simple indices for measuring insulin resistance that integrates adipokines in non-diabetic obese postmenopausal women before and after weight loss: a MONET study. Diabetes Metab. 2018;44(2):190–191. doi:10.1016/j.diabet.2017.04.006
22. Hung AM, Sundell MB, Egbert P, et al. A comparison of novel and commonly-used indices of insulin sensitivity in African American chronic hemodialysis patients. Clin J Am Soc Nephrol. 2011;6(4):767–774. doi:10.2215/CJN.08070910
23. Kelsey MM, Forster JE, Van Pelt RE, Reusch JE, Nadeau KJ. Adipose tissue insulin resistance in adolescents with and without type 2 diabetes. Pediatr Obes. 2014;9(5):373–380. doi:10.1111/j.2047-6310.2013.00189.x
24. Uchil D, Pipalia D, Chawla M, et al. Non-alcoholic fatty liver disease (NAFLD)–the hepatic component of metabolic syndrome. J Assoc Physicians India. 2009;57:201–204.
25. Bell LN, Wang J, Muralidharan S, et al. Relationship between adipose tissue insulin resistance and liver histology in nonalcoholic steatohepatitis: a pioglitazone versus vitamin E versus placebo for the treatment of nondiabetic patients with nonalcoholic steatohepatitis trial follow-up study. Hepatology. 2012;56(4):1311–1318. doi:10.1002/hep.25805
26. Capurso C, Capurso A. From excess adiposity to insulin resistance: the role of free fatty acids. Vascul Pharmacol. 2012;57(2–4):91–97. doi:10.1016/j.vph.2012.05.003
27. Ouchi N, Parker JL, Lugus JJ, Walsh K. Adipokines in inflammation and metabolic disease. Nat Rev Immunol. 2011;11(2):85–97. doi:10.1038/nri2921
28. Vilela BS, Vasques AC, Cassani RS, et al. The HOMA-Adiponectin (HOMA-AD) closely mirrors the HOMA-IR index in the screening of insulin resistance in the brazilian metabolic syndrome study (BRAMS). PLoS One. 2016;11(8):e0158751. doi:10.1371/journal.pone.0158751
29. Adams-Huet B, Devaraj S, Siegel D, Jialal I. Increased adipose tissue insulin resistance in metabolic syndrome: relationship to circulating adipokines. Metab Syndr Relat Disord. 2014;12(10):503–507. doi:10.1089/met.2014.0092
30. Song Y, Sondergaard E, Jensen MD. Unique metabolic features of adults discordant for indices of insulin resistance. J Clin Endocrinol Metab. 2020;105(8):8. doi:10.1210/clinem/dgaa265
31. Zhu HJ, Pan H, Cui Y, et al. The changes of serum glypican4 in obese patients with different glucose metabolism status. J Clin Endocrinol Metab. 2014;99(12):E2697. doi:10.1210/jc.2014-2018
32. Moran A, Jacobs DR
33. Nielsen S, Guo Z, Albu JB, Klein S, O’Brien PC, Jensen MD. Energy expenditure, sex, and endogenous fuel availability in humans. J Clin Invest. 2003;111(7):981–988. doi:10.1172/JCI16253
34. Phil Z, Kathryn H, Laura P, Barbara L, Kenneth C. A clinical trial to maintain glycemic control in youth with type 2 diabetes. N Engl J Med. 2012;366:2247–2256.
35. Hara K, Horikoshi M, Yamauchi T, et al. Measurement of the high-molecular weight form of adiponectin in plasma is useful for the prediction of insulin resistance and metabolic syndrome. Diabetes Care. 2006;29(6):1357–1362. doi:10.2337/dc05-1801
 © 2021 The Author(s). This work is published and licensed by Dove Medical Press Limited. The
full terms of this license are available at https://www.dovepress.com/terms
and incorporate the Creative Commons Attribution
- Non Commercial (unported, 3.0) License.
By accessing the work you hereby accept the Terms. Non-commercial uses of the work are permitted
without any further permission from Dove Medical Press Limited, provided the work is properly
attributed. For permission for commercial use of this work, please see paragraphs 4.2 and 5 of our Terms.
© 2021 The Author(s). This work is published and licensed by Dove Medical Press Limited. The
full terms of this license are available at https://www.dovepress.com/terms
and incorporate the Creative Commons Attribution
- Non Commercial (unported, 3.0) License.
By accessing the work you hereby accept the Terms. Non-commercial uses of the work are permitted
without any further permission from Dove Medical Press Limited, provided the work is properly
attributed. For permission for commercial use of this work, please see paragraphs 4.2 and 5 of our Terms.