Back to Journals » Diabetes, Metabolic Syndrome and Obesity » Volume 15
Adipose Dysfunction in Adulthood Insulin Resistance of Low-Birth Weight Mice: A Proteomics Study
Authors Wang J ![]() , Yang L
, Yang L ![]() , Yang L, Zhou F
, Yang L, Zhou F ![]() , Zhao H, Liu J, Ma H, Song G
, Zhao H, Liu J, Ma H, Song G
Received 10 December 2021
Accepted for publication 1 March 2022
Published 16 March 2022 Volume 2022:15 Pages 849—862
DOI https://doi.org/10.2147/DMSO.S353095
Checked for plagiarism Yes
Review by Single anonymous peer review
Peer reviewer comments 2
Editor who approved publication: Professor Ming-Hui Zou
Jun Wang,1– 3 Linlin Yang,4 Linquan Yang,4 Fei Zhou,1 Hang Zhao,2 Jing Liu,2 Huijuan Ma,1,2,4,* Guangyao Song1,2,*
1Department of Internal Medicine, Hebei Medical University, Shijiazhuang, Hebei, People’s Republic of China; 2Department of Endocrinology and Metabolic Diseases, Hebei General Hospital, Shijiazhuang, Hebei, People’s Republic of China; 3Department of Emergency, Baoding First Central Hospital, Baoding, Hebei, People’s Republic of China; 4Hebei Key Laboratory of Metabolic Diseases, Hebei General Hospital, Shijiazhuang, Hebei, People’s Republic of China
*These authors contributed equally to this work
Correspondence: Huijuan Ma, Hebei Key Laboratory of Metabolic Diseases, Hebei General Hospital, 348 Heping West Road, Shijiazhuang, 050051, Hebei, People’s Republic of China, Email [email protected] Guangyao Song, Department of Endocrinology and Metabolic Diseases, Hebei General Hospital, 348 Heping West Road, Shijiazhuang, 050051, Hebei, People’s Republic of China, Email [email protected]
Purpose: To investigate changes in the protein expression profile of white adipose tissue in low-birth weight (LBW) mice with high-fat diets using tandem mass tag (TMT) and liquid chromatography-mass spectrometry (LC-MS/MS) and parallel reaction monitoring (PRM).
Methods: Institute of Cancer Research (ICR) mice were used to establish an LBW model using malnutrition during pregnancy. Male pups were randomly selected from LBW and normal-birth weight (NBW) offspring, then all given a high-fat diet. Blood glucose, serum insulin, total cholesterol (TC) and triglyceride (TG) levels were measured. The weight ratio of liver, muscle, and adiposity index were calculated. Hematoxylin and eosin staining was used to visualize adipose tissue morphology. Oil red O staining of liver and TG content of muscle were used to determine ectopic lipid deposition. TMT combined with LC-MS/MS was used to analyze protein expression in white adipose tissue. PRM and Western blot were used to verify the expression of CD36, SCD1, PCK1 and PPARγ.
Results: Compared with NBW mice, fasting blood glucose, insulin and HOMA-IR significantly increased in LBW mice, indicating insulin resistance and impaired glucose regulation; TC, TG, adipocyte size, and adiposity index were increased in LBW mice, suggesting obesity and disorder of lipid metabolism. We observed ectopic lipid deposition in liver and muscle. There were 996 differentially expressed proteins (DEPs) in the LBW/NBW groups. Peroxisome proliferator-activated receptor (PPAR) was a relatively important signaling pathway regulating metabolic process in functional enrichment analysis of DEPs. Up-regulated expression of CD36, SCD1, and PCK1 in the adipose tissue of LBW mice was observed through PPAR pathways cluster analysis. And PRM and Western blot assay validated the proteomics findings.
Conclusion: When exposed to high-fat diets, LBW mice exhibited insulin resistance and disorder of lipid metabolism compared with NBW mice. The expression of PPARγ was elevated, as well as upstream CD36, downstream SCD1 and PCK1 of the PPARγ in the adipose tissue of LBW mice. It was suggested that the activation in CD36/PPARγ/SCD1 and CD36/PPARγ/PCK1 pathways may induce adipose dysfunction, thereby increasing susceptibility to insulin resistance.
Keywords: low birth weight, adipose tissue, insulin resistance, lipid metabolism
Introduction
Low birth weight (LBW) is an indicator of malnutrition and growth restriction in utero,1 with maternal diet restriction and an abnormal intrauterine growth environment causing fetal metabolic pressure. In recent years, many prospective studies have confirmed that LBW is closely related to metabolic diseases such as adult insulin resistance and obesity.2–4 Our research group previously proposed that birth weight is negatively correlated with type 2 diabetes mellitus (T2DM) using meta-analysis.5 Animal models show that LBW is associated with insulin resistance and adiposity.6–8 There are epigenetic speculations such as fetal insulin and the thrifty phenotype hypothesis for LBW inducing an imbalance in glucose and lipid homeostasis in adulthood,9,10 but the specific molecular mechanism remains ambiguous. This limits the control and prevention of susceptibility to insulin resistance in LBW populations.
Adipose tissue is an endocrine organ responsible for dynamic energy storage, and dysfunctional adipose tissue plays a key role in the development of insulin resistance.11 Excessive energy intake leads to adipocyte hyperplasia and hypertrophy,12 and the increased release of free fatty acids. Ectopic lipid deposition in non-adipose tissues increases lipotoxicity, thus interfering with insulin signaling pathways and glucose homeostasis, and promoting insulin resistance.13 Nakano et al proposed the overloaded adipocyte hypothesis in LBW infants,14 while Wu et al suggested the role of adipose tissue dysfunction as an underlying mechanism of the relationship between LBW and glucose metabolism disorders in children aged 6–18 years.15 The role and potential molecular mechanism of adipose tissue in the process of insulin resistance and T2DM associated with LBW needs to be further explored. Moreover, few studies have applied proteomics to study the relationship between low birth weight and insulin resistance. Proteomics analysis can profile all the proteins in adipose tissue, so an investigation with proteomics analysis would help to unravel this enigma.
In this study, LBW mice were subjected to high-fat overfeeding to simulate the dietary pattern among modern human populations, and protein changes in epididymal adipose tissue were observed using tandem mass tag (TMT)-labeled proteomics analysis. Bioinformatics analysis and parallel reaction monitoring (PRM) verification were used to explore the possible mechanism underlying how LBW might affect insulin resistance in adulthood, providing evidence for the prevention and treatment of T2DM in LBW populations.
Materials and Methods
Animals and Experimental Groups
Specific-pathogen-free Institute of Cancer Research (ICR) mice aged 6–8 weeks (20 females and 10 males) without mating history were selected for this experiment. After one week of adaptive feeding, the female and male ICR mice were caged at a ratio of 2:1.The vaginal plug was recorded as the 0.5th day of pregnancy. The pregnancy malnutrition method was adopted to establish the LBW model. Pregnant females were randomly assigned to either a control or undernutrition group. Control dams received normal food intake. Dams in the undernutrition group were fed at 50% food-restriction levels (refer to normal food intake in controls) from days 12.5 to 18.5. All newborn mice were weighed within 24 hours of delivery. At birth, litter numbers were equalized to eight. During suckling, dams were randomly assigned to ad libitum chow.
Nine male pups were randomly selected from the LBW and normal-birth weight (NBW) offspring. They were labeled as LBW or NBW. After the breastfeeding period (age 3 weeks), they were given a high-fat diet (total calories 2193.4 kJ/100 g). Calorie composition of the diet was 60% fat, 20% carbohydrate, and 20% protein. The weight and food intake of offspring mice was measured every week to the nearest 0.1 g.
Intraperitoneal Glucose Tolerance Test (IPGTT)
The IPGTT was performed on the eleventh week of the high-fat intervention (age 14 weeks). After fasting for 12 h, fasting blood glucose (baseline blood glucose) was measured using tail vein blood samples, followed by intraperitoneal injection of 50% glucose 2 g/kg. Tail vein blood was then drawn again to measure blood glucose at 15, 30, 60, and 120 minutes after glucose injection using a blood glucose meter (Roche Diagnostics GmbH, Mannheim, Baden-Wurttemberg, Germany).
Specimen Collection
The mice fed high-fat diets for 17 weeks (age 20 weeks) were weighed after fasting 12 h before anesthesia with 1% pentobarbital (60 mg/kg). Blood was collected and centrifuged at 4°C at 3000 rpm for 15 min in a refrigerated high-speed centrifuge (Thermo Fisher Scientific, Waltham, Massachusetts, USA) and the serum collected. Serum was stored in a −80°C freezer (Qingdao Haier Biomedical Co Ltd, Qingdao, China) for later use. After blood sampling, the liver, skeletal muscle were removed by laparotomy, weighed for weight ratio (g/100g of body weight). And epididymal and perirenal fat tissues were dissected away and weighed for adiposity index determination (g/100g of body weight). Then these tissues snap frozen in liquid nitrogen and stored at −80°C.
Measurement of Fasting Blood Glucose, Insulin
Serum fasting Insulin levels were measured using ELISA (Alpco, Salem, USA). Fasting blood glucose levels were measured using a blood glucose meter. After that, a Homoeostasis Model Assessment for Insulin Resistance (HOMA-IR) was calculated according to the following formula: Blood Glucose (mmol/L) × (Serum Insulin (mlU/L)/22.5.
Measurement of Serum TC and TG
Serum total cholesterol (TC) and triglyceride (TG) assay kits were purchased from Nanjing Jiancheng Bioengineering Institute (Nanjing, China). The experimental procedures were performed according to the manufacturer’s instructions.
Hematoxylin and Eosin (HE) Staining of Adipose Tissue
Adipose tissues were fixed with 4% neutral formaldehyde (Biosharp, China), then the paraffin-embedded tissues were sliced into sections. Sections were stained using HE (Servicebio, Wuhan, China) then observed and photographed using light microscopy.
Oil Red O Staining of Liver Tissue
Oil Red O reagent (Servicebio) was used to stain frozen liver slices to examine lipid accumulation within hepatocytes. Stained sections were observed and photographed using light microscopy.
Measurement of TG Content in Muscle
50mg skeletal muscle tissue was weighed and put into a pre-cooled EP tube, 9 times the volume of anhydrous ethanol was added according to the ratio of weight (g): volume (mL)= 1:9. The mixture were ground in a frozen grinder, centrifuged at 2500 rpm for 10 minutes at room temperature, and the supernatant was taken to test the TG content using a triglyceride enzymatic assay kit (Nanjing Jiancheng Bioengineering Institute).
Sample Preparation
Epididymal adipose tissue samples were powdered and dissolved in lysis buffer (8 M urea, 2 mM ethylenediamine tetraacetic acid and 1% protease inhibitor cocktail [Sigma, St. Louis, USA]), followed by sonication using a high-intensity ultrasonic processor (Scientz, Ningbo, China). The remaining debris was removed by centrifugation at 4°C. Supernatants were collected to determine protein concentration. For digestion, the protein solution was reduced with 5 mM dithiothreitol (Sigma, St. Louis, USA) for 30 min at 56 °C and alkylated with 11 mM iodoacetamide (Sigma, St. Louis, USA) for 15 min at room temperature in darkness. The protein sample was then diluted by adding 100 mM triethylammonium bicarbonate (TEAB; Sigma, St. Louis, USA) to a urea concentration <2 M. Trypsin (Promega, Madison, Wisconsin, USA) was added at 1:50 trypsin:protein mass ratio for the first digestion overnight and 1:100 trypsin:protein mass ratio for a second 4-h digestion. After trypsin digestion, peptides were desalted using a Strata X C18 SPE column (Phenomenex, Torrance, California, USA) and vacuum-dried. Peptide samples were reconstituted in 0.5 M TEAB and processed according to the manufacturer’s protocol for the TMT kit/iTRAQ kit (Thermo Fisher Scientific).
LC-MS/MS Analysis
The tryptic peptides were dissolved in 0.1% formic acid (Fluka, St. Louis, USA; solvent A) then separated using the EASY-nLC 1000 UPLC system (Thermo Fisher Scientific). Peptides were subjected to the ion source followed by tandem mass spectrometry (MS/MS) using Orbitrap Fusion™ (Thermo Fisher Scientific). Peptide precursor ions and their secondary fragments were detected and analyzed using high-resolution Orbitrap. A data-dependent procedure was used for data collection. The quantitative method was set to TMT-6plex, and the false discovery rate for protein and peptide-spectrum match identification was adjusted to <1%.
Bioinformatics Methods
Gene Ontology (GO) is a major bioinformatics initiative to unify the representation of gene and gene product attributes across all species. The UniProt-GOA database (http://www.ebi.ac.uk/GOA/) and InterProScan software (http://www.ebi.ac.uk/interpro/) were used to provide protein annotation and classification. Kyoto Encyclopedia of Genes and Genomes (KEGG) (http://www.kegg.jp/) integrated the network information of differentially expressed protein (DEP) interactions for pathway enrichment analysis. The InterPro database was used to analyze the enrichment of the functional domains of the DEPs.
PRM Verification
In this experiment, PRM was used to verify DEPs. The peptides were dissolved in the mobile phase A of LC then separated using the EASY-nLC 1000 ultra-high performance liquid system. Mobile phase A was an aqueous solution containing 0.1% formic acid and 2% acetonitrile (Thermo Fisher Scientific); and mobile phase B contained 0.1% formic acid and 90% acetonitrile. The liquid gradient setting of phase B was as follows: 0~40 min, 7–25% B; 40~52 min, 25–35% B; 52~56 min, 35–80% B; 56~60 min, 80% B, all at a constant flow rate of 350 nL/min.
Western Blot Validation
Because of the lack of LC-MS/MS data about peroxisome proliferator-activated receptor gamma (PPARγ), Western blot analyses were performed to confirm its presence. Adipose tissue samples from both the LBW and NBW groups were lysed in lysis buffer (Solarbio, Beijing, China) containing protease inhibitors (Solarbio), and protein concentrations were determined using the Pierce™ BCA Protein Assay Kit (Thermo Fisher Scientific). Protein samples were then resolved using sodium dodecyl sulphate–polyacrylamide gel electrophoresis and transferred onto polyvinylidene difluoride membranes using electrophoresis. Membranes were blocked with 5% non-fat dried milk (Solarbio) then incubated with the appropriate primary and secondary antibodies. The band was detected using enhanced chemiluminescent reagents (Zen BioScience Co, Ltd., Chengdu, China) under a gel imager. The following antibodies were used: glyceraldehyde-3-phosphate dehydrogenase (GAPDH; rabbit antibody; 1:20,000 dilution; Proteintech, Wuhan, China); PPARγ (rabbit antibody; 1:1000 dilution; Cell Signaling Technology, Boston, USA); and horseradish-peroxidase-labeled goat anti-rabbit immunoglobulin G (1: 10,000 dilution; Abbkine, Wuhan, China). GAPDH was used as the loading control.
Statistical Analysis
All statistical analyses were performed using SPSS 22.0 software (IBM Corp., Armonk, NY, USA). Data were expressed as mean ± standard deviation. When the data satisfied normal distribution and the variances were consistent, between-group comparisons were conducted by t-test. p<0.05 was defined as statistically significant.
Results
Establishment of the LBW Mouse Model in Offspring
The LBW mouse model was established by 50% food restriction in ICR mice during pregnancy days 12.5–18.5. The birth weights of the offspring mice in the LBW group (1.10 ± 0.17 g) were significantly lower than those of the offspring mice in the NBW group (1.66 ± 0.16 g), indicating successful establishment of the LBW model (Figure 1A).
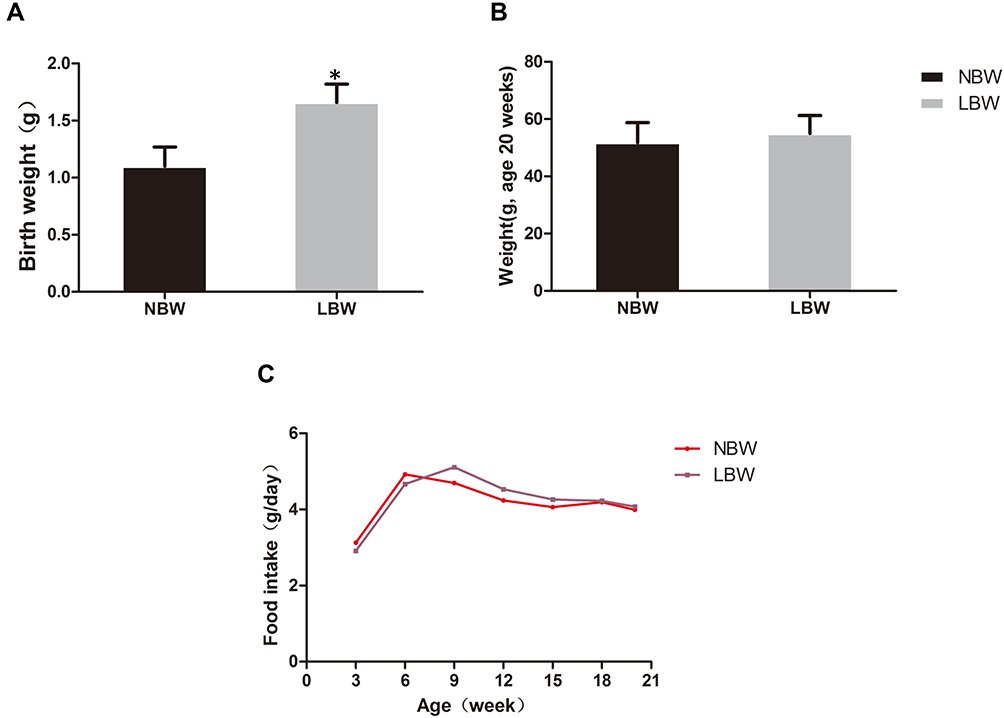 |
Figure 1 (A) Birth weight, (B) body weight (age 20 weeks), (C) food intake of mice in each group. Data were presented as the mean ± standard deviation; *p<0.05 vs NBW (Student’s t test). Abbreviations: NBW, normal birth weight; LBW, low birth weight. |
LBW Mouse Model Develop Insulin Resistance and Impaired Glucose Regulation
At 20 weeks, there was no significant difference in body weight between NBW and LBW mice (Figure 1B). Food intake was not significantly different between the two groups (Figure 1C). In the IPGTT performed at 14 weeks, fasting blood glucose in the LBW group increased significantly compared with the NBW group, and blood glucose increased at 1 h and 2 h after glucose injection (Figure 2A). At the end of 20 weeks, the serum levels of fasting glucose and insulin in LBW group were higher than those in the NBW group (Figure 2B and C). Thereafter, the values of HOMA-IR were calculated. The results showed that the values of HOMA-IR in the LBW group were significantly higher than those in the NBW group (Figure 2D). Elevation of serum TC in the LBW group was more pronounced (Figure 2E), while TG showed a rising trend (Figure 2F). The weight ratio of liver and skeletal muscle in the LBW group was not increased significantly, while adiposity index was increased markedly, suggesting obesity and disorder of lipid metabolism (Figure 3). All these results indicated that LBW mice fed with high-fat diet exhibited severely insulin resistance and impaired glucose regulation in adulthood.
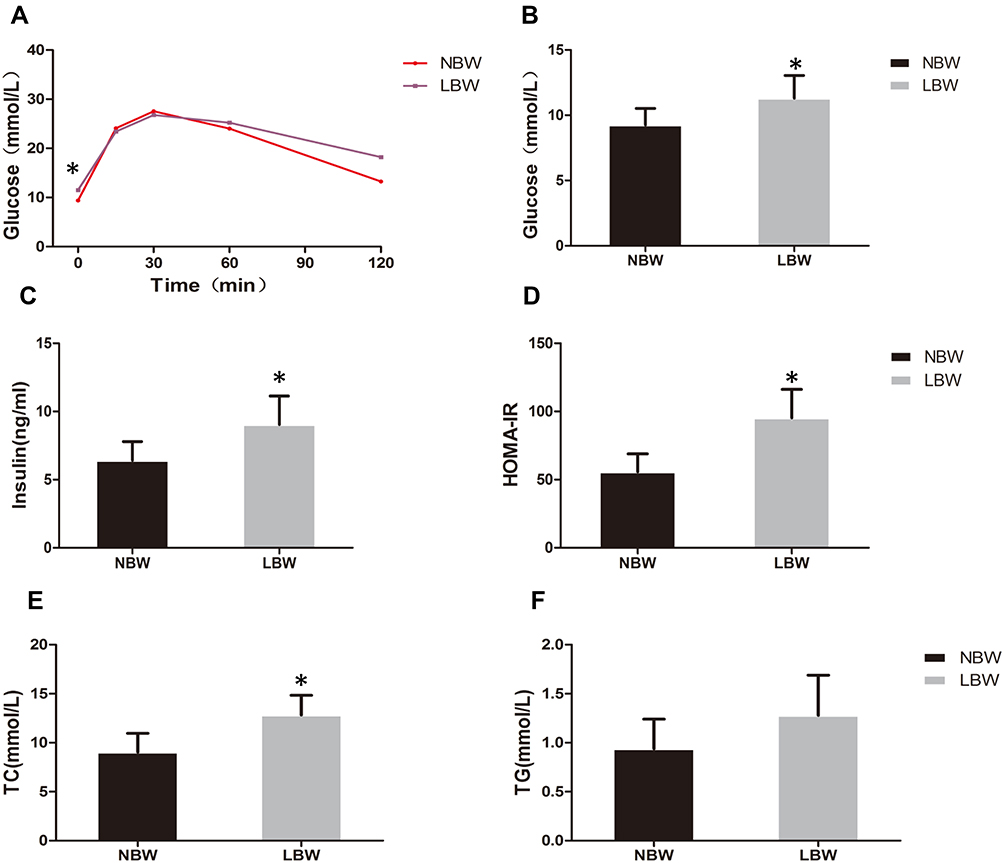 |
Figure 2 (A) IPGTT, (B) fasting blood glucose, (C) serum insulin, (D) HOMA-IR, (E) TC, (F) TG of mice in each group. Data were presented as the mean ± standard deviation; *p<0.05 vs NBW (Student’s t test). Abbreviations: IPGTT, intraperitoneal glucose tolerance test; HOMA-IR, Homoeostasis Model Assessment for Insulin Resistance; TC, total cholesterol; TG, triglyceride. |
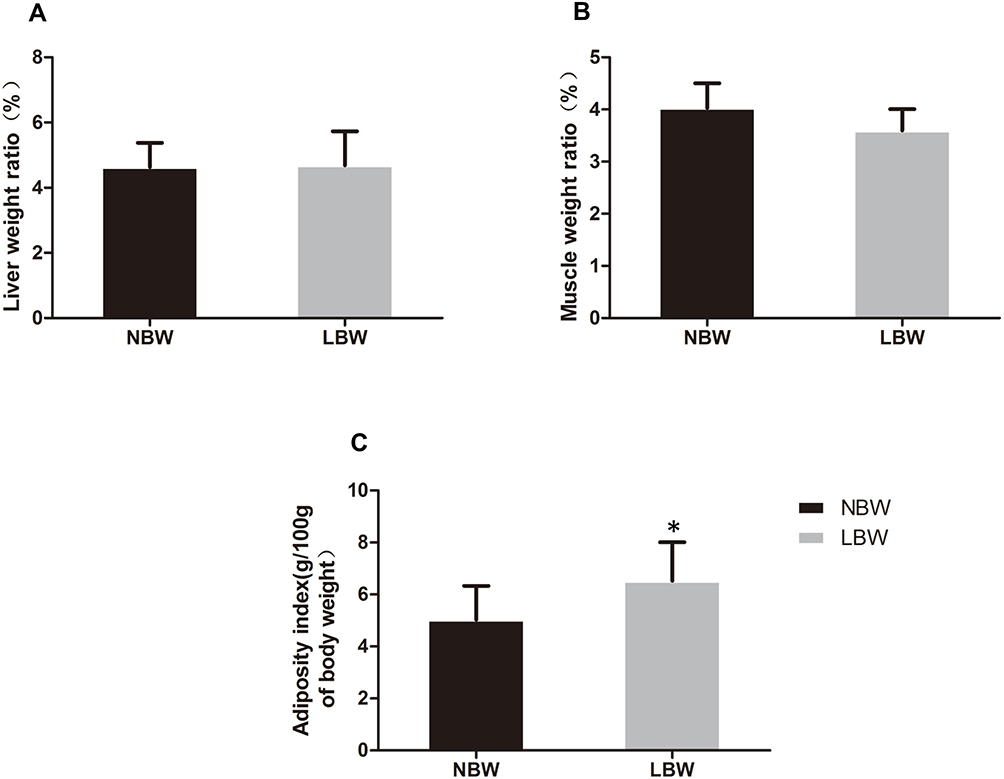 |
Figure 3 (A) Weight ratio of liver, (B) muscle, (C) adiposity index (g/100g of body weight) of mice in each group. Data were presented as the mean ± standard deviation; *p<0.05 vs NBW (Student’s t-test). |
Adipose Tissue Morphology and Ectopic Lipid Deposition
To observe adipose tissue morphology and ectopic lipid deposition, we performed HE staining and oil red O staining, and measured TG content in muscle. The HE staining of adipose tissue showed that adipocyte size was increased significantly in the LBW group compared with the NBW group (Figure 4A).A large number of red lipid droplets in hepatocytes in both the LBW and NBW groups were seen according to the oil red O staining of liver, suggesting liver lipid deposition (Figure 4B).Muscle TG content increased significantly in LBW group compared with NBW group, indicating muscle lipid deposition (Figure 4C).
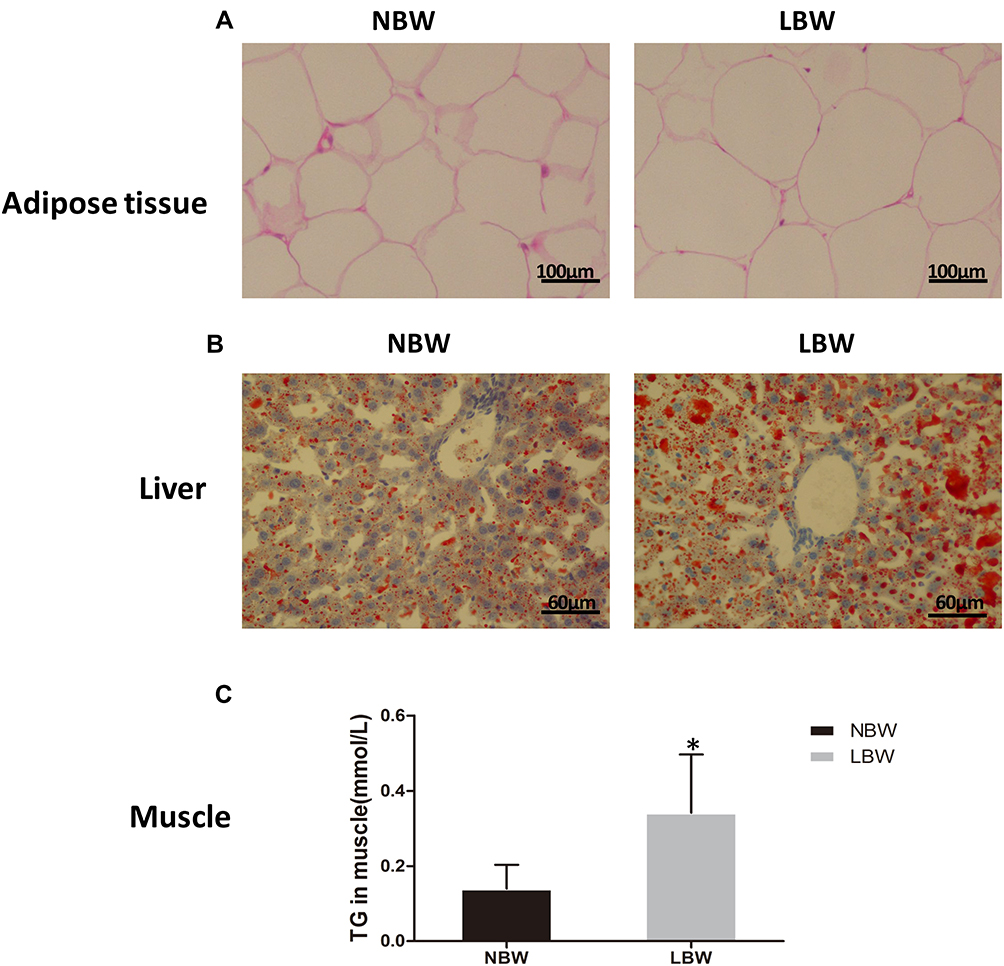 |
Figure 4 (A) HE staining of adipose tissue, (B) oil red O staining of liver, (C) TG content in muscle. Data were presented as the mean ± standard deviation; *p<0.05 vs NBW (Student’s t-test). |
Analysis of DEPs in Adipose Tissue
A total of 5854 proteins were identified in this study, of which 4940 had quantitative information. According to the filtrate threshold (P value <0.05, average ratio >1.2 or average ratio <1.0), the DEPs were screened out. There were 996 DEPs in the LBW/NBW groups, comprising 325 up-regulated and 671 down-regulated proteins. (Figure 5A).
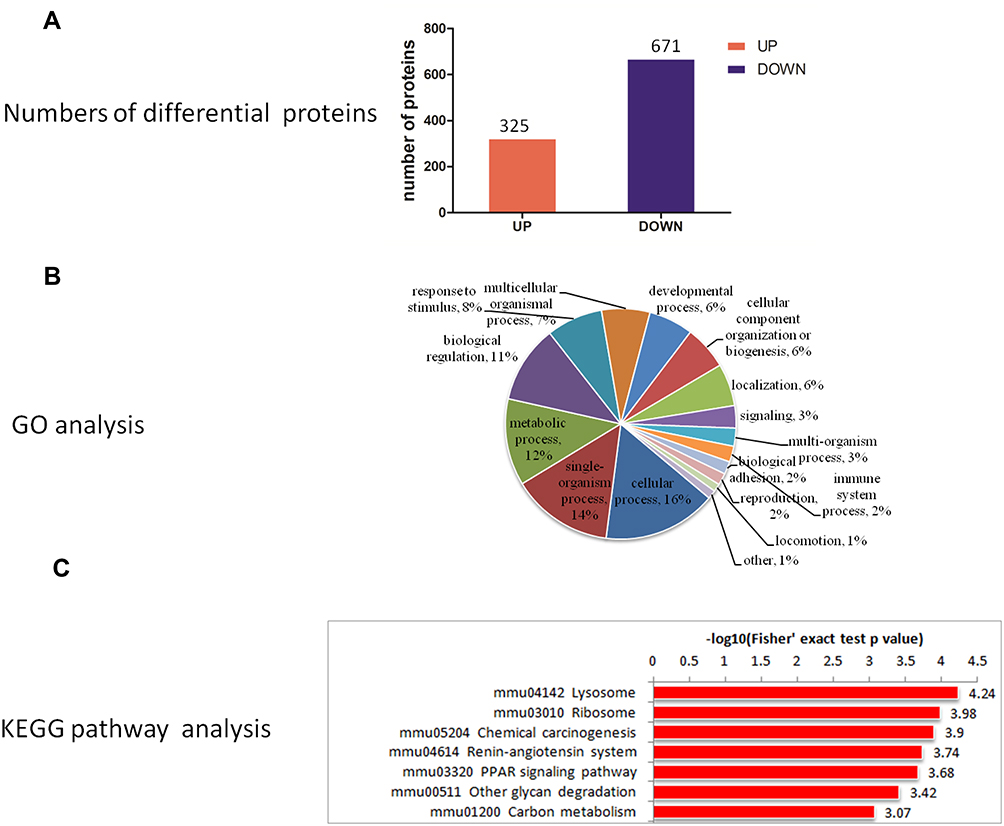 |
Figure 5 (A) Quantitative information, (B) GO analysis, (C) KEGG pathway enrichment analysis of differential proteins in LBW/NBW. Abbreviations: GO, the Gene Ontology; KEGG, Kyoto Encyclopedia of Genes and Genomes. |
The GO analysis of the identified DEPs was conducted using the UniProt-GOA database and Interport Scan software and the proteins were classified according to biological process (BP), molecular function, and cell composition. In the BP analysis, DEPs in the LBW/NBW groups were mainly involved in cellular processes, single-organism processes, metabolic processes, and biological regulation, of which metabolic processes accounted for approximately 12% (Figure 5B), suggesting that the DEPs might play an important role in the metabolic process.
The KEGG pathway enrichment analysis of DEPs in the LBW/NBW groups using Fisher’s precise double-ended test method showed that DEPs were mainly involved in lysosome, ribosome, chemical carcinogenesis, renin-angiotensin system, PPAR, and other glycan degradation and carbon metabolism processes (Figure 5C), among which the PPAR pathway was a relatively critical signal transduction pathway.
Verification of the PPAR Signaling Pathway
Through enrichment analysis of the KEGG pathway, we found that the PPAR signaling pathway was a relatively important signal transduction pathway in which DEPs were involved. In adipose tissue, the PPARγ signaling pathway was closely related to lipid metabolism (Figure 6).Thirty-three DEPs in the PPAR signaling pathway were identified. In the PPARγ pathway, CD36, PCK1, and SCD1 might affect glucose metabolism via the regulation of lipid metabolism, and the differential expression of CD36 changed substantially, so CD36, SCD1, and PCK1 were selected for analysis. Expression of CD36, SCD1, and PCK1 in the LBW group was up-regulated compared with the NBW group (Figure 7). Six protein samples were selected from the LBW group and NBW group for PRM quantification. Each protein was quantified with two or more unique peptides. After PRM quantification, we accurately identified the up-regulated CD36, SCD1, and PCK1, and the results were consistent with the proteomic analysis. The fragment ion peak areas of the corresponding peptides of CD36, SCD1, and PCK1 are shown in Figure 8A and B. Western blot analysis demonstrated that PPARγ expression was up-regulated in the LBW group compared with the NBW group (Figure 8C and D).
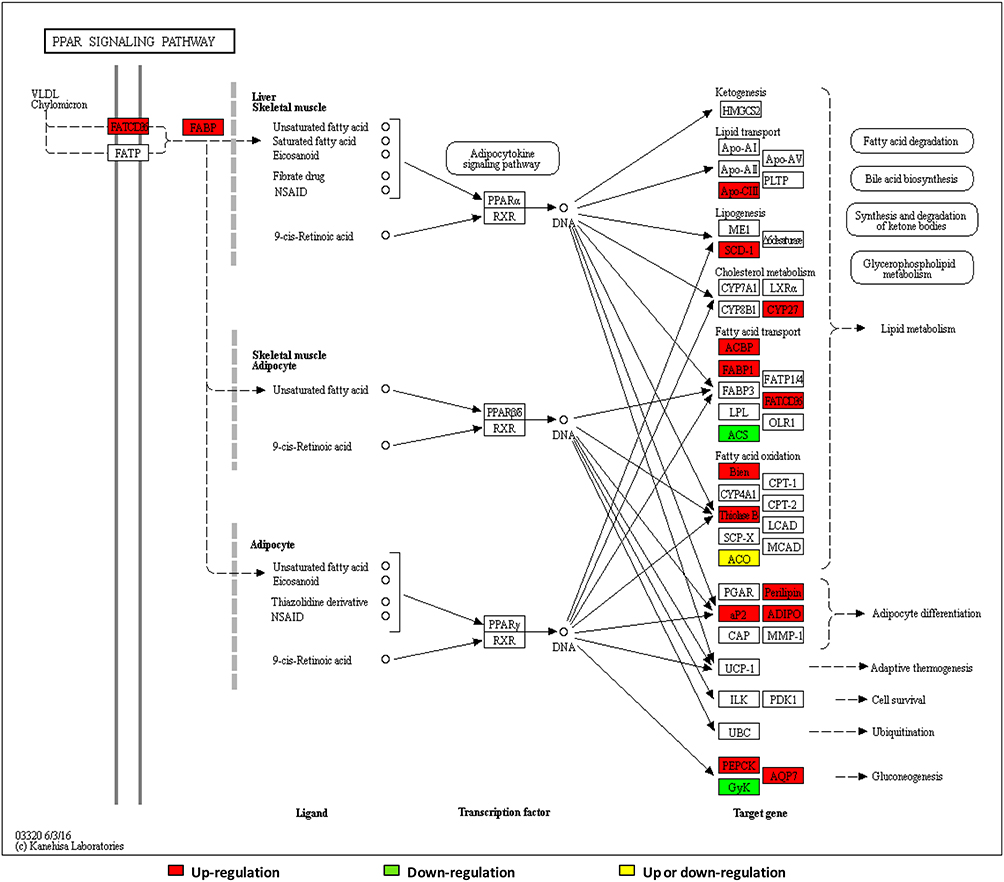 |
Figure 6 Network of PPAR pathways. |
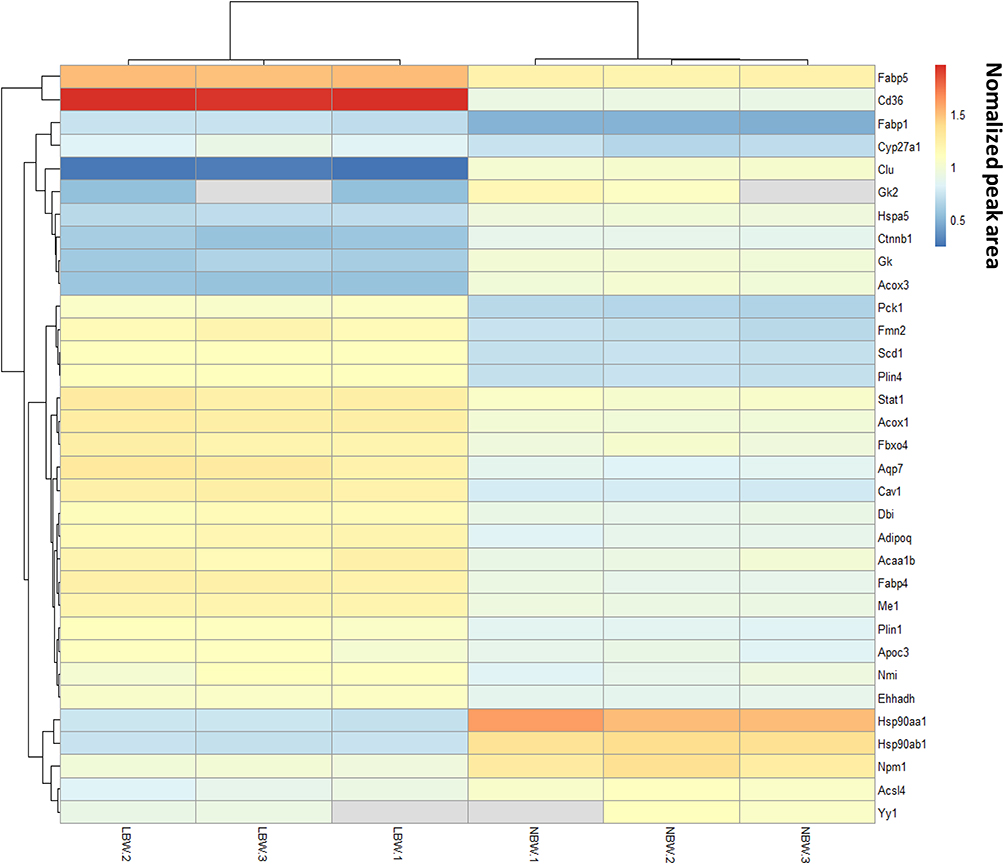 |
Figure 7 PPAR pathways cluster analysis heatmap. |
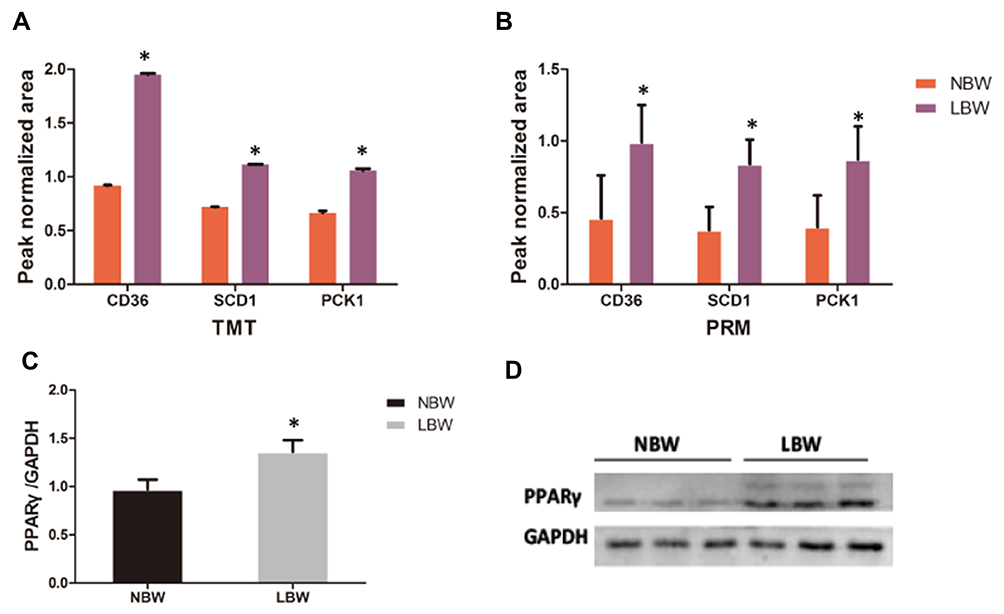 |
Figure 8 The ion peak normalized area of CD36, SCD1, and PCK1 in each group with (A) TMT and (B) PRM. Western blot verified the expression of PPARγ in the NBW/LBW groups. (C) Quantitation analysis of PPARγ expression standardised by GAPDH. (D) Western blot picture. Data were presented as the mean ± standard deviation; *p<0.05 vs NBW (Student’s t test). Abbreviations: TMT, tandem mass tag; PRM, parallel reaction monitoring; PPARγ, peroxisome proliferator-activated receptor gamma; GAPDH, glyceraldehyde-3-phosphate dehydrogenase. |
Discussion
A number of human and animal studies have shown that LBW raises the risk of insulin resistance and obesity, but the specific mechanism underlying this remains unclear. To explore the molecular and physiological mechanisms contributing to this correlation, we used calorie restriction during pregnancy in ICR mice to produce LBW offspring, along with NBW controls. Offspring mice from both groups were fed a high-fat diet. Our study is the first to apply proteomics to investigate the molecular mechanisms of insulin resistance caused by low birth weight. Proteomics analysis and PRM validation in adipose tissue revealed possible pivotal signaling pathways associated with LBW that might contribute to insulin resistance in adulthood.
In our research, LBW offspring presented higher levels of fasting glucose, insulin, HOMA-IR and adiposity index, and enlarged adipocyte size, indicating development of insulin resistance and adipose dysfunction in adulthood. The GO analysis of the TMT proteomics analysis showed that a high proportion of DEPs in the NBW/LBW groups were involved in metabolic process, reaching up to approximately 12%. Combined with KEGG pathway enrichment analysis, we found PPAR to be a relatively significant signaling pathway, involving DEPs and strongly linked to lipid metabolism in adipose tissues. PPARγ, as a highly enriched subtype of the PPAR family in white adipose tissue,16 regulates the transcription of target genes controlling lipid metabolism in adipocytes17,18 and promotes adipogenesis.19 In our study, expression of PPARγ was up-regulated in LBW mice compared with NBW mice. In vivo experiments have demonstrated the importance of PPARγ function in the regulation of whole-body insulin sensitivity.20 Deficiency of the PPARγ gene in mice has been reported to result in a more insulin-sensitive phenotype under high-fat conditions.21 To verify the proteomics-based observations, we performed further PRM validation of CD36, SCD1, and PCK1 in the PPAR pathway. As a fatty acid translocase, CD36 promotes the transport of long-chain fatty acids in adipocytes.22 The oxidized low-density lipoprotein recognized and absorbed by CD36 has a strong activating effect on PPARγ,23,24 and PPARγ further regulates the expression of downstream CD36 and SCD1. PPARγ can directly stimulate the expression of SCD1. However, the main regulation of SCD1 by PPARγ occurs at the transcriptional level, where PPARγ increases the transcriptional activity of SCD1 by binding to the SCD1 promoter, which can produce a two-fold increment in the promoter’s activity.25 There is evidence that the gene encoding PCK1 in adipose tissue is the target gene of PPARγ, which regulates the activation of the PCK1 gene during adipogenesis.26 In the proteomics analysis, expression of CD36, SCD1, and PCK1 were up-regulated in the LBW group compared with NBW group. PRM quantified up-regulated CD36, SCD1, and PCK1. In summary, compared with NBW group, the whole PPARγ pathway was active in the adipose tissue of LBW mice, promoting adipogenesis.
In adipose tissue, SCD1 and PCK1 are crucial to lipogenesis. SCD1 is a rate-limiting enzyme that synthesizes monounsaturated fatty acids-the main component of triglycerides.27 PCK1 in adipose tissue is a key enzyme in the re-esterification of fatty acids and is critical in the regulation of glyceroneogenesis and the release of fatty acids through the triglyceride/fatty acid cycle, which is essential for lipid storage in adipose tissue.28 Animal experiments in LBW mice suggest that LBW alters the expression of genes regulating adipocyte differentiation and function.29 This has also been demonstrated in other LBW mammalian models.30–32 Therefore, it is plausible that LBW might affect lipid metabolism through the CD36/PPARγ/SCD1 and CD36/PPARγ/PCK1 pathways in adipose tissue (as shown in Figure 9). Compared with NBW mice, we observed increased adipocyte size and accumulated epididymal fat in LBW mice with high-fat feeding, and taken together with the results of proteomics analysis and PRM verification, it might be concluded that LBW aggravated the accumulation of white adipose tissue and reduced the lipid storage threshold because of excessive use of lipid storage capacity in a high-fat environment.
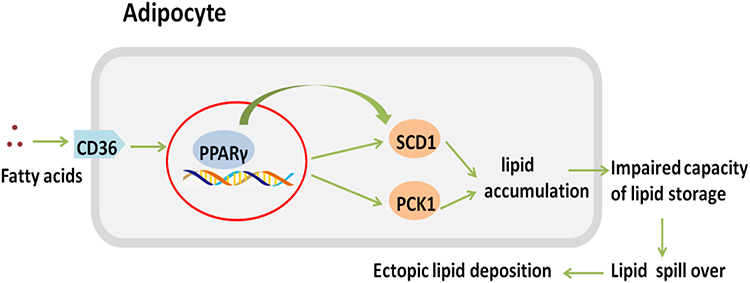 |
Figure 9 CD36/PPARγ/SCD1 and CD36/PPARγ/PCK1 pathway. |
In the LBW model, high-fat feeding exacerbated the inability of white adipose tissue to further expand and, combined with abnormal expression of genes regulating lipid metabolism and adipocyte differentiation, adipocytes were unable to appropriately accommodate energy surplus, leading to increased lipid overflow.33 Compared with their NBW counterparts, LBW mice shown elevated peripheral triglyceride levels and ectopic lipid deposition in the liver and muscle (typical manifestations of lipotoxicity), thus interfering with cell homeostasis, impairing metabolic pathways and inducing insulin resistance.34,35 Elevated values of fasting blood glucose, insulin and HOMA-IR revealed glucose homeostasis imbalance. In contrast to other animal studies on LBW, a long-term high-fat diet was applied to mimic the dietary pattern of modern life in our study. Compared with NBW mice, the PPARγ signaling pathway in adipose tissue remained relatively active in LBW mice with high-fat feeding, and the expression of CD36, SCD1, and PCK1 increased. Accordingly, CD36 promoted the transport of fatty acids in adipocytes and activated PPARγ, which stimulated the expression of SCD1 and PCK1, promoting adipogenesis and leading to impaired lipid storage capacity and increased lipotoxicity in the LBW mice, which might be the mechanism underlying insulin resistance caused by LBW. Most importantly, the PPARγ pathway was reported for the first time as a significant mechanism linking low birth weight with adulthood diabetes.
This study has some limitations. Our evidence is obtained from in vitro studies, and there is a lack of in vivo experimental data. Future studies of the role of the CD36/PPARγ/SCD1 and CD36/PPARγ /PCK1 pathways using gene-edited LBW mice could provide useful in vivo evidence of the relationship between LBW and insulin resistance.
Conclusion
In summary, when exposed to high-fat diets, LBW mice exhibited insulin resistance and disorder of lipid metabolism compared with NBW mice. Following functional enrichment analysis suggested PPAR pathway as an important mechanism underlying metabolic regulation in adipose tissue of high-fat fed LBW mice. The expression of PPARγ was elevated, as well as upstream CD36, downstream SCD1 and PCK1 of the PPARγ in the adipose tissue of LBW mice, further confirming the activation of PPARγ signaling pathway. It was suggested that the activation in CD36/PPARγ/ SCD1 and CD36/PPARγ/PCK1 pathways may induce adipose dysfunction, thereby increasing susceptibility to insulin resistance.
Data Sharing Statement
The analyzed data sets generated about animal experiment during the study are available from the corresponding author on reasonable request. The mass spectrometry proteomics data has been deposited to the ProteomeXchange Consortium via the PRIDE36 partner repository with the dataset identifier PXD021019.
Ethics Approval
The authors declare that the experiment was approved by the Animal Ethics Committee of Hebei General Hospital (No. 247) and was carried out in accordance with regulations on the management of experimental animals in Hebei Province.
Consent for Publication
The authors agree to publication in the Journal.
Acknowledgment
We thank Helen Roberton, from Liwen Bianji (Edanz) (www.liwenbianji.cn/) for editing the English text of a draft of this manuscript.
Funding
This study was supported by grants from Hebei Province Natural Science Foundation of China (No. H2019307108).
Disclosure
The authors report no conflicts of interest for this work.
References
1. Ma H, Sales VM, Wolf AR, et al. Attenuated effects of bile acids on glucose metabolism and insulin sensitivity in a male mouse model of prenatal undernutrition. Endocrinology. 2017;158(8):2441–2452. doi:10.1210/en.2017-00288
2. Whincup PH, Kaye SJ, Owen CG, et al. Birth weight and risk of type 2 diabetes: a systematic review. JAMA. 2008;300(24):2886–2897.
3. Jornayvaz FR, Vollenweider P, Bochud M, Mooser V, Waeber G, Marques-Vidal P. Low birth weight leads to obesity, diabetes and increased leptin levels in adults: the CoLaus study. Cardiovasc Diabetol. 2016;15:73. doi:10.1186/s12933-016-0389-2
4. Buhl CS, Stφdkilde-Jφrgensen H, Videbech P, et al. Escitalopram ameliorates hypercortisolemia and insulin resistance in low birth weight men with limbic brain alterations. J Clin Endocrinol Metab. 2018;103(1):115–124. doi:10.1210/jc.2017-01438
5. Zhao H, Song A, Zhang Y, Zhen Y, Song G, Ma H. The association between birth weight and the risk of type 2 diabetes mellitus: a systematic review an d meta-analysis. Endocr J. 2018;65(9):923–933. doi:10.1507/endocrj.EJ18-0072
6. Fontaine MA, Diane A, Singh VP, et al. Low birth weight causes insulin resistance and aberrant intestinal lipid metabolism independent of mi crobiota abundance in landrace-large white pigs. FASEB J. 2019;33(8):9250–9262. doi:10.1096/fj.201801302RR
7. Sarr O, Thompson JA, Zhao L, Lee TY, Regnault TR. Low birth weight male Guinea pig offspring display increased visceral adiposity in early adulthood. PLoS One. 2014;9(6):e98433. doi:10.1371/journal.pone.0098433
8. Beauchamp B, Ghosh S, Dysart MW, et al. Low birth weight is associated with adiposity, impaired skeletal muscle energetics and weight loss resistance in mice. Int J Obes (Lond). 2015;39(4):702–711.
9. Hughes AE, Hattersley AT, Flanagan SE, Freathy RM. Two decades since the fetal insulin hypothesis: what have we learned from genetics? Diabetologia. 2021;64(4):717–726. doi:10.1007/s00125-021-05386-7
10. Bar J, Weiner E, Levy M, Gilboa Y. The thrifty phenotype hypothesis: the association between ultrasound and Doppler studies in fetal growth restriction and the development of adult disease. Am J Obstet Gynecol MFM. 2021;3:100473. doi:10.1016/j.ajogmf.2021.100473
11. Ahmed B, Sultana R, Greene MW. Adipose tissue and insulin resistance in obese. Biomed Pharmacother. 2021;137:111315. doi:10.1016/j.biopha.2021.111315
12. Hammarstedt A, Gogg S, Hedjazifar S, Nerstedt A, Smith U. Impaired adipogenesis and dysfunctional adipose tissue in human hypertrophic obesity. Physiol Rev. 2018;98(4):1911–1941. doi:10.1152/physrev.00034.2017
13. Heilbronn LK, Campbell LV. Adipose tissue macrophages, low grade inflammation and insulin resistance in human obesity. Curr Pharm Des. 2008;14(12):1225–1230. doi:10.2174/138161208784246153
14. Nakano Y. Adult-onset diseases in low birth weight infants: association with adipose tissue maldevelopment. J Atheroscler Thromb. 2020;27(5):397–405. doi:10.5551/jat.RV17039
15. Wu Y, Yu X, Li Y, et al. Adipose tissue mediates associations of birth weight with glucose metabolism disorders in children. Obesity. 2019;27(5):746–755. doi:10.1002/oby.22421
16. Maréchal L, Laviolette M, Rodrigue-Way A, et al. The CD36-PPARγ pathway in metabolic disorders. Int J Mol Sci. 2018;19(5):1529. doi:10.3390/ijms19051529
17. Noshiro M, Kawamoto T, Nakashima A, et al. DEC1 regulates the rhythmic expression of PPARγ target genes involved in lipid metabolism in white ad ipose tissue. Genes Cells. 2020;25(4):232–241. doi:10.1111/gtc.12752
18. Ricote M, Valledor AF, Glass CK. Decoding transcriptional programs regulated by PPARs and LXRs in the macrophage: effects on lipid hom eostasis, inflammation, and atherosclerosis. Arterioscler Thromb Vasc Biol. 2004;24(2):230–239. doi:10.1161/01.ATV.0000103951.67680.B1
19. Montaigne D, Butruille L, Staels B. PPAR control of metabolism and cardiovascular functions. Nat Rev Cardiol. 2021;18(12):809–823. doi:10.1038/s41569-021-00569-6
20. Yamaguchi S, Yoshino J. Adipose tissue NAD+ biology in obesity and insulin resistance: from mechanism to therapy. Bioessays. 2017;39(5):1600227. doi:10.1002/bies.201600227
21. Kubota N, Terauchi Y, Miki H, et al. PPAR gamma mediates high-fat diet-induced adipocyte hypertrophy and insulin resistance. Mol Cell. 1999;4(4):597–609. doi:10.1016/S1097-2765(00)80210-5
22. Glatz JF, Luiken JJ. From fat to FAT (CD36/SR-B2): understanding the regulation of cellular fatty acid uptake. Biochimie. 2017;136:21–26. doi:10.1016/j.biochi.2016.12.007
23. Nagy L, Tontonoz P, Alvarez JG, Chen H, Evans RM. Oxidized LDL regulates macrophage gene expression through ligand activation of PPARgamma. Cell. 1998;93(2):229–240. doi:10.1016/S0092-8674(00)81574-3
24. Su T, Huang C, Yang C, et al. Apigenin inhibits STAT3/CD36 signaling axis and reduces visceral obesity. Pharmacol Res. 2020;152:104586. doi:10.1016/j.phrs.2019.104586
25. Shi P, Meng R, Liao K, et al. Cadmium transcriptionally regulates Scd1 expression in silver pomfret. Environ Toxicol. 2020;35(3):404–413. doi:10.1002/tox.22877
26. Beale EG, Forest C, Hammer RE. Regulation of cytosolic phosphoenolpyruvate carboxykinase gene expression in adipocytes. Biochimie. 2003;85(12):1207–1211. doi:10.1016/j.biochi.2003.10.012
27. Kamal S, Saleem A, Rehman S, Bibi I, Iqbal HMN. Protein engineering: regulatory perspectives of stearoyl CoA desaturase. Int J Biol Macromol. 2018;114:692–699. doi:10.1016/j.ijbiomac.2018.03.171
28. Yu S, Meng S, Xiang M, Ma H. Phosphoenolpyruvate carboxykinase in cell metabolism: roles and mechanisms beyond gluconeogenesis. Mol Metab. 2021;53:101257. doi:10.1016/j.molmet.2021.101257
29. Isganaitis E, Jimenez-Chillaron J, Woo M, et al. Accelerated postnatal growth increases lipogenic gene expression and adipocyte size in low-birth weight mice. Diabetes. 2009;58(5):1192–1200. doi:10.2337/db08-1266
30. Gondret F, Père MC, Tacher S, et al. Spontaneous intra-uterine growth restriction modulates the endocrine status and the developmental expression of genes in porcine fetal and neonatal adipose tissue. Gen Comp Endocrinol. 2013;194:208–216. doi:10.1016/j.ygcen.2013.09.018
31. Suzuki M, Shibanuma M, Kimura S. Effect of severe maternal dietary restriction on growth and intra-abdominal adipose tissue weights in offspring rats. J Nutr Sci Vitaminol. 2010;56(5):293–298. doi:10.3177/jnsv.56.293
32. Muhlhausler BS, Ritorto V, Schultz C, Chatterton BE, Duffield JA, McMillen IC. Birth weight and gender determine expression of adipogenic, lipogenic and adipokine genes in perirenal adipose tissue in the young adult sheep. Domest Anim Endocrinol. 2008;35(1):46–57. doi:10.1016/j.domaniend.2008.01.007
33. Carobbio S, Pellegrinelli V, Vidal-Puig A. Adipose tissue function and expandability as determinants of lipotoxicity and the metabolic syndrome. Adv Exp Med Biol. 2017;960:161–196. doi:10.1007/978-3-319-48382-5_7
34. Khalid M, Alkaabi J, Khan MAB, Adem A. Insulin signal transduction perturbations in insulin resistance. Int J Mol Sci. 2021;22(16):8590. doi:10.3390/ijms22168590
35. da Silva Rosa SC, Nayak N, Caymo AM, Gordon JW. Mechanisms of muscle insulin resistance and the cross-talk with liver and adipose tissue. Physiol Rep. 2020;8(19):e14607. doi:10.14814/phy2.14607
36. Perez-Riverol Y, Csordas A, Bai J, et al. The PRIDE database and related tools and resources in 2019: improving support for quantification data. Nucleic Acids Res. 2019;47(D1):D442–d450. doi:10.1093/nar/gky1106
 © 2022 The Author(s). This work is published and licensed by Dove Medical Press Limited. The
full terms of this license are available at https://www.dovepress.com/terms
and incorporate the Creative Commons Attribution
- Non Commercial (unported, 3.0) License.
By accessing the work you hereby accept the Terms. Non-commercial uses of the work are permitted
without any further permission from Dove Medical Press Limited, provided the work is properly
attributed. For permission for commercial use of this work, please see paragraphs 4.2 and 5 of our Terms.
© 2022 The Author(s). This work is published and licensed by Dove Medical Press Limited. The
full terms of this license are available at https://www.dovepress.com/terms
and incorporate the Creative Commons Attribution
- Non Commercial (unported, 3.0) License.
By accessing the work you hereby accept the Terms. Non-commercial uses of the work are permitted
without any further permission from Dove Medical Press Limited, provided the work is properly
attributed. For permission for commercial use of this work, please see paragraphs 4.2 and 5 of our Terms.