Back to Journals » OncoTargets and Therapy » Volume 13
Adipose-Derived Stem Cells Can Replace Fibroblasts as Cell Control for Anti-Tumor Screening Assay
Authors Pham PV ![]() , Nguyen ST
, Nguyen ST ![]() , Phan NLC, Do NM, Vo PH
, Phan NLC, Do NM, Vo PH ![]()
Received 23 April 2020
Accepted for publication 5 June 2020
Published 2 July 2020 Volume 2020:13 Pages 6417—6423
DOI https://doi.org/10.2147/OTT.S259114
Checked for plagiarism Yes
Review by Single anonymous peer review
Peer reviewer comments 2
Editor who approved publication: Prof. Dr. Nicola Silvestris
Phuc Van Pham,1– 3 Sinh Truong Nguyen,1 Nhan Lu-Chinh Phan,1 Nghia Minh Do,1 Phuc Hong Vo1
1Stem Cell Institute, University of Science, VNU-HCM, Ho Chi Minh City, Vietnam; 2Laboratory of Stem Cell Research and Application, University of Science, VNU-HCM, Ho Chi Minh City, Vietnam; 3Cancer Research Laboratory, University of Science, VNU-HCM, Ho Chi Minh City, Vietnam
Correspondence: Phuc Van Pham Email [email protected]
Abstract: Anti-tumor activity screening is a typical process used in anti-tumor drug discovery. The ideal anti-tumor drug candidates are extracts or compounds that can inhibit the proliferation of cancer cells via apoptosis, while exerting minimal effects on normal somatic cells. For a long time, fibroblasts were used as normal cells for all anti-tumor screening assays. However, the fibroblasts exhibited several limitations as cell controls for anti-tumor screening. This study aimed to compare the usage of dermal fibroblasts (DFs) and adipose-derived stem cells (ADSCs) as normal cell controls in anti-tumor screening protocols. The DFs and ADSCs were prepared per the published protocols. The IC50 values of doxorubicin on hepatocellular carcinoma cells HepG2, breast cancer cells MCF-7, DFs and ADSCs were determined via the Alamar blue assay. The side effect indexes (SEIs) were calculated as the ratio of IC50 values of drugs on cancer cells and IC50 values of drugs on DFs, and on ADSCs. The stability of the anti-tumor assay was investigated when carried out on DFs and ADSCs from different passages. The results showed that the IC50 values, as well as SEI values, were not significantly different between using DFs or ADSCs as normal cell controls when DFs and ADSCs were at passage 3. However, for DFs at passage 6 to 12, the IC50 values of doxorubicin were significantly different between DFs and ADSCs. The IC50 values of doxorubicin on DFs were strongly reduced due to the senescence of DFs, while the values were more constant in ADSCs. The SEI values of doxorubicin on DFs, compared to HepG2 and MCF-7 cells, were also changed during passage 3 to 12 of the DFs. However, these values were only slightly changed for ADSCs from the 3rd to 12th passages. ADSCs can replace DFs as a normal cell control for anti-tumor activity screening.
Keywords: adipose-derived stem cell, anti-tumor activity screening, dermal fibroblast, normal cell control
Introduction
Cancer is the second leading cause of death in the word.1 Chemotherapy is still an important method to treat this disease.2–4 However, chemotherapy has faced challenges, including multi-drug resistance and side effects.5–7 Therefore, research on developing new drugs is still being promoted and is critical. Anti-tumor activity screening assay is the most popular as well as the first assay used in the anti-cancer drug discovery process.8–10 To determine side effects of anti-cancer drug candidates, normal cells are used as control cells for the assay. The most common side effects of anti-cancer drugs is non-selective killing, whereby the drug kills both cancerous cells and normal cells of the patients. Therefore, the side effect index (SEI) values were used to demonstrate the extent of the side effects. The SEI values were calculated as the ratio of the IC50 value of the respective agent on cancerous cells to the IC50 value of the agent on normal cells. For a long time, dermal fibroblasts (DFs) from both humans and rodents were used as normal cell controls in almost all screening studies.11–15 There has been no study to explain why fibroblasts were used in the studies herein. However, fibroblasts have been popular cells to study, and they are easy to isolate and expand for a long time. Moreover, many studies have applied these previous published protocols to future studies. After completion of some screening projects, we documented that SEI values are so variable; it seems that these values depend on the passage of the fibroblasts. To replace fibroblasts as the normal cell control, we evaluated the use of adipose-derived stem cells (ADSCs) as the normal cell control. This report aimed to report the initial findings to rationalize the use of ADSCs as suitable candidate cells to serve as a normal cell control in lieu of fibroblasts.
Materials and Methods
Cell Lines
The HepG2 and MCF-7 cell lines were obtained from American Type Culture Collection (ATCC, Manassas, VA). They were grown in Dulbecco’s Modified Eagle’s Medium (DMEM), supplemented with 10% heat-inactivated fetal bovine serum (FBS) and 1% penicillin–streptomycin, and cultured in a humidified incubator with 5% CO2 at 37°C; all reagents were obtained from Thermo Fisher Scientific (Waltham, MA). Both cancer cell lines were authenticated by short tandem repeat (STR) profiling cell authentication services at Forensic Center of Ho Chi Minh City. The STR profiles from the center were compared to STR profiles of MCF-7 and HepG2 cells published on the ATCC website.
Adipose-Derived Stem Cells and Dermal Fibroblast Isolation and Proliferation
Dermal fibroblasts (DFs) were isolated from the foreskin using the previously published protocol.16 All patients provided informed consent for use of foreskin tissue in this research. The procedure for cell isolation was approved by the Scientific Ethics Committee of the Stem Cell Institute, University of Science, Vietnam National University Ho Chi Minh City, Viet Nam. Foreskin was stored in phosphate buffered saline (PBS) solution at 4°C and transferred to the laboratory for isolation and culture of fibroblasts. DFs were expanded to the 3rd, 6th, 9th and 12th passages, and used accordingly in some assays. The DFs were cultured and expanded in DMEM/F12 supplemented with 10% FBS and 1% penicillin–streptomycin in a humidified incubator with 5% CO2 at 37°C; all reagents were obtained from Thermo Fisher Scientific (Waltham, MA). The DFs at the 3rd passage were used to characterize fibroblast phenotype by flow cytometry for CD90 and vimentin expression.
Adipose-derived stem cells (ADSCs) were isolated from fat tissue using a previously published protocol.17 The stromal vascular fractions (SVFs) were extracted from the adipose tissues using the Cell Extraction Kit (Regenmedlab, Ho Chi Minh City, Vietnam), according to the manufacturer’s instructions. SVFs were cultured to collect ADSCs in the flask using the ADSCult I medium (Regenmedlab, Ho Chi Minh City, Vietnam), which consisted of DMEM/F12 supplemented with antibiotic/antimycotic, epidermal growth factor (EGF), basic fibroblast growth factor (bFGF), and 10% activated human platelet rich plasma. ADSCs were subcultured and expanded to the 3rd, 6th, 9th and 12th passages. The ADSCs at the 3rd passage were used to characterize mesenchymal stem cell phenotype.
The population doubling levels (PDLs) of ADSCs and DFs were calculated at the 3rd, 6th, 9th and 12th passages. PDL refers to the total number of times the cells in the population have doubled since their primary isolation in vitro. PDLs were calculated as n = 3.32 (log UCY - log l) + X, where n = the final PDL number at the end of a given subculture, UCY = the cell yield at that point, l = the cell number used as inoculum to begin that subculture, and X = the doubling level of the inoculum used to initiate the subculture being quantitated. Both ADSCs and DFs were seeded at 2500 cells/cm2 in T-25 flasks. When the flasks reached 80% confluency, the cells were subcultured at 1:3 split ratio. The obtained total cells at the 3rd, 6th, 9th, and 12th passages were recorded to calculate the PDLs using the software EcoCyto-Population doubling level calculator (https://play.google.com/store/apps/details?id=com.PDL.Calc&hl=en).
IC50 Values and SEI Values of Doxorubicin on HepG2, MCF-7, ADSCs and DFs
To determine IC50 values of doxorubicin on HepG2, MCF-7 and ADSCs, 2500 cells of HepG2, MCF-7, DFs or ADSCs were seeded into each well of a 96-well tissue culture plate one day before treatment with doxorubicin (Sigma-Aldrich, St. Louis, MO). The serial concentrations of doxorubicin used in this assay were: 125, 62, 30, 15, 7, 3, and 0 µg/mL (untreated). Each concentration was tested in triplicate. After 48 h of treatment with doxorubicin, Alamar Blue (R-7071; Sigma-Aldrich) was added to the medium to a final concentration of 10 µg/mL, and incubated for 1 hour. The fluorescence at 560 nm was recorded using a DTX 880 system (Beckman Coulter, Brea, CA). Each concentration was tested in triplicate. Experiments were independently repeated three times. Based on the IC50 values of doxorubicin on HepG2, MCF-7, DFs and ADSCs, we determined the side effect index (SEI) values. SEI values correspond to the non-selective toxicity of doxorubicin against DFs and ADSCs. The SEI value is the ratio of the IC50 of doxorubicin on cancer cells (HepG2 or MCF-7) to the IC50 of doxorubicin on normal cells (DFs or ADSCs).
Statistical Analysis
Data were analyzed by GraphPad Prism software (Graphpad Software, Inc., La Jolla, CA) for the determination of IC50 values. All data were presented as the mean of triplicate experiments. Statistical significance was set at P<0.05.
Results
ADSCs and DFs Isolation and Characterization
As the results, ADSCs were expanded and characterized using the minimal criteria for mesenchymal stem cells (MSCs); they expressed some particular markers of MSCs (such as CD44, CD73, CD90 and CD105) (Figure 1E–H) but were negative for CD14, CD45 and HLA-DR (Figure 1A–D). They also could be induced into adipocytes, osteoblasts and chondroblasts (Figure 1J–K). DFs were successfully isolated from the dermal layer of human skin. The DFs displayed the distinctive shape when adhered onto the flask surface and highly expressed CD90 (>99%) (Figure 1L) and vimentin (>99%) (Figure 1M).
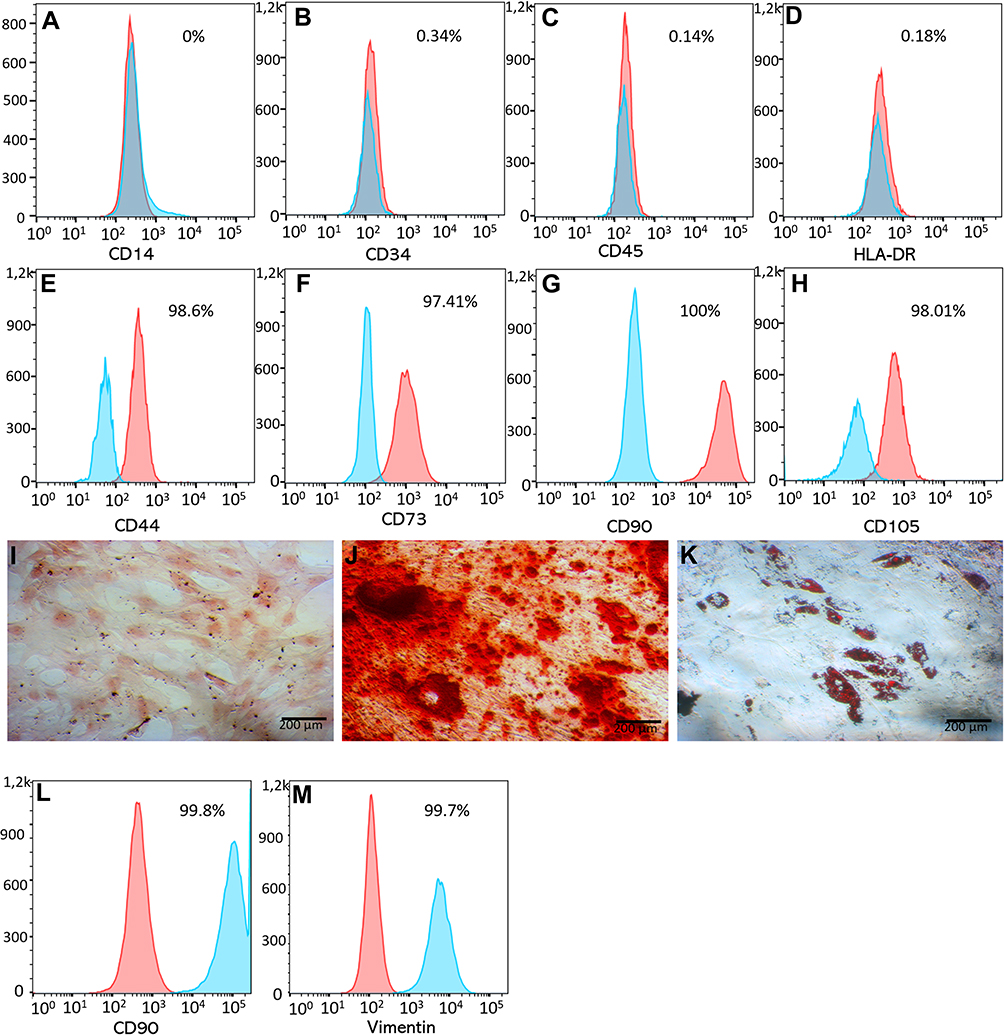 |
Figure 1 The phenotype of ADSCs and DFs. ADSCs displayed the mesenchymal stem cell phenotype, being negative for CD14 (A), CD34 (B), CD45 (C), HLA-DR (D), and positive for CD44 (E) CD73 (F), CD90 (G) and CD105 (H). They also were differentiated into mesodermal cells including chondrocytes (I), osteoblasts (J) and adipocytes (K). DFs strongly expressed CD90 (L) and vimentin (M). Abbreviations: ADSCs, adipose-derived stem cells; CD, cluster of differentiation; DFs, dermal fibroblasts. |
PDLs of ADSCs and DFs were determined at the 3rd, 6th, 9th and 12th passages. The results showed that the DPL values gradually increased in both ADSCs and DFs after the 3rd, 6th, 9th and 12th passages. The PDLs of ADSCs were slightly higher compared to DFs at the same passage. This was related to the fact that the total number of ADSCs obtained at 80% confluency was higher than that of DFs (Table 1).
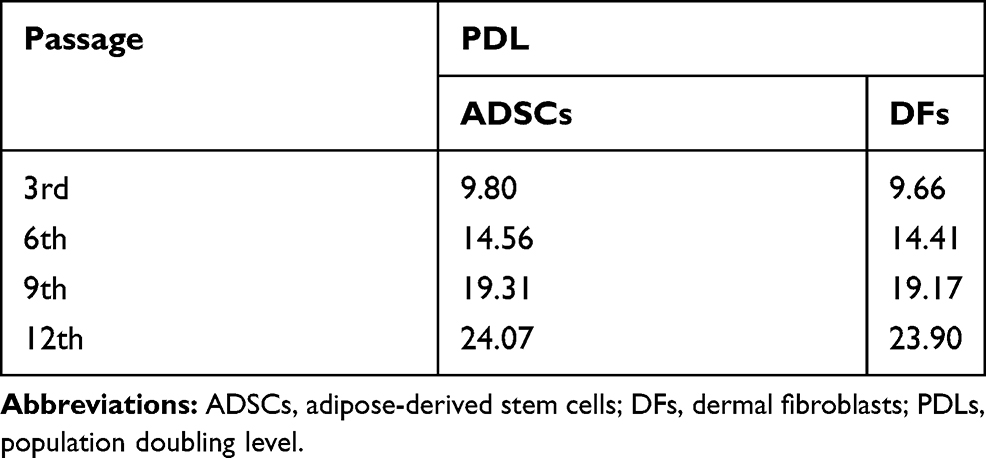 |
Table 1 PDLs of ADSCs and DFs at the 3rd, 6th, 9th and 12th Passages |
IC50 Values of Doxorubicin on ADSCs, DFs, MCF-7 and HepG2
IC50 values of doxorubicin were determined at different cell passages for both DFs and ADSCs (Figure 2). The results showed that at low passage (3rd) (PDL of 9.66 for DFs, and 9.80 for ADSCs), the IC50 of doxorubicin on DFs and ADSCs were not significantly different (12.17 ± 1.72 ng/mL for DFs vs. 12.47 ± 0.40 ng/mL for ADSCs; p > 0.05). When DFs were continuously expanded to the 6th (PDL of 14.41), 9th (PDL of 19.17) and 12th (PDL of 23.90) passages, the IC50 values of doxorubicin significantly decreased (8.29 ± 0.78 ng/mL at the 6th passage, 5.87 ± 0.35 ng/mL at the 9th passage, and 3.43 ± 0.55 at the 12th passage; p < 0.05). However, the IC50 values slowly changed for ADSCs. The IC50 values at the 3rd (PDL of 9.80) and 6th (PDL of 14.56) passages were nonsignificantly changed (12.47 ± 0.40 ng/mL at 3rd vs. 11.75 ± 0.36 ng/mL at 6th; p > 0.05). Moreover, the IC50 values at the 9th (PDL of 19.31) and 12th (PDL of 24.07) passages were significantly decreased compared to the 3rd (10.65 ± 0.60 ng/mL at 9th, and 10.74 ± 0.37 ng/mL at 12th, compared to 12.47 ± 0.40 ng/mL at 3rd; p < 0.05). The data also showed that the IC50 values of doxorubicin in ADSCs at the 9th and 12th passages were not significantly different compared to that of ADSCs at the 6th passage (Figure 2).
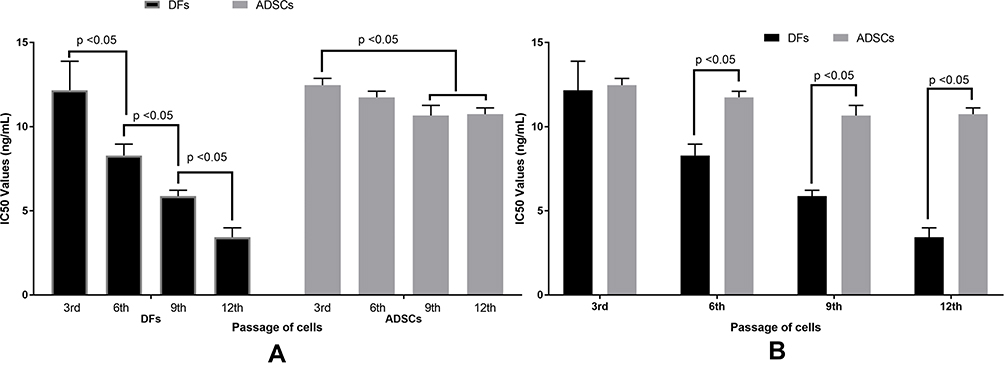 |
Figure 2 IC50 values of doxorubicin are different between the passages of DFs and ADSCs. The IC50 values of DFs were significantly decreased as the passages of DFs increased, while the values slightly changed when the passage of ADSCs increased from the 3rd to the 6th passage, and from the 6th to the 9th or 12th passage (A). The IC50 values of doxorubicin are nonsignificant between DFs and ADSCs at the 3rd passage; however, these values are significantly different between DFs and ADSCs at the 6th, 9th and 12th passages (B). Abbreviations: ADSCs, adipose-derived stem cells; DFs, dermal fibroblasts; IC50, the half maximal inhibitory concentration. |
SEI Values of Doxorubicin on ADSCs, DFs, MCF-7 and HepG2
The SEI values of doxorubicin were calculated based on the IC50 of doxorubicin on DFs and ADSCs in two cases of HepG2 hepatocellular carcinoma cell screening and MCF-7 breast cancer cell screening. From the results of changes in IC50 values of doxorubicin on DFs at different passages, the SEI values also significantly changed when DFs at different passages were used. Indeed, these values gradually increased in the higher passages of DFs, for both HepG2 and MCF-7 screening.
For HepG2 cells, the SEI values of doxorubicin were variable between assays with different passages of DFs used. As shown in Figure 3, these values significantly increased when the higher passage of DFs were used: 9.00 ± 1.00 ng/mL at 3rd passage (PDL of 9.66), 11.17 ± 1.04 ng/mL at 6th passage (PDL of 14.41), 13.90 ± 1.15 ng/mL at 9th passage (PDL of 19.17), and 16.30 ± 0.61 ng/mL at 12th passage (PDL of 23.90) of DFs (p < 0.05). The SEI values of doxorubicin calculated based on the IC50 values of doxorubicin on ADSCs were stable. The values for ADSCs for the 3rd to 12th passages of ADSCs used were as follows: 8.00 ± 1.00 ng/mL at 3rd passage (PDL of 9.80), 8.17 ± 0.76 ng/mL at 6th passage (PDL of 14.56), 8.60 ± 0.53 ng/mL at 9th passage (PDL of 19.31), and 8.33 ± 0.29 ng/mL at 12th passage (PDL of 24.07) of ADSCs (p > 0.05) (Figure 3A).
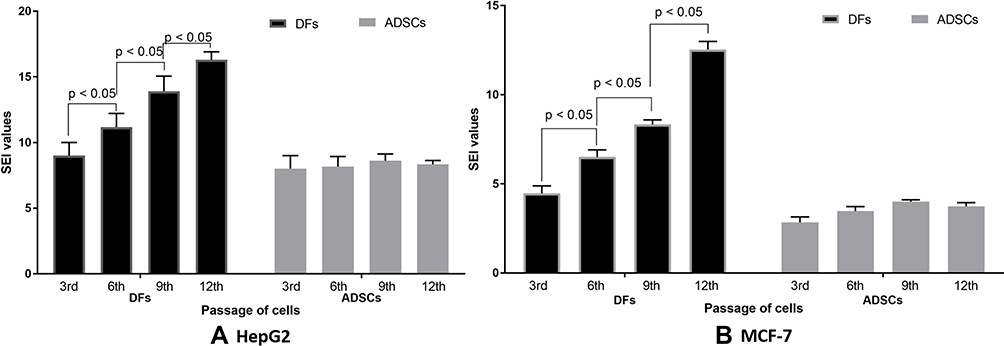 |
Figure 3 The SEI values of doxorubicin on DFs and ADSCs at their different passages when compared to HepG2 and MCF-7 cells. (A) SEI values were significant increased as the passages of DFs increased from the 3rd to 6th, 9th and 12 passages- in the HepG2 model; however, the SEI values changed for ADSCs from the 3rd through 12th passage in that model. (B) Similarly, the SEI values also strongly increased when using DFs as the normal cell control, while the SEI values were nonsignificantly changed when ADSCs were used as the normal cell control in the MCF-7 model. Abbreviations: ADSCs, adipose-derived stem cells; DFs, dermal fibroblasts; SEI, side effect index. |
For MCF-7 cells, the SEI values of doxorubicin, when evaluating DFs, significantly increased as follows: by 4.47 ± 0.42 fold at the 3rd passage (PDL of 9.66) of DFs, 6.50 ± 0.40 fold at the 6th passage (PDL of 14.41) of DFs, 8.33 ± 0.25 fold at the 9th passage (PDL of 19.17) of DFs, and 12.53 ± 0.45 fold at the 12th passage (PDL of 23.90) of DFs (p < 0.05). The SEI values of doxorubicin, when evaluating ADSCs, seemed stable when ADSCs at the 3rd (PDL of 9.80), 6th (PDL of 14.56), 9th (PDL of 19.31) and 12th (PDL of 24.07) passages were used in the assays (2.83 ± 0.31 fold at 3rd passage of ADSCs, 3.47 ± 0.25 fold at the 6th passage of ADSCs, 4.00 ± 0.10 fold at the 9th passage of ADSCs, and 3.73 ± 0.21 fold at the 12th passage of ADSCs; p > 0.05) (Figure 3B).
Discussion
Anti-tumor activity screening is a popular assay in anti-cancer drug discovery. Ideally, the anti-cancer drug candidates are extracts or compounds that can inhibit cancer cell proliferation but not inhibit somatic normal cells. However, all anti-mitotic agents that can inhibit proliferation of cancer cells also inhibit normal cellular proliferation. Therefore, it is important that potential anti-cancer drugs strongly block the cancer cells but have minimal effect on normal cells. To determine this effect, normal cells such as fibroblasts have been used for a long time in virtually all anti-tumor activity screening. Dermal fibroblasts have been so popular for these screening studies because they are easy to isolate and expand. However, after using these cells for anti-tumor activity screening in some current projects, we discovered that fibroblasts may not be the most suitable cells to use as normal cell controls for screening. This report aimed to demonstrate some evidence on the range of IC50 values and SEI values of doxorubicin on dermal fibroblasts at different cell passages. We also suggest a new kind of cell for anti-tumor activity screening – adipose-derived stem cells. The results showed that the IC50 values of doxorubicin on DFs were quite different when cell passage number as well as PDLs increased, while the IC50 values were more stable on ADSCs. The reason of this observation can be explained by the senescence of fibroblasts in in vitro culture conditions. We recognized that the cell proliferation of DFs gradually decreased (data not shown) when subcultured from the 3rd (PDL of 9.66) to 12th (PDL of 23.90) passage. Indeed, this was the main characteristic of cell senescence of DFs.
It seems that the senescent DFs were easily affected by doxorubicin more so than younger cells. The IC50 values of doxorubicin were remarkably reduced from the 3rd (PDL of 9.66) to 12th (PDL of 23.90) passage. In some published studies, the senescence of fibroblasts- after the number of passages- was also reported.18,19 The changes in IC50 values affected the SEI values of doxorubicin on HepG2 and MCF-7 cells, when compared to that of DFs, which was also significantly changed.
When we used ADSCs as normal cell controls the IC50 values, as well as SEI values, were more stable. Although the IC50 values had decreased in the 9th and 12th passages compared to the 3rd, these changes were not significant (p>0.05). The SEI values of doxorubicin on HepG2 and MCF-7 cells, when compared to ADSCs, were nonsignificant (p>0.05). These results suggest that the response of ADSCs toward doxorubicin was more constant. It may be that the ADSC senescence was slower than in DFs. Many reports have shown that ADSCs can maintain their phenotype and potential to the 13th passage20 or 15th passage.21 Indeed, as stem cells, ADSCs own their self-renewal potential.21 The SEI values show the side effects of anti-cancer drugs that can also kill normal cells in patients. These values will guide the selection of potential anti-tumor candidates for further experimentation, as well as for safety evaluation of any new anti-cancer drug. Although DFs have been used for a long time, the SEI values based on DFs are so variable. Therefore, the use of DFs in anti-tumor activity screening of anti-cancer drug candidates can produce some non-exact selection. ADSCs may be are a new choice as the normal cell control for anti-tumor screening.
Conclusion
In conclusion, anti-tumor screening is the most popular assay used in drug discovery. To determine the side effects of anti-cancer drugs, as well as determining the anti-cancer drug candidates, normal cells were used to calculate the side effect index values. These values will show how these drugs kill cancer cells and normal cells. This study showed that the IC50 values and SEI values of doxorubicin on dermal fibroblasts can significantly vary among the different passages of fibroblasts, while the IC50 and SEI values are less variable when using ADSCs. Overall, our results suggest that ADSCs should be considered as an additional (second) normal cell control for anti-tumor activity screening.
Abbreviations
ADSCs, adipose-derived stem cells; DFs, dermal fibroblasts; IC50, the half maximal inhibitory concentration; PDL, population doubling level; SEI, side effect index; STR, short tandem repeat.
Acknowledgments
This work was supported by the Vietnam National University, Ho Chi Minh City, Vietnam, under grant A2015-18-01.
Author Contributions
All authors made substantial contributions to conception and design, acquisition of data, or analysis and interpretation of data; took part in drafting the article or revising it critically for important intellectual content; gave final approval of the version to be published; and agree to be accountable for all aspects of the work.
Disclosure
The authors declare no conflict of interest.
References
1. Available from: https://www.who.int/news-room/fact-sheets/detail/cancer [http://gco.iarc.fr/today/data/factsheets/cancers/11-Liver-fact-sheet.pdf].
2. Arruebo M, Vilaboa N, Sáez-Gutierrez B, et al. Assessment of the evolution of cancer treatment therapies. Cancers (Basel). 2011;3(3):3279–3330. doi:10.3390/cancers3033279
3. Garcia M-A, Kalecinski J, Oriol M, et al. Cancer patients treated with intravenous chemotherapy for the first time. What are their needs? What do they lack? A qualitative-quantitative mixed approach. Patient Prefer Adherence. 2018;12:1853–1861. doi:10.2147/PPA.S169810
4. Feinberg B, Kish J, Dokubo I, Wojtynek J, Lord K. Reports of the demise of chemotherapy have been greatly exaggerated. Am J Manag Care. 2019;25(6):270–272.
5. Luqmani YA. Mechanisms of drug resistance in cancer chemotherapy. Med Princ Pract. 2005;14(Suppl 1):35–48. doi:10.1159/000086183
6. Mansoori B, Mohammadi A, Davudian S, Shirjang S, Baradaran B. The different mechanisms of cancer drug resistance: a brief review. Adv Pharm Bull. 2017;7(3):339–348. doi:10.15171/apb.2017.041
7. Holohan C, Van Schaeybroeck S, Longley DB, Johnston PG. Cancer drug resistance: an evolving paradigm. Nat Rev Cancer. 2013;13(10):714–726. doi:10.1038/nrc3599
8. Gao G, Chen L, Huang C. Anti-cancer drug discovery: update and comparisons in yeast, drosophila, and zebrafish. Curr Mol Pharmacol. 2014;7(1):44–51. doi:10.2174/1874467207666140702113629
9. Kumar S, Bajaj S, Bodla RB. Preclinical screening methods in cancer. Indian J Pharmacol. 2016;48(5):481–486. doi:10.4103/0253-7613.190716
10. Ediriweera MK, Tennekoon KH, Samarakoon SR. In vitro assays and techniques utilized in anticancer drug discovery. J Appl Toxicol. 2019;39(1):38–71.
11. Kirana C, Record IR, McIntosh GH, Jones GP. Screening for antitumor activity of 11 species of Indonesian zingiberaceae using human MCF-7 and HT-29 cancer cells. Pharm Biol. 2003;41(4):271–276. doi:10.1076/phbi.41.4.271.15673
12. Oliveira PFD, Alves JM, Damasceno JL, et al. Cytotoxicity screening of essential oils in cancer cell lines. Rev Bras Farmacogn. 2015;25(2):183–188. doi:10.1016/j.bjp.2015.02.009
13. Hasanpourghadi M, Pandurangan AK, Karthikeyan C, Trivedi P, Mustafa MR. Mechanisms of the anti-tumor activity of methyl 2-(−5-fluoro-2-hydroxyphenyl)-1 H-benzo [d] imidazole-5-carboxylate against breast cancer in vitro and in vivo. Oncotarget. 2017;8(17):28840. doi:10.18632/oncotarget.16263
14. Nguyen M, De Ninno A, Mencattini A, et al. Dissecting effects of anti-cancer drugs and cancer-associated fibroblasts by on-chip reconstitution of immunocompetent tumor microenvironments. Cell Rep. 2018;25(13):3884–3893. e3883. doi:10.1016/j.celrep.2018.12.015
15. Manjunath C, Mahurkar N. In vitro cytotoxicity of cardamom oil, lemon oil, and jasmine oil on human skin, gastric, and brain cancer cell line. J Canc Res Therapeut. 2020.
16. Nguyen ST, Huynh KL, Nguyen HL-T, et al. Hopea odorata extract inhibits hepatocellular carcinoma via induction of caspase-dependent apoptosis. Onco Targets Ther. 2017;10:5765–5774. doi:10.2147/OTT.S150092
17. Pham P, Vu NB, Phan NL-C, et al. Good manufacturing practice-compliant isolation and culture of human adipose derived stem cells. Biomed Res Ther. 2014;4(1):1–9.
18. Raffetto JD, Mendez MV, Phillips TJ, Park HY, Menzoian JO. The effect of passage number on fibroblast cellular senescence in patients with chronic venous insufficiency with and without ulcer. Am J Surg. 1999;178(2):107–112. doi:10.1016/S0002-9610(99)00134-8
19. Jin J, Zhang T. Effects of glucose restriction on replicative senescence of human diploid fibroblasts IMR-90. Cell Physiol Biochem. 2013;31(4–5):718–727. doi:10.1159/000350090
20. Gruber H, Somayaji S, Riley F, et al. Human adipose-derived mesenchymal stem cells: serial passaging, doubling time and cell senescence. Biotech Histochem. 2012;87(4):303–311. doi:10.3109/10520295.2011.649785
21. Truong NC, Bui KH, Van Pham P. Characterization of senescence of human adipose-derived stem cells after long-term expansion. Adv Exp Med Biol. 2019;1084:109–128.
 © 2020 The Author(s). This work is published and licensed by Dove Medical Press Limited. The
full terms of this license are available at https://www.dovepress.com/terms
and incorporate the Creative Commons Attribution
- Non Commercial (unported, 3.0) License.
By accessing the work you hereby accept the Terms. Non-commercial uses of the work are permitted
without any further permission from Dove Medical Press Limited, provided the work is properly
attributed. For permission for commercial use of this work, please see paragraphs 4.2 and 5 of our Terms.
© 2020 The Author(s). This work is published and licensed by Dove Medical Press Limited. The
full terms of this license are available at https://www.dovepress.com/terms
and incorporate the Creative Commons Attribution
- Non Commercial (unported, 3.0) License.
By accessing the work you hereby accept the Terms. Non-commercial uses of the work are permitted
without any further permission from Dove Medical Press Limited, provided the work is properly
attributed. For permission for commercial use of this work, please see paragraphs 4.2 and 5 of our Terms.