Back to Journals » Breast Cancer: Targets and Therapy » Volume 17
Adipokines in Breast Cancer: Decoding Genetic and Proteomic Mechanisms Underlying Migration, Invasion, and Proliferation
Authors Ließem A ![]() , Leimer U, Germann GK, Köllensperger E
, Leimer U, Germann GK, Köllensperger E
Received 14 August 2024
Accepted for publication 4 December 2024
Published 25 January 2025 Volume 2025:17 Pages 79—102
DOI https://doi.org/10.2147/BCTT.S491277
Checked for plagiarism Yes
Review by Single anonymous peer review
Peer reviewer comments 2
Editor who approved publication: Professor Pranela Rameshwar
Anne Ließem, Uwe Leimer, Günter K Germann, Eva Köllensperger
Clinic for Plastic, Aesthetic and Reconstructive Surgery, Spine, Orthopedic and Hand Surgery, Preventive Medicine – ETHIANUM, Heidelberg, 69115, Germany
Correspondence: Eva Köllensperger, Clinic for Plastic, Aesthetic and Reconstructive Surgery, Spine, Orthopedic and Hand Surgery, Preventive Medicine – ETHIANUM, Heidelberg, 69115, Germany, Email [email protected]
Background: Adipokines, bioactive peptides secreted by adipose tissue, appear to contribute to breast cancer development and progression. While numerous studies suggest their role in promoting tumor growth, the exact mechanisms of their involvement are not yet completely understood.
Methods: In this project, varying concentrations of recombinant human adipokines (Leptin, Lipocalin-2, PAI-1, and Resistin) were used to study their effects on four selected breast cancer cell lines (EVSA-T, MCF-7, MDA-MB-231, and SK-Br-3). Over a five-day proliferation phase, linear growth was assessed by calculating doubling times and malignancy-associated changes in gene and protein expression were identified using quantitative TaqMan real-time PCR and multiplex protein analysis. Migration and invasion behaviors were quantified using specialized Boyden chamber assays.
Results: We found significant, adipokine-mediated genetic and proteomic alterations, with PCR showing an up to 6-fold increase of numerous malignancy-associated genes after adipokine-supplementation. Adipokines further altered protein secretion, such as raising the concentrations of different tumor-associated proteins up to 13-fold. Effects on proliferation varied, however, with most approaches showing significant enhancement in growth kinetics. A concentration-dependent increase in migration and invasion was generally observed, with no significant reductions in any approaches.
Conclusion: We could show a robust promoting effect of several adipokines on different breast cancer cells in vitro. Understanding the interaction between adipose tissue and breast cancer cells opens potential avenues for innovative breast cancer prevention and therapy strategies. Our findings indicate that antibodies against specific adipokines could become a beneficial component of clinical breast cancer treatment in the future.
Keywords: breast cancer, adipokines, tumor progression, adipose tissue, secretome
Introduction
Despite the development of new diagnostic approaches and therapy concepts, breast cancer remains the most frequently diagnosed cancer and the leading cause of death among women.1 Although new concepts were able to slightly decrease mortality and recurrence rates in breast cancer patients, the yet considerably high recurrence rates of 9–20% after mastectomy and the rising incidence are imperative for further research.1–3 The tumorigenesis of breast cancer is a complex process influenced by various factors, obesity and high body fat percentage seemingly playing a significant role, worsening patient outcomes and prognosis.4 In fact, for postmenopausal women, studies have reported a 10% higher likelihood of developing breast cancer for every increment of 5 BMI units above 25.5 Alleged crucial factors in the obesity related risk of breast cancer development are so-called adipokines, proteins mainly produced by adipocytes. Adipokines are recognized as key players in various inflammatory, metabolic, and immunological processes,6,7 believed to exert both paracrine and endocrine effects on tumor cells. Levels of the adipokines PAI-1, Resistin, Lipocalin-2 and Leptin are elevated in patients with obesity, and, complementary, commonly overexpressed in breast cancer cells, with high levels correlating with poor prognosis,8–18 potentially stimulating tumor cell survival, proliferation, and invasiveness. Discussions are sparking regarding their use as prognostic markers for breast cancer patients and suggesting their potential as targets for innovative therapeutic strategies.
Studies have shown that PAI-1 is implicated in the promotion of cytoskeletal reorganization and glycolytic metabolism,19 inhibition of apoptosis,20 activation of signaling pathways, such as the PI3K/AKT pathway,21 as well as immune evasion through attracting pro-tumorigenic neutrophils.8 Resistin promotes epithelial-mesenchymal transition through TLR4 and activation of STAT3,13,22 stimulates invasion through activation of the ERM family and increases the expression of vimentin, an important molecule in cancer progression.23–25 Its serum levels seem to correlate with tumor size, stage, and grade, as well as lymph node invasion.11–13,23 Exposure to Lipocalin-2 has been shown to induce overexpression of Vimentin, Fibronectin, and the transcription factor Slug, along with downregulation of E-cadherin, thereby promoting epithelial-mesenchymal transition (EMT) in breast cancer cells.14,15 Leptin, physiologically acting as a regulator of energy balance, metabolism, and appetite,26 has been suggested to promote tumor development through crosstalk with PPARs and upregulation of Bcl2. It activates several signaling pathways, including STAT3, ERK1/2, PI3K/AKT/mTOR, and NF-κB,27–30 and increases the expression of VEGF as well as the production of estrogen and its receptors.4,30 Estrogen exposure is a known risk factor for breast cancer development.
Given the great heterogeneity of primary breast cancer cells in patients, each representing diverse mutations and unique biological characteristics, the impact of adipokines on tumor promotion and behavior is likely to vary considerably.31 In this study, we examine four breast cancer subtypes, such as hormone receptor-positive (MCF-7), triple-negative (MDA-MB-231), and HER2-positive (EVSA-T, SK-BR-3) cells, to establish a comprehensive and robust model, aiming to capture a broad spectrum of the malignant processes involved in the initiation and promotion of breast cancer.
Enhanced activation of the PI3K/AKT pathway has been observed in most breast cancer subtypes. It’s downstream signaling triggers EMT via NF-κB, promotes angiogenesis through VEGF and activates key proteins like mTOR, thereby stimulating protein synthesis and proliferation.31–33 MCF-7 cells, being (ER)-positive, grow in response to estrogen. They are typically less aggressive and show low metastatic potential, retaining E-Cadherin expression and lacking Vimentin. An autocrine loop for VEGF facilitates MCF-7’s migration and invasion, however, VEGF levels typically remain lower relative to those in other cell lines.34 The triple-negative MDA-MB-231 cell line is highly aggressive and associated with the poorest prognosis among all breast cancer subtypes. The poorly differentiated cells possess great metastatic potential compared to other breast cancer subtypes, with loss of E-Cadherin, mutations in p53, enhanced MMP expression, AKT/ERK and NF-κB pathway activation driving rapid proliferation, migration and invasion.26,31 Growth of the EVSA-T and SK-BR-3 cell lines are driven by overexpression of the Human Epidermal Growth Factor Receptor 2 (HER2), which activates signaling pathways such as PI3K/AKT and MAPK/ERK, promoting proliferation, cell motility, and angiogenesis. Mutations of p53 and upregulation of the anti-apoptotic gene Bcl-2 further boost proliferation.35
Further research is needed to fully understand the mechanisms behind adipokine-mediated breast cancer promotion, so far, only very few studies have focused on adipokine-associated changes in tumor gene expression. Our study aims to analyze the distinct molecular impact of adipokines on different breast cancer cell lines, laying the groundwork for further investigation. Gaining a deeper understanding of this interplay can open avenues for innovative therapeutic strategies and drive the development of modulating drugs interfering with adipokine-mediated tumor promotion in the future.
Methods
Expansion of Tumor Cells
In the following, when talked about “BRCA” it is referred to the four breast cancer cell lines MCF-7, MDA-MB-231, EVSA-T and SK-BR-3. The cell lines were purchased from American Type Culture Collection (ATCC), Manassas, USA (#CRM-HTB-26, −30 and −22) and Leibniz-Institute DSMZ GmbH, Braunschweig, Germany (#ACC-433). If not indicated otherwise, all reagents were from Sigma-Aldrich.
Before every experimental approach, the BRCAs were expanded for 3 (EVSA-T), 4 (MDA-MB-231), 5 (MCF-7) and 6 (SK-BR-3) days in their specific expansion medium (Table 1) according to their individual speed of growth. Conducting the experiments, all cells were kept in cultivation medium containing Dulbecco’s Modified Eagle Medium (DMEM) low glucose (1g/l d-glucose) (Gibco) with 40% MCDB-201 (HiMedia), 1x insulin, transferrin, selenous acid (ITS; Corning), 1x Penicillin/Streptomycin (100 U/mL Penicillin; 0.1 mg/mL Streptomycin), 0.02µM Dexamethason, 0.1mM L-Ascorbic acid 2-phosphate, 2% Fetal Calf Serum (FCS; Biochrom), 10ng/mL rhEGF and 10ng/mL rhPDGF-BB (both from Cell Systems). Cells were seeded in 6-well plates (8,5 cm2) to numbers shown in Table 1.
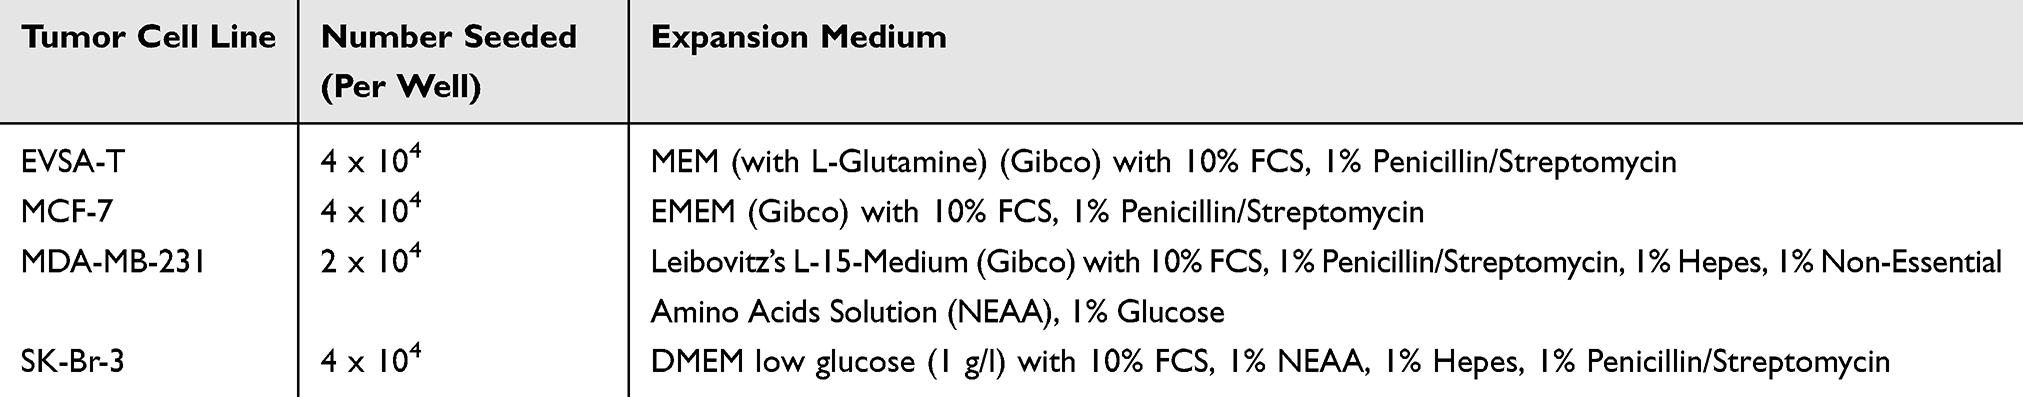 |
Table 1 Medium Used for Expansion Prior to Conduction of Experiments |
All adipokines used in this study were purchased from R&D systems. Following the manufacturer’s instruction for reconstitution, lyophilized PAI-1 was dissolved to a concentration of 500 μg/mL in sterile 50 mm sodium acetate and 100 mm NaCl, with the pH adjusted to 5.5. Resistin was reconstituted at 50 μg/mL in 2 mm acetic acid with a pH of 3.0.
Growth Kinetics
The growth kinetics of each BRCA subjected to physiological concentrations of adipokines (40 ng/mL PAI-1, 40 ng/mL Resistin, 30 ng/mL Leptin and 200 ng/mL Lipocalin-2) were compared to control cells without adipokines. For this, cells were trypsinized, and the number of vital cells of 6 individual wells per condition was determined on 5 consecutive days using a Neubauer Chamber (Marienfeld, #0640030). We omitted recording data from later days, as preliminary experiments showed that exponential growth occurred exclusively before day 5.
All cell lines were seeded at a number of 40,000 cells/well, except MDA-MB-231 (20,000 cells/well). At time of exponential growth, the doubling time was calculated using the formula: DT (in hours) = (log2 x T)/(logY - logX), with T = cultivation time (in h), Y = cell count at end of T, and X = cell count at beginning of T. The mean doubling times of both groups were analyzed for significance using Student’s t-test.
Gene Expression
The expression of 184 tumor-associated genes was analyzed with the aid of real-time qPCR using TaqMan technology. Tumor cells proliferated for 4 days under two conditions (BRCA without adipokines and BRCA with 40 ng/mL PAI-1, 40 ng/mL Resistin, 30 ng/mL Leptin or 200 ng/mL Lipocalin-2) and frozen in Trizol (Invitrogen, #15596026) were compared for differences in their expression profile. Using the PureLink RNA Mini Kit (Invitrogen, #12183025) and PureLink DNase-Set (Invitrogen, #12185-010) the RNA was isolated, and its quantity determined with the Qubit RNA HS Assay Kit (Invitrogen, #Q32852).
With the help of Reverse Transcriptase (Applied Biosystems, #4308228), 1 µg of RNA was transcribed into cDNA in the Mastercycler EP Gradient S (Eppendorf, #S5345) and its amount was determined leveraging the Qubit ssDNA HS Kit (Invitrogen, Q10212).
Predesigned TaqMan Real Time PCR plates of the company AppliedBiosystems facilitated the subsequent analysis of 184 relevant genes in the fields “Human Chemokines” (#4418861) and “Molecular Mechanism of Cancer” (#4418938) carried out by the StepOne Plus Cycler (Software Vers. 2.2.2, AppliedBiosystems), with 5 ng of cDNA per well, diluted by TaqMan Fast Advanced MasterMix of the same company (#4444554) and nuclease free water.
The analysis was performed with the Expression Suite software (Vers. 1.3, ThermoFisher), which generated fold values representing the gene expression difference compared to the control.
The appropriate housekeeping gene for each pair was individually selected by the ExpressionSuite software from the genes GUSB, HPRT1, or GAPDH.
Invasiveness
The impact of adipokines on the invasiveness of BRCA cell lines was assessed in a concentration-dependent manner, using the QCM Chemotaxis Cell Migration Assay (#ECM 508) and QCM ECMatrix Cell Invasion Assay (#ECM 550) from the company Merck Millipore, each with a pore size of 8 µm. The different concentrations were deployed in replicates of six.
As some adipokines were reconstituted before use, the reconstitution solution was tested for any interference in a fifth approach (Table 2).
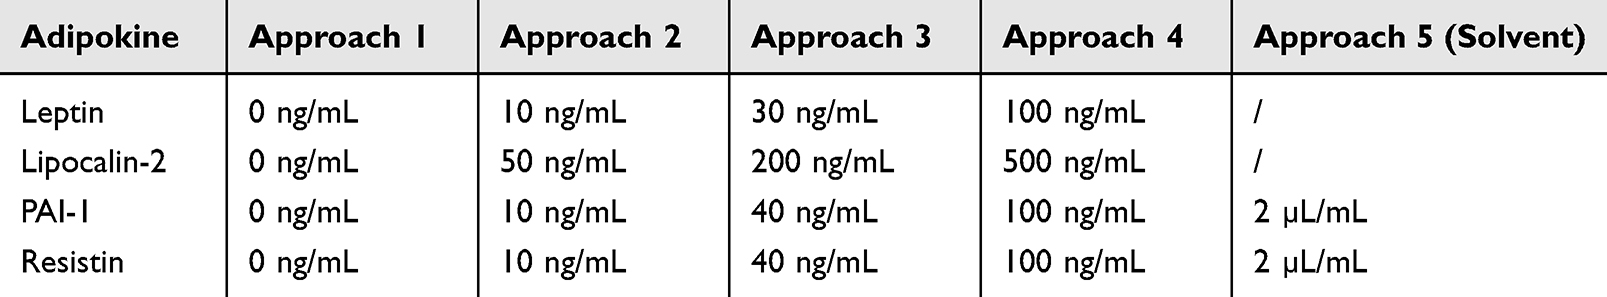 |
Table 2 Concentrations of Adipokines and Reconstitution Solution Used in Migration and Invasion Assay |
Migration Assay
Tumor cells were cultivated in their specific expansion medium and seeded at a number of 6000 cells/well on the membrane of each transwell-insert situated in their respective bottom well filled with 500 µL of adipokine-supplemented cultivation Medium.
After a cultivation of 24 hours, the medium was aspirated, the inserts subjected to 400 µL of Cell Stain for 20 minutes and subsequently washed in water to remove excessive stain.
The inner membrane of the insert was freed of non-migrated cells using cotton swabs, and its outer wall was cleaned of residual stain with Kim Wipes (Kimberly-Clark, #7552) soaked in 80% ethanol.
Upon drying, the inserts were placed in 300 µL of extraction buffer for 15 minutes on a platform rocker. Colorimetric measurement of 100 µL per sample was performed in technical duplicates, using the Infinite M Nano plate reader from Tecan, at a wavelength of 560 nm (Magellan Pro, Vers. 7.5).
ANOVA analysis was performed using SPSS software, testing for significant differences between groups.
Invasion Assay
Tumor cells were cultivated in their specific expansion medium and seeded at a number of 6000 cells/well on the membrane of each transwell-insert, previously incubated by serum-free cultivation medium for one hour. The inserts were then situated in its respective bottom well filled with 500 µL of adipokine-induced cultivation Medium.
After a cultivation of 72 hours, the medium was aspirated, and two cotton swabs were used to remove the ECM-Matrix adhering to the membrane. Each insert was stained with 400 µL of Cell Stain from the kit and washed in double distilled water after 20 minutes.
The inner membrane of the insert was freed of non-migrated cells using cotton swabs, and its outer wall was cleaned of residual stain with a Kim Wipe (Kimberly-Clark, #7552) soaked in 80% ethanol. Upon drying, the inserts were placed in 300 µL of extraction buffer for 15 minutes on a platform rocker. Colorimetric measurement of 100 µL per sample was performed in technical duplicates, using the Infinite M Nano plate reader from Tecan, at a wavelength of 560 nm.
ANOVA analysis was performed using SPSS software, testing for significant differences between groups.
Protein Expression
The conditioned supernatants of tumor cells proliferated for 4 days under different conditions (BRCA without adipokines and BRCA with 40 ng/mL PAI-1, 40 ng/mL Resistin, 30 ng/mL Leptin or 200 ng/mL Lipocalin-2) were analyzed for their content of 27 cytokines (Fibroblast growth factor (FGF) basic, Eotaxin, granulocyte colony-stimulating factor (G-CSF), granulocyte-macrophage colony-stimulating factor (GM-CSF), interferon (IFN)-γ, interleukin (IL)-1β, IL-1ra, IL-2, IL-4, IL-5, IL-6, IL-7, IL-8, IL-9, IL-10, IL-12 (p70), IL-13, IL-15, IL-17A, interferon-gamma induced protein (IP)-10, Monocyte chemoattractant protein (MCP)-1, Macrophage inflammatory protein (MIP)-1α, MIP-1β, platelet-derived growth factor (PDGF)-BB, C-C motif chemokine ligand (CCL)5, Tumor Necrosis Factor (TNF)-α, Vascular endothelial growth factor (VEGF)) using the Bio-Plex Pro Human Cytokine 27-plex Assay (#M500KCAF0Y) and 3 additional cytokines (hepatocyte growth factor (HGF) (#171B6008M), IFN-α2 (#171B6010M) and monokine induced by gamma-INF (MIG) (#171B6015M)) from the manufacturer Bio-Rad.
Furthermore, the levels of six adipokines (Plasminogen activator inhibitor (PAI)-1, Resistin, Lipocalin-2, Adipsin, Adiponectin and Leptin) were determined with the Human Adipokine Magnetic Bead Panel (#HADK1MAG-61K) and Human Bone Magnetic Bead Panel (#HBNMAG-51K) by Merck Millipore.
All assays were carried out following the instructions of the manufacturer, using the conditioned medium of six separate wells per condition pooled together.
The Bio-Plex 200 Analyzer by Bio-Rad and its software Bio-Plex Manager 6.2.0.175 were used to measure the fluorescent signals, comparing it to the standard values of the respective standard curves.
Six replicates per sample were measured and their mean fluorescent intensity was calculated to create fold values comparing the respective approach to its control.
Results
Growth Kinetics
Supplementation of PAI-1 had significant impact on the growth kinetics of three BRCA cell lines with a decrease in the proliferation rate for MDA-MB-231 (p = <0.001) and an increase for EVSA-T (p = <0.001) and SK-BR-3 (p = 0.009) (Figure 1a).
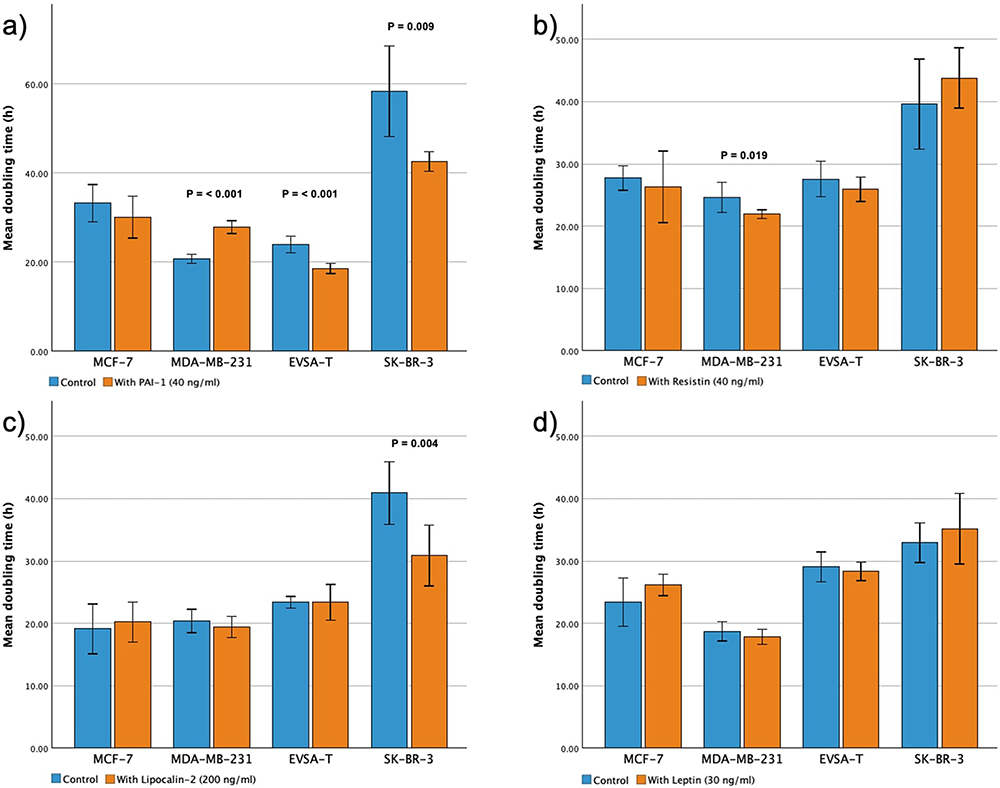 |
Figure 1 Effect of recombinant adipokines (PAI-1, Resistin, Lipocalin-2 and Leptin) on the proliferation rate of the breast cancer cell lines MCF-7, MDA-MB-231, EVSA-T and SK-BR-3. Each bar represents the mean doubling time of 6 biological replicates. Doubling times were calculated at the time of exponential growth during a 5-day cultivation period, using the formula: DT (in hours) = (log2 x (T)/(logY - logX), with T = cultivation time (in h), Y = cell count at end of T, and X = cell count at beginning of T. Statistical differences were analyzed using Student’s t-test. P-values are presented above their respective bars (a) 40 ng/mL PAI-1, (b) 40 ng/mL Resistin, (c) 200 ng/mL Lipocalin-2, (d) 30 ng/mL Leptin. |
Adding Resistin to the cell culture led to a significant increase in the growth kinetics of MDA-MB-231 with p = 0.019 (Figure 1b) and same was shown for Lipocalin-2 concerning SK-BR-3 (p = 0.004) (Figure 1c). For MCF-7 no significant change in growth kinetics could be shown.
Leptin did not affect cellular proliferation of any BRCA cell line significantly (Figure 1d).
Gene Expression
In our different BRCA cell lines cultures the presence of added adipokines at concentrations of 30 ng/mL (Leptin), 40 ng/mL (PAI-1/Resistin) and 200 ng/mL (Lipocalin) led to relevant changes in the expression of malignancy-associated genes on day 4 of proliferation compared to its control approach without added adipokines.
For the sake of clarity, only gene expression increases of 2.5-fold or more, as well as downregulations to 0.4-fold or less, are presented (Tables 3–7) and discussed. For a different perspective, Table 3 provides an overview of the genes most influenced by the considered adipokines overall.
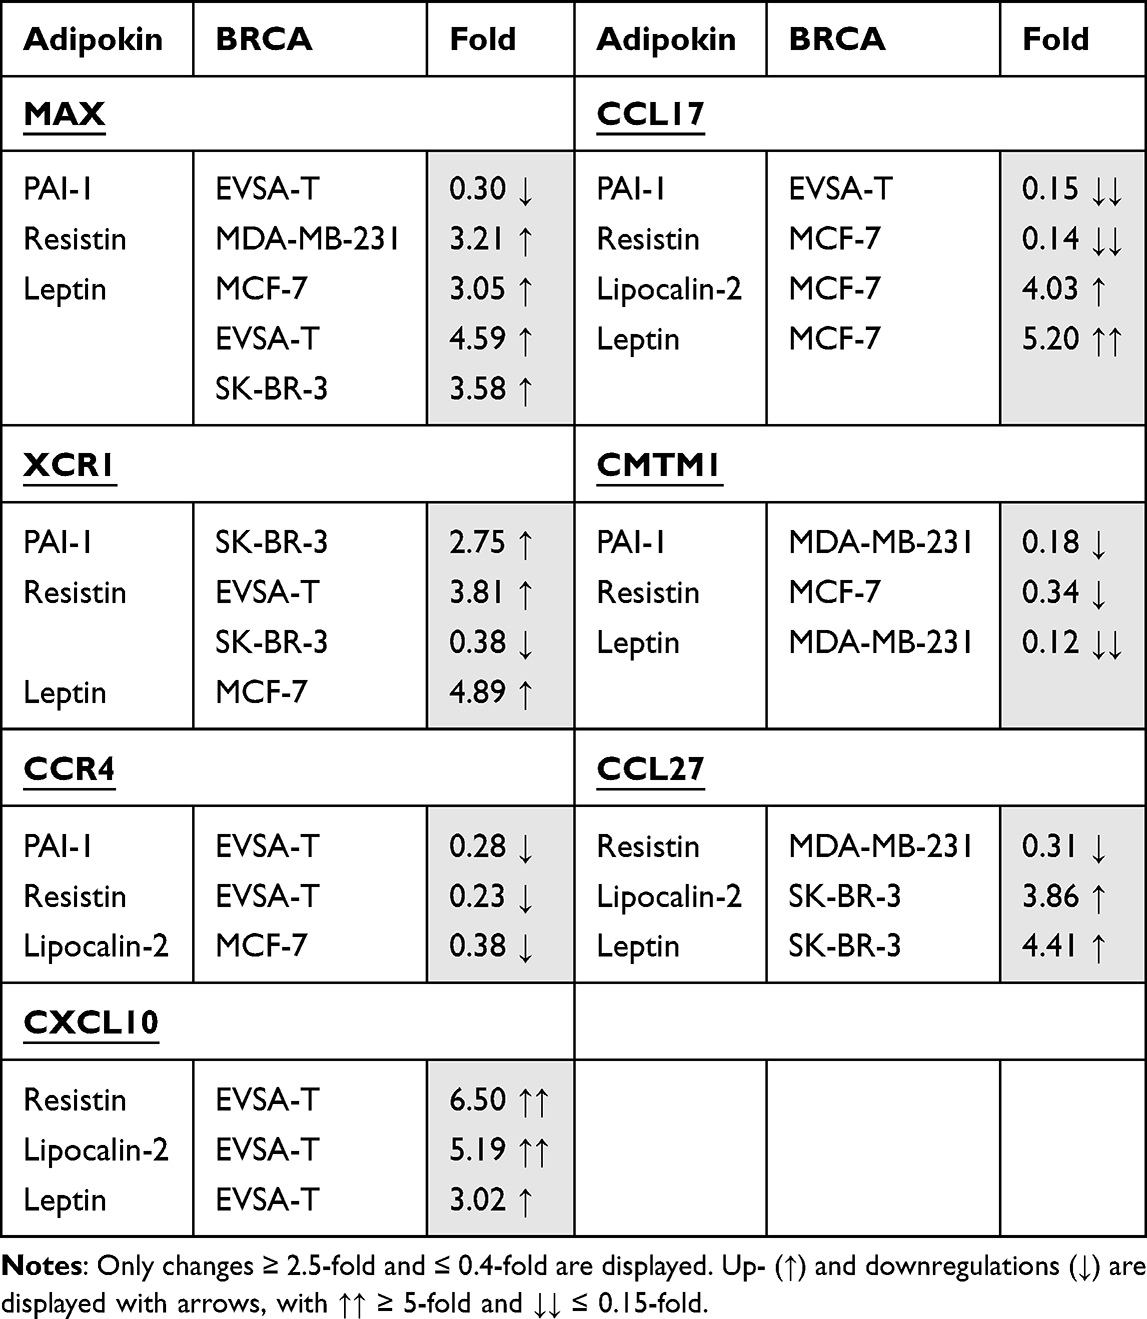 |
Table 3 Overview of the Genes Most Frequently Influenced in MCF-7, MDA-MB-231, EVSA-T, and SK-Br-3 When Exposed to 40 ng/ml PAI-1, 40 ng/ml Resistin, 200 ng/ml Lipocalin-2, or 30 ng/ml Leptin for 4 Days |
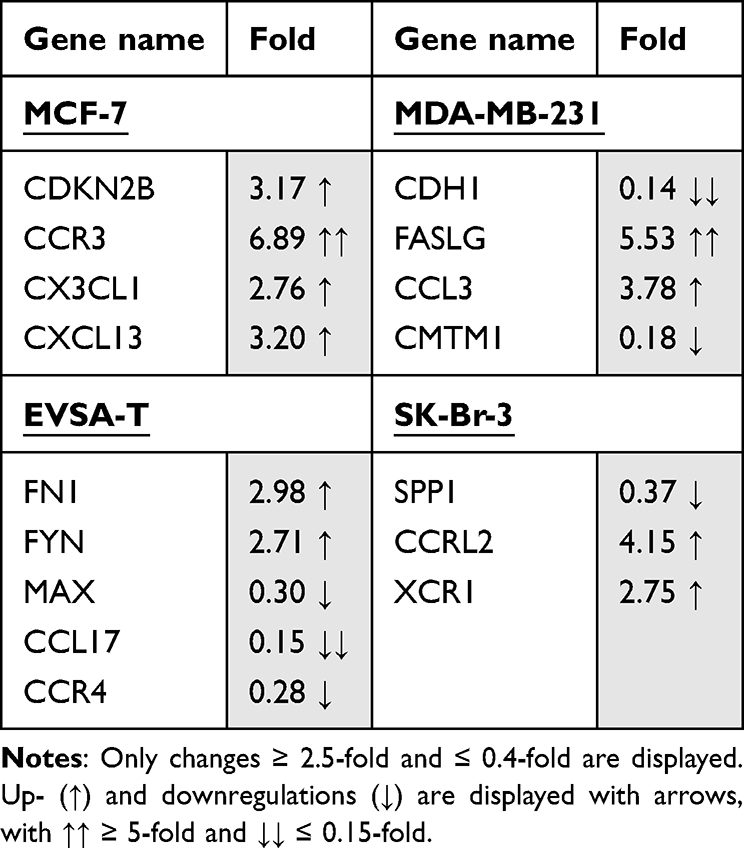 |
Table 4 Effect of 40 ng/ml Recombinant PAI-1 on the Gene Expression of the Breast Cancer Cell Lines MCF-7, MDA-MB-231, EVSA-T, and SK-Br-3 on Day 4 of Cultivation |
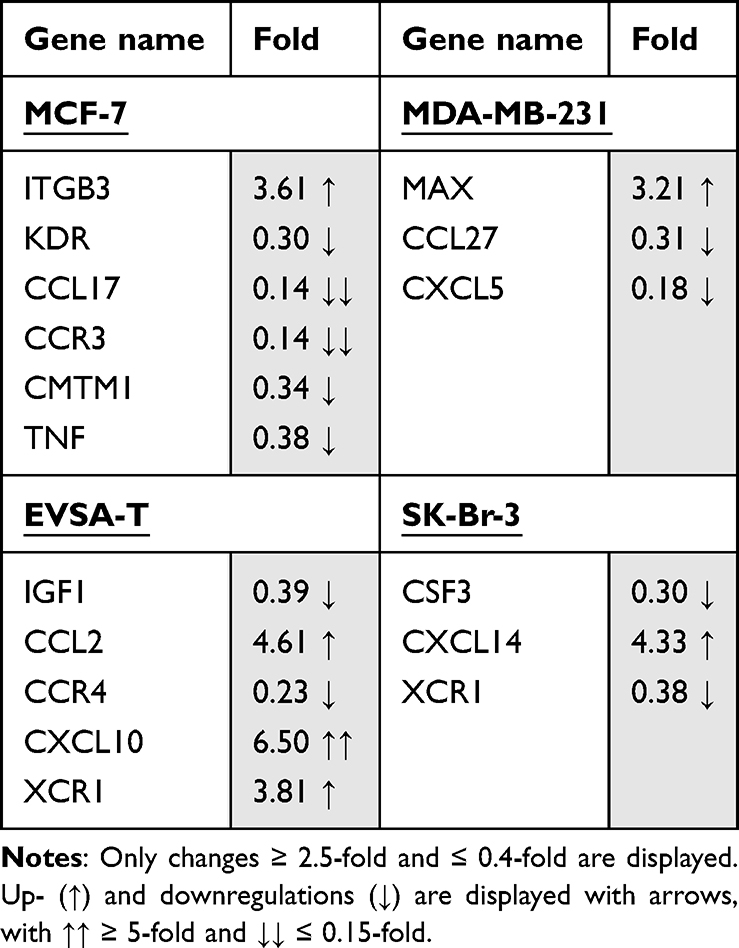 |
Table 5 Effect of 40 ng/ml Recombinant Resistin on the Gene Expression of the Breast Cancer Cell Lines MCF-7, MDA-MB-231, EVSA-T, and SK-Br-3 on Day 4 of Cultivation |
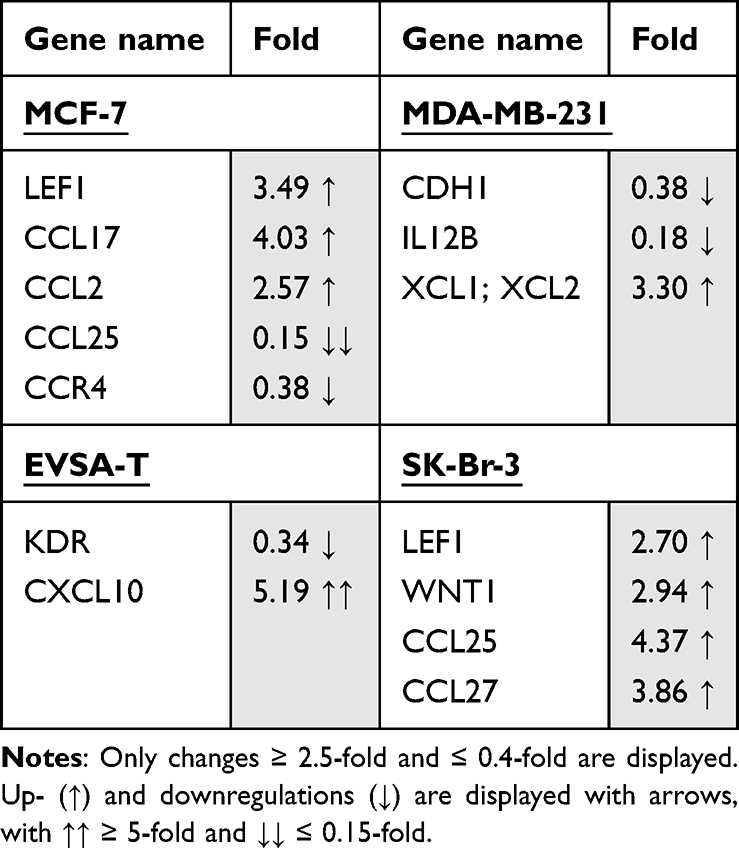 |
Table 6 Effect of 200 ng/ml Recombinant Lipocalin-2 on the Gene Expression of the Breast Cancer Cell Lines MCF-7, MDA-MB-231, EVSA-T, and SK-Br-3 on Day 4 of Cultivation |
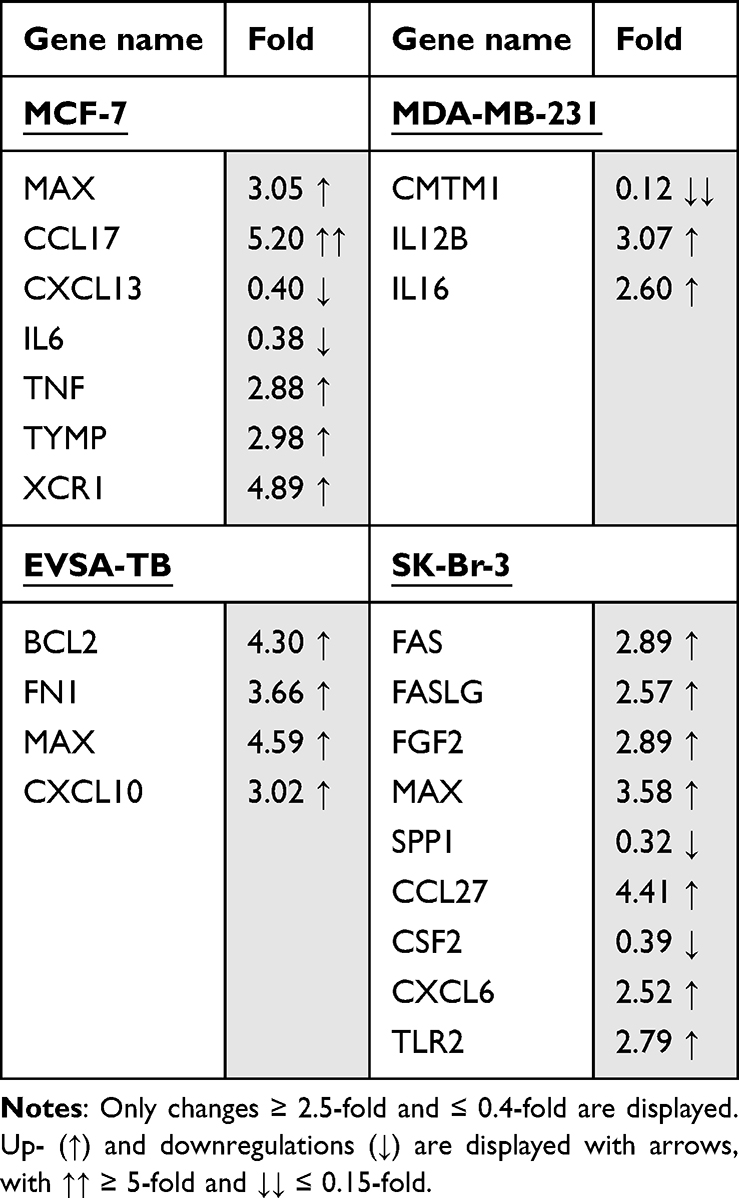 |
Table 7 Effect of 30 ng/ml Recombinant Leptin on the Gene Expression of the Breast Cancer Cell Lines MCF-7, MDA-MB-231, EVSA-T, and SK-Br-3 on Day 4 of Cultivation |
In the following descriptive report fold values are shown in brackets behind their corresponding gene.
Effect of PAI-1 on BRCA Gene Expression
For MCF-7, PAI-1 led to an upregulation of the genes CDKN2B (3.17), CCR3 (6.89), CX3CL1 (2.76) and CXCL13 (3.2). Relevant downregulations could not be found.
For MDA-MB-231, an upregulation of the genes FASLG (5.53) and CCL3 (3.78) as well as a downregulation of the genes CDH1 (0.14) and CMTM1 (0.18) was demonstrated.
The gene-expression of FN1 (2.98) and FYN (2.71) was increased in EVSA-T, while its expression of MAX (0.30), CCL17 (0.15) and CCR4 (0.28) decreased.
SK-BR-3 showed an increase of the genes CCRL2 (4.15) and XCR1 (2.75) and a decrease of SPP1 (0.37) with supplementation of PAI-1 to the cell culture.
Effect of Resistin on BRCA Gene Expression
For MCF-7, an upregulation of the gene ITGB3 (3.61) and downregulation of the genes KDR (0.30), CCL17 (0.14), CCR3 (0.14), CMTM1 (0.34) and TNF-α (0.38) were determined when subjected to Resistin.
MDA-MB-231 reacted with an upregulation of the gene MAX (3.21) and downregulation of the genes CCL27 (0.31) and CXCL5 (0.18) while for EVSA-T an increase of CCL2 (4.61), CXCL10 (6.50) and XCR1 (3.81) as well as a decrease of the genes IGF1 (0.39) and CCR4 (0.23) was shown.
SK-BR-3 underwent an increase of the gene CXCL14 (4.33) and a decrease of CSF3 (0.30) and XCR1 (0.38) owing to Resistin.
Effect of Lipocalin-2 on BRCA Gene Expression
Addition of Lipocalin-2 to the cell culture provoked an increase of the gene expression of LEF1 (3.49), CCL17 (4.03) and CCL2 (2.57) and a decrease of CCL25 (0.15) and CCR4 (0.38), for MCF-7.
For MDA-MB-231, an upregulation of XCL1/XCL2 (3.30) and a downregulation of CDH1 (0.38) as well as IL12B (0.18) was shown.
EVSA-T encountered upregulation of the gene CXCL10 (5.19) and downregulation of KDR (0.34), whereas for SK-BR-3 only upregulations of the genes LEF1 (2.70), WNT1 (2.94), CCL25 (4.37) and CCL27 (3.86) were determined.
Effect of Leptin on BRCA Gene Expression
For MCF-7, Leptin led to an upregulation of the five genes MAX (3.05), CCL17 (5.20), TNF-α (2.88), TYMP (2.98) and XCR1 (4.89) as well as to a downregulation of CXCL13 (0.40) and IL6 (0.38).
MDA-MB-231 reacted with the upregulation of the genes IL12B (3.07) and IL16 (2.60) and downregulation of CMTM1 (0.12).
For EVSA-T, the genes BCL2 (4.30), FN1 (3.66), MAX (4.59) and CXCL10 (3.02) showed increase in their expression due to Leptin, but no clear decrease.
SK-BR-3 reacted with the upregulation of the 7 genes FAS (2.89), FASLG (2.57), FGF2 (2.89), MAX (3.58), CCL27 (4.41), CXCL6 (2.52) and TLR2 (2.79), while SPP1 (0.32) and CSF2 (0.39) underwent downregulation.
Migration Assay
PAI-1
The addition of PAI-1 led to significant increases in the migration capacity of all four BRCA cell lines (Figure 2a–d). At a concentration of 100 ng/mL a significant increase could be shown with p = < 0.001 for all cell lines in comparison to the control approach. For all BRCAs but MDA-MB-231 (p = 0.029) the same significance was demonstrated for 40 ng/mL (p = <0.001). All cell lines but MCF-7 showed a significant increase of migration activity at 10 ng/mL with p = <0.001 for EVSA-T and SK-BR-3 and p = 0.019 for MDA-MB-231. For MCF-7 (p = 0.012) and EVSA-T (p = 0.001) a further increase of migration could be demonstrated by increasing the concentration of PAI-1 from 10 to 100 ng/mL, 10 to 40 ng/mL (MCF-7, p = 0.035) and 40 to 100 ng/mL (EVSA-T, p = 0.016).
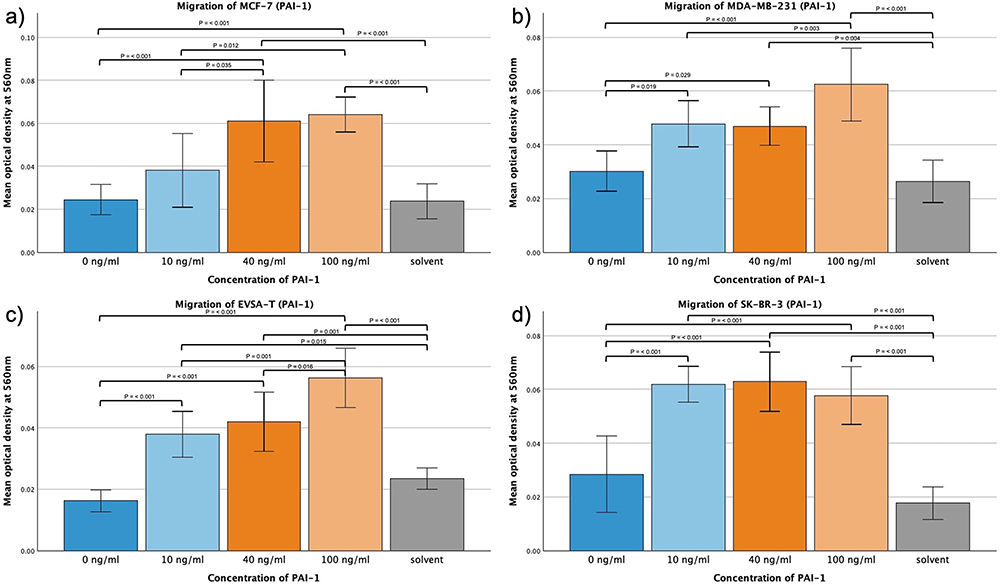 |
Figure 2 Effect of increasing amounts of recombinant PAI-1 on the migratory activity of the breast cancer cell lines MCF-7, MDA-MB-231, EVSA-T, and SK-BR-3. The Y-axis displays optical density readings measured at a wavelength of 560 nm. Significance bars and p-values indicate the significance between the groups, assessed with ANOVA analysis. Solvent was used to reconstitute the lyophilized PAI-1 upon its addition to the medium. Its sole impact was assessed at the concentration employed in the approach featuring the highest concentration of reconstituted PAI-1, aiming to reveal potential interference. (a) 0 ng/mL, (b) 10 ng/mL, (c) 40 ng/mL, (d) 100 ng/mL). |
At a concentration of 100 ng/mL, all cell lines also exhibited a significant migratory increase compared to the approach containing the solvent at the concentration present in the 100 ng/mL approach (p = <0.001), therefore excluding the solvent as the sole cause for the increased migration.
Resistin
The addition of Resistin led to significant increases in the migration capacity of all four BRCA cell lines (Figure 3a–d). At a concentration of 100 ng/mL a significant increase could be shown with p = <0.001 for all cell lines in comparison to the control approach.
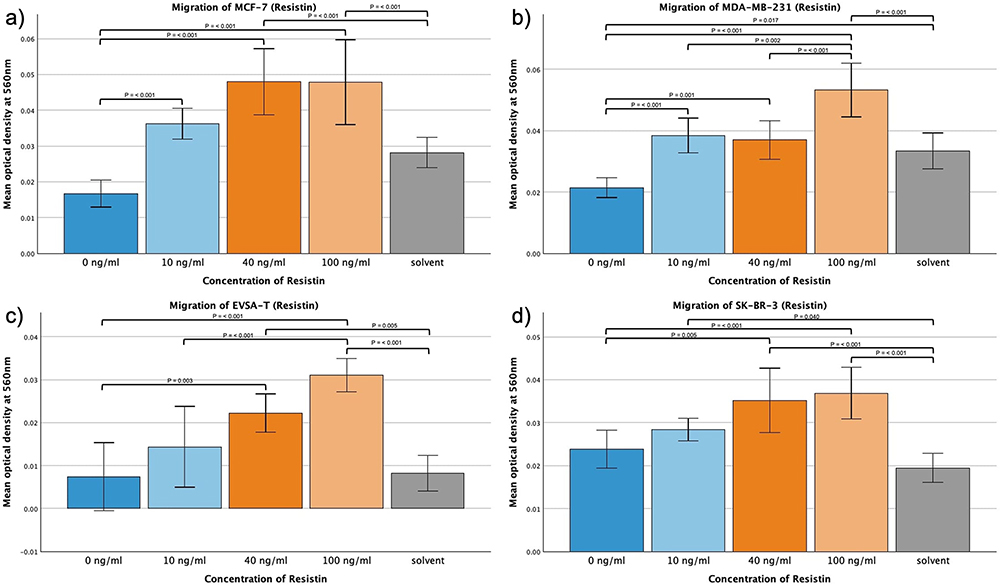 |
Figure 3 Effect of increasing amounts of recombinant Resistin on the migratory activity of the breast cancer cell lines MCF-7, MDA-MB-231, EVSA-T, and SK-BR-3. The Y-axis displays optical density readings measured at a wavelength of 560 nm. Significance bars and p-values indicate the significance between the groups, assessed with ANOVA analysis. Solvent was used to reconstitute the lyophilized Resistin upon its addition to the medium. Its sole impact was assessed at the concentration employed in the approach featuring the highest concentration of reconstituted Resistin, aiming to reveal potential interference. (a) 0 ng/mL, (b) 10 ng/mL, (c) 40 ng/mL, (d) 100 ng/mL). |
Same could be demonstrated at a concentration of 40 ng/mL Resistin (p = <0.001 (MCF-7/MDA-MB-231), p = 0.003 (EVSA-T), p = 0.005 (SK-BR-3)), and in the case of MCF-7 and MDA-MB-231 even at a concentration of 10 ng/mL (p = <0.001).
The augmentation from 10 ng/mL to 100 ng/mL (for MDA-MB-231 also 40 ng/mL to 100 ng/mL (p = 0.002)) led to a significant enhancement in the migratory capacity of MDA-MB-231 and EVSA-T (p = 0.002 and p = <0.001, respectively), whereas MCF-7 and SK-BR-3 appeared to plateau at 40 ng/mL.
At a concentration of 100 ng/mL, all cell lines also exhibited a significant migratory increase compared to the control approach containing the solvent at the concentration present in the 100 ng/mL approach (p = <0.001), therefore excluding the solvent as the sole cause for the increased migration.
Lipocalin-2
No significant effect was shown for MCF-7 when subjected to 50, 200 or 500 ng/mL Lipocalin-2. However, MDA-MB-231, EVSA-T and SK-BR-3 exhibited a significant increase in their migratory capacity when subjected to 500 ng/mL (p = 0.006, p = <0.001, p = 0.002, respectively). Same effect was obtained at 200 ng/mL for MDA-MB-231 and EVSA-T (p = <0.001), EVSA-T as well displaying an increase at 50 ng/mL (p = 0.023).
MDA-MB-231 appeared to plateau at 200 ng/mL, whereas EVSA-T continued to exhibit a notable increase when shifting from 200 ng/mL to 500 ng/mL (p = 0.009) (Figure 4a-d).
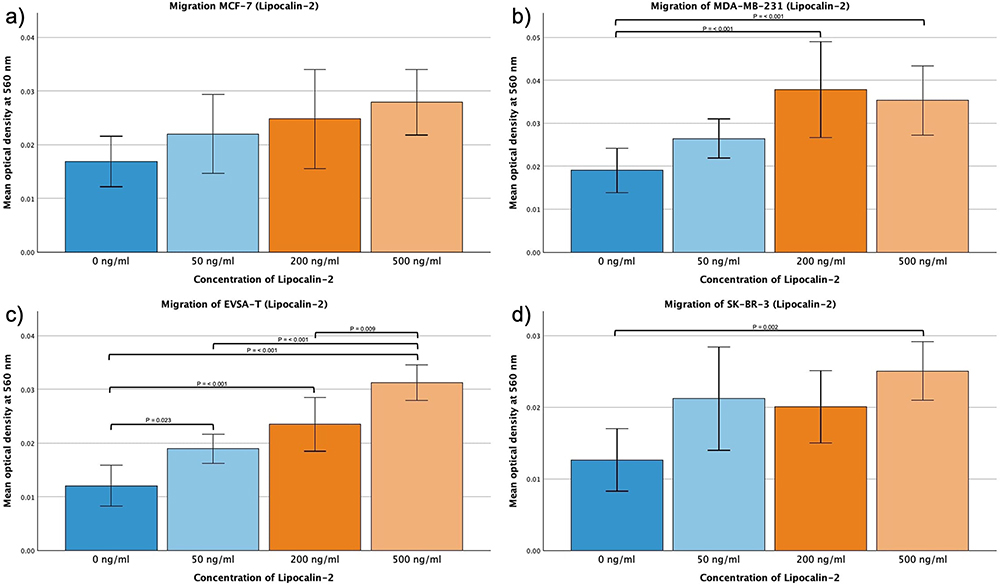 |
Figure 4 Effect of increasing amounts of recombinant Lipocalin-2 on the migratory activity of the breast cancer cell lines MCF-7, MDA-MB-231, EVSA-T, and SK-BR-3. The Y-axis displays optical density readings measured at a wavelength of 560 nm. Significance bars and p-values indicate the significance between the groups, assessed with ANOVA analysis. (a) 0 ng/mL, (b) 50 ng/mL, (c) 200 ng/mL, (d) 500 ng/mL). |
Leptin
For EVSA-T no significant effect of Leptin could be determined when subjected to 10, 30 or 100 ng/mL. MCF-7, MDA-MB-231 and SK-BR-3, however, increased their migratory activity when exposed to 100 ng/mL Leptin with p = <0.001, MCF-7 and MDA-MB also demonstrating a significant effect increasing the dosage to only 30 ng/mL (p = 0.045 and p = 0.024).
MCF-7 and MDA-MB-231 seemed to enhance their migration correspondingly to the augmentation of the concentration with 10 ng/mL to 100 ng/mL showing a significant effect (p = 0.008 (MCF-7), p = 0.041 (MDA-MB-231)).
SK-BR-3 migration significantly increased when exposed to 10 ng/mL Resistin (p = 0.009), however, no further significant increase could be seen when using higher concentrations (Figure 5a–d).
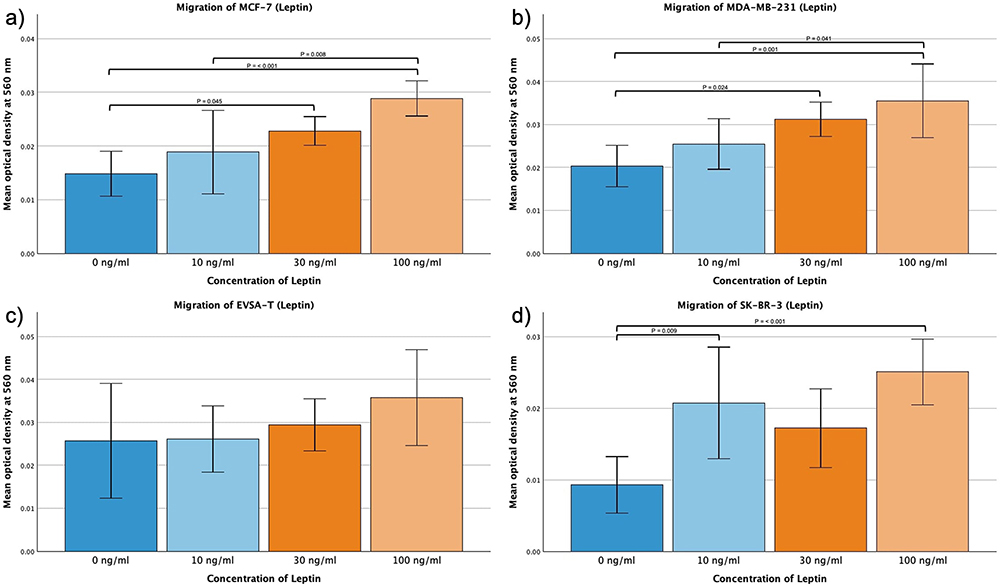 |
Figure 5 Effect of increasing amounts of recombinant Leptin on the migratory activity of the breast cancer cell lines MCF-7, MDA-MB-231, EVSA-T, and SK-BR-3. The Y-axis displays optical density readings measured at a wavelength of 560 nm. Significance bars and p-values indicate the significance between the groups, assessed with ANOVA analysis. (a) 0 ng/mL, (b) 10 ng/mL, (c) 30 ng/mL, (d) 100 ng/mL). |
Invasion Assay
PAI-1
MCF-7 displayed significant increase in invasion when subjected to 40 and 100 ng/mL PAI-1 (p = <0.001) and the invasion of MDA-MB-231 was increased for 100 ng/mL PAI-1 when compared to 10 and 40 ng/mL (p = <0.001). EVSA-T and SK-BR-3 did not show significant changes across different concentrations of PAI-1.
In no approach the solvent increased invasion compared to the control approach (Figure 6a–d).
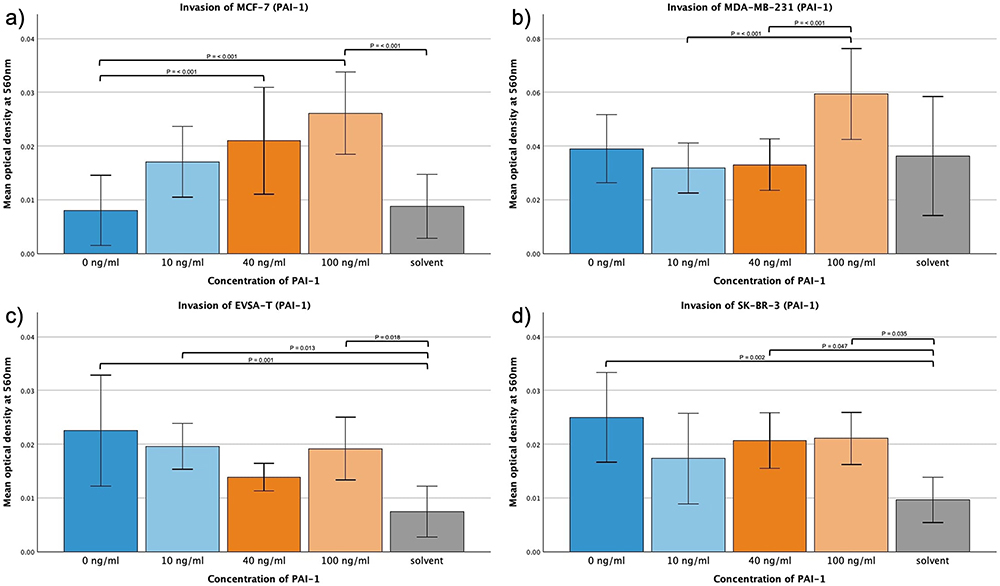 |
Figure 6 Effect of increasing amounts of recombinant PAI-1 on the invasive activity of the breast cancer cell lines MCF-7, MDA-MB-231, EVSA-T, and SK-BR-3. The Y-axis displays optical density readings measured at a wavelength of 560 nm. Significance bars and p-values indicate the significance between the groups, assessed with ANOVA analysis. Solvent was used to reconstitute the lyophilized PAI-1 upon its addition to the medium. Its sole impact was assessed at the concentration employed in the approach featuring the highest concentration of reconstituted PAI-1, aiming to reveal potential interference. (a) 0 ng/mL, (b) 10 ng/mL, (c) 40 ng/mL, (d) 100 ng/mL). |
Resistin
No significant alterations in the invasive behavior of the four BRCA cell lines could be attributed to Resistin (Figure 7a–d). However, MDA-MB-231 showed a significant increase in invasion viewing 40 ng/mL of Resistin in comparison to the approach with solvent (p = 0.036). EVSA-T displayed a significant decrease at the same concentration when compared to the solvent (p = 0.047).
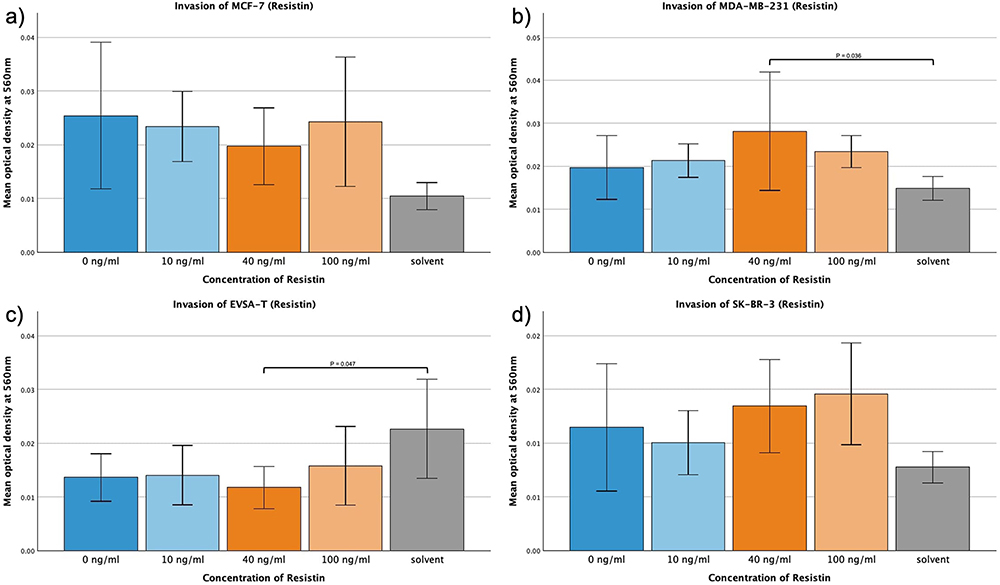 |
Figure 7 Effect of increasing amounts of recombinant Resistin on the invasive activity of the breast cancer cell lines MCF-7, MDA-MB-231, EVSA-T, and SK-BR-3. The Y-axis displays optical density readings measured at a wavelength of 560 nm. Significance bars and p-values indicate the significance between the groups, assessed with ANOVA analysis. Solvent was used to reconstitute the lyophilized Resistin upon its addition to the medium. Its sole impact was assessed at the concentration employed in the approach featuring the highest concentration of reconstituted Resistin, aiming to reveal potential interference. (a) 0 ng/mL, (b) 10 ng/mL, (c) 40 ng/mL, (d) 100 ng/mL). |
Lipocalin-2
For Lipocalin-2 no change of the invasion capacity of the four BRCA could be shown (Figure 8a–d).
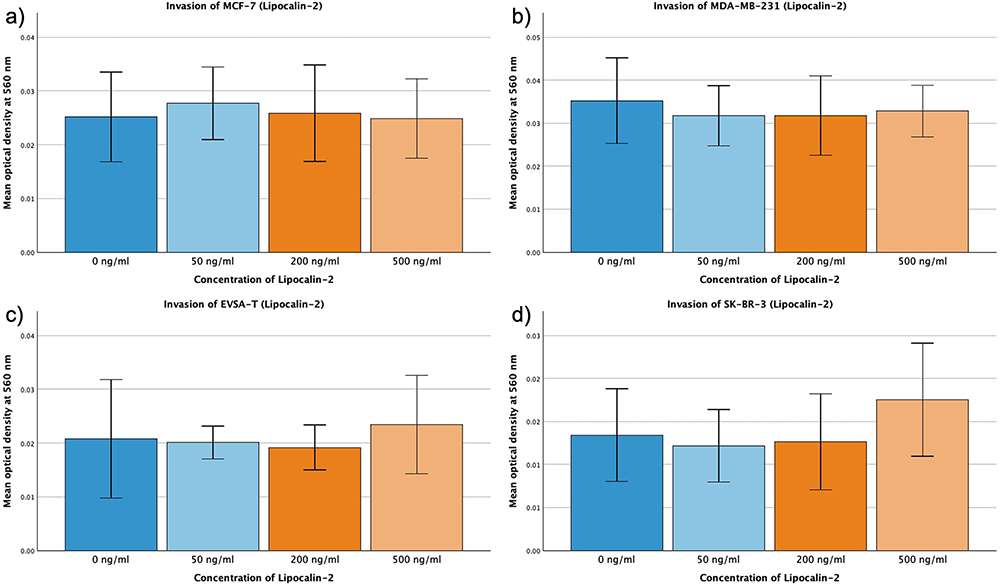 |
Figure 8 Effect of increasing amounts of recombinant Lipocalin-2 on the invasive activity of the breast cancer cell lines MCF-7, MDA-MB-231, EVSA-T, and SK-BR-3. The Y-axis displays optical density readings measured at a wavelength of 560 nm. Significance bars and p-values indicate the significance between the groups, assessed with ANOVA analysis. (a) 0 ng/mL, (b) 50 ng/mL, (c) 200 ng/mL, (d) 500 ng/mL). |
Leptin
For MCF-7, EVSA-T and SK-BR-3 the mean invasion capacity decreased as response to the addition of Leptin, however without statistical significance.
MDA-MB-231 displayed augmentation in its invasive behavior as result to increasing concentrations of Leptin from 0 ng/mL to 30 or 100 ng/mL and from 10 ng/mL to 100 ng/mL (p = <0.001).
Furthermore, for MDA-MB-231 an increase of invasive capacity with rising Leptin from 10 ng/mL to 30 ng/mL was determined with a significance of p = 0.01 (Figure 9a–d).
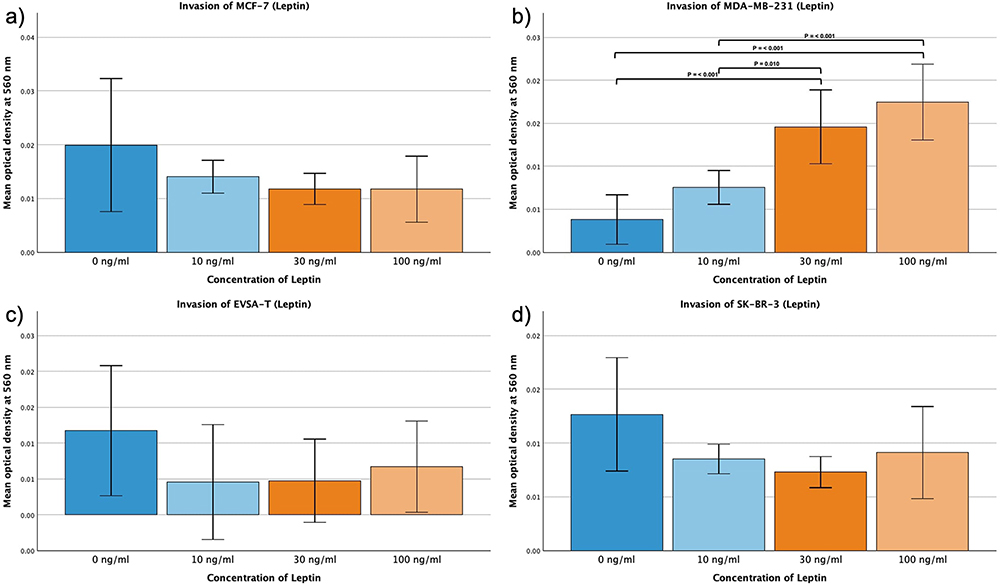 |
Figure 9 Effect of increasing amounts of recombinant Leptin on the invasive activity of the breast cancer cell lines MCF-7, MDA-MB-231, EVSA-T, and SK-BR-3. The Y-axis displays optical density readings measured at a wavelength of 560 nm. Significance bars and p-values indicate the significance between the groups, assessed with ANOVA analysis. (a) 0 ng/mL, (b) 10 ng/mL, (c) 30 ng/mL, (d) 100 ng/mL). |
Protein Expression
In BRCA the presence of added adipokines at concentrations of 30 ng/mL (Leptin), 40 ng/mL (PAI-1/Resistin), and 200 ng/mL (Lipocalin), respectively, led to relevant changes in protein expression on day 4 of proliferation compared to its control approach without added adipokines.
Tables 8–11 only show measurement pairs in which one or more values were greater than 5 pg/mL and absolute change exceeded 5 pg/mL. Smaller values were not taken into account, as they might be subject to measurement inaccuracies and display little significance. Levels of the respective added adipokine are displayed independently of level and fold. Protein expression increases by 1.05-fold or more and decreases by 0.95-fold or less, are marked with an arrow for up- (↑) and downregulation (↓), where ↑↑ represents changes ≥1.35-fold and ↓↓ denotes changes ≤0.85-fold.
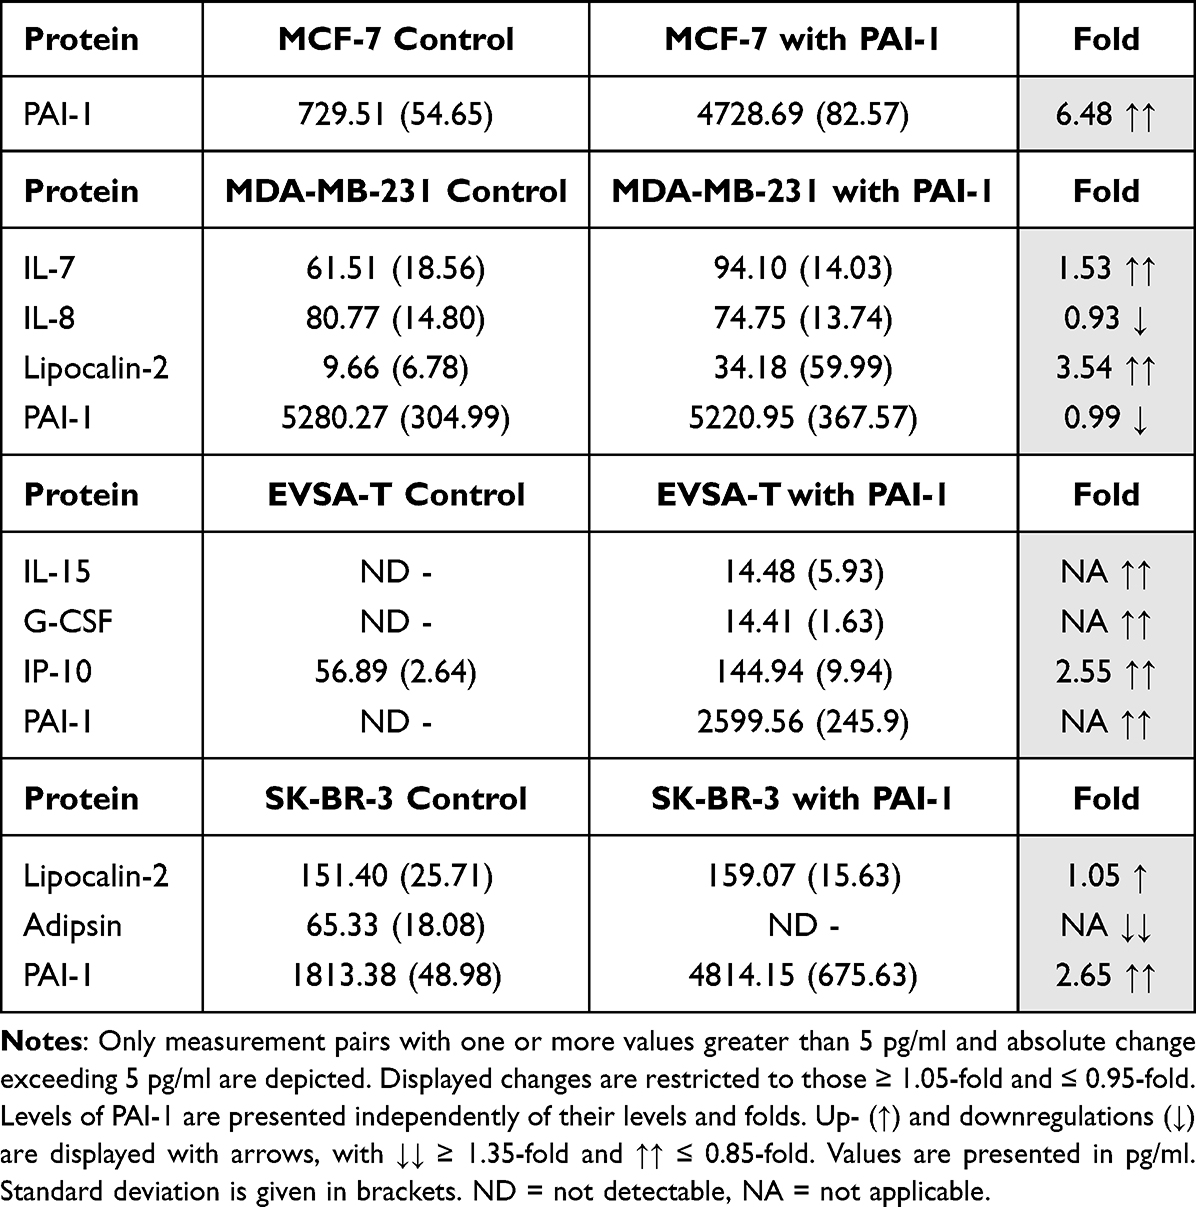 |
Table 8 Effect of 40 ng/ml Recombinant PAI-1 on the Protein Expression of the Breast Cancer Cell Lines MCF-7, MDA-MB-231, EVSA-T, and SK-BR-3 on Day 4 of Cultivation |
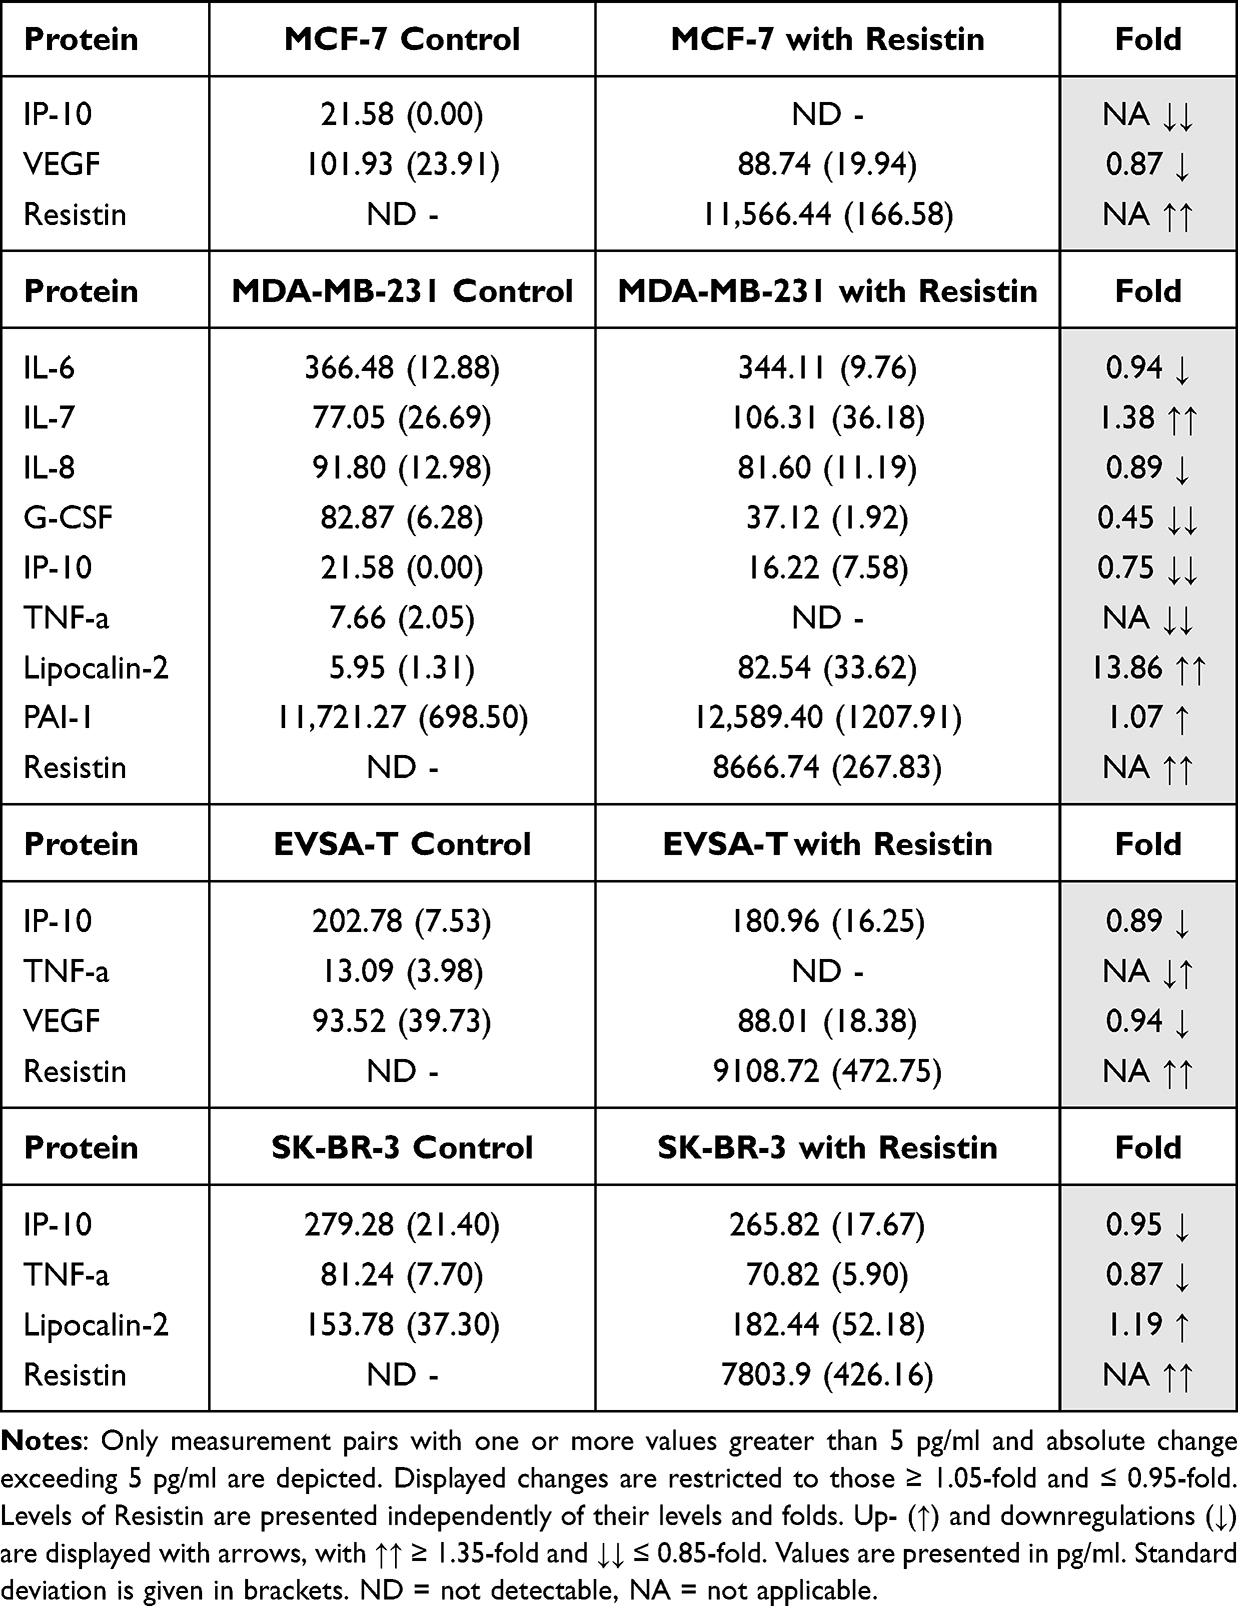 |
Table 9 Effect of 40 ng/ml Recombinant Resistin on the Protein Expression of the Breast Cancer Cell Lines MCF-7, MDA-MB-231, EVSA-T, and SK-BR-3 on Day 4 of Cultivation |
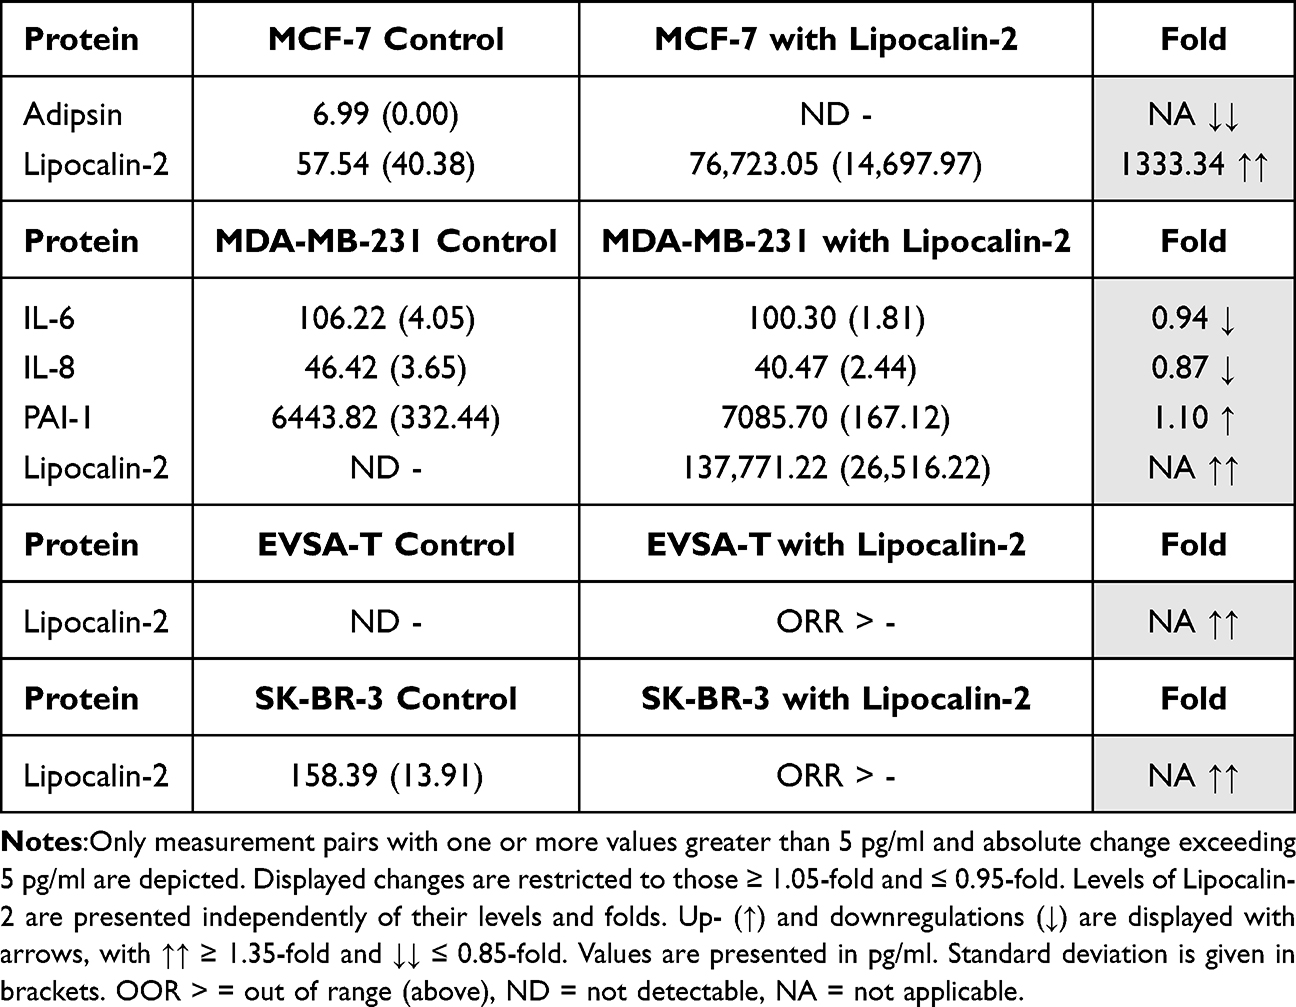 |
Table 10 Effect of 200 ng/ml Recombinant Lipocalin-2 on the Protein Expression of the Breast Cancer Cell Lines MCF-7, MDA-MB-231, EVSA-T, and SK-BR-3 on Day 4 of Cultivation |
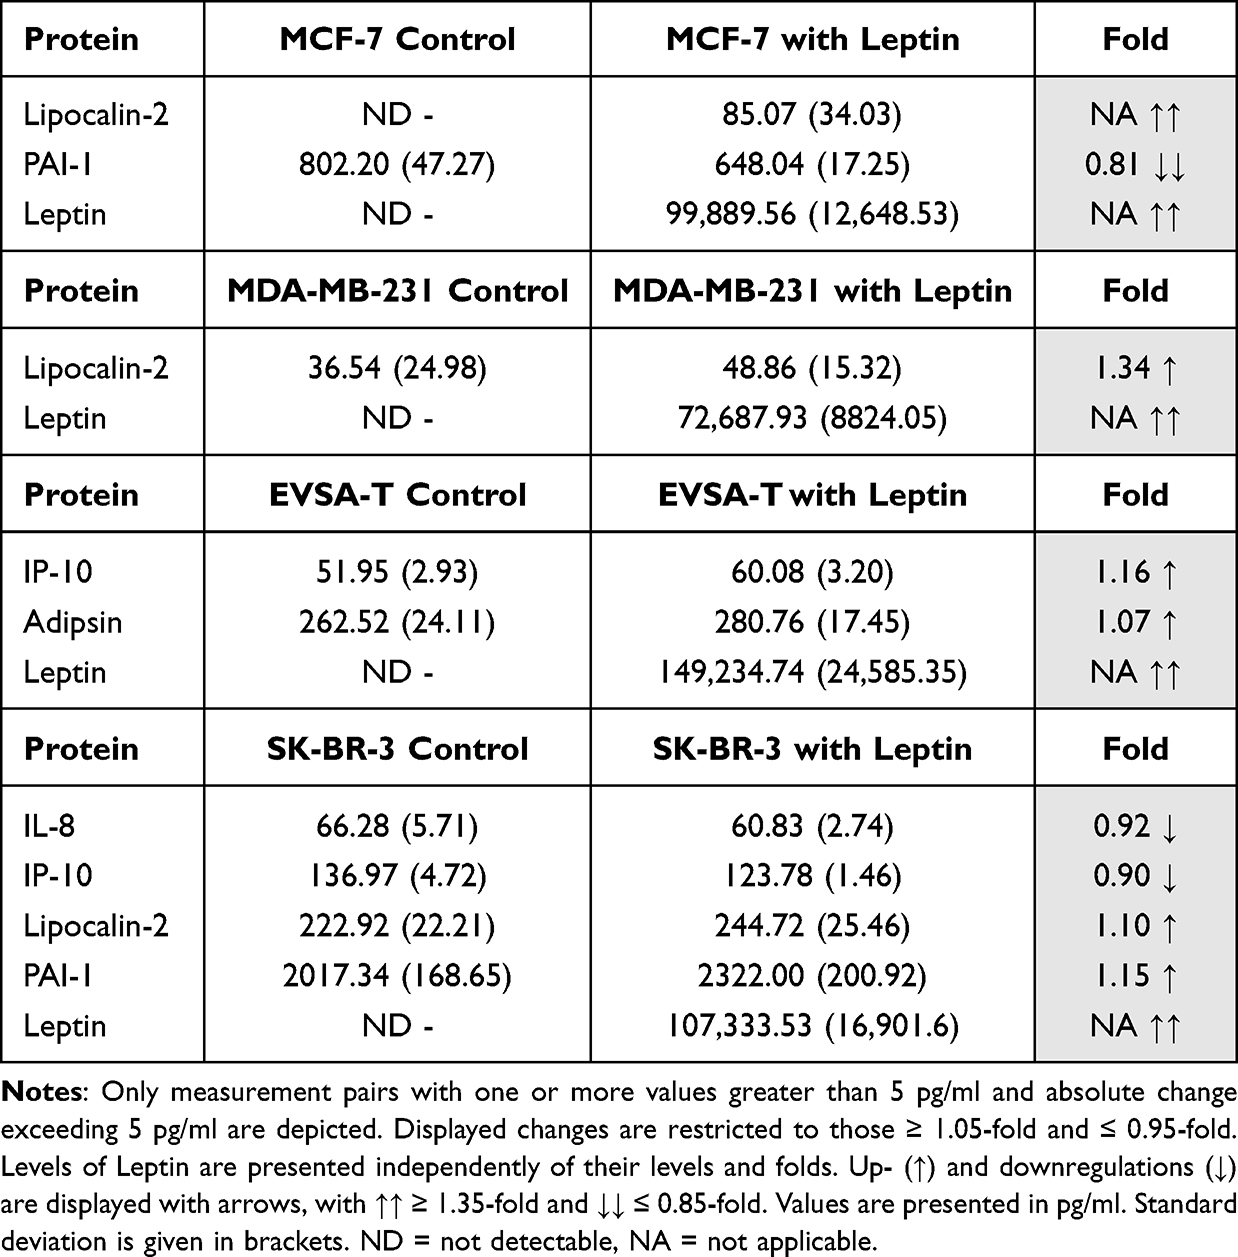 |
Table 11 Effect of 30 ng/ml Recombinant Leptin on the Protein Expression of the Breast Cancer Cell Lines MCF-7, MDA-MB-231, EVSA-T, and SK-BR-3 on Day 4 of Cultivation |
With PDGF previously added to the medium, its values were noted unreliable to contribute meaningful information. For the sake of clarity, we opted to omit its values from the table.
Effect of PAI-1 on BRCA Protein Expression
For MCF-7, PAI-1 did not lead to any relevant changes.
For MDA-MB-231, an increase of the expression of the proteins IL-7 (1.53) and Lipocalin-2 (3.54) and a decrease of IL-8 (0.93) were demonstrated, and the proteins IL-15 (NA), G-CSF (NA) and IP-10 (2.55) were upregulated in EVSA-T, while a significant downregulation was not observed.
In SK-BR-3 expression of Lipocalin-2 (1.05) increased and expression of Adipsin (NA) decreased (Table 8).
Effect of Resistin on BRCA Protein Expression
Resistin decreased expression of IP-10 (NA) and VEGF (0.87) in MCF-7. For MDA-MB-231, an upregulation of IL-7 (1.38), Lipocalin-2 (13.86) and PAI-1 (1.07) as well as a downregulation of IL-6 (0.94), IL-8 (0.89), G-CSF (0.45), IP-10 (0.75) and TNF-α (NA) was observed.
EVSA-T reacted with a downregulation of IP-10 (0.89), TNF-α (NA) and VEGF (0.94).
In SK-BR-3 expression of Lipocalin-2 (1.19) increased and expression of IP-10 (0.95) and TNF- α (0.87) decreased (Table 9).
Effect of Lipocalin-2 on BRCA Protein Expression
Lipocalin-2 caused a decrease of Adipsin (NA) in MCF-7 while for MDA-MB-231, an increase of PAI-1 (1.10) and a decrease of IL-6 (0.94) and IL-8 (0.87) was observed.
In EVSA-T and SK-BR-3 Lipocalin-2 lead to no changes (Table 10).
Effect of Leptin on BRCA Protein Expression
For MCF-7 and MDA-MB-231, Leptin led to an increased expression of Lipocalin-2 (NA, 1.34), and for MCF-7 expression of PAI-1 decreased (0.81).
In EVSA-T expression of IP-10 (1.16) and Adipsin (1.07) increased, while in SK-BR-3 an upregulation of Lipocalin-2 (1.10) and PAI-1 (1.15) as well as a downregulation of IL-8 (0.92) and IP-10 (0.90) was observed (Table 11).
Discussion
Our analysis revealed a cell line-dependent response of breast cancer cells to adipokines, capable of modulating the expression of both pro-tumorigenic and anti-tumorigenic genes. By conducting functional assays such as assessing migration, invasion, and proliferation, we were able to show an overall tumor-promoting effect of adipokines on breast cancer cells. While the extent of cellular motility increase was cell line-dependent, no adipokine-induced decrease in migration or invasion was observed in any cell line.
Given that PAI-1 led to an enhanced migratory capacity across all analyzed breast cancer cell lines in our study, as well as to an increased invasion and proliferation, tumor-favoring gene changes seem to prevail. The greatest increase was found in the CCR3 gene when supplementing PAI-1 to the MCF-7-cell line. CCR3 encodes for an important chemokine receptor on the surface of varying (tumor-) cells. Chemokines are important chemoattractants, induced by inflammatory signals and pathological processes.36 Chemokine receptors are mainly found on immune and endothelial cells, but also on cancer cells, where elevated levels of chemokine receptors have been linked to tumor cell growth, increased tumor cell survival, migration, and angiogenesis.37 Specifically, activation of the CCR3 receptor has been shown to increase the migration and proliferation in different types of tumor cells,38 matching the enhanced invasiveness and growth kinetics of MCF-7 cells with PAI-1 supplementation in our assays. However, the full extent of PAI-1 and subsequently CCR3-induced migration and proliferation might not have been fully shown in our assays, as Eotaxin-1, which is CCR3s primary ligand and closely linked to promotion of tumor migration and invasion,39 was only marginally expressed in our BRCA tumor cells. In vivo, tumor-surrounding cells, such as adipocytes and adipose tissue-derived stromal cells, secrete considerable concentrations of Eotaxin,40,41 triggering migration and proliferation by activating overexpressed CCR3 receptors. This effect might lead to even greater increase in migration and proliferation than currently observed in our in vitro assays. Interestingly, we observed a reduction of CCR3 gene expression in Resistin-supplemented MCF-7 cells in vitro - a hint towards a potential anti-tumor role for Resistin, maybe also counteracting Eotaxin-mediated CCR3 activation in vivo.
Further contributing to the PAI-1-induced tumor promotion is the upregulation of CCRL2, receptor to the breast cancer-promoting ligand CCL2,42 in SK-BR-3. Interestingly, another ligand binding to CCRL2 is the adipokine chemerin, which influences immunity, adiposity, and metabolism and is commonly found to be overexpressed in breast cancer tissue. Studies report conflicting results about the effects of chemerin on tumor promotion.43,44 Secreted by tumor cells and neighboring adipocytes in vivo,43,44 the PAI-1-mediated overexpression of its receptor CCRL2, may facilitate a stronger response to chemerin in vivo and enhanced tumor cell growth kinetics and migration.
The upregulation of the receptors CCR3 and CCRL2 by PAI-1 indicates that PAI-1 may play a key role in enhancing the susceptibility of breast cancer cells to other adipose tissue-derived proteins, thereby further contributing to tumor promotion by amplifying cellular responses.
Emphasizing its tumor-promoting role, supplementation of PAI-1 further increased the expression of CX3CL1 and CCL3 in our study, genes shown to enhance cellular proliferation, migration, and survival.45–48 Additionally, both PAI-1 and Lipocalin-2 were found to downregulate the gene CDH1 in MDA-MB-231 cells, a characteristic effect of these adipokines, that also has been reported in other studies.14,15,19 CDH1 encodes for the adhesion protein E-Cadherin, whose loss drives metastasis by enabling cells to detach and migrate. Reduced E-Cadherin expression is a distinctive feature of an increased Epithelial-Mesenchymal Transition (EMT), a process in which cancer cells lose their cell–cell adhesion properties, enhancing their ability to invade surrounding tissues and metastasize. Loss of E-Cadherin has previously been shown to be a crucial factor in the malignancy of MDA-MB-231 cells. Its downregulation by PAI-1 and Lipocalin-2 significantly contributes to the progression of highly aggressive triple-negative breast cancers,31 a phenomenon that was also evident in the MDA-MB-231 cell line in our experiments. Since the other tested cell lines in our experiment did not exhibit altered CDH1 expression, the susceptibility of MDA-MB-231 cells to PAI-1 and Lipocalin-2 highlights the negative effects of adiposity and related higher concentrations of adipokines for this aggressive triple-negative breast cancer cell line. Furthermore, it indicates that adipokines like PAI-1 and Lipocalin-2, known to downregulate CDH1, have less impact on cell lines that still express E-cadherin compared to those, that do not.
The tumor-promoting effects of adipokines were further demonstrated by the increased expression of the chemokine receptor XCR1 in response to PAI-1, Resistin, and Leptin across three different BRCA cell lines. The enhanced invasiveness and variable proliferation observed with rising XCR1 levels in our study align with findings from previous research.49,50 Overall, the widespread upregulation of XCR1 across various cell lines indicates a general susceptibility of this gene to modulation in breast cancer, suggesting it as a potential target in breast cancer therapy. Additionally, further tumor-promoting alterations were observed, including the upregulation of FYN and FN1 by PAI-1 in EVSA-T, and the upregulation of ITGB3 by Resistin in MCF-7, both of which are known to enhance proliferation and migration in breast cancer.51–53
While we have primarily discussed tumor-promoting changes so far, our findings also included significant anti-tumor effects, such as the reduced proliferation in PAI-1-supplemented MDA-MB-231 cells. One potential mediator of this anti-tumorigenic effect could be FASLG, which was upregulated in our study in MDA-MB-231 through PAI-1. FASLG is analyzed as a potential target in breast cancer treatment,54,55 since its upregulation has been shown to promote tumor cell apoptosis. In our experiments, adding Leptin to SK-BR-3-cell culture enhanced FASLG expression in the BRCA cells, highlighting FASLG as a key protein for adipokine-induced anti-tumor effects. Interestingly, MDA-MB-231 and MCF-7 cell growth was further inhibited by supplementation of PAI-1, Leptin, or Resistin through consistent downregulation of CMTM1 - a gene that promotes proliferation and resistance to TNF-α-induced apoptosis. Given that CMTM1 is known to be overexpressed in MDA-MB-231, its downregulation in the MDA-MB-231 cell line by PAI-1 and Leptin mitigates an important malignant characteristic associated with this cell line.56 Concomitantly, MDA-MB-231 showed reduced growth kinetics following PAI-1 supplementation in our study, suggesting a potential focus on CMTM1 in anti-breast cancer treatments.
Interestingly, in vivo, the PAI-1-induced reduction of proliferation may be even more pronounced than shown in our measurements, as application of PAI-1 and Resistin to MDA-MB-231 cells further resulted in increased levels of IL-7, a protein known to enhance T-lymphocyte survival and growth, thereby exerting anti-tumor activity in vivo.57 However, due to absence of T-lymphocytes in our experimental system, we could not demonstrate this effect in our proliferation assay. However, it should also be noted that Lipocalin-2 might counteract the aforementioned effect by downregulating IL-12B in MDA-MB-231 cells, an interleukin that plays a crucial role in stimulating CD8+ T cells and enhancing immune response via IFN-gamma production.58,59 Its Lipocalin-2-mediated downregulation therefore may promote immune evasion and enhance proliferation in vivo.
MAX (MYC associated factor X) emerged as the most profoundly impacted gene in our study. While it was frequently upregulated by Resistin (MDA-MB-231) and Leptin (MCF-7, EVSA-T, SK-BR-3), supplementation of PAI-1, however, led to a considerable downregulation of the MAX gene in EVSA-T cells. MAX is an obligate dimerization partner to the oncogenic transcription factor MYC, which is widely known for its role in cancer formation, inducing proliferation, tumor cell survival, angiogenesis and immune evasion. MYC is discussed as a promising target for cancer therapy. Through its reciprocal dependency, knockdown of MAX as well as inhibition of MYC were observed to lead to tumor regression and decrease of migration in previous studies.60–62 The pro-angiogenic effect of MAX may promote the progression of diverse breast cancer variants, including invasive micropapillary carcinoma (IMPC). In IMPC, cells form clusters devoid of fibrovascular cores. Angiogenesis induced by the MAX-MYC complex could increase vascular density around these clusters, promoting metastasis, as suggested in previous studies.61–63 The significant upregulation of the oncogenic MAX gene in our study highlights the MYC-MAX complex as a critical target in adipokine-driven breast cancer progression. Given its well-established tumor-promoting role, this upregulation further emphasizes the pro-tumorigenic effects of adipokines.
However, through the observed downregulation of MAX by PAI-1, along with the concurrent PAI-1-induced downregulation of CMTM1 and upregulation of FASLG, PAI-1 may ultimately promote an anti-proliferative effect, particularly in the MDA-MB-231 cell line. This hypothesis is supported by the results of our proliferation assay, showing reduced proliferation in PAI-1-induced MDA-MB-231 cells. The significance of FASLG and CMTM1 as general contributors to anti-tumor mechanisms is further highlighted by the concurrent Leptin-induced upregulation of FASLG and the downregulation of CMTM1 by both Resistin and Leptin.
A further notable observation is the immense upregulation of the CXCL10 gene in EVSA-T cells by addition of Resistin, Lipocalin-1 and Leptin, but not PAI-1. The chemokine CXCL10 possesses promoting effects on proliferation and migration in breast cancer and its concentration is positively correlated with tumor size, poorer prognosis and ER status. ER status was not evaluated in our study. However, given the positive correlation between ER status and CXCL10 expression, it is conceivable that breast cancer cells, that have been originally ER-negative, may undergo a receptor shift, influenced by Resistin, Lipocalin-1, and Leptin, resulting in an ER-positive phenotype. This suggests that adipokines could facilitate subtype transitions within breast cancer, a behavior that has already been partially observed with Leptin, as studies indicate that breast cancer cases in obese women are predominantly ER-positive and display a more aggressive phenotype compared to those in lean women.30 Additionally, the expression of CXCL10 is stimulated by estrogen.64,65 As Leptin stimulates estrogen production and improves estrogen receptor sensitivity through enhancing ER expression in breast cancer cells,30 upregulation of CXCL10 may be greater in vivo, suggesting CXCL10 as a potential key contributor to Leptin-driven malignancy progression.
Further, both Leptin and Lipocalin-2 were found to cause a remarkable upregulation of the chemokine CCL27 (SK-BR-3) and CCL17 (MCF-7). Both activate the ERK1/2 pathway and thus promote invasiveness and proliferation of tumor cells.66,67 In accordance with these genetic alterations, both approaches showed enhanced migration in our study. Interestingly, PAI-1 and Resistin led to a downregulation of CCL17 (PAI-1 and Resistin) and CCL27 (Resistin only), respectively, indicating further anti-tumor effects for these adipokines. As CCL17 promotes the expression of its receptor CCR4,67,68 the PAI-1-induced decrease of CCL17 expression in the EVSA-T cell line might contribute to the observed concurrent downregulation of CCR4. Known to be overexpressed in most breast cancers, CCR4 promotes breast cancer growth in mice and enhances chemotactic response to CCL17.69 By downregulating both CCR4 and CCL17, PAI-1 and Resistin exert additional anti-tumor effects, reducing invasiveness and growth kinetics by decreasing ERK1/2 pathway activation, complementing their previously mentioned anti-proliferative properties.
In the multiplex protein measurement assay, PAI-1 had a significant impact on the EVSA-T cell line, inducing new expression of IL-15 and G-CSF and upregulating IP-10 concentrations by 2.55-fold. While IL-15 may further inhibit tumor promotion by enhancing immune response,70 G-CSF and IP-10 have been found to promote tumor growth and dissemination and correlate with poor prognosis.71–73 G-CSF, known to be highly expressed by cancer-associated adipocytes as well, stimulates EMT through activation of STAT3, PI3K/AKT, ERK and MAPK, thereby promoting invasiveness.72 In our study, PAI-1 was the only adipokine that increased proliferation in EVSA-T cells, likely due to the involvement of G-CSF and IP-1071–73 and the aforementioned upregulation of FYN and FN1.51,52 These effects appear to outweigh the previously noted impact of PAI-1-induced downregulation of the tumor-promoting factors CCL17, CCR4, and MAX in EVSA-T cells.
In contrast, Resistin continued to exhibit a notable anti-tumor activity in BRCA in our multiplex protein assay, reducing TNF-α and IP-10 expression up to complete suppression and decreasing the levels of IL-6 (0.94-fold), G-CSF (0.45-fold), and vascular endothelial growth factor (VEGF) by up to 0.87-fold. While IL-6 and VEGF are crucial mediators of angiogenesis in tumors,42,74 TNF-α is known to be overexpressed in cancers and correlates with poor prognosis and advanced tumor stage.75 Although able to both promote and inhibit proliferation, TNF-α typically enhances proliferation and inhibits apoptosis.76 We found TNF-α to be highly susceptible to Resistin as evidenced by a significant downregulation of TNF- α protein expression across three different BRCA cell lines, whereas no other adipokine elicited any measurable effect on TNF-α protein expression in any cell line.
A further interesting observation in our multiplex assay was the reciprocal impact of the different applied adipokines on each other’s expression, with MDA-MB-231 and SK-BR-3 cells exhibiting the most pronounced alterations in their adipokine expression profiles. Both cell lines showed consistent upregulation of Lipocalin-2 in every adipokine-supplemented approach, reaching up to an almost 14-fold increase. Furthermore, PAI-1 was upregulated by adipokine-supplementation in 50% of the assays involving MDA-MB-231 and SK-BR-3 cells. In this context, it is important to acknowledge that normal breast tissue already secretes low baseline levels of PAI-1, Lipocalin-2 and Leptin. In breast cancer, however, adipokine expression is often elevated and serves as a marker of malignancy, as it typically correlates with advanced tumor stage and poorer prognosis.12–15,19,21,27 The observed upregulation of adipokine expression therefore contributes to the promotion of both SK-BR-3 and the highly aggressive MDA-MB-231 cells, highlighting self-amplification as a key pathological mechanism by which adipokines drive breast cancer progression.
Conversely, the MCF-7 cell line exhibited a differential response: while Lipocalin-2 was similarly upregulated through Leptin, PAI-1 expression decreased in the same approach. Furthermore, Adipsin expression decreased in MCF-7 cells supplemented with PAI-1, while being markedly upregulated in Leptin-supplemented EVSA-T cells. This divergence highlights MCF-7’s typically less aggressive phenotype.34 Resistin and Leptin expression levels remained stable across all breast cancer cell lines, indicating that these adipokines are less susceptible to adipokine-driven modulation.
While the determined levels of adipokine expression in our assays suggest that tumor cells significantly contribute to adipokine levels–and therefore tumor promotion–in the living organism, it is essential to interpret them in relation to adipokine concentrations induced by adipocytes. Previous studies report serum levels of Lipocalin-2 and PAI-1 at approximately 70,000 pg/mL and 30,000 pg/mL, respectively, in obese patients.77,78 In contrast, our breast cancer cells secreted much lower adipokine levels–up to 244.72 pg/mL for Lipocalin-2 and 12,589.4 pg/mL for PAI-1. We therefore conclude that within the living organism adipokine-driven breast cancer promotion most likely originates from adipokines secreted by adipocytes, rather than from the limited secretion by breast cancer cells or normal breast tissue. However, as elevated adipokine levels in breast cancer cells are linked to advanced tumor stages and poorer prognosis,12–15,19,21,27 higher local concentrations within tumor cell clusters likely exert significant paracrine effects.
Although PAI-1 levels of MDA-MB-231 cells were hardly influenced by additional supplementation of recombinant PAI-1, migration still increased significantly through addition of different concentrations of PAI-1 to MDA-MB-231 cells. This may appear paradoxical; however, we suspect the observed increase in migration in our study to originate from gene alterations triggered by high concentrations of PAI-1 immediately after supplementation, prior to possible negative feedback mechanisms or undesirable protein degradation of PAI-1 during time. Although the PAI-1 mediated stimulation of Lipocalin-2 expression, as found in our protein analysis, may have contributed to the increased malignant properties observed in our MDA-MB-231 cells, we suspect elevated PAI-1 levels to be the main cause of these observed pro-tumorigenic changes, as we noted a distinct pattern in the gene alterations via PAI-1 in contrast to those induced by Lipocalin-2. However, the elevated Lipocalin-2 levels induced by PAI-1 supplementation may stimulate further PAI-1 expression, as evident in our assays, leading to a higher turnover rate, helping to maintain steady PAI-1 levels despite potential degradation.
To fully interpret our findings, it is essential to consider potential methodological factors that may have influenced the results. The solvent used to reconstitute lyophilized adipokines likely had minimal impact on migration and invasion, as it showed no significant difference from the control in most cases. Only Resistins solvent showed a slight increase in migration in MDA-MB-231 cells, however, differing significantly from the impact of the highest concentration of solved Resistin, thus more likely acting as an amplifier rather than a causative factor. For PAI-1, its solvent slightly reduced invasion in EVSA-T and SK-BR-3 cells, possibly masking pro-tumorigenic effects. Regarding growth kinetics, while most cell lines showed a slight increase in proliferation, only a few changes were statistically significant, likely due to limited sample size or insufficient adipokine concentrations.
Conclusion
Our study showed a concentration-dependent, overall promoting effect of adipokines on several malignancy-associating features of different breast cancer cell lines. We conclude that adipokines can significantly contribute to breast cancer progression, making them a potential target for breast cancer therapy. Adipokine-targeted antibody therapy, combined with standard treatments, may enhance treatment efficacy and improve outcomes, similar to existing therapies targeting HER2- or ER-receptors. Moreover, our findings highlight obesity as a key risk factor for breast cancer, emphasizing the importance of primary prevention through weight loss. Further research is needed to confirm these findings and to investigate the molecular mechanisms by which adipokines exert differential effects across subtypes, potentially paving the way for subtype-specific therapeutic strategies.
Data Sharing Statement
The datasets generated and analyzed are available from the corresponding author upon reasonable request.
Author Contributions
All authors made a significant contribution to the work reported, whether that is in the conception, study design, execution, acquisition of data, analysis and interpretation, or in all these areas; took part in drafting, revising or critically reviewing the article; gave final approval of the version to be published; have agreed on the journal to which the article has been submitted; and agree to be accountable for all aspects of the work.
Funding
This study was financially supported by Hopp Stiftung, Walldorf, Germany. The Hopp Stiftung did not influence the design of the study, the collection, analysis, and interpretation of data, or the writing of the manuscript.
Disclosure
The authors report no conflicts of interest in this work.
References
1. Sung H, Ferlay J, Siegel RL, et al. Global cancer statistics 2020: GLOBOCAN estimates of incidence and mortality worldwide for 36 cancers in 185 countries. CA Cancer J Clin. 2021;71(3):209–249. doi:10.3322/caac.21660
2. Giaquinto AN, Sung H, Miller KD, et al. Breast cancer statistics, 2022. CA Cancer J Clin. 2022;72(6):524–541. doi:10.3322/caac.21754
3. Leitlinienprogramm Onkologie (Deutsche Krebsgesellschaft, Deutsche Krebshilfe, AWMF): S3-Leitlinie Früherkennung, Diagnose, Therapie und Nachsorge des Mammakarzinoms [Guideline Program in Oncology (German Cancer Society, German Cancer Aid, AWMF): S3-Guideline on Early Detection, Diagnosis, Therapy, and Follow-Up of Breast Cancer], Version 4.4, 2021, AWMF Registry Number: 032-045OL, Available from: http://www.leitlinienprogramm-onkologie.de/leitlinien/mammakarzinom/.
4. Verras GI, Tchabashvili L, Chlorogiannis -D-D, et al. Updated clinical evidence on the role of adipokines and breast cancer: a review. Cancers. 2023;15(5):1572. doi:10.3390/cancers15051572
5. Lauby-Secretan B, Scoccianti C, Loomis D, et al. body fatness and cancer--viewpoint of the IARC working group. N Engl J Med. 2016;375(8):794–798. doi:10.1056/NEJMsr1606602
6. Taylor EB. The complex role of adipokines in obesity, inflammation, and autoimmunity. Clin Sci. 2021;135(6):731–752. doi:10.1042/CS20200895
7. Kim JE, Kim JS, Jo MJ, et al. The roles and associated mechanisms of adipokines in development of metabolic syndrome. Molecules. 2022;27(2):334.
8. Uhl B, A Mittmann L, Dominik J, et al. uPA-PAI-1 heteromerization promotes breast cancer progression by attracting tumorigenic neutrophils. EMBO Mol Med. 2021;13(6):e13110. doi:10.15252/emmm.202013110
9. Duffy MJ, McGowan PM, Harbeck N, et al. uPA and PAI-1 as biomarkers in breast cancer: validated for clinical use in level-of-evidence-1 studies. Breast Cancer Res. 2014;16(4):428. doi:10.1186/s13058-014-0428-4
10. Chambers SK, Ivins CM, Carcangiu ML. Plasminogen activator inhibitor-1 is an independent poor prognostic factor for survival in advanced stage epithelial ovarian cancer patients. Int J Cancer. 1998;79(5):449–454. doi:10.1002/(SICI)1097-0215(19981023)79:5<449::AID-IJC1>3.0.CO;2-0
11. Dalamaga M, Sotiropoulos G, Karmaniolas K, et al. Serum resistin: a biomarker of breast cancer in postmenopausal women? Association with clinicopathological characteristics, tumor markers, inflammatory and metabolic parameters. Clin Biochem. 2013;46(7–8):584–590. doi:10.1016/j.clinbiochem.2013.01.001
12. Lee YC, Chen Y-J, Wu CC, et al. Resistin expression in breast cancer tissue as a marker of prognosis and hormone therapy stratification. Gynecol Oncol. 2012;125(3):742–750. doi:10.1016/j.ygyno.2012.02.032
13. Wang CH, Wang P-J, Hsieh Y-C, et al. Resistin facilitates breast cancer progression via TLR4-mediated induction of mesenchymal phenotypes and stemness properties. Oncogene. 2018;37(5):589–600. doi:10.1038/onc.2017.357
14. Hu C, Yang K, Li M, et al. Lipocalin 2: a potential therapeutic target for breast cancer metastasis. Onco Targets Ther. 2018;11:8099–8106. doi:10.2147/OTT.S181223
15. Yang J, Bielenberg DR, Rodig SJ, et al. Lipocalin 2 promotes breast cancer progression. Proc Natl Acad Sci U S A. 2009;106(10):3913–3918. doi:10.1073/pnas.0810617106
16. Miyoshi Y, Funahashi T, Tanaka S, et al. High expression of leptin receptor mRNA in breast cancer tissue predicts poor prognosis for patients with high, but not low, serum leptin levels. Int J Cancer. 2006;118(6):1414–1419. doi:10.1002/ijc.21543
17. Chen DC, Chung Y-F, Yeh Y-T, et al. Serum adiponectin and leptin levels in Taiwanese breast cancer patients. Cancer Lett. 2006;237(1):109–114. doi:10.1016/j.canlet.2005.05.047
18. Romero-Figueroa Mdel S, Garduño-García JDJ, Duarte-Mote J, et al. Insulin and leptin levels in obese patients with and without breast cancer. Clin Breast Cancer. 2013;13(6):482–485. doi:10.1016/j.clbc.2013.08.001
19. Humphries BA, Buschhaus JM, Chen Y-C, et al. Plasminogen activator inhibitor 1 (PAI1) promotes actin cytoskeleton reorganization and glycolytic metabolism in triple-negative breast cancer. Mol Cancer Res. 2019;17(5):1142–1154. doi:10.1158/1541-7786.MCR-18-0836
20. Kwaan HC, Wang J, Svoboda K, et al. Plasminogen activator inhibitor 1 may promote tumour growth through inhibition of apoptosis. Br J Cancer. 2000;82(10):1702–1708. doi:10.1054/bjoc.2000.1207
21. Zhang W, Yang S, Chen D, et al. SOX2-OT induced by PAI-1 promotes triple-negative breast cancer cells metastasis by sponging miR-942-5p and activating PI3K/Akt signaling. Cell Mol Life Sci. 2022;79(1):59. doi:10.1007/s00018-021-04120-1
22. Barbieri I, Pensa S, Pannellini T, et al. Constitutively active Stat3 enhances neu-mediated migration and metastasis in mammary tumors via upregulation of Cten. Cancer Res. 2010;70(6):2558–2567. doi:10.1158/0008-5472.CAN-09-2840
23. Lee JO, Kim N, Lee HJ, et al. Resistin, a fat-derived secretory factor, promotes metastasis of MDA-MB-231 human breast cancer cells through ERM activation. Sci Rep. 2016;6:18923. doi:10.1038/srep18923
24. Clucas J, Valderrama F. ERM proteins in cancer progression. J Cell Sci. 2014;127(2):267–275. doi:10.1242/jcs.133108
25. Satelli A, Li S. Vimentin in cancer and its potential as a molecular target for cancer therapy. Cell Mol Life Sci. 2011;68(18):3033–3046. doi:10.1007/s00018-011-0735-1
26. Kang C, LeRoith D, Gallagher EJ. Diabetes, obesity, and breast cancer. Endocrinology. 2018;159(11):3801–3812. doi:10.1210/en.2018-00574
27. Surmacz E. Leptin and adiponectin: emerging therapeutic targets in breast cancer. J Mammary Gland Biol Neoplasia. 2013;18(3–4):321–332. doi:10.1007/s10911-013-9302-8
28. Ghasemi A, Saeidi J, Azimi-Nejad M, et al. Leptin-induced signaling pathways in cancer cell migration and invasion. Cell Oncol. 2019;42(3):243–260. doi:10.1007/s13402-019-00428-0
29. Dana N, Ferns GA, Nedaeinia R, et al. Leptin signaling in breast cancer and its crosstalk with peroxisome proliferator-activated receptors alpha and gamma. Clin Transl Oncol. 2023;25(3):601–610. doi:10.1007/s12094-022-02988-4
30. Schmidt S, Monk JM, Robinson LE, et al. The integrative role of leptin, oestrogen and the insulin family in obesity-associated breast cancer: potential effects of exercise. Obes Rev. 2015;16(6):473–487. doi:10.1111/obr.12281
31. Pratelli G, Carlisi D, Di Liberto D, et al. MCL1 inhibition overcomes the aggressiveness features of triple-negative breast cancer MDA-MB-231 cells. Int J Mol Sci. 2023;24(13):11149. doi:10.3390/ijms241311149
32. Yuan Y, Long H, Zhou Z, et al. PI3K-AKT-targeting breast cancer treatments: natural products and synthetic compounds. Biomolecules. 2023;13(1):93. doi:10.3390/biom13010093
33. O’Donnell JS, Massi D, Teng MWL, et al. PI3K-AKT-mTOR inhibition in cancer immunotherapy, redux. Semin Cancer Biol. 2018;48:91–103. doi:10.1016/j.semcancer.2017.04.015
34. Comsa S, Cimpean AM, Raica M. The story of MCF-7 breast cancer cell line: 40 years of experience in research. Anticancer Res. 2015;35(6):3147–3154.
35. Pan L, Li J, Xu Q, et al. HER2/PI3K/AKT pathway in HER2-positive breast cancer: a review. Medicine. 2024;103(24):e38508. doi:10.1097/MD.0000000000038508
36. Viola A, Luster AD. Chemokines and their receptors: drug targets in immunity and inflammation. Annu Rev Pharmacol Toxicol. 2008;48:171–197. doi:10.1146/annurev.pharmtox.48.121806.154841
37. Balkwill F. Cancer and the chemokine network. Nat Rev Cancer. 2004;4(7):540–550. doi:10.1038/nrc1388
38. Johrer K, Zelle-Rieser C, Perathoner A, et al. Up-regulation of functional chemokine receptor CCR3 in human renal cell carcinoma. Clin Cancer Res. 2005;11(7):2459–2465. doi:10.1158/1078-0432.CCR-04-0405
39. Zhu F, Liu P, Li J, et al. Eotaxin-1 promotes prostate cancer cell invasion via activation of the CCR3-ERK pathway and upregulation of MMP-3 expression. Oncol Rep. 2014;31(5):2049–2054. doi:10.3892/or.2014.3060
40. Vasudevan AR, Wu H, Xydakis AM, et al. Eotaxin and obesity. J Clin Endocrinol Metab. 2006;91(1):256–261. doi:10.1210/jc.2005-1280
41. Hattori H, Ishihara M. Fibroblast growth factor-2 and interleukin-4 synergistically induce eotaxin-1 expression in adipose tissue-derived stromal cells. Cell Biol Int. 2020;44(5):1124–1132. doi:10.1002/cbin.11309
42. Bonapace L, Coissieux -M-M, Wyckoff J, et al. Cessation of CCL2 inhibition accelerates breast cancer metastasis by promoting angiogenesis. Nature. 2014;515(7525):130–133. doi:10.1038/nature13862
43. Yu M, Yang Y, Huang C, et al. Chemerin: a functional adipokine in reproductive health and diseases. Biomedicines. 2022;10(8):1910. doi:10.3390/biomedicines10081910
44. Treeck O, Buechler C, Ortmann O. Chemerin and cancer. Int J Mol Sci. 2019;20(15):3750. doi:10.3390/ijms20153750
45. Liu W, Bian C, Liang Y, et al. CX3CL1: a potential chemokine widely involved in the process spinal metastases. Oncotarget. 2017;8(9):15213–15219. doi:10.18632/oncotarget.14773
46. Tardaguila M, Mira E, García-Cabezas MA, et al. CX3CL1 promotes breast cancer via transactivation of the EGF pathway. Cancer Res. 2013;73(14):4461–4473. doi:10.1158/0008-5472.CAN-12-3828
47. Tsang JY, Ni Y-B, Chan S-K, et al. CX3CL1 expression is associated with poor outcome in breast cancer patients. Breast Cancer Res Treat. 2013;140(3):495–504. doi:10.1007/s10549-013-2653-4
48. Ma X, Su J, Zhao S, et al. CCL3 promotes proliferation of colorectal cancer related with TRAF6/NF- κ B molecular pathway. Contrast Media Mol Imaging. 2022;2022:2387192. doi:10.1155/2022/2387192
49. Yang XL, Qi LG, Lin FJ, et al. The role of the chemokine receptor XCR1 in breast cancer cells. Breast Cancer. 2017;9:227–236. doi:10.2147/BCTT.S126184
50. Kim M, Rooper L, Xie J, et al. The lymphotactin receptor is expressed in epithelial ovarian carcinoma and contributes to cell migration and proliferation. Mol Cancer Res. 2012;10(11):1419–1429. doi:10.1158/1541-7786.MCR-12-0361
51. Xie YG, Yu Y, Hou L-K, et al. FYN promotes breast cancer progression through epithelial-mesenchymal transition. Oncol Rep. 2016;36(2):1000–1006. doi:10.3892/or.2016.4894
52. Chen C, Ye L, Yi J, et al. FN1 mediated activation of aspartate metabolism promotes the progression of triple-negative and luminal a breast cancer. Breast Cancer Res Treat. 2023;201(3):515–533. doi:10.1007/s10549-023-07032-9
53. Kovacheva M, Zepp M, Berger S, et al. Conditional knockdown of integrin beta-3 reveals its involvement in osteolytic and soft tissue lesions of breast cancer skeletal metastasis. J Cancer Res Clin Oncol. 2021;147(2):361–371. doi:10.1007/s00432-020-03428-y
54. Liu Y, Wen Q-J, Yin Y, et al. FASLG polymorphism is associated with cancer risk. Eur J Cancer. 2009;45(14):2574–2578. doi:10.1016/j.ejca.2009.04.001
55. Prager I, Watzl C. Mechanisms of natural killer cell-mediated cellular cytotoxicity. J Leukoc Biol. 2019;105(6):1319–1329. doi:10.1002/JLB.MR0718-269R
56. Wang J, Zhang G, Zhang Y, et al. CMTM1_v17 is a novel potential therapeutic target in breast cancer. Oncol Rep. 2014;32(5):1829–1836. doi:10.3892/or.2014.3429
57. Leilei Z, Kewen Z, Biao H, Fang H, Yigang W, et al. The role of chemokine IL-7 in tumor and its potential antitumor immunity. J Interferon Cytokine Res. 2022;42(6):243–250. doi:10.1089/jir.2021.0236
58. Nunez-Marrero A. Assessing the role of the interleukin-12/STAT4 axis in breast cancer by a bioinformatics approach. Int J Sci Basic Appl Res. 2019;48(2):38–52.
59. Yang SX, Wei W-S, Ouyan Q-W, et al. Interleukin-12 activated CD8(+) T cells induces apoptosis in breast cancer cells and reduces tumor growth. Biomed Pharmacother. 2016;84:1466–1471. doi:10.1016/j.biopha.2016.10.046
60. Guddeti RK, Pacharla H, Yellapu NK, et al. MORC2 and MAX contributes to the expression of glycolytic enzymes, breast cancer cell proliferation and migration. Med Oncol. 2023;40(3):102. doi:10.1007/s12032-023-01974-2
61. Duffy MJ, O’Grady S, Tang M, et al. MYC as a target for cancer treatment. Cancer Treat Rev. 2021;94:102154. doi:10.1016/j.ctrv.2021.102154
62. Dhanasekaran R, Deutzmann A, Mahauad-Fernandez WD, et al. The MYC oncogene - the grand orchestrator of cancer growth and immune evasion. Nat Rev Clin Oncol. 2022;19(1):23–36. doi:10.1038/s41571-021-00549-2
63. Yang YL, Liu -B-B, Zhang X, et al. Invasive micropapillary carcinoma of the breast: an update. Arch Pathol Lab Med. 2016;140(8):799–805. doi:10.5858/arpa.2016-0040-RA
64. Wu X, Sun A, Yu W, et al. CXCL10 mediates breast cancer tamoxifen resistance and promotes estrogen-dependent and independent proliferation. Mol Cell Endocrinol. 2020;512:110866. doi:10.1016/j.mce.2020.110866
65. Tsutsumi E, Stricklin J, Peterson EA, et al. Cxcl10 chemokine induces migration of ING4-deficient breast cancer cells via a novel cross talk mechanism between the Cxcr3 and egfr receptors. Mol Cell Biol. 2022;42(2):e0038221. doi:10.1128/mcb.00382-21
66. Lin HY, Sun S-M, Lu X-F, et al. CCR10 activation stimulates the invasion and migration of breast cancer cells through the ERK1/2/MMP-7 signaling pathway. Int Immunopharmacol. 2017;51:124–130. doi:10.1016/j.intimp.2017.07.018
67. Korbecki J, Kojder K, Simińska D, et al. CC chemokines in a tumor: a review of pro-cancer and anti-cancer properties of the ligands of receptors CCR1, CCR2, CCR3, and CCR4. Int J Mol Sci. 2020;21(21):8412.
68. Yoshie O. CCR4 as a therapeutic target for cancer immunotherapy. Cancers. 2021;13(21): 5542.
69. Li JY, Ou Z-L, Yu S-J, et al. The chemokine receptor CCR4 promotes tumor growth and lung metastasis in breast cancer. Breast Cancer Res Treat. 2012;131(3):837–848. doi:10.1007/s10549-011-1502-6
70. Zhang S, Zhao J, Bai X, et al. Biological effects of IL-15 on immune cells and its potential for the treatment of cancer. Int Immunopharmacol. 2021;91:107318. doi:10.1016/j.intimp.2020.107318
71. Clark AM, Heusey HL, Griffith LG, et al. IP-10 (CXCL10) can trigger emergence of dormant breast cancer cells in a metastatic liver microenvironment. Front Oncol. 2021;11:676135. doi:10.3389/fonc.2021.676135
72. Liu L, Wu Y, Zhang C, et al. Cancer-associated adipocyte-derived G-CSF promotes breast cancer malignancy via Stat3 signaling. J Mol Cell Biol. 2020;12(9):723–737. doi:10.1093/jmcb/mjaa016
73. Hollmen M, Karaman S, Schwager S, et al. G-CSF regulates macrophage phenotype and associates with poor overall survival in human triple-negative breast cancer. Oncoimmunology. 2016;5(3):e1115177. doi:10.1080/2162402X.2015.1115177
74. Ferrara N. The role of vascular endothelial growth factor in pathological angiogenesis. Breast Cancer Res Treat. 1995;36(2):127–137. doi:10.1007/BF00666035
75. Balkwill F. TNF-alpha in promotion and progression of cancer. Cancer Metastasis Rev. 2006;25(3):409–416. doi:10.1007/s10555-006-9005-3
76. Cruceriu D, Baldasici O, Balacescu O, et al. The dual role of tumor necrosis factor-alpha (TNF-alpha) in breast cancer: molecular insights and therapeutic approaches. Cell Oncol. 2020;43(1):1–18. doi:10.1007/s13402-019-00489-1
77. Huotari A, Lehto SM, Niskanen L, et al. Increased serum PAI-1 levels in subjects with metabolic syndrome and long-term adverse mental symptoms: a population-based study. Cardiovasc Psychiatry Neurol. 2010;2010:501349. doi:10.1155/2010/501349
78. Catalan V, Gómez-Ambrosi J, Rodríguez A, et al. Increased adipose tissue expression of lipocalin-2 in obesity is related to inflammation and matrix metalloproteinase-2 and metalloproteinase-9 activities in humans. J Mol Med. 2009;87(8):803–813. doi:10.1007/s00109-009-0486-8
 © 2025 The Author(s). This work is published and licensed by Dove Medical Press Limited. The
full terms of this license are available at https://www.dovepress.com/terms
and incorporate the Creative Commons Attribution
- Non Commercial (unported, 3.0) License.
By accessing the work you hereby accept the Terms. Non-commercial uses of the work are permitted
without any further permission from Dove Medical Press Limited, provided the work is properly
attributed. For permission for commercial use of this work, please see paragraphs 4.2 and 5 of our Terms.
© 2025 The Author(s). This work is published and licensed by Dove Medical Press Limited. The
full terms of this license are available at https://www.dovepress.com/terms
and incorporate the Creative Commons Attribution
- Non Commercial (unported, 3.0) License.
By accessing the work you hereby accept the Terms. Non-commercial uses of the work are permitted
without any further permission from Dove Medical Press Limited, provided the work is properly
attributed. For permission for commercial use of this work, please see paragraphs 4.2 and 5 of our Terms.