Back to Journals » Clinical Ophthalmology » Volume 18
Addressing Technical Failures in a Diabetic Retinopathy Screening Program
Authors Brennan IG, Kelly SR, McBride E, Garrahy D ![]() , Acheson R, Harmon J, McMahon S, Keegan DJ, Kavanagh H, O'Toole L
, Acheson R, Harmon J, McMahon S, Keegan DJ, Kavanagh H, O'Toole L ![]()
Received 19 October 2023
Accepted for publication 18 January 2024
Published 9 February 2024 Volume 2024:18 Pages 431—440
DOI https://doi.org/10.2147/OPTH.S442414
Checked for plagiarism Yes
Review by Single anonymous peer review
Peer reviewer comments 2
Editor who approved publication: Dr Scott Fraser
Video abstract presented by Brennan.
Views: 99
Ian Gerard Brennan,1,* Stephen R Kelly,1,* Edel McBride,2 Darragh Garrahy,1 Robert Acheson,2 Joanne Harmon,2 Shane McMahon,2 David J Keegan,1 Helen Kavanagh,1 Louise O’Toole2
1Diabetic RetinaScreen, National Screening Service, Health Service Executive, Dublin, Ireland; 2Diabetic Retinal Screening Service, NEC Care, Cork City, Co. Cork, Ireland
*These authors contributed equally to this work
Correspondence: Louise O’Toole, NEC Care, Matthew House-3rd Floor, Fr Matthew Street, Cork City, Co. Cork, T12 TN56, Ireland, Email [email protected]
Purpose: Diabetic retinopathy (DR) is a preventable cause of blindness detectable through screening using retinal digital photography. The Irish National Diabetic Retina Screening (DRS) programme, Diabetic RetinaScreen, provides free screening services to patients with diabetes from aged 12 years and older. A technical failure (TF) occurs when digital retinal imaging is ungradable, resulting in delays in the diagnosis and treatment of sight-threatening disease. Despite their impact, the causes of TFs, and indeed the utility of interventions to prevent them, have not been extensively examined.
Aim: Primary analysis aimed to identify factors associated with TF. Secondary analysis examined a subset of cases, assessing patient data from five time points between 2019 and 2021 to identify photographer/patient factors associated with TF.
Methods: Patient data from the DRS database for one provider were extracted for analysis between 2018 and 2022. Information on patient demographics, screening results, and other factors previously associated with TF were analyzed. Primary analysis involved using mixed-effects logistic regression models with nested patient-eye random effects. Secondary analysis reviewed a subset of cases in detail, checking for causes of TF.
Results: The primary analysis included a total of 366,528 appointments from 104,407 patients over 5 years. Most patients had Type 2 diabetes (89.2%), and the overall TF rate was 4.9%. Diabetes type and duration, dilate pupil status, and the presence of lens artefacts on the camera were significantly associated with TF. The Secondary analysis identified the primary cause of TF was found to be optically dense cataracts, accounting for over half of the TFs.
Conclusion: This study provides insight into the causes of TF within the Irish DRS program, highlighting cataracts as the primary contributing factor. The identification of patient-level factors associated with TF facilitates appropriate interventions that can be put in place to improve patient outcomes and minimize delays in treatment and diagnosis.
Keywords: ungradable image, cataract, screen failure, camera, retinal photography
A Letter to the Editor has been published for this article.
A Response to Letter by Prof. Dr. Budu has been published for this article.
Introduction
The growing prevalence of Diabetes Mellitus is such that it has been termed a modern preventable pandemic.1 The impact of diabetic retinal screening (DRS) programs using digital photography to detect sight-threatening retinopathy has been significant. The incidence and prevalence of blindness is much lower in populations where screening for diabetic eye disease has been established compared to diabetic populations without screening.2 Diabetic retinopathy (DR) is no longer the leading cause of certifiable blindness among working age adults in England and Wales.3 Clear fundal images detailing the retinal microvasculature are mandatory to allow grading of DR.
Diabetic RetinaScreen was launched in Ireland in 2013 to address the challenge of DR. It is a government funded, quality assured national screening program that provides a free DRS service to all patients diagnosed with diabetes from the age of 12 years and older.4 Patients are usually dilated upon attendance, and two 45-degree digital photographs of the retina centered on the macula and the optic disc are taken. These images are then graded remotely. The term technical failure (TF) is used when imaging is ungradable. Ungradable images can be broadly categorized into two groups. The first category is where the image capture technique has been suboptimal, the resulting images may be out of focus, insufficient, and/or incorrect fields captured or there may be artefacts from the camera lens present. The second category of ungradable images encompasses patient characteristics such as limited pupil dilation, motion blur, or media opacities.5 Following the occurrence of a TF, the patient is then invited to attend a further clinical appointment where a comprehensive ophthalmic examination is made using slit-lamp biomicroscopy. Therefore, the impact of TF is significant, it is burdensome to the patient as well as being costly to the screening service. Ultimately, a TF can delay both the diagnosis and the treatment of sight-threatening diabetic retinopathy and non-diabetic eye diseases (NDED).
For best practice in a DRS program, the TF rate should be maintained as low as possible, with the Irish national DRS setting a standard of <7%.6 Despite their considerable impact, the causes of TFs have not been widely studied nor have any inferences been made about the strength or utility of interventions to prevent them. The objective of this paper is to determine the factors that are associated with TFs. A secondary objective is to analyze the effect of various interventions on reducing the TF rate in our service, with the aim of improving patient care and outcomes by minimizing non-clinical errors that cause delays in treatment and diagnosis.
Methods
Diabetic Retina Screening and Grading Protocol
The screening and grading were performed by NEC Care Ireland (NEC, Japan) and ENP Health Solutions (renamed in 2023, Diabetic Retinopathy-Clinical and Management Services (DR-CMS)) using the OptoMize clinical information management systems (CIMS), ensuring General Data Protection Regulation (GDPR) compliance and secure storage accessible to relevant healthcare professionals. Retinal imaging was performed using Nonmyd 7 retinal cameras (Kowa, USA) and Nonmyd 8 retinal cameras (Kowa, USA). During each screening session, a technician assesses the individual’s visual acuity and utilizes pinhole correction if the unaided visual acuity is 6/9 or worse. A minimum of two 45° mydriatic digital photographs of the retina centered on the macula and the optic disc were used for DR grading. Additional anterior segment photographs were captured when the images were noticed to be inadequate at the time of capture. Such causes included cataract, corneal scars, and small pupils. NEC, in collaboration with the National Screening Service, agreed to a grading protocol for Diabetic RetinaScreen, aligned with the English National Diabetic Eye Screening Programme grading matrix.7 Retinal images were graded for retinopathy as R0, R1, R2, or R3, depending on the presence of signs of DR lesions and their severity. Images displaying surrogate markers of clinically significant macular oedema (CSMO), such as dot/blot hemorrhages, hard exudates, or retinal thickening within one disc diameter of the foveal centre, received a maculopathy grade of M1. Images without these markers were graded M0. Images with evidence of previous photocoagulation treatment were given a grade of P1, while those without were either left blank or given a grade of P0.
Graders further assigned an “adequate” or “inadequate” image quality grade. To be deemed “adequate”, at least an estimated 85% of the retina had to be clearly visible. If necessary, a jigsaw technique was employed, fusing together clear parts of the captured images, optimizing vessel details, and thus potentiating grading. If good-quality retinal images could not be obtained, then the images were given a U, ungradable, grade, and patients were referred for slit lamp-based grading. Onward referrals from screening underwent rigorous double-grading by two independent graders, with arbitration for disagreements performed by senior grading staff. Internal quality assurance involved ongoing training, multidisciplinary meetings, and audits, particularly focusing on image quality. Individuals unable to complete digital screening were assessed using an ungradable pathway or directly referred to a treatment center.4,8
Study Population
Patient’s data were extracted from the database managed by one of the Diabetic RetinaScreen providers (NEC) between the years 2018 and 2022. These data included information on patient demographics (such as age, sex, diabetes type) as well as the results of their screening appointments (DR grade, visual acuity, image quality). Risk factors previously found to be associated with TF were chosen for inclusion in the study.9 The screening program uses two-field (macula centered and disc centered) 45-degree images captured on quality assured and standardized cameras.4 For a subset of these patients, a review of images and charts was carried out. Fifty TFs from the months of February 2019, July 2019, February 2020, July 2020, and February 2021 were randomly selected. Pupillary dilation was termed inadequate if the radius of the pupillary aperture was less than half the iridial radius. This study followed the tenets of the Declaration of Helsinki.
A number of interventions were introduced between 2019 and 2021 with the aim of lowering the TF across the program; attempts to capture of an additional 45-degree fundal image for each eye aiming to provide a clearer, alternative view of the macula and optic disc in 2019, improved camera servicing processes in 2019, regular focused multi-disciplinary team meetings and quarterly clinic reviews for all screeners from 2019 onwards, the introduction of an additional dilating agent, phenylephrine 2.5%, for patients where tropicamide 1% had not sufficiently dilated the pupils in 2020.
Data Analysis
Primary analysis involved using all available data in the database to model which factors were associated with TF. This was achieved using a mixed-effects logistic regression model using nested patient-eye random effects.
Secondary analysis aimed at reviewing a subset of cases in more detail was carried out. Patient data from five time points between 2019 and 2021 were checked for the presence of cataract, rate of adequately dilated pupils, rate of anterior images captured, and the presence of camera artefacts on the lens.
All analyses were carried out in R (version 4.0.1; R Foundation for Statistical Computing, Vienna, Austria). A p-value of 0.05 or less was considered statistically significant.
Results
Primary Analysis
A total of 366,528 appointments from 104,407 patients over 5 years were included in the primary analysis. Table 1 shows the characteristics of the study population. The overall TF rate, as measured by an image being labelled as “Inadequate” was 4.9%. The majority of patients were labelled as Type 2 diabetes (89.6%) with just under 60% being male. The median duration of diabetes was 4.56 years.
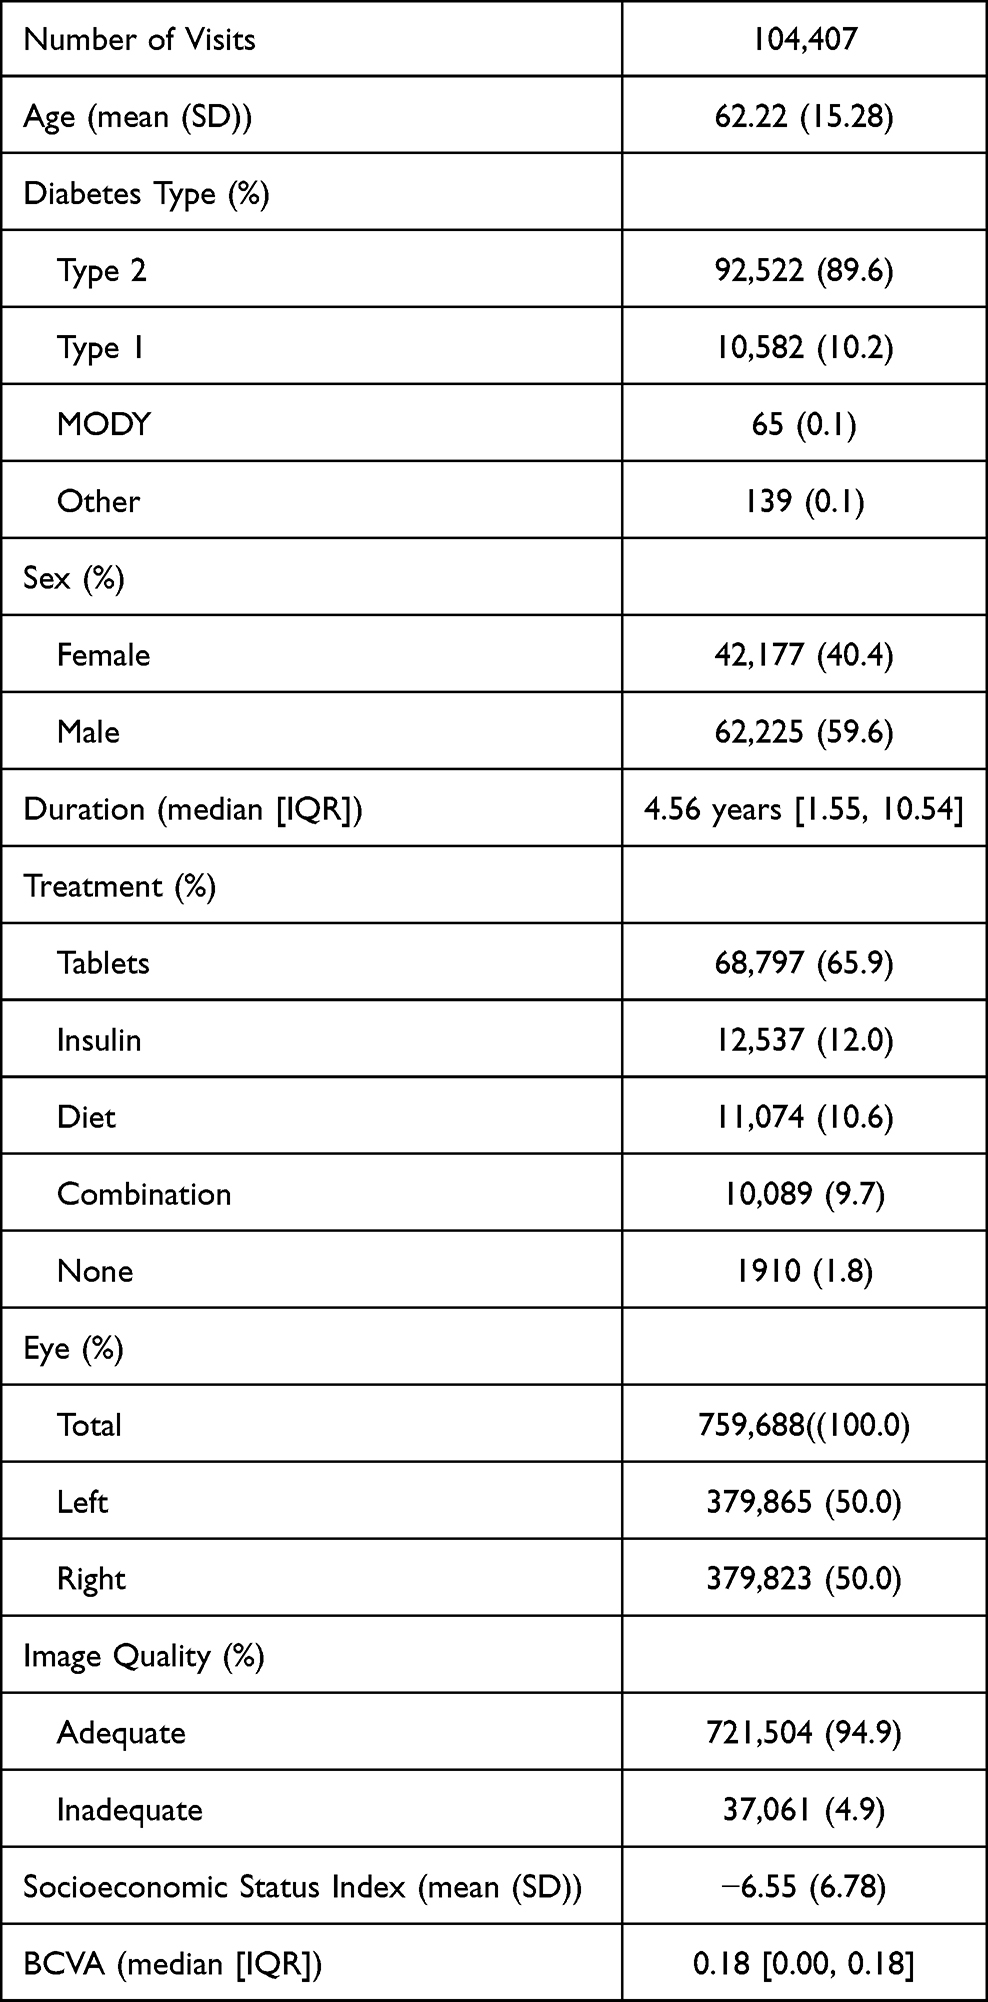 |
Table 1 Summary Statistics of the Population (Patient-Eye Level) |
The TF rate decreased from 6.6% to 3.5% between the years 2018 and 2022 (Figure 1). It should be noted that due to the COVID-19 pandemic, the number of screening appointments in 2020 decreased substantially.
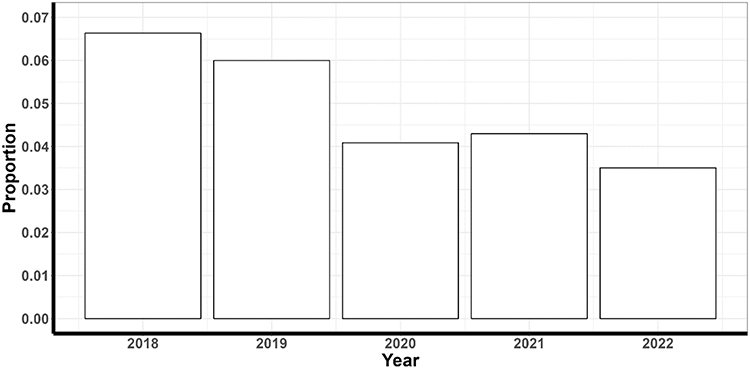 |
Figure 1 Rate of technical failures over time. Note: Due to Covid-19, the number of people screened was less. |
The results of the mixed effects model are found in Table 2. The rate of TF increased with age (OR: 1.01 per year, 95% CI: 1.01–1.01, p < 0.001), duration of diabetes (OR: 1.05 per year, 95% CI: 1.05–1.05, p < 0.001) and most significantly with cataract being present (OR: 17.86, 95% CI: 16.46–19.38, p < 0.001). Patient age did not significantly impact TF rate when controlled for diabetes type, socioeconomic status index, duration of diabetes, individual grader, and visual acuity.
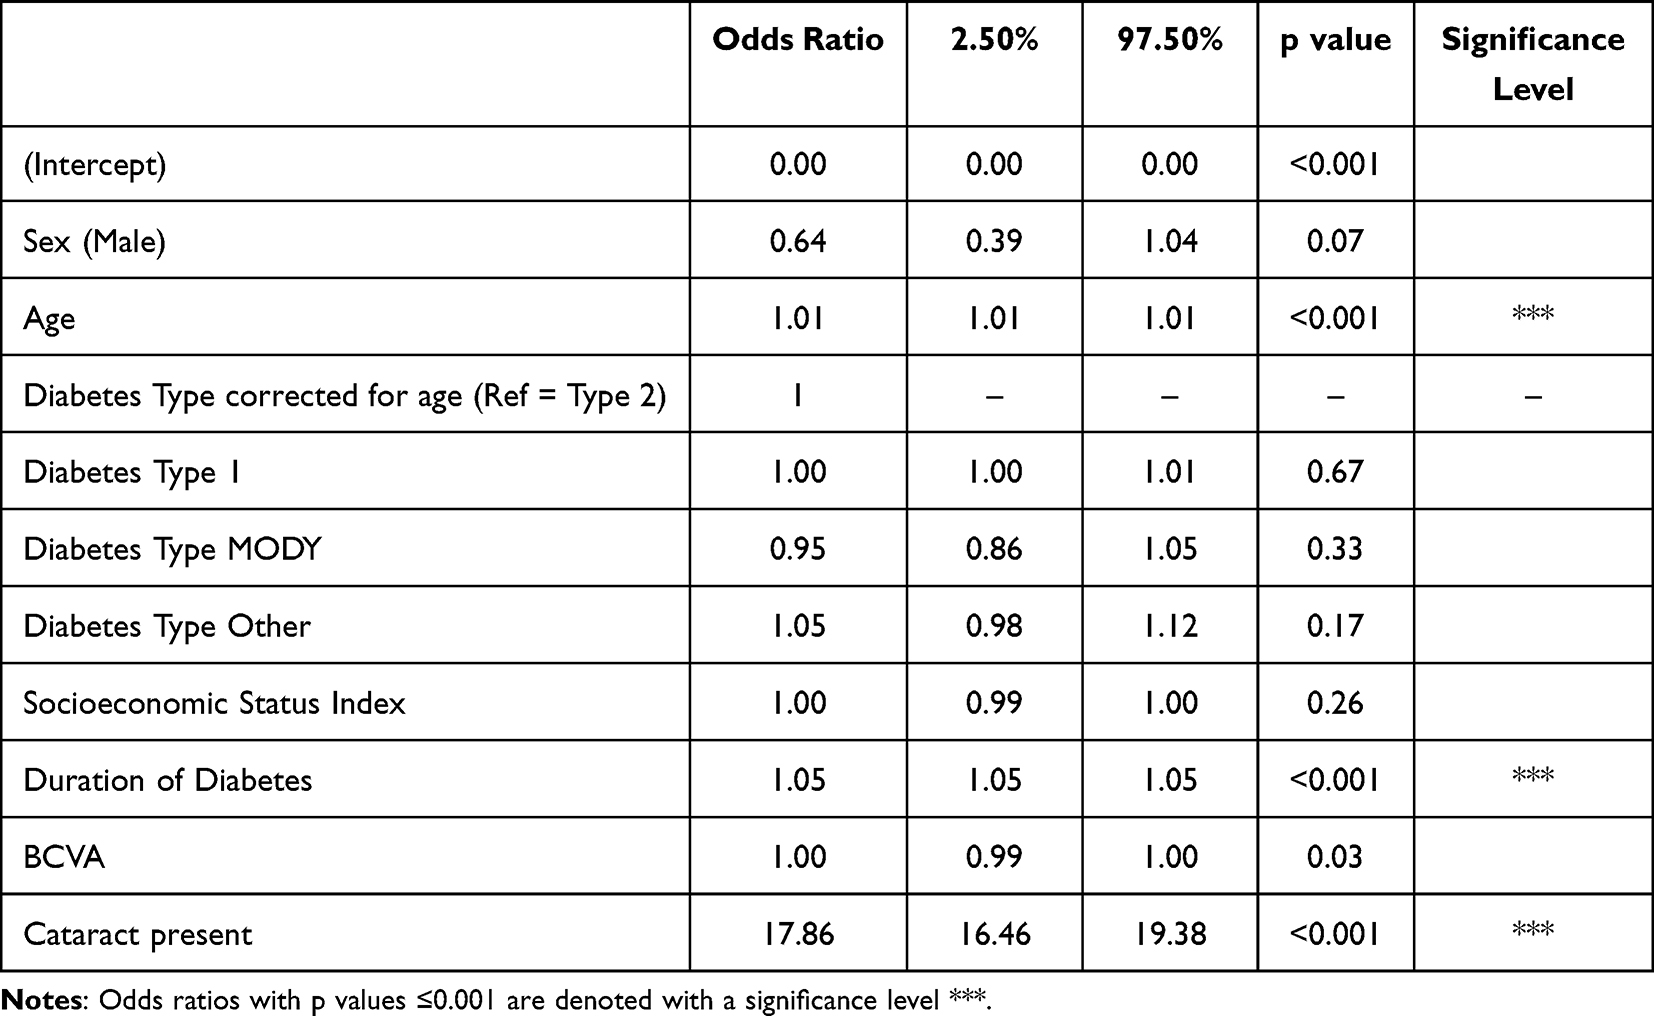 |
Table 2 Results of Mixed-Effects Logistic Regression Model (Association with TF Rate) |
There was no increased rate of TF observed with either gender, social deprivation level, or visual acuity.
Secondary Analysis
Technical Failures: Inadequate Pupil Dilation
Of the 250 TFs audited in the study, 108 (43.2%) had sufficiently dilated pupils, while 84 (35.6%) had inadequate dilation (Table 3). Phenylephrine 2.5% drops were introduced for supplemental dilation into the standard protocol in July 2020. Of those who were inadequately dilated, only 7 patients (7.86%) received dilation with phenylephrine 2.5%. In addition, it was unclear in the remaining 53 cases whether patients were adequately dilated or not; anterior segment imaging was performed in just 2 (3.92%) of these cases where the dilation status was uncertain.
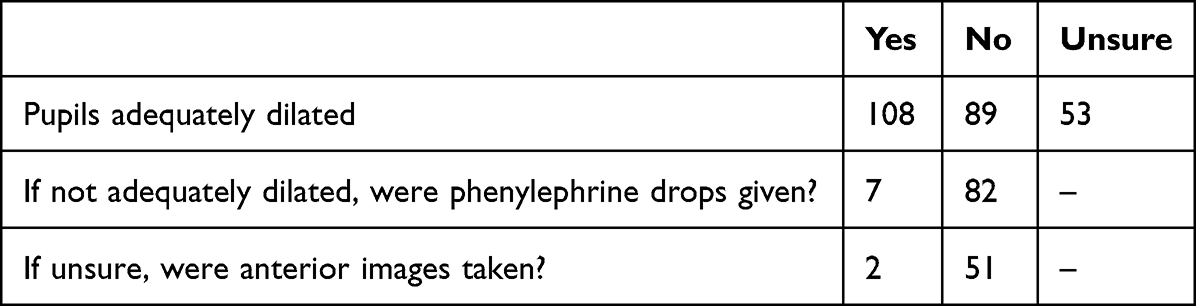 |
Table 3 Adequacy of Pupil Dilation |
Technical Failures: Cataract
The most common cause of TF at each periodic in-depth assessment was cataract, seen in 52% of all TFs (range 40–60%) (Table 4). In 100% of these TFs, cataract was seen in the eye implicated in the TF and therefore judged to be the reason for the TF (Table 5). Notably, in 25% of all TFs, no associated cataract was seen, while in 23%, the presence of cataract could not be determined (Table 4). In the majority of cases when there was uncertainty regarding the presence of cataract, no anterior imaging had been performed (Table 6). The capture rate of anterior images improved from 64% to 88%, enabling the identification of cataract and subsequent referral for slit-lamp confirmation and treatment.
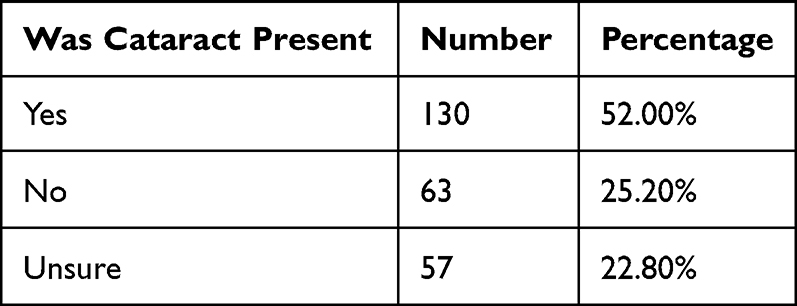 |
Table 4 The Presence of Cataract in the Setting of Technical Failure |
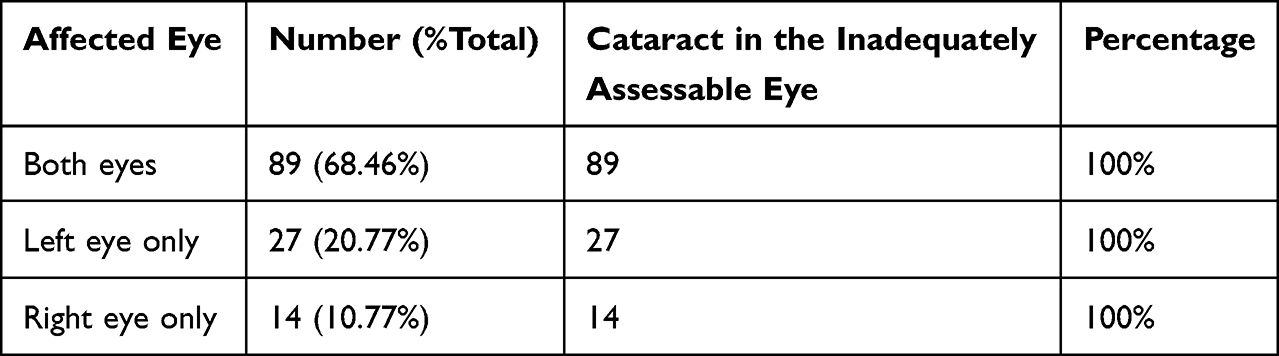 |
Table 5 Presence of Cataract in the Affected Eye When Cataract Was Present |
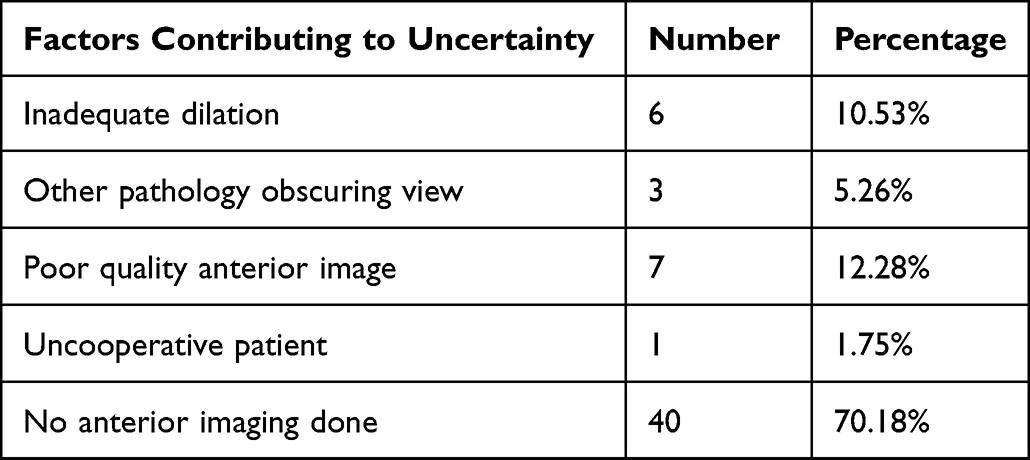 |
Table 6 Factors Contributing to Uncertainty Regarding the Presence of a Cataract in Cases of TF Were Identified (22.8% of Patients) |
Technical Failures: Camera Lens Artefact and Camera Servicing
Improved and more frequent camera maintenance led to a noteworthy decline in lens artefacts, decreasing from 46% in the first month of analysis to a mere 4% in the final month assessed (Table 7). Camera servicing had an immediate effect, with a 2.2% drop from 8.37% in October 2019 to 6.16% in December 2019. There was a 1.5% drop from 5.81% in October 2021 to 4.3% in December 2021. During servicing, the camera lenses were replaced, which addressed causes of TF such as incorrect focus, camera lens artefacts, and inadequate illumination.
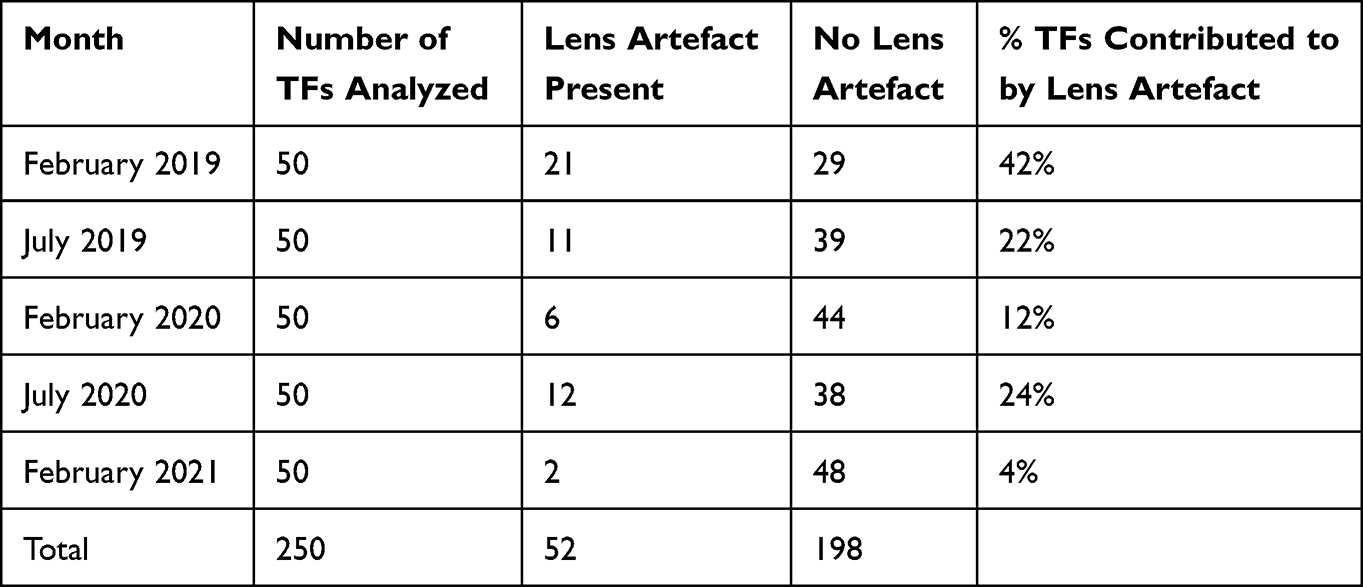 |
Table 7 Change in Percentage of Technical Failures Where Lens Artefact Was a Contributing Factor |
Technical Failures and Supplemental Posterior Segment Imaging
The incorporation of an extra fundal image for each eye, offering an alternative perspective of the optic disc and macular region, contributed to a reduction in the TF rate. Specifically, the TF rate decreased from 9% in March 2019 to 6% in April 2019 following the introduction of this additional retinal image. As shown in Table 8, the percentage of TFs where no extra fundus images were attempted significantly reduced from 70% in February 2019 before the incorporated change to 40% by February 2021 (chi-square statistic = 9.0909, p = 0026).
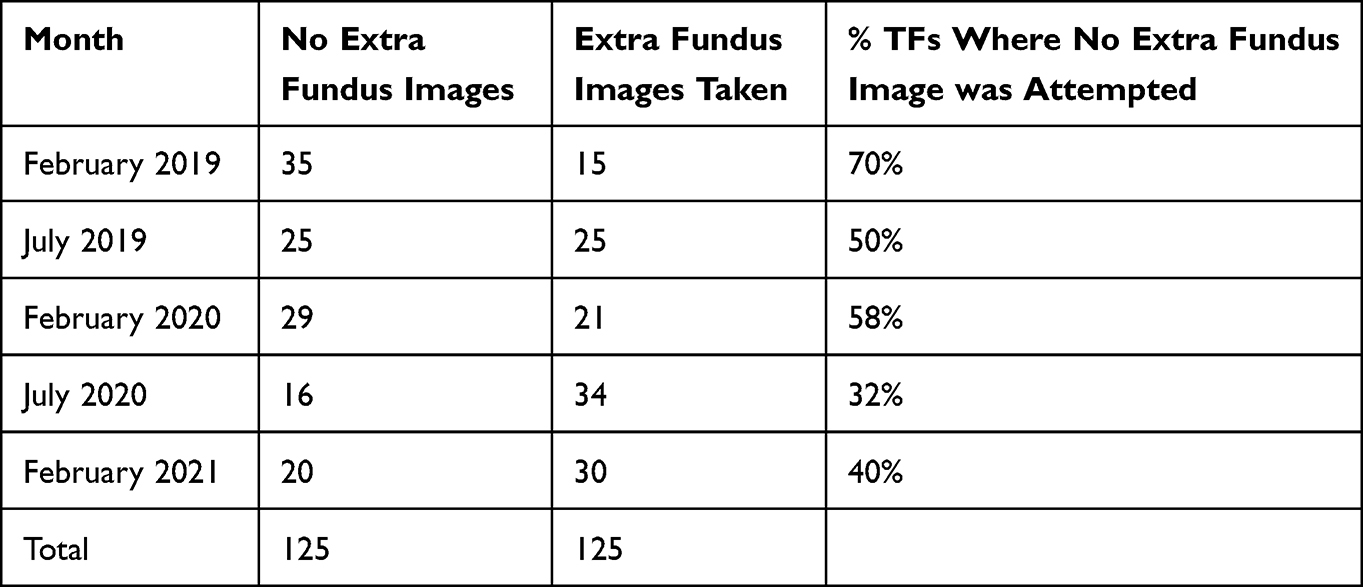 |
Table 8 Change in Percentage of Technical Failures Where No Extra Fundus Images Were Attempted |
Discussion
This study is the first to demonstrate the factors that are associated with TF in the Irish national DRS, Diabetic RetinaScreen. Our findings indicate that the TF rate increases with age, the duration of diabetes as well as the presence of a cataract. Specifically, patients with Type 2 diabetes mellitus had higher rates of TF compared with those with other types of diabetes. Over the 5-year study period, we demonstrated a steady decline in TF rate following the implementation of quality assurance strategies. In half of the audited TF cases, an optically dense cataract was shown to be the cause of our TF. Camera lens artefacts and inadequate dilation contributed to a significant proportion of the remaining 48% of cases and are remediable causes. Specifically, 31 (25.8%) of these patients had lens artefacts present that we felt were affecting the quality of the image, while 29 (24.2%) were inadequately dilated.
The reason for the TF remained undetermined in almost a quarter (23%) of cases. Our findings directly reflect the challenges encountered in a real-world DRS program and hold relevance for those considering the establishment of a DRS service.
Diabetic patients are up to five times more likely to develop cataracts and tend to develop them at an earlier age compared to non-diabetics.10–12 The increased prevalence of cataracts within a diabetic population significantly impacts on a DRS program as the acquisition of gradable images is made more challenging. Our reported TF rate of 52% due to the presence of an optically dense cataract aligns with findings from other studies. Scanlon et al found that in a group of 3650 mydriatic patients with a 3.7% failure rate, 57% of the ungradable images had an obvious central cataract and 21% exhibited early cataract.13 Rico-Sergado’s study of over 400 non-mydriatic patients with ungradable images found that 69.2% had a lens opacity.11 Murgatroyd et al determined that the presence of a posterior subcapsular cataract was highly predictive of ungradable nonmydriatic fundus photographs.9 The improved capture rate of anterior segment images shown in our study (from 64% to 88%), aided us to identify the presence of cataract and their role in causing TFs. Notably, just over two-thirds of our patients (68%) with ungradable images secondary to cataracts had bilateral involvement.
Approximately one-fifth of cataract extractions are performed on diabetic patients.14 This poses a significant challenge in the timely management of diabetic patients in Ireland, as surgical intervention is essential to avoid continued attendance at slit-lamp biomicroscopy examinations. This not only adds to patients’ travel burden due to limited availability of such clinics compared to DRS centers but also increases the overall cost of services. Given the relatively high non-attendance rates in DR screening appointments (18.5% in Ireland), addressing cataracts promptly becomes crucial for efficient and accessible diabetic retinopathy management.15
Numerous studies have shown that adequate pupillary dilation facilitates image acquisition and reduces the rate of ungradable images.12,16,17 While advantageous for imaging, the disadvantage of pupillary dilation from the patient’s perspective is that their vision becomes blurred, and temporarily prohibits driving.18 Nonetheless, this inconvenience mitigates the need for a further dilated assessment using slit-lamp biomicroscopy. We determined that just over a third of our patients (35.6%) were inadequately dilated, indicating a critical area for improvement. Dilation of the pupil becomes more difficult with increased duration of diabetes secondary to denervation of the autonomic pupillomotor nerve fibres.19 Scanlon et al suggested that the introduction of phenylephrine 2.5% along with tropicamide 1% could reduce the TF rate for patients over 80 years old.13 Although we introduced the option of phenylephrine 2.5% as a second dilating agent, we acknowledge that the impact of this additional intervention was not given adequate time to be sufficiently assessed, and we recognize this as a limitation of our study. The use of phenylephrine necessitates careful consideration due to potential drug interactions and contraindications in patients with cardiac disease, hypertension, or thyrotoxicosis. Despite these considerations, the national screening service clinical advisory group has opted to retain phenylephrine as an adjunctive dilating agent.20
Kanclerz et al performed a meta-analysis across imaging modalities, they found the TF rates for mydriatic digital fundus photography, non-mydriatic digital fundus photography, smartphone-based imaging, and ultrawide-field imaging (UWF) were 3.4%, 12.1%, 5.3%, and 2.2%, respectively.12 The TF rate was significantly different between all pairs of the analyzed techniques and the overall TF rate for all techniques was 6.6%, while the lowest TF rate (2.2%) was found in ultrawide field (UWF) photography.12 Our mean five-year TF rate, including both mydriatic and non-mydriatic digital fundus photography, was 4.9%. Silva et al compared ungradable image rates between nonmydriatic UWF imaging and nonmydriatic multifield fundus photography (NMFP) in a population-based DR teleophthalmology program.21 They found that the ungradable rate per patient for DR was significantly lower with UWF imaging compared with NMFP, namely 2.8% vs 26.9%. They concluded that the demonstrated benefit of UWF imaging may have resulted in part as high-resolution scanning laser ophthalmoscopy facilitates better imaging through media opacities and smaller pupils. Like Scanlon and our findings, Silva found a significant association between increased age, duration of diabetes, and the incidence of TF.13,21,22 The need for ongoing camera operator training and camera maintenance has also been highlighted by Raumviboonsuk et al.23 Taylor et al acknowledged that at the time of image acquisition, if a screener is poorly trained, their captured images may be unsuited for grading. While this study is unique, they identified a need to standardize camera settings and ensure that they are regularly audited for consistency.24
Besides employing UWF, another technique to circumvent the effect of cataract and acquire clear gradable images is to take additional posterior segment photographs. Programs providing a DRS service vary in their protocols; Scottish screeners take only one macula-centered digital fundus photograph per eye;25,26 like Ireland, the England, Wales, and Northern Ireland screening program protocols use two images: a macula and an optic disc-centered image.27 Looker reported that the rate of ungradable eyes in Scotland was 1.6% of all screening appointments from 2005 to 2011, though this figure referred to those assessed at slit lamp.28 The Scottish Diabetic Retinopathy Screening Collaborative quality assurance protocols have a set maximum rate of ungradable images at 2.5% for digital imaging.25 Notably, Martinez reported a TF rate of 8.8% when a single image foveal-centered photograph is used.29 Salongcay et al employed a five-field imaging protocol and used three different brands of handheld cameras.30 Their TF rate ran between 0% and 3.56%.30 Our TF rate decreased from 9% in March 2019 to 6% in April 2019 following the introduction of additional posterior segment imaging. Although taking extra images per eye may seem like an additional step in the screening process that requires extra resources and time, we feel reducing TF at the initial screen to avoid costly and unnecessary further slit-lamp biomicroscopy justifies the resource expenditure at this stage of screening.
Raumviboonsuk et al found that when performing real-time diabetic retinopathy screening using deep learning, the deep-learning system classified a significant number of images (14.8%) to be ungradable.31 Just 64% of images considered ungradable by the deep-learning system were also considered ungradable by their adjudication panel.31 However, the advantage of such an automated image curation system lies at the point of image capture. It can provide real-time feedback to the screening photographers and potentially reduce the incidence of low-quality images by up to 70%.32,33 It is worth noting that media opacity from cataract, present in over half the patients with TF in this analysis, will adversely impact retinal image quality, irrespective of whether the grading is conducted by humans or AI.
While a significant limitation of this real-world study is the absence of case controls for direct comparison of each intervention, this decision was deemed necessary to ensure patient care was not compromised. Despite this limitation, the study proves valuable through single group analysis and the use of historical data for comparison. The TF rates from 2020 to 2023 consistently remained below the historical rates of 0.05 observed in 2016 and 2017, with all rates below 0.045. Single group studies, despite lacking a direct concurrent comparison group, can provide valuable insights into causal treatment effects by extrapolating expected outcomes in the untreated arm, relying on before-after, implicit, or historical comparisons as comparison proxies.34 Additionally, the effects of each intervention were not assessed in isolation, and there were undoubtedly crossover effects. The interventions were likely to be synergistic, and following multidisciplinary teaching sessions, the screener was more likely to use all interventions possible to capture the best available images for grading. It was, however, possible to quantify the number of additional retinal and anterior segment images acquired; however, the weighting of various educational sessions was more difficult to standardize.
Some causes of TF remain as significant challenges. When screening for DR in patients with dense corneal opacities or significant asteroid hyalosis, slit-lamp biomicroscopy is often employed. Indirect ophthalmoscopy may be the preferred way to assess DR in immobile and/or cognitively impaired patients. Hand held cameras have been successfully used to bring DRS to the patient rather than have the patient attend a clinic.30,35 A hand-held camera would be potentially useful to screen those individuals with mobility challenges when positioning their head on the chinrest of a camera.
Conclusion
This study underscores the importance of comprehensive interventions aimed at reducing TF rates and improving the effectiveness of DRS programs. In particular, this study highlights the significant impact of patient factors, particularly cataracts, on the TF rate. Cataracts were involved in over 50% of TF cases, presenting a challenge that cannot be fully overcome at a screening level. As a result, most patients with cataracts still require referral to optometric services. However, through targeted interventions such as addressing photographer/photographic errors with the introduction of a third alternative-view fundus photograph and more focused multi-disciplinary meetings, as well as implementing enhanced and regular camera servicing, the overall TF rate was successfully reduced. By addressing modifiable factors and considering patient-specific challenges, we can enhance the quality of DRS and ultimately improve patient outcomes.
Ethics Statement
This study meets the categorization of clinical audit as per the National Office of Clinical Audit (NOCA) GDPR Assessment table Further ethics review was not required by the Reference Research Ethics Committee Midlands Area and Corporate (Regional Health Area B), in accordance with research regulations of Ireland.
Disclosure
Edel McBride, Joanne Harmon, and Shane McMahon are employed by NEC Care, Ireland. Robert Acheson and Louise O’Toole have contractual relationships with NEC Care, Ireland. Louise O’Toole also reports travel grant from and advisory board for Bayer Pharmaceuticals and Novartis Pharmaceuticals, outside the submitted work. Robert Acheson is a founding director of Diabetic Retinopathy-Clinical and Management Services (DR-CMS). Helen Kavanagh and David J Keegan are employed by the National Screening Service, Ireland. The authors report no other conflicts of interest in this work.
References
1. Singer ME, Dorrance KA, Oxenreiter MM, Yan KR, Close KL. The type 2 diabetes “modern preventable pandemic” and replicable lessons from the COVID-19 crisis. Prev Med Reports. 2022;25. doi:10.1016/J.PMEDR.2021.101636
2. Estil S, Steinarsson AE, Einarsson S, Aspelund T, Stefánsson E. Diabetic eye screening with variable screening intervals based on individual risk factors is safe and effective in ophthalmic practice. Acta Ophthalmol. 2020;98(4):343–346. doi:10.1111/AOS.14425
3. Liew G, Michaelides M, Bunce C. A comparison of the causes of blindness certifications in England and Wales in working age adults (16-64 years), 1999-2000 with 2009-2010. BMJ Open. 2014;4(2):1–6. doi:10.1136/bmjopen-2013-004015
4. Pandey R, Morgan MM, Murphy C, et al. Irish National Diabetic RetinaScreen Programme: report on five rounds of retinopathy screening and screen-positive referrals. (INDEAR study report no. 1). Br J Ophthalmol. 2022;106(3):409–414. doi:10.1136/bjophthalmol-2020-317508
5. Lin J, Yu L, Weng Q, Zheng X. Retinal image quality assessment for diabetic retinopathy screening: a survey. Multimed Tools Appl. 2020;79:16173–16199.
6. Diabetic RetinaScreen. Standards for Quality Assurance in Diabetic RetinaScreen. Dublin; 2019.
7. Scanlon PH. The English National Screening Programme for diabetic retinopathy 2003–2016. Acta Diabetol. 2017;54(6):515–525. doi:10.1007/S00592-017-0974-1/TABLES/5
8. National Screening Service Quality Assurance Committee for Diabetic Retinopathy Screening. Standards for Quality Assurance in Diabetic Retinopathy Screening. Dublin: Ireland; 2019.
9. Murgatroyd H, Cox A, Ellingford A, Ellis JD, MacEwen CJ, Leese GP. Can we predict which patients are at risk of having an ungradeable digital image for screening for diabetic retinopathy? Eye. 2008;22(3):344–348. doi:10.1038/SJ.EYE.6702611
10. Scanlon PH, Malhotra R, Thomas G, et al. The effectiveness of screening for diabetic retinopathy by digital imaging photography and technician ophthalmoscopy. Diabet Med. 2003;20(6):467–474. doi:10.1046/J.1464-5491.2003.00954.X
11. Rico-Sergado L, Pérez-Canales JL, Pérez-Santonja JJ. Effect of visual impairment on teleretinal imaging for diabetic retinopathy screening. Ophthalmic Surg Lasers Imaging Retin. 2016;47(1):42–48. doi:10.3928/23258160-20151214-06
12. Kanclerz P, Tuuminen R, Khoramnia R. Imaging Modalities Employed in Diabetic Retinopathy Screening: a Review and Meta-Analysis. Diagnostics. 2021;11:1802. doi:10.3390/DIAGNOSTICS11101802
13. Scanlon PH, Foy C, Malhotra R, Aldington SJ. The influence of age, duration of diabetes, cataract, and pupil size on image quality in digital photographic retinal screening. Diabetes Care. 2005;28(10):2448–2453. doi:10.2337/DIACARE.28.10.2448
14. Hamilton AM UMPP. Epidemiology of Diabetic Retinopathy. In: Editors. Management of Diabetic Retinopathy. London:: BMJ Publishing G; 1996.
15. Kelly SR, Loiselle AR, Pandey R, et al. Factors associated with non-attendance in the Irish national diabetic retinopathy screening programme (INDEAR study report no. 2). Acta Diabetol. 2021;58(5):643–650. doi:10.1007/s00592-021-01671-4
16. Murgatroyd H, Ellingford A, Cox A, et al. Effect of mydriasis and different field strategies on digital image screening of diabetic eye disease. Br J Ophthalmol. 2004;88(7):920. doi:10.1136/BJO.2003.026385
17. Piyasena MMPN, Murthy GVS, Yip JLY, et al. Systematic review and meta-analysis of diagnostic accuracy of detection of any level of diabetic retinopathy using digital retinal imaging. Syst Rev. 2018;7(1):1–18. doi:10.1186/S13643-018-0846-Y/TABLES/4
18. Working Group on Traffic Medicine. Report on Medical Fitness to Drive Standards 2016. Dublin; 2016.
19. Cahill M, Eustace P, De Jesus V. Pupillary autonomic denervation with increasing duration of diabetes mellitus. Br J Ophthalmol. 2001;85(10):1225–1230. doi:10.1136/BJO.85.10.1225
20. National Screening Service Clinical Advisory Group. Use of Phenylephrine on the Diabetic RetinaScreen Programme. Dublin; 2023.
21. Silva PS, Horton MB, Clary D, et al. Identification of Diabetic Retinopathy and Ungradable Image Rate with Ultrawide Field Imaging in a National Teleophthalmology Program. Ophthalmology. 2016;123(6):1360–1367. doi:10.1016/J.OPHTHA.2016.01.043
22. Silva PS, Cavallerano JD, Tolls D, et al. Potential efficiency benefits of nonmydriatic ultrawide field retinal imaging in an ocular telehealth diabetic retinopathy program. Diabetes Care. 2014;37(1):50–55. doi:10.2337/DC13-1292
23. Raumviboonsuk P, Krause J, Chotcomwongse P, et al. Deep learning versus human graders for classifying diabetic retinopathy severity in a nationwide screening program. NPJ Digit Med. 2019;2:25. doi:10.1038/s41746-019-0099-8
24. Taylor DJ, Goatman KA, Gregory A, Mark Histed CN, Martin TJW. Image-quality standardization for diabetic retinopathy screening. Expert Rev Ophthalmol. 2009;4(5):469–476. doi:10.1586/eop.09.39
25. Scottish Diabetic Retinopathy Screening Collaborative. Diabetic Retinopathy Screening Service Annual Report 2018/19. Inverness; 2012.
26. Mellor J, Jiang W, Fleming A, et al. Can deep learning on retinal images augment known risk factors for cardiovascular disease prediction in diabetes? A prospective cohort study from the national screening programme in Scotland. Int J Med Inform. 2023:175. doi:10.1016/J.IJMEDINF.2023.105072
27. Diabetic eye screening: guidance when adequate images cannot be taken - GOV.UK. Available from: https://www.gov.uk/government/publications/diabetic-eye-screening-pathway-for-images-and-where-images-cannot-be-taken/diabetic-eye-screening-guidance-when-adequate-images-cannot-be-taken.
28. Looker HC, Nyangoma SO, Cromie DT, et al. Predicted impact of extending the screening interval for diabetic retinopathy: the Scottish Diabetic Retinopathy Screening programme. Diabetologia. 2013;56(8):1716. doi:10.1007/S00125-013-2928-7
29. Martinez J, Hernandez-Bogantes E, Wu L. Diabetic retinopathy screening using single-field digital fundus photography at a district level in Costa Rica: a pilot study. Int Ophthalmol. 2011;31(2):83–88. doi:10.1007/S10792-010-9413-9
30. Salongcay RP, Martin C, Jacoba P, et al. One-field, two-field and five-field handheld retinal imaging compared with standard seven-field Early Treatment Diabetic Retinopathy Study photography for diabetic retinopathy screening. Br J Ophthalmol. 2023;1:1–7. doi:10.1136/bjophthalmol-2022-321849
31. Ruamviboonsuk P, Tiwari R, Sayres R, et al. Real-time diabetic retinopathy screening by deep learning in a multisite national screening programme: a prospective interventional cohort study. Lancet Digit Heal. 2022;4(4):e235–e244. doi:10.1016/S2589-7500(22
32. Dai L, Wu L, Li H, et al. A deep learning system for detecting diabetic retinopathy across the disease spectrum. Nat Commun. 2021;12(1):3242. doi:10.1038/s41467-021-23458-5
33. van der Heijden AA, Abramoff MD, Verbraak F, van Hecke MV, Liem A, Nijpels G. Validation of automated screening for referable diabetic retinopathy with the IDx-DR device in the Hoorn Diabetes Care System. Acta Ophthalmol. 2018;96(1):63–68. doi:10.1111/aos.13613
34. Paulus JK, Dahabreh IJ, Balk EM, Avendano EE, Lau J, Ip S. Opportunities and challenges in using studies without a control group in comparative effectiveness reviews. Res Synth Methods. 2014;5(2):152–161. doi:10.1002/JRSM.1101
35. Cushley LN, Quinn NB, Blows P, McKeever E, Peto T. The Integration of Diabetic Eye Screening into Hemodialysis Units in Northern Ireland. Kidney360. 2022;3(9):1542–1544. doi:10.34067/KID.0001802022
 © 2024 The Author(s). This work is published and licensed by Dove Medical Press Limited. The
full terms of this license are available at https://www.dovepress.com/terms
and incorporate the Creative Commons Attribution
- Non Commercial (unported, 3.0) License.
By accessing the work you hereby accept the Terms. Non-commercial uses of the work are permitted
without any further permission from Dove Medical Press Limited, provided the work is properly
attributed. For permission for commercial use of this work, please see paragraphs 4.2 and 5 of our Terms.
© 2024 The Author(s). This work is published and licensed by Dove Medical Press Limited. The
full terms of this license are available at https://www.dovepress.com/terms
and incorporate the Creative Commons Attribution
- Non Commercial (unported, 3.0) License.
By accessing the work you hereby accept the Terms. Non-commercial uses of the work are permitted
without any further permission from Dove Medical Press Limited, provided the work is properly
attributed. For permission for commercial use of this work, please see paragraphs 4.2 and 5 of our Terms.