Back to Journals » Clinical Interventions in Aging » Volume 9
Additional measures do not improve the diagnostic accuracy of the Hospital Admission Risk Profile for detecting downstream quality of life in community-dwelling older people presenting to a hospital emergency department
Authors Grimmer K, Milanese S, Beaton K, Atlas A, Kennedy K
Received 16 October 2013
Accepted for publication 25 November 2013
Published 23 January 2014 Volume 2014:9 Pages 233—242
DOI https://doi.org/10.2147/CIA.S56086
Checked for plagiarism Yes
Review by Single anonymous peer review
Peer reviewer comments 4
K Grimmer, S Milanese, K Beaton, A Atlas
International Centre for Allied Health Evidence, University of South Australia, Adelaide, SA, Australia
Introduction: The Hospital Admission Risk Profile (HARP) instrument is commonly used to assess risk of functional decline when older people are admitted to hospital. HARP has moderate diagnostic accuracy (65%) for downstream decreased scores in activities of daily living. This paper reports the diagnostic accuracy of HARP for downstream quality of life. It also tests whether adding other measures to HARP improves its diagnostic accuracy.
Methods: One hundred and forty-eight independent community dwelling individuals aged 65 years or older were recruited in the emergency department of one large Australian hospital with a medical problem for which they were discharged without a hospital ward admission. Data, including age, sex, primary language, highest level of education, postcode, living status, requiring care for daily activities, using a gait aid, receiving formal community supports, instrumental activities of daily living in the last week, hospitalization and falls in the last 12 months, and mental state were collected at recruitment. HARP scores were derived from a formula that summed scores assigned to age, activities of daily living, and mental state categories. Physical and mental component scores of a quality of life measure were captured by telephone interview at 1 and 3 months after recruitment.
Results: HARP scores are moderately accurate at predicting downstream decline in physical quality of life, but did not predict downstream decline in mental quality of life. The addition of other variables to HARP did not improve its diagnostic accuracy for either measure of quality of life.
Conclusion: HARP is a poor predictor of quality of life.
Keywords: functional decline, HARP, quality of life, older people
Introduction
Functional decline (FD) is the loss of functional autonomy, reflected in a gradual decrease in the ability to live independently and safely in the community.1 The World Health Organization2 describes that autonomy is compromised by the deleterious effects of biological or psychological aging. Reduced functional autonomy has been associated with increased mortality rates, increased rates of health service use and institutionalization, and greater health care costs.3–5
Measurement of individual FD is complex, and there is currently no standard definition of the attributes of FD, or a comprehensive assessment for risk factors for FD.6 The most common place for assessment of FD risk is in hospital, when an older person comes to the attention of health care providers, usually in a health crisis. Given the temporal nature of FD, the validity of a point-in-time assessment of incipient (suspected) FD in hospital can only be determined by longitudinal (downstream) changes in patients’ functional autonomy.2–5 Assessment of the risk of downstream functional decline in a hospital is reported as an effective strategy to attenuate the effects of aging, if it leads to interventions to improve or maintain independent community living.7–18
Systematic reviews have found fewer than ten FD assessment instruments with published psychometric properties.15,19,20 These instruments have a range of psychometric properties, although they include similar core elements of functional ability, age, and cognition. Additional items are included in some instruments, ostensibly to improve diagnostic accuracy. These are generally correlates of FD, including ambulation, leg strength, and use of a walking aid,21–25 assistance required to travel, education status,23 living status (eg, alone), polypharmacy, hearing and seeing well, and memory problems.24,25
The Hospital Admission Risk Profile (HARP) instrument26 has been adopted in Australian hospitals for routine assessment of older people for discharge planning purposes. HARP provides a composite risk score for FD (categorized as low, moderate, or high) via a formula that combines scores for increasing age (calculated as 10-year categories from age 65 years), Abbreviated Mini-Mental State Examination (AMMSE) Score27 of less than 15, and less than median scores on the total Instrumental Activities of Daily Living (IADL) scale.28 The IADL total score is the sum of scores from eight domains (each scored as unable to manage: 0; needs some help: 1; or independent: 2). Domains comprise using the telephone, taking medications, managing money, getting to places beyond walking distance, preparing meals, grocery shopping, doing housework or handyman work, and doing laundry.
Sager et al26 developed the HARP on cohorts of older Americans, and validated its predictive capacity against a downstream (unspecified) measure of basic activities of daily living, collected 3 months after HARP administration. Predictive validity of HARP was moderate as reported by the area under the (receiver operator characteristic) curve (AUC; 0.65). HARP predictive validity has been subsequently investigated in studies of older hospitalized people in Belgium29 and the Netherlands.30 Both studies used the Katz Activities of Daily Living Instrument31 3 months after HARP assessment for downstream validation purposes. These studies reported similar AUC values to Sager et al26 (0.68; 95% confidence interval [CI] 50.57–0.77),29 and for low (0.65), intermediate (0.60) and high FD risk (0.56).30
Thus, to date, testing the diagnostic accuracy of HARP has been with measures of basic activities of daily living taken 3 months after HARP delivery.26,29,30 Attenuated activities of daily living are not the only feature of FD,2–6 thus other measures may provide different information regarding HARP predictive validity. This paper reports on new information and the diagnostic accuracy of HARP validated against downstream quality of life measured at 1 and 3 months post HARP assessment. It also reports on whether the addition of other predictors of FD to HARP improves the diagnostic accuracy for detecting downstream reduced quality of life.
Methods
Ethics
Ethical approval for the study was provided by the Human Research Ethics Committees of the authors’ university (HREC No: P364/09) and the participating health care facility (RAH REC No: 091202a). Subjects provided written consent when they were recruited after reading the information sheet in conjunction with the researcher who recruited them.
Setting
The Emergency Department (ED) of one large public tertiary Australian hospital. This hospital routinely used the HARP instrument to assess older individuals for the risk of FD.
Timing of research
This study took place from September 2011 to February 2012.
Sample
The sample consisted of consenting individuals aged 65 years or older who were living independently in the community. They were recruited when they presented to the ED for the management of a medical problem for which they were discharged directly from ED (without a related hospital ward admission). Eligibility for the study was confirmed if they were not subsequently admitted to any hospital for any reason up to 1-week after recruitment. Our recruitment process and over-time sampling methods are described elsewhere.6,32
Researchers
All recruiters in the ED were currently practicing health professionals (doctors, physiotherapists, nurses, or occupational therapists). At recruitment, each potential participant was assisted in reading and understanding the information sheet and consent form, and the researcher asked consenting, eligible participants the questions about baseline measures and recorded the answers. The only question that participants answered themselves was the one on the AMMSE where they had to replicate a shape.
Measures
Baseline
At recruitment in the ED, eligible individuals provided information on predictors of FD;32 namely, age, sex, primary language, highest level of education, postcode (used to calculate socioeconomic status [SES]),33 living status, requiring care to assist with daily activities, using a gait aid regularly, and receiving formal community supports. Information was collected on outcome measures for FD, namely the number of falls experienced in the past 12 months (using Russell et al’s34 instrument), hospitalizations in the past 6 months, Lawton’s IADL instrument (reflecting on the past 1–2 days),28 and the AMMSE27 (a point-in-time measure). Individual HARP scores were calculated using the Sager et al26 formula, which applies scores for age categories, low AMMSE, and low IADL scores. HARP scores classify FD risk as low =0, moderate =1, and high =2.26
Follow-up
Data was captured at 1 and 3 months post recruitment to provide an additional data point on the trajectory of FD compared to what has been provided in previous HARP validation studies (all of which only collected data at three months post assessment). Participants completed a telephone interview at both time points. For the six patients with poor English comprehension and language (identified at baseline), all were accompanied by an English-speaking family member who assisted with translating questions and answers in the ED. Similar support from family members was provided for these participants at telephone follow-up. At each telephone follow-up, subjects confirmed their eligibility and consent, postcode, current living status, use of care and gait aid, and receipt of formal community supports. Subjects provided responses to the same IADLs questions,28 as well as falls34 and hospitalizations since last contact. In addition, a new measure was delivered at both follow-up points: quality of life (assessed over the last 4 weeks [12-item Short Form Health Survey {SF12}]).35 Quality of life is the measure of downstream FD considered in this paper.
Data management
Data at each time point was entered into a purpose-built Microsoft Excel file (Microsoft Corporation, Redmond, WA, USA) linked by unique patient identifiers. HARP scores were dichotomized as low risk (0) and combined moderate (1) or high risk (2) (classified as 1). As the HARP score was based on age categories, there was no need to consider age as a FD predictor in subsequent modeling. All but one FD predictor was categorized in binary form for analysis purposes; namely, primary language (English not first language =1), requiring care (1), receiving community support (1), education (primary only =1, primary and secondary only =2, any tertiary =3), and using a gait aid (1). The 10 level SES classification33 was collapsed into five ranks for analysis to account for small numbers in some cells, with the lowest rank (SES 1 or 2) used as the default.
SF12 scores were calculated using the scoring template36 and reported as physical and mental component scores (PCS and MCS respectively). Population thresholds for age-sex categories were applied to these scores37 to provide age-sex standardized individual subject thresholds for low/high PCS and MCS (with below-threshold component scores categorized as 1). This approach adjusted quality of life scores for age and sex, meaning that neither of these variables was required in subsequent predictive models. PCS and MCS were analyzed in two ways:
- Point-in-time for participants whose PCS or MCS scores fell below their relevant population age-sex group mean at either 1 or 3 months.
- Over the 2 months between the second and third data capture points (1 and 3 months after recruitment), which identified those participants with:
- low PCS or MCS at both follow-up points;
- high PCS or MCS at 1 month follow-up but low PCS or MCS at 3-month follow-up;
- low PCS and MCS at both 1 and 3 months’ follow-up;
- high PCS and MCS at 1 month follow-up but low PCS and MCS at 3-month follow-up.
Analysis
The research questions were “How well does HARP predict downstream quality of life?” and “Does the inclusion of predictors of FD increase the predictive capacity of the HARP in terms of downstream quality of life?” Age and sex descriptors were calculated for the sample, and differences in PCS and MCS were calculated for age-sex groups using analysis of variance (ANOVA) models.
To answer the first question, univariate logistic regression models were constructed to test the associations between PCS, MCS, and HARP. To answer the second question, HARP, PCS, MCS, and FD predictors were first regressed against each other in univariate models to test for strength and independence. The predictor variables with significant univariate associations with PCS or MCS were flagged for further analysis. However, variables with significant associations with HARP were not considered for further analysis to avoid over-controlling the diagnostic models.38 Stepwise multivariate logistic regression models were then constructed using the different combinations of binary scored MCS and PCS as outcome measures, HARP as the primary predictor, and then individually adding the FD predictor variables that were significantly associated with MCS or PCS (but not with HARP) in ranked order by strength of association with the quality of life component scores. Where any additional variable did not significantly influence the strength of the model by significantly changing the likelihood ratio (based on the P-value associated with the amount of change), the variable was not retained. Statistics from univariate and multivariate models were reported as odds ratios (ORs) and 95% CI. The parameter estimates from the most efficient predictor multivariate models were used to construct subject-specific predictor scores. Receiver operator characteristic curves were constructed, and AUCs were calculated for the different quality of life outcomes. SAS Version 9.4 (SAS Institute, Cary, NY, USA) and MedCalc (MedCalc Software bvba, Ostend, Belgium) were used for analysis.
Results
Sample
One hundred and forty-eight individuals remained eligible for the study at both 1 and 3 months post-recruitment and provided measures of quality of life by telephone interview at both follow-up points. This sample consisted of 68 males and 80 females, with females being significantly older than males (mean age [95% CI] 77.8 [75.9–79.7]; 74.9 [73.4–76.4], respectively; P<0.05). The age-sex categories are reported in Figure 1.
 | Figure 1 Age-sex classifications for participants. |
HARP scores
Of the 148 participants, 83 (56.1%) had no risk of FD (HARP score =0), 51 (34.5%) had moderate risk of FD (HARP score =1), and the remainder (N=14, 9.5%) had high risk of FD (HARP score =2). Individuals with moderate or high risk HARP scores were combined for analysis purposes because of the small numbers in the high risk group.
Quality of life scores
There was no significant sex difference in mean MCS at 1 month (male mean 52.1 [standard deviation {SD} 8.1]; female mean 52.2 [SD 8.6]); however, males had a significantly higher mean MCS score at 3 months (mean 54.3 [SD 6.5]) than females (mean 51.7 [SD 8.9]). There were significant sex differences for PCS at both 1 and 3 months, with males having higher mean scores for both instances (1 month male mean 46.5 [SD 11.0]; females 42.0 [SD 10.3]; 3-month male mean 46.2 [SD 11.2]; female 40.6 [SD 10.9]). Across the four age groups, there were significant differences only in mean MCS at 1 month, and PCS at 3 months (Table 1). Subsequent classification of individual MCS and PCS as above or below age-sex standardized population thresholds essentially deconfounded predictive models for the influence of sex and age.
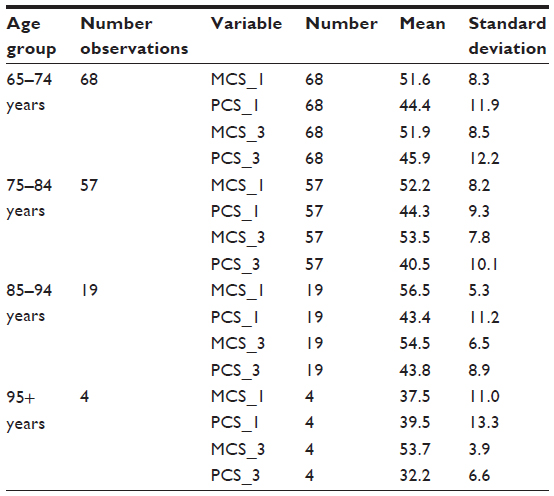 | Table 1 Age classification means for physical and mental component quality of life scores at 1 and 3 months |
Considering PCS, 52 participants scored below age-sex threshold scores at both follow-up points (months one and three), and 18 participants scored high on month one and low on month three (total 70/148 [47%] individuals who were low, or declined, in PCS over time). There were 44 participants who scored low at both 1 and 3 months for MCS, and 22 individuals whose scores declined from high to low over time (total 66/148 [44%] who deteriorated over time). Twenty-three participants scored low on both PCS and MCS at both 1 and 3 month follow-ups, and two participants deteriorated between months one and three in both MCS and PCS (total 25 participants of 148 [17%]). Consistently low or declining MCS scores were significantly associated with consistently low or declining PCS scores (OR 2.4 [CI 1.2–4.6]).
Quality of life scores predicted by HARP
Significant associations were found between:
- PCS at 1 and 3 months and HARP; and
- consistently low, or deteriorating, PCS and HARP.
There was no convincing association between HARP and MCS at any follow-up time point (Table 2). AUCs for HARP, using downstream PCS as a measure of FD, approximated the AUCs that were reported when HARP was validated against downstream basic activities of daily living (3 months after assessment).26,29,30 As an example of the AUCs found in this study, Figure 2 reports the receiver operator characteristic curve derived from the model of HARP predicting consistently low or declining PCS at 1 and 3 month follow-ups.
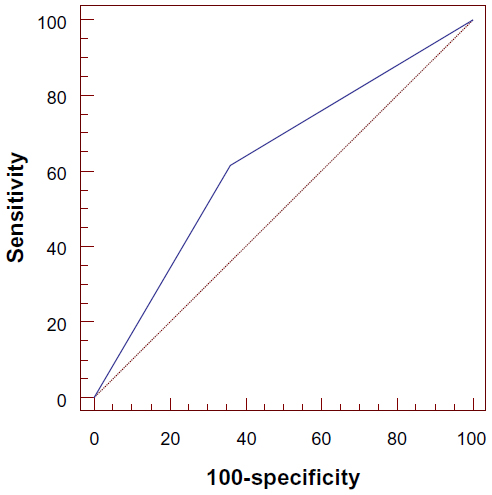 | Figure 2 Receiver operator characteristic curve derived from HARP predicting consistently low or declining PCS over 2 months (1 and 3 months after HARP was calculated). |
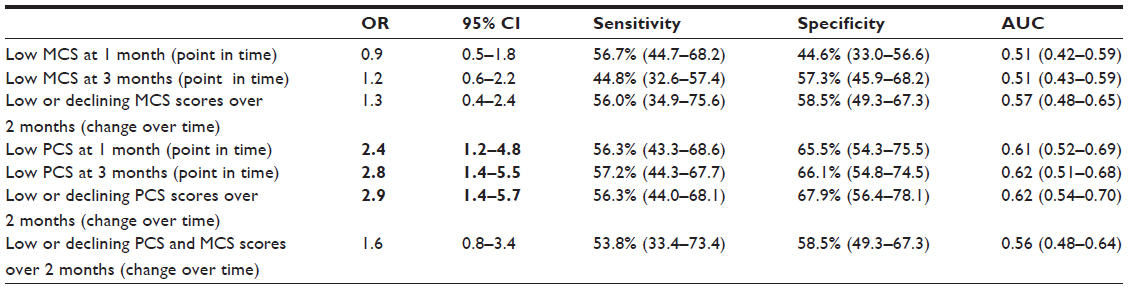 | Table 2 Association between HARP and quality of life components (MCS and PCS) |
Quality of life scores and predictor variables
Having a carer and using a gait aid were significantly correlated with MCS and PCS at one month follow-up, and PCS at three months follow-up. Receiving community supports was significantly correlated with PCS at both time points. Speaking a primary language other than English was significantly correlated with MCS at three months. Using a gait aid was significantly associated with low and deteriorating measures for both MCS and PCS. Requiring care and receiving community supports was associated with consistently low or deteriorating PCS, and speaking a primary language other than English was associated with consistently low or deteriorating MCS (Table 3).
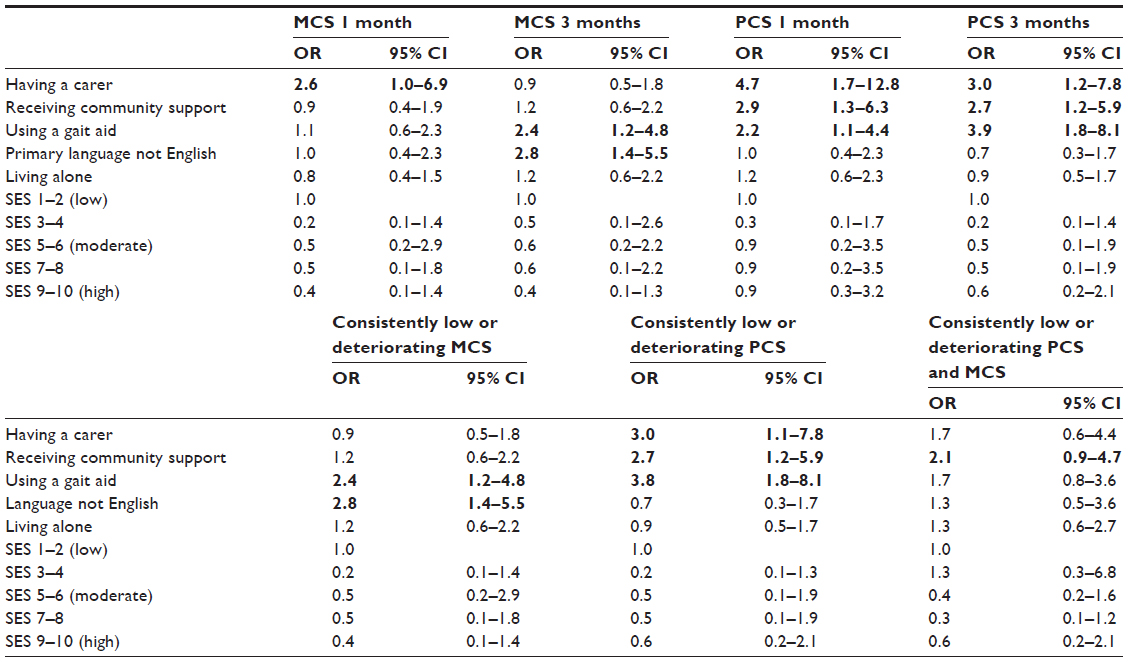 | Table 3 Quality of life (as measured by SF12 component scores) and predictor variables of FD |
Testing for independence
High HARP scores (elevated risk of FD) were significantly related to requiring care, receiving community support, using a gait aid, and living alone. Receiving community support was significantly related to using a gait aid and living alone, and using a gait aid was significantly related to living alone (Table 4).
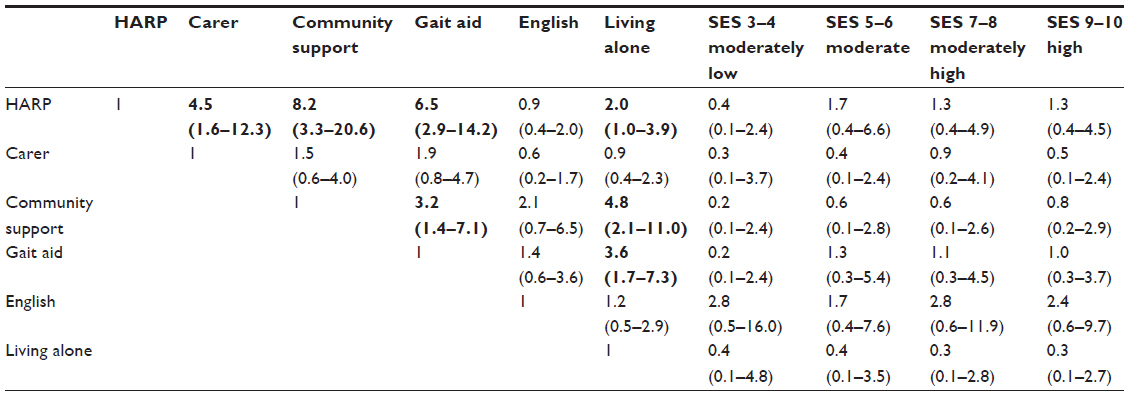 | Table 4 Univariate associations between FD predictor variables |
Multivariate models
Based on the findings of univariate analyses reported in Tables 2–4, the only models to which additional predictor variables could be added to potentially improve the diagnostic predictive capability of HARP were for outcomes of MCS at 3 months, and low or deteriorating MCS scores between 1 and 3 months. Speaking a primary language other than English was the only predictor variable that was significantly associated with MCS, but not significantly associated with HARP. Given the non-significant association between HARP and MCS at any time point, it was unlikely that addition of this predictor variable would significantly improve the diagnostic capacity of HARP for MCS. This was indeed the case, as the addition of this predictor variable to the models of MCS at 3 months and HARP and low or deteriorating MCS over 2 months and HARP, showed no significant effect. Neither of the ORs changed significantly (both approximating 1.2 [CI 0.6–2.2]), nor did the AUCs (approximating 0.52 [CI 0.43–0.61]).
Discussion
This is the first study to our knowledge that assessed HARP predictive validity with downstream quality of life. By measuring quality of life at 1 and 3 months after consecutively sampled older subjects recruited from the ED (when HARP scores were calculated), we report new knowledge regarding the usefulness of the HARP in predicting the trajectory of FD in terms of the physical component of quality of life (Figure 3). Inverting the ORs presented in Table 2, moderate or high risk HARP scores are significant negative predictors of downstream high PCS at 1 or 3 months, as well as consistently high or improving PCS quality of life over 3 months after HARP assessment (Figure 3). Moderate or high risk HARP scores were also strongly associated with other physical attributes of FD, namely the need for a carer, use of community services and a gait aid, and living alone. HARP was not a good predictor of downstream MCS quality of life.
 | Figure 3 Three month trajectory of the likelihood of high PCS (from SF12 quality of life measure; ORs, 95% CIs), after being assessed with a moderate or high HARP score at baseline. |
HARP risk scores of FD are determined by summing scores attributed to increasing age, low cognition, and low physical functioning.26 It is therefore logical that HARP is a good predictor of decreasing physical attributes of quality of life, as well as a measure of decreasing physical capacity (eg, use of walking aid, requiring care, and so on). We found similar predictive validity scores (AUCs) for HARP with downstream low PCS quality of life, compared to published data on downstream low capacity in basic activities of daily living (AUC of approximately 0.6).26,29,30 Thus HARP could be applied in a hospital ward or ED with moderate assurance that it detects between 60 and 66 people in every 100 older people who may decline in physical functioning or physical attributes of quality of life over the next 3 months.
We were similarly not surprised by the lack of association between HARP and downstream mental component quality of life scores. However, given the strong association we reported between decreasing mental and physical quality of life scores over time, it is feasible that decreasing mental quality of life may impact on downstream physical characteristics of FD. For instance, we propose that for an older person living independently and safely in the community, attending the ED with a minor medical issue may be a sufficient flag to make some of them subsequently doubt their capacity to remain living alone. This may be reflected by decreasing MCS quality of life over time, perhaps even irrespective of physical functioning.
Consequently, we interrogated our dataset post hoc to identify personal journeys over time which could shed some light on these findings. We considered PCS at 1 and 3 months in those 74 participants with low MCS at 1 month after HARP assessment. Nine patients (12.2%) deteriorated in physical quality of life over time (high PCS at 1 month, low PCS at 3 months), another nine (12.2%) improved over time (low PCS at 1 month, high PCS at 3 months), and 31 (41.9%) had low PCS at both time points. The remainder had high PCS at both time points.
We then followed up the associations reported in Table 3, between downstream low MCS at 1 month – use of gait aids and primary language not English – for the nine participants whose PCS deteriorated over time, and the nine participants whose PCS improved over time. In addition, we examined falls and hospitalizations; the findings are reported in Table 5. The groups were similar with respect to English not the primary language, and fallers (number of falls) over time. There were also similar numbers of hospitalized participants over time, although the group with deteriorating PCS had a slightly higher number of hospitalizations than the improved group at 3 months (14 versus 9). However, considering the total number of hospitalizations (baseline to 3 months), the numbers were similar between groups (17 and 16). The use of community services differed, with two of the three people in the deteriorating PCS group who received community services at baseline having ceased using them at the 1 month follow-up, while all participants who were receiving community services at baseline in the improved group continued to receive them at the 1- and 3-month follow-ups.
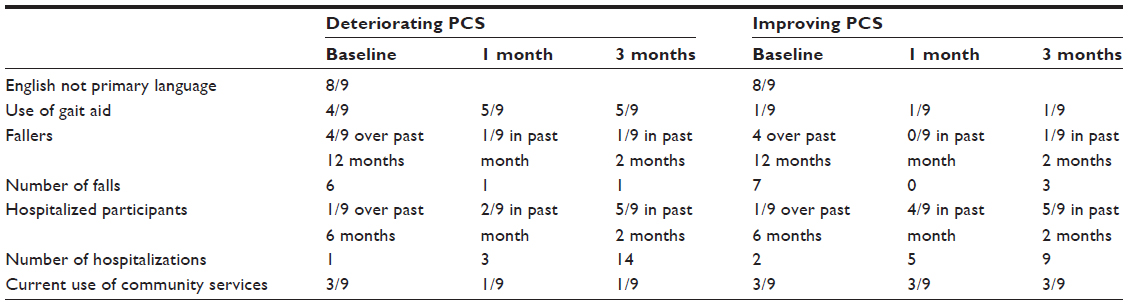 | Table 5 Exploring differences in individuals with low MCS at 1 month who deteriorated or improved in PCS over 2 months (between 1 month and 3 months after HARP assessment) |
The use of a gait aid however, was notably different. In the group whose PCS deteriorated over time, 4 of 9 participants reported using a gait aid when they were recruited (44.4%), and one further participant was using a gait aid by the first month follow-up (and continued this at the 3-month follow-up). Conversely only 1 of 9 (11.1%) in the group whose PCS improved over time reported using a gait aid at baseline, and none had commenced using one at subsequent follow-ups. Thus, despite the number of falls and fallers being similar in both groups, confidence in independent ambulation may be critical to maintaining high downstream physical quality of life.
Further analysis is required to understand the relationships between MCS and PCS over time, by examining other factors in depth, such as the reason for presenting to the ED, severity and type of falls, reasons for hospitalization, type, frequency and appropriateness of community supports (if used), and the home environment and family support.
Limitations
This study was limited in a number of ways. The sample which provided over time data was small (148). This limited our capacity to explore subsets in any detail. Moreover, we did not capture quality of life at recruitment, which was a significant flaw in our design. Our rationale for not doing so was that consenting participants were unwell and/or distressed in the ED (at time of recruitment). Asking the battery of SF12 questions that reflected on the previous month may be burdensome, and may produce potentially inaccurate information. We believed that the other measures of FD recorded at baseline were less likely to incur inaccuracies because of shorter timeframes (IADLs recalled over the past 1–2 days) or memorable events recalled over longer time periods (falls or hospitalizations in the last 12 months). Baseline information on quality of life however, would have provided us with a better understanding of participants’ downstream changes. We also did not collect detailed information on predictors of FD at baseline or downstream that may have explained our findings better (for instance the type of gait aid used, nature and severity of falls, reasons for subsequent hospitalizations, or types of community supports). Thus, this dataset has identified many unanswered or new questions for future research.
Conclusion
If screening for FD in hospital settings focused on downstream physical capacity and physical quality of life, the HARP is an appropriate, moderately valid instrument. Decisions regarding the likelihood within the next 3 months of an older person requiring care and/or community support and using a gait aid could be reliably predicted from a HARP assessment undertaken in the ED. However FD is a complex measure and to focus only on physical aspects would seem to be inadequate for understanding older people’s needs.6 This study showed that there were a significant number of people who had low mental component quality of life scores 1 month post recruitment from the ED, and a further significant number who declined between 1 and 3 months. While HARP might be appropriate for assisting in identifying those who may decline physically, it is not appropriate to identify those who may decline mentally. Given the association between physical and mental quality of life, and the potential role of gait aids, there is a clear opportunity to consider screening for mental and physical quality of life at the time of hospital assessment, and following older people over time after an ED presentation, to see whether they may have suffered mental decline (and why) and thus put themselves on the trajectory of physical decline.
Acknowledgments
We acknowledge the contribution of members of the ARC Linkage team (Dr Saravana Kumar, Associate Professor Susan Hillier, John Forward, John Moss and Louise Gordge), and the CNAHS Partner contribution to the grant.
Disclosure
The authors report no conflicts of interest in this work.
References
Mehta KM, Yaffe K, Covinsky KE. Cognitive impairment, depressive symptoms, and functional decline in older people. J Am Geriatr Soc. 2002;50(6):1045–1050. | |
World Health organization. International Classification of Impairments, Disabilities and Handicaps: a Manual of Classification Relating to the Consequences of Disease. Geneva: World Health Organization; 1980. | |
Covinsky KE, Justice AC, Rosenthal GE, Palmer RM, Landefeld CS. Measuring prognosis and case mix in hospitalized elders. The importance of functional status. J Gen Intern Med. 1997;12(4):203–208. | |
Fortinsky RH, Covinsky KE, Palmer RM, Landefeld CS. Effects of functional status changes before and during hospitalization on nursing home admission of older adults. J Gerontol A Biol Sci Med Sci. 1999;54(10):M521–M526. | |
Inouye SK, Wagner DR, Acampora D, et al. A predictive index for functional decline in hospitalized elderly medical patients. J Gen Intern Med. 1993;8(12):645–652. | |
Grimmer K, Beaton K, Hendry K. Identifying functional decline: a methodological challenge. Patient Relat Outcome Meas. 2013;4:37–48. | |
King BD. Functional decline in hospitalized elders. Medsurg Nurs. 2006;15(5):265–271; quiz 272. | |
Moss JE, Flower CL, Houghton LM, Moss DL, Nielsen DA, Taylor DM. A multidisciplinary Care Coordination Team improves emergency department discharge planning practice. Med J Aust. 2002;177(8):435–439. | |
Naylor MD, Brooten D, Campbell R, et al. Comprehensive discharge planning and home follow-up of hospitalized elders: a randomized clinical trial. JAMA. 1999;281(7):613–620. | |
Miller DK, Lewis LM, Nork MJ, Morley JE. Controlled trial of a geriatric case-finding and liaison service in an emergency department. J Am Geriatr Soc. 1996;44(5):513–520. | |
Weir R, Browne G, Byrne C, et al. The efficacy and efficiency of the quick response program: a randomised controlled trial. Can J Aging. 1998;17(3):272–295. | |
McCusker J, Verdon J, Tousignant P, de Courval LP, Dendukuri N, Belzile E. Rapid emergency department intervention for older people reduces risk of functional decline: results of a multicenter randomized trial. J Am Geriatr Soc. 2001;49(10):1272–1281. | |
Scott IA. Care of older people in acute care hospitals: do we know how? Med J Aust. 1999;171(9):485–488. | |
Runciman P, Currie CT, Nicol M, Green L, McKay V. Discharge of elderly people from an accident and emergency department: evaluation of health visitor follow-up. J Adv Nurs. 1996;24(4):711–718. | |
Hoogerduijn JG, Schuurmans MJ, Duijnstee MS, de Rooij SE, Grypdonck MF. A systematic review of predictors and screening instruments to identify older hospitalized patients at risk for functional decline. J Clin Nurs. 2007;16(1):46–57. | |
Baztán JJ, Suárez-García FM, López-Arrieta J, Rodríguez-Mañas L, Rodríguez-Artalejo F. Effectiveness of acute geriatric units on functional decline, living at home, and case fatality among older patients admitted to hospital for acute medical disorders: meta-analysis. BMJ. 2009;338:b50. | |
Caplan GA, Williams AJ, Daly B, Abraham K. A randomized, controlled trial of comprehensive geriatric assessment and multidisciplinary intervention after discharge of elderly from the emergency department – the DEED II study. J Am Geriatr Soc. 2004;52(9):1417–1423. | |
AHMAC Care of Older Australian Working Group. A Guide for Assessing Older People in Hospitals. Victoria: Department of Health; 2004. Available from: http://docs.health.vic.gov.au/docs/doc/611584DDA451964DCA25785200107D95/$FILE/assessing-older-people.pdf. Accessed November 27, 2013. | |
Sutton M, Grimmer-Somers K, Jeffries L. Screening tools to identify hospitalised elderly patients at risk of functional decline: a systematic review. Int J Clin Pract. 2008;62(12):1900–1909. | |
Beaton K, Grimmer K. Tools that assess functional decline: systematic literature review update. Clin Interv Aging. 2013;8:485–494. | |
Callen BL, Mahoney JE, Grieves CB, Wells TJ, Enloe M. Frequency of hallway ambulation by hospitalized older adults on medical units of an academic hospital. Geriatr Nurs. 2004;25(4):212–217. | |
Bortz WM. A conceptual framework of frailty: a review. J Gerontol A Biol Sci Med Sci. 2002;57(5):M283–M288. | |
Hoogerduijn JG, Buurman BM, Korevaar JC, Grobbee DE, de Rooij SE, Schuurmans MJ. The prediction of functional decline in older hospitalised patients. Age Ageing. 2012;41(3):381–387. | |
Barber JH, Wallis JB, McKeating E. A postal screening questionnaire in preventive geriatric care. J R Coll Gen Pract. 1980;30(210):49–51. | |
Hébert R, Bravo G, Korner-Bitensky N, Voyer L. Predictive validity of a postal questionnaire for screening community-dwelling elderly individuals at risk of functional decline. Age Ageing. 1996;25(2):159–167. | |
Sager MA, Rudberg MA, Jalaluddin M, et al. Hospital admission risk profile (HARP): identifying older patients at risk for functional decline following acute medical illness and hospitalization. J Am Geriatr Soc. 1996;44(3):251–257. | |
Folstein MF, Folstein SE, McHugh PR. “Mini-mental state”. A practical method for grading the cognitive state of patients for the clinician. J Psychiatr Res. 1975;12(3):189–198. | |
Lawton MP, Brody EM. Assessment of older people: self-maintaining and instrumental activities of daily living. Gerontologist. 1969;9(3):179–186. | |
de Saint-Hubert M, Jamart J, Boland B, Swine C, Cornette P. Comparison of three tools predicting functional decline after hospitalization of older patients. J Am Geriatr Soc. 2010;58(5):1003–1005. | |
Hoogerduijn JG, Schuurmans MJ, Korevaar JC, Buurman BM, de Rooij SE. Identification of older hospitalised patients at risk for functional decline, a study to compare the predictive values of three screening instruments. J Clin Nurs. 2010;19(9–10):1219–1225. | |
Katz S, Ford AB, Moskowitz RW, Jackson BA, Jaffe MW. Studies of illness in the aged. The index of ADL: a standardized measure of biological and psychosocial function. JAMA. 1963;185:914–919. | |
Grimmer K, Beaton K, Kumar S, et al. Estimating the risk of functional decline in the elderly after discharge from an Australian public tertiary hospital emergency department. Aust Health Rev. 2013;37(3):341–347. | |
Australian Bureau of Statistics [webpage on the Internet]. Census of Population and Housing: Socio-Economic Indexes for Areas (SEIFA). Australian Bureau of Statistics; 2011. Available from: http://www.abs.gov.au/ausstats/[email protected]/mf/2033.0.55.001/. Accessed November 20, 2013. | |
Russell MA, Hill KD, Day LM, Blackberry I, Gurrin LC, Dharmage SC. Development of the Falls Risk for Older People in the Community (FROP-Com) screening tool. Age Ageing. 2009;38(1):40–46. | |
Ware JE, Sherbourne CD. The MOS 36-item short-form health survey (SF-36). I. Conceptual framework and item selection. Med Care. 1992;30(6):473–483. | |
Gandek B, Ware JE, Aaronson NK, et al. Cross-validation of item selection and scoring for the SF-12 Health Survey in nine countries: results from the IQOLA Project. International Quality of Life Assessment. J Clin Epidemiol. 1998;51(11):1171–1178. | |
Avery J, Dal Grande E, Taylor A. Quality of Life in South Australia as Measured by the SF-12 Health Status Questionnaire: Population Norms for 2003: Trends From 1997–2003. South Australia: Population Research and Outcome Studies Unit, Department of Human Services; 2004. Available from: http://health.adelaide.edu.au/pros/docs/reports/general/qol_quality_of_life_sf_12.pdf. Accessed November 27, 2013. | |
Hosmer DW, Lemeshow S. A goodness-of-fit test for the multiple logistic regression model. Comm Statist Theory Meth. 1980;A10:1043–1069. |
 © 2014 The Author(s). This work is published and licensed by Dove Medical Press Limited. The
full terms of this license are available at https://www.dovepress.com/terms
and incorporate the Creative Commons Attribution
- Non Commercial (unported, 3.0) License.
By accessing the work you hereby accept the Terms. Non-commercial uses of the work are permitted
without any further permission from Dove Medical Press Limited, provided the work is properly
attributed. For permission for commercial use of this work, please see paragraphs 4.2 and 5 of our Terms.
© 2014 The Author(s). This work is published and licensed by Dove Medical Press Limited. The
full terms of this license are available at https://www.dovepress.com/terms
and incorporate the Creative Commons Attribution
- Non Commercial (unported, 3.0) License.
By accessing the work you hereby accept the Terms. Non-commercial uses of the work are permitted
without any further permission from Dove Medical Press Limited, provided the work is properly
attributed. For permission for commercial use of this work, please see paragraphs 4.2 and 5 of our Terms.