Back to Journals » Vascular Health and Risk Management » Volume 10
Adding multiple risk factors improves Framingham coronary heart disease risk scores
Authors Hu G, Root M, Duncan A
Received 19 June 2014
Accepted for publication 29 July 2014
Published 5 September 2014 Volume 2014:10 Pages 557—562
DOI https://doi.org/10.2147/VHRM.S69672
Checked for plagiarism Yes
Review by Single anonymous peer review
Peer reviewer comments 4
Editor who approved publication: Dr Daniel Duprez
Guizhou Hu,1 Martin Root,2 Ashlee W Duncan1
1BioSignia, Inc., Durham, NC, USA; 2Department of Nutrition and Health Care Management, Appalachian State University, Boone, NC, USA
Purpose: Since the introduction of the Framingham Risk Score (FRS), numerous versions of coronary heart disease (CHD) prediction models have claimed improvement over the FRS. Tzoulaki et al challenged the validity of these claims by illustrating methodology deficiencies among the studies. However, the question remains: Is it possible to create a new CHD model that is better than FRS while overcoming the noted deficiencies? To address this, a new CHD prediction model was developed by integrating additional risk factors, using a novel modeling process.
Methods: Using the National Health Nutritional Examination Survey III data set with CHD-specific mortality outcomes and the Atherosclerosis Risk in Communities data set with CHD incidence outcomes, two FRSs (FRSv1 from 1998 and FRSv2 from National Cholesterol Education Program Adult Treatment Panel III), along with an additional risk score in which the high density lipoprotein (HDL) component of FRSv1 was ignored (FRSHDL), were compared with a new CHD model (NEW-CHD). This new model contains seven elements: the original Framingham equation, FRSv1, and six additional risk factors. Discrimination, calibration, and reclassification improvements all were assessed among models.
Results: Discrimination was improved for NEW-CHD in both cohorts when compared with FRSv1 and FRSv2 (P<0.05) and was similar in magnitude to the improvement of FRSv1 over FRSHDL. NEW-CHD had a similar calibration to FRSv2 and was improved over FRSv1. Net reclassification for NEW-CHD was substantially improved over both FRSv1 and FRSv2, for both cohorts, and was similar in magnitude to the improvement of FRSv1 over FRSHDL.
Conclusion: While overcoming several methodology deficiencies reported by earlier authors, the NEW-CHD model improved CHD risk assessment when compared with the FRSs, comparable to the improvement of adding HDL to the FRS.
Keywords: risk assessment, atherosclerotic risk in communities, NHANES, epidemiology
Introduction
Widely regarded as the gold standard in coronary heart disease (CHD) risk assessment tools, the Framingham Risk Score (FRS) was developed from the Framingham Heart Study1 and has been validated in multiple populations.2–4 However, several widely accepted risk factors for heart disease risk were not included in the original model. These shortcomings contribute to the much-debated topic of whether additional risk factors could materially improve the FRS in assessing CHD risk.
Tzoulaki et al recently compiled a systematic review of studies claiming improvement over the FRS.5,6 The review concluded that most claims were questionable because of various deficiencies in the validation study designs, including improper data use (eg, using the same data to develop and validate the model); incorrect use of FRS by including individuals with previous CHD diagnoses; incomplete use of tests for discrimination, calibration, and reclassification; and publication bias.
The objective of the present study was to demonstrate that FRS can indeed be improved by developing a new CHD model that combines the original Framingham equation with six additional literature-derived risk factors, using a novel modeling process.7 The accuracy of this NEW-CHD model was then compared with the FRS while striving to avoid the methodology deficiencies outlined by Tzoulaki et al.5
Material and methods
Models and data sets
FRS
Two versions of the FRS are currently in use. The first version (FRSv1), published in 1998, includes diabetes diagnosis status and evaluates CHD risk among individuals who are free of CHD at presentation.1,8 The second version (FRSv2) was published within the National Cholesterol Education Program Adult Treatment Panel III guideline and includes hypertension medication status among its inputs but excludes the diabetes diagnosis, thereby making FRSv2 applicable only to individuals without diabetes or CHD.9
For the current research, a modified version of FRSv1 was also developed by excluding high density lipoprotein (HDL) (FRSHDL). This abbreviated model was used to compare the incremental accuracy gain of the NEW-CHD model to any difference observed between FRS and FRSHDL.
NEW-CHD model
The NEW-CHD model was developed using an alternative model-building method called synthesis analysis. Synthesis analysis is used to develop comprehensive risk-assessment models by combining literature-derived risk factors with partially adjusted relative risks.10,11 Details of synthesis analysis and its statistical validation have been reported elsewhere.7,10,11
The NEW-CHD model was created by combining the original Framingham risk equation (FRE),12 which also was the basis for FRSv1, with additional literature-derived risk factors, including family history of CHD (father/brother with CHD before age 60 years or mother/sister before age 65 years), physical exercise level (lower, equal, or higher when compared with peers), body mass index (kg/m2), serum albumin, apolipoprotein A, and plasma fibrinogen. The selection of these variables was based on their availability in both validation data sets.
Population data
Two longitudinal data sets were used in the present study: the Atherosclerosis Risk in Communities (ARIC) study and the Third National Health Nutritional Examination Survey (NHANES III). ARIC is a prospective epidemiologic study conducted in four US communities, and CHD incidence was recorded during the follow-up interval. Details of the ARIC and NHANES study designs have been previously described.13,14 The NHANES III data were supplemented with CHD-specific mortality data at follow-up.
To allow for appropriate comparisons among the three models (FRSv1, FRSv2, and NEW-CHD), all individuals with CHD or diabetes at baseline were excluded from analysis. Use of hypertension medication, a FRSv2 input, was the only variable not included in both data sets.
The ARIC study data set contained 13,657 individuals, aged 45 to 64 years at baseline. In the 10 years after baseline evaluation, 759 CHD cases, defined as clinically diagnosed myocardial infarction, electrocardiogram diagnosis of myocardial infarction, fatal CHD event, or receipt of CHD-related clinical procedures, were reported.
NHANES III subjects were limited to those aged 40 to 70 years (n=5,706), the appropriate ages for both NEW-CHD and FRS applications. Over an average follow-up interval of 14 years, 88 CHD-associated deaths were recorded, as documented by an International Statistical Classification of Diseases and Related Health Problems, Tenth Revision, cause of death code of 059-061.
Statistical analysis
The performance features of the risk assessment models were evaluated using discrimination, calibration, and reclassification indices. Discrimination was evaluated by the c-statistic or area under the receiver operating characteristic curve. With several methods being appropriate for calculating the c-statistic,15,16 the current study used the method described by D’Agostino et al17 and DeLong et al.18 Among selected models, c-statistic comparisons were made by evaluating the pairwise c-statistic difference. The 95% confidence interval of the difference was derived from bootstrapping 100 data sets that were randomly selected from the study data.
Calibration is defined as the closeness between observed incidence and predicted probability. To evaluate a model’s calibration, data are typically divided into deciles according to predicted risk; subsequently, the closeness between Kaplan–Meier-derived incidence and average predicted probabilities from a given model are tested by Hosmer–Lemeshow chi-square statistics. In general, a chi-square greater than 20 is evidence of lack of fit.17 When a model is evaluated in a data set other than the data set from which it was developed, lack of fit may be a result of differences in outcome definition. To address this problem, the model can be recalibrated, which forces the overall predicted probability equal to the overall incidence. Only ARIC contained a CHD-incidence outcome; therefore, calibration assessments were performed in this data set only.
Reclassification measures the change in classification between a “new” model and an “old” model.19–21 In clinical practice, this change is very important, as different risk classifications could prompt different treatments. If the new model improves classification over the old model, one would expect the new model to yield more “correct” reclassifications than “incorrect” reclassifications. This evaluation is known as net reclassification index (NRI). It is well known that NRI is dependent on the definition of classification thresholds. To overcome this issue, Pencina et al introduced a new parameter, classless NRI, which is no longer dependent on any arbitrarily defined risk classes.19 In the present study, both class NRI and classless NRI were used. When class NRI was calculated, the ATP III guideline-defined 10-year CHD risk thresholds of lower than 10%, 10%–20%, and higher than 20% were used.
In addition, comparisons between the NEW-CHD and FRSv1 were made in the ARIC data, using a Cox proportional hazards model. This comparison was chosen because FRSv1 was directly derived from the original FRE, and FRE is the foundation for the NEW-CHD model. The Cox model included eight independent variables: FRSv1 and seven NEW-CHD elements (the FRE and six additional risk factors). This model is designed to evaluate which elements of the NEW-CHD model contribute most to the incremental accuracy of NEW-CHD over FRSv1.
All analyses were performed using SAS 9.3 (SAS Institute Inc., Cary, NC, USA).
Results
As shown in Table 1, the NEW-CHD model yielded higher c-statistics than FRSv1 and FRSv2 in both data sets and for both genders. On evaluating the differences among pairwise c-statistics, the discrimination gains with NEW-CHD were higher than those observed between FRSv1 and FRSHDL, and the results were consistent between the two data sets and between genders (Table 2).
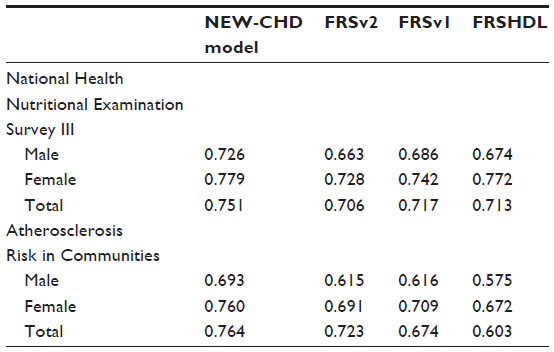 | Table 1 C-statistics of the four selected models assessed by gender in the National Health Nutritional Examination Survey III and Atherosclerosis Risk in Communities |
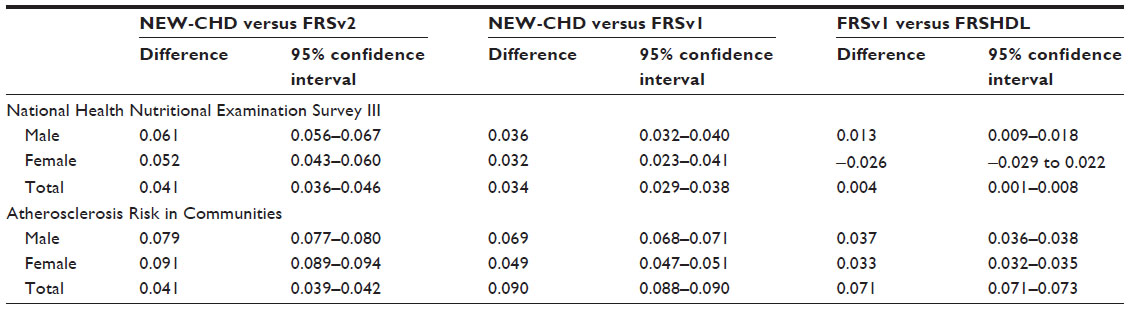 | Table 2 Differences among pairwise c-statistics and corresponding 95% confidence intervals between selected model pairs by gender in National Health Nutritional Examination Survey III and Atherosclerosis Risk in Communities |
As shown in Table 3, the recalibration effect appears to be very dramatic for FRSv1 and FRSHDL; in contrast, recalibration brought both the NEW-CHD and FRSv2 models near the Hosmer–Lemeshow chi-square accepted threshold of 20, which is indicative of no lack of fit.
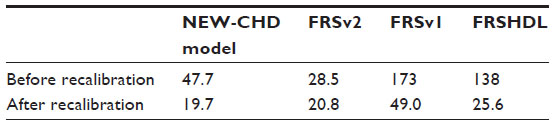 | Table 3 Hosmer–Lemeshow chi-square values of the lack of fit test between predicted and observed coronary heart disease risk for selected models in Atherosclerosis Risk in Communities |
NRI values between selected model pairs appear to be very similar to the pairwise c-statistics difference (Table 4). Results demonstrate that the NRI values of NEW-CHD over FRSv1 and FRSv2 are all statistically significant.
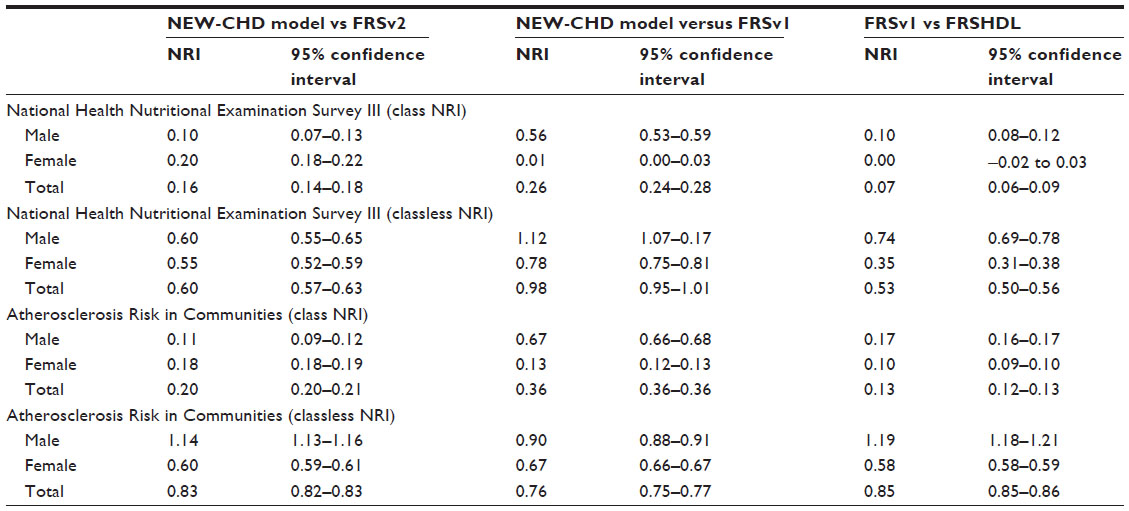 | Table 4 Class and classless net reclassification improvement and corresponding 95% confidence intervals between selected models by gender in National Health Nutritional Examination Survey III and Atherosclerosis Risk in Communities |
In a Cox model in which FRSv1 and seven NEW-CHD model elements were treated as covariates, FRE and three of the six additional risk factors significantly contributed to the CHD risk prediction, even while adjusting for FRSv1 (Table 5), indicating that the FRE still contains additional predictive power beyond that captured in FRSv1. These findings illustrate that the NEW-CHD model outperforms FRSv1.
 | Table 5 Hazard ratios and corresponding 95% confidence intervals resulting from a Cox model of coronary heart disease incidence in the Atherosclerosis Risk in Communities cohort with the FRSv1, Framingham equation, and six additional risk factors as covariates |
Discussion
In the present study, a new CHD risk assessment model (NEW-CHD), developed by integrating six additional literature-derived variables into the original FRE, was demonstrated to outperform the FRSv1 and FRSv2 in discrimination and reclassification. After recalibration, the NEW-CHD model outperformed FRSv1 and was similar to FRSv2 in calibration. Notably, the improvement of the NEW-CHD model over the FRS was achieved despite three of the six additional variables in the NEW-CHD model making no significant contribution to the overall risk assessment power.
Although emerging risk factors are known to contribute to CHD prediction,22–24 it remains uncertain whether any CHD model, with additional risk factors incorporated, could significantly outperform FRS. In his research, Tzoulaki et al cited three deficiencies among studies reporting claimed benefit over FRS: the population or the CHD outcome was not properly selected; prediction accuracy properties, including discrimination, calibration, and classification, were not comprehensively tested; and researchers who validated the models were typically the same authors who developed the models.5,6
In the present study, special consideration was given to address each of Tzoulaki’s critiques. First, the NEW-CHD model was not empirically derived from either ARIC or NHANES III data but, rather, was constructed using literature-derived information. The finding that three risk factors integrated into the NEW-CHD model did not significantly contribute to the prediction in the ARIC data is indicative of external validation; furthermore, consistent observations in different data sources add to the external validation strength of NEW-CHD.
Although NEW-CHD does not have restrictions on the eligible population, to make data sets applicable with FRSv1 and FRSv2, validation was performed among individuals free of CHD and diabetes at baseline. It is important to note that including these individuals would increase various accuracy indices (particularly discrimination) of the NEW-CHD model; however, NEW-CHD would then be incomparable with FRS.
Second, the present study assessed various model accuracy indices including discrimination, calibration, and reclassification. Although not all statistical indices were included in the present study, those statistical terms, widely recognized as important in model accuracy assessment, were evaluated to address Tzoulaki’s predictive accuracy critique.
For Tzoulaki’s third issue, although it can be reasonably argued that conflicting interests and potential publication bias do play a role in validation studies, it should not be assumed that every researcher who develops a model will always bias its validation. The sole purpose of developing the NEW-CHD model was to demonstrate that FRS can indeed be improved. The risk factors added to the NEW-CHD model were only limited by their availability in the data sets.
Results from the current study illustrate that recalibration was necessary before a true comparison of model calibration could be made. Although none of the models scored extremely well, NEW-CHD was the only model with a chi-square of less than 20, indicative of adequate model fit.
A higher positive NRI indicates that the NEW-CHD model correctly identified patients who were truly at higher and lower risk compared with the FRS models. Not only did the present study demonstrate that FRS can indeed be improved, it also showed that the magnitude of the accuracy gain can be substantial. When evaluating discrimination and reclassification, the NEW-CHD improvements over FRSv1 and FRSv2 were similar to or greater than the accuracy gain of FRSv1 over FRSHDL. Thus, these findings yield a simplified interpretation that NEW-CHD added to the discrimination of FRS equally or more than what HDL added to FRSHDL.
Although successfully validating a NEW-CHD model shown to outperform standard FRS, one limitation of the present study is that it only allows for validation of models containing risk factors that were available in both data sets. Unfortunately, one FRSv2 input, hypertension medication, was not used in FRSv1. Having this variable may have potentially increased the accuracy of FRSv2 beyond that shown in the present study; however, little evidence indicates that FRSv2 was significantly improved over FRSv1 (ie, FRSv1 and FRSv2 are almost equally adopted in clinical practice). Given this information, it is very unlikely that having the hypertension medication variable in the data would yield a significant change in the study results.
Another weakness of the present study is the small outcome sample size of the NHANES III data, with only 88 CHD deaths. Although this finding did not appear to affect statistical significance test results, a larger sample size could add credibility to the results.
A final shortcoming of the present study is that since the preparation of this analysis, new lipid guidelines have been put forth by the American College of Cardiology/American Heart Association Task Force on Practice Guidelines.25 These new guidelines make use of a new risk model, the Pooled Cohort Equations.26 This limits the practical application of this present analysis clinically, particularly the NRI. However, the original intent, to test the extendibility of the FRS, has been met.
Conclusion
In summary, various statistical model accuracy indices have been used to demonstrate the validity of a new CHD assessment tool that combines six well-known risk factors with the FRE. With a combination of discrimination, calibration, and reclassification, this new model has been shown to perform better than both Framingham score models, and this improvement is similar in magnitude to incorporating HDL into the FRSv1. This exercise should lend confidence to those researchers who would heed the challenge of developing new and improved disease prediction models.
Acknowledgment
This manuscript was prepared using ARIC Research Materials obtained from the NHLBI Biologic Specimen and Data Repository Information Coordinating Center and does not necessarily reflect the opinions or views of the ARIC or the NHLBI.
Disclosure
The two BioSignia authors (GH and AWD) declare an explicit conflict of interest related to their employment. The Appalachian State University author (MMR) is a former BioSignia employee and current owner of company stock, with an explicit conflict of interest.
References
Wilson PW, D’Agostino RB, Levy D, Belanger AM, Silbershatz H, Kannel WB. Prediction of coronary heart disease using risk factor categories. Circulation. 1998;97(18):1837–1847. | |
D’Agostino RB Sr, Grundy S, Sullivan LM, Wilson P; CHD Risk Prediction Group. Validation of the Framingham coronary heart disease prediction scores: results of a multiple ethnic groups investigation. JAMA. 2001;286(2):180–187. | |
Liu J, Hong Y, D’Agostino RB Sr, et al. Predictive value for the Chinese population of the Framingham CHD risk assessment tool compared with the Chinese Multi-Provincial Cohort Study. JAMA. 2004;291(21):2591–2599. | |
Marrugat J, D’Agostino R, Sullivan L, et al. An adaptation of the Framingham coronary heart disease risk function to European Mediterranean areas. J Epidemiol Community Health. 2003;57(8):634–638. | |
Tzoulaki I, Liberopoulos G, Ioannidis JP. Assessment of claims of improved prediction beyond the Framingham risk score. JAMA. 2009;302(21):2345–2352. | |
Siontis GC, Tzoulaki I, Siontis KC, Ioannidis JP. Comparisons of established risk prediction models for cardiovascular disease: systematic review. BMJ. 2012;344(May 24 1):e3318. | |
Hu G, Root MM. Building prediction models for coronary heart disease by synthesizing multiple longitudinal research findings. Eur J Cardiovasc Prev Rehabil. 2005;12(5):459–464. | |
Framingham Heart Study. Coronary Heart Disease (10-Year Risk). Available from: http://www.framinghamheartstudy.org/risk-functions/coronary-heart-disease/10-year-risk.php. Accessed July 25, 2014. | |
National Cholesterol Education Program (NCEP) Expert Panel on Detection, Evaluation, and Treatment of High Blood Cholesterol in Adults (Adult Treatment Panel III). Third Report of the National Cholesterol Education Program (NCEP) Expert Panel on Detection, Evaluation, and Treatment of High Blood Cholesterol in Adults (Adult Treatment Panel III) final report. Circulation. 2002;106(25):3143–3421. | |
Zhou XH, Hu N, Hu G, Root M. Synthesis analysis of regression models with a continuous outcome. Stat Med. 2009;28(11):1620–1635. | |
Samsa G, Hu G, Root M. Combining information from multiple data sources to create multivariable risk models: illustration and preliminary assessment of a new method. J Biomed Biotechnol. 2005;2005(2):113–123. | |
Anderson KM, Odell PM, Wilson PW, Kannel WB. Cardiovascular disease risk profiles. Am Heart J. 1991;121(1 Pt 2):293–298. | |
The ARIC Investigators. The Atherosclerosis Risk in Communities (ARIC) Study: design and objectives. The ARIC investigators. Am J Epidemiol. 1989;129(4):687–702. | |
National Center for Health Statistics. The Third National Health and Nutrition Examination survey (NHANES III) Linked Mortality File, Mortality follow-up through 2006: Matching Methodology; 2009. Available from: http://www.cdc.gov/nchs/data/datalinkage/matching_methodology_nhanes3_final.pdf. Accessed August 30, 2012. | |
Chambless LE, Cummiskey CP, Cui G. Several methods to assess improvement in risk prediction models: extension to survival analysis. Stat Med. 2011;30(1):22–38. | |
Pearson TA, Mensah GA, Alexander RW, et al; American Heart Association. Markers of inflammation and cardiovascular disease: application to clinical and public health practice: A statement for healthcare professionals from the Centers for Disease Control and Prevention and the American Heart Association. Circulation. 2003;107(3):499–511. | |
D’Agostino RB, Nam B-H. Evaluation of the performance of survival analysis models: discrimination and calibration measures. In: Balakrishnan N, Rao CR, editors. Handbook of Statistics: Advances in Survival Analysis. San Diego, CA: Elsevier, Inc.; 2004. | |
DeLong ER, DeLong DM, Clarke-Pearson DL. Comparing the areas under two or more correlated receiver operating characteristic curves: a nonparametric approach. Biometrics. 1988;44(3):837–845. | |
Pencina MJ, D’Agostino RB Sr, Steyerberg EW. Extensions of net reclassification improvement calculations to measure usefulness of new biomarkers. Stat Med. 2011;30(1):11–21. | |
Pencina MJ, D’Agostino RB Sr, D’Agostino RB Jr, Vasan RS. Evaluating the added predictive ability of a new marker: from area under the ROC curve to reclassification and beyond. Stat Med. 2008;27(2):157–172, discussion 207–212. | |
Cook NR. Use and misuse of the receiver operating characteristic curve in risk prediction. Circulation. 2007;115(7):928–935. | |
Berger JS, Jordan CO, Lloyd-Jones D, Blumenthal RS. Screening for cardiovascular risk in asymptomatic patients. J Am Coll Cardiol. 2010;55(12):1169–1177. | |
de Ruijter W, Westendorp RG, Assendelft WJ, et al. Use of Framingham risk score and new biomarkers to predict cardiovascular mortality in older people: population based observational cohort study. BMJ. 2009;338:1–8. | |
Marsh RW. Predicting cardiovascular events using three stage Discriminant Function is much more accurate than Framingham or QRISK. Eur J Epidemiol. 2011;26(12):915–918. | |
Stone NJ, Robinson JG, Lichtenstein AH, et al. 2013 ACC/AHA Guideline on the Treatment of Blood Cholesterol to Reduce Atherosclerotic Cardiovascular Risk in Adults: A Report of the American College of Cardiology/American Heart Association Task Force on Practice Guidelines. Circulation. 2014;129(25)(Suppl 2):S1–S45. | |
Goff DC Jr, Lloyd-Jones DM, Bennett G, et al. 2013 ACC/AHA Guideline on the Assessment of Cardiovascular Risk: A Report of the American College of Cardiology/American Heart Association Task Force on Practice Guidelines. J Am Coll Cardiol. 2014;63(25 Pt B):2935–2959. |
 © 2014 The Author(s). This work is published and licensed by Dove Medical Press Limited. The
full terms of this license are available at https://www.dovepress.com/terms
and incorporate the Creative Commons Attribution
- Non Commercial (unported, 3.0) License.
By accessing the work you hereby accept the Terms. Non-commercial uses of the work are permitted
without any further permission from Dove Medical Press Limited, provided the work is properly
attributed. For permission for commercial use of this work, please see paragraphs 4.2 and 5 of our Terms.
© 2014 The Author(s). This work is published and licensed by Dove Medical Press Limited. The
full terms of this license are available at https://www.dovepress.com/terms
and incorporate the Creative Commons Attribution
- Non Commercial (unported, 3.0) License.
By accessing the work you hereby accept the Terms. Non-commercial uses of the work are permitted
without any further permission from Dove Medical Press Limited, provided the work is properly
attributed. For permission for commercial use of this work, please see paragraphs 4.2 and 5 of our Terms.