Back to Journals » Cancer Management and Research » Volume 11
Added value of histogram analysis of apparent diffusion coefficient maps for differentiating triple-negative breast cancer from other subtypes of breast cancer on standard MRI
Authors Liu HL, Zong M ![]() , Wei H, Wang C, Lou JJ, Wang SQ, Zou QG, Jiang YN
, Wei H, Wang C, Lou JJ, Wang SQ, Zou QG, Jiang YN
Received 30 March 2019
Accepted for publication 11 July 2019
Published 6 September 2019 Volume 2019:11 Pages 8239—8247
DOI https://doi.org/10.2147/CMAR.S210583
Checked for plagiarism Yes
Review by Single anonymous peer review
Peer reviewer comments 2
Editor who approved publication: Dr Sanjeev K. Srivastava
Hong-Li Liu,1,* Min Zong,1,* Han Wei,1 Cong Wang,2 Jian-Juan Lou,1 Si-Qi Wang,1 Qi-Gui Zou,1 Yan-Ni Jiang1
1Department of Radiology, The First Affiliated Hospital of Nanjing Medical University, Nanjing 210029, People’s Republic of China; 2Department of Pathology, The First Affiliated Hospital of Nanjing Medical University, Nanjing 210029, People’s Republic of China
*These authors contributed equally to this work
Correspondence: Yan-Ni Jiang
Department of Radiology, The First Affiliated Hospital of Nanjing Medical University, No. 300, Guangzhou Road, Nanjing 210029, People’s Republic of China
Tel +86 1 377 665 2465
Fax +86 258 372 4440
Email [email protected]
Background: Triple-negative breast cancers generally occur in young women with remarkable potential to be aggressive. It will be of great help to detect this subtype of tumor early. To retrospectively evaluate the performance of histogram analysis of apparent diffusion coefficient (ADC) maps in distinguishing triple-negative breast cancer (TNBC) from other subtypes of breast cancer (non-TNBC), when combined with magnetic resonance imaging (MRI) features.
Materials and methods: From February 2014 to December 2018, 192 patients were included in this study taking preoperative standard MRI (s-MRI) and DWI. Seventy-six of them were pathologically confirmed with TNBC and rest 116 with other subtypes. First, their clinical-pathological features and morphological characteristics on MRI were assessed, including tumor size, foci quantity, tumor shape, margin, internal enhancement, and time-signal intensity curve types, in addition to the signal intensity on T2-weighted images. Second, whole-lesion apparent diffusion coefficient (ADC) histogram analysis was executed. Finally, both univariate and multivariate regression analyses were applied to identify the most useful variables in separating TNBCs from non-TNBCs, and then their effects were evaluated following receiver operating characteristic curve analysis.
Result: Multivariate regression analysis indicated that circumscribed margin, rim enhancement, and ADC90 were important predictors for TNBC. Increased area under curve (AUC) and improved specificity can be obtained when combined s-MRI and DWI (circumscribed margin+rim enhancement+ADC90>1.47×10⁻³ mm2/s) is taken as the criterion, other than s-MRI (circumscribed margin+rim enhancement) alone (s-MRI+DWI vs s-MRI; AUC, 0.833 vs 0.797; specificity, 98.3% vs 89.7%; sensitivity, 68.4% vs 69.7%).
Conclusion: Circumscribed margin and rim enhancement on s-MRI and ADC90 are three important elements in detecting TNBC, while ADC histogram analysis can provide additional value in this detection.
Keywords: triple-negative breast cancer, magnetic resonance imaging, morphological features, diffusion-weighted imaging, histogram analysis
Introduction
Triple-negative breast cancer (TNBC) is characterized with lack of estrogen receptor (ER), progesterone receptor (PR), and human epidermal growth factor receptor 2 (HER2).1 It constitutes 12–17% breast cancer population and has been identified as an important subtype, due to its prevalence in young women and higher possibility of metastases.2,3 It is known that biopsy is adopted to find out the molecular subtype of breast cancer before treatment. However, imaging diagnosis is also recommended in following cases: 1) A biopsy is impossible; 2) Needle biopsy may miss tissue from breast cancer when the sample or cells are taken from wrong area; 3) Even if the sample is selected from correct area, the pathologist misinterprets the tissue or cell as benign, which actually indicates a cancer; and 4) Target biopsy is selected for multifocal lesions. Therefore, non-invasive prediction of TNBCs using magnetic resonance imaging (MRI) is favorable to select the therapies.
Diffusion-weighted imaging (DWI) indicates the main Brownian movement of protons in bulk water molecules.2,3 Apparent diffusion coefficient (ADC) values are measured from the mean diffusivity along three orthogonal directions, and this diffusivity is affected by tissue cellularity, fluid viscosity, blood flow, and membrane permeability. Microstructural characteristics were correlated with ADC value, such as water diffusion and blood circulations in capillary microstructure.4–6 Several studies indicated that the combination of DWI and dynamic MRI has the potential to improve their diagnostic performance.7–9 However, these studies only measured one or several slices of the lesion, which may provide deficient information concerning radiologic heterogeneity of the tumor and observer bias. Instead, in this study, a whole-lesion ADC histogram analysis was applied, which could better reflect the tissue heterogeneity, reduce interrater variability, and increase the diagnostic specificity.10–12 It has been proved in our previous study that ADC histogram analysis can add value to standard MRI in predicting breast malignancy.13 To our knowledge, there have been no reports addressing such value in increasing the diagnostic specificity of TNBC.
We performed this study to integrate ADC histogram analysis into the standard MRI findings for discriminating TNBC from other subtypes of breast cancer.
Materials and methods
Patients
The present investigation was approved by the ethics committee of the First Affiliated Hospital of Nanjing Medical University (Nanjing, China). Informed consent was not obtained since this was a retrospective study and the study protocol conformed to the ethical guidelines of the Declaration of Helsinki. From February 2014 to December 2018, 432 patients without any intervention before MRI were enrolled in the study. Among them, 240 were excluded at image analyses due to non-mass enhancement (n=98), small tumor size (<1 cm) (n=63), insufficient clinical-pathological information (n=19), poor image quality or image artifact (n=35), and post-processing failure (n=25). And the rest 192 patients composed of the population for analysis, including 76 TNBC and 116 non-TNBC.
MR image acquisition
MRI was obtained through a bilateral 8-channel phased-array breast coil with the patient in the prone position on the same 3.0 T MRI scanner (MAGNETOM Trio, Siemens, Germany). Standard MRI and DWI were acquired following such sequences: 1) a DWI sequence with b-values, 50 and 800 s/mm2; repetition time/echo time (TR/TE), 5400/86 ms; field-of-view (FOV), 360×180 mm; matrix size, 192×82; and slice thickness, 4 mm. Five readout segments were acquired for readout-segmented EPI (echo-planar imaging). ADC maps were drawn automatically from the DWI by MRI software; 2) the dynamic series, including a three-dimensional transverse fast low angle shot T1-weighted sequence with fat suppression; TR/TE, 4.23/1.57 ms; FOV, 340×340 mm; matrix size, 448×296; slice thickness, 0.9 mm. Gadopentetate dimeglumine (Magnevist; Bayer Healthcare, Berlin, Germany) was injected intravenously as a bolus (0.1 mmol/kg body weight) by a power injector at 3.0 ml/s, followed by a 20 ml saline flush after pre-contrast acquisitions. The enhanced images were acquired in five post-contrast acquisitions without gap centered at 20 s within total 5 mins and 41 s; 3) the sagittal T2-weighted imaging (T2WI) sequence with fat suppression, TR/TE, 3000/72 ms; FOV, 340×340 mm; matrix size, 269×384; and slice thickness, 4.0 mm.
Clinical-pathological data
Histopathological results were acquired by surgery or core needle biopsy on all female patients (mean, 49.13±11.91 years; range, 25–92 years) in our institution within 1 month after MRI examination. Histological diagnoses were made by a single experienced pathologist (CW) with more than 10 years’ work in breast histologic evaluation. Lymph node status was examined on the basis of hematoxylin and eosin-stained sections. Histological grades of tubular structure, pleomorphism, and mitotic count were evaluated with modified Bloom and Richardson as the criteria, and they are ranked a: Grade I, score 3–5; Grade II, score 6–7, Grade III, scores 8–9. For the immunohistochemical analysis, tissue sections with fixed formalin and embedded paraffin were stained with appropriate antibodies. ER or PR was considered as positive when the stained nuclei take up more than 1% of the cancer cells on an entire stained slide. Furthermore, membranous staining was scored from 0 to 3+ in the case that HER2 expression is concerned. Score 3+ meant positive and score 0 or 1+ is considered as negative. Tumors scored 2+ were sent for fluorescence in situ hybridization (FISH) test to determine the gene amplification, and HER2 expression was labeled as positive if the signal ratio of HER2 gene to chromosome 17 was greater than 2. Accordingly, breast cancers were categorized into TNBC (ER and PR absent, HER2 negative) and non-TNBC (ER- and/or PR-positive or HER2 overexpressed or amplified) groups with reference to molecular marker expression.14 The detailed clinical-pathological features of these two groups are illustrated in Table 1.
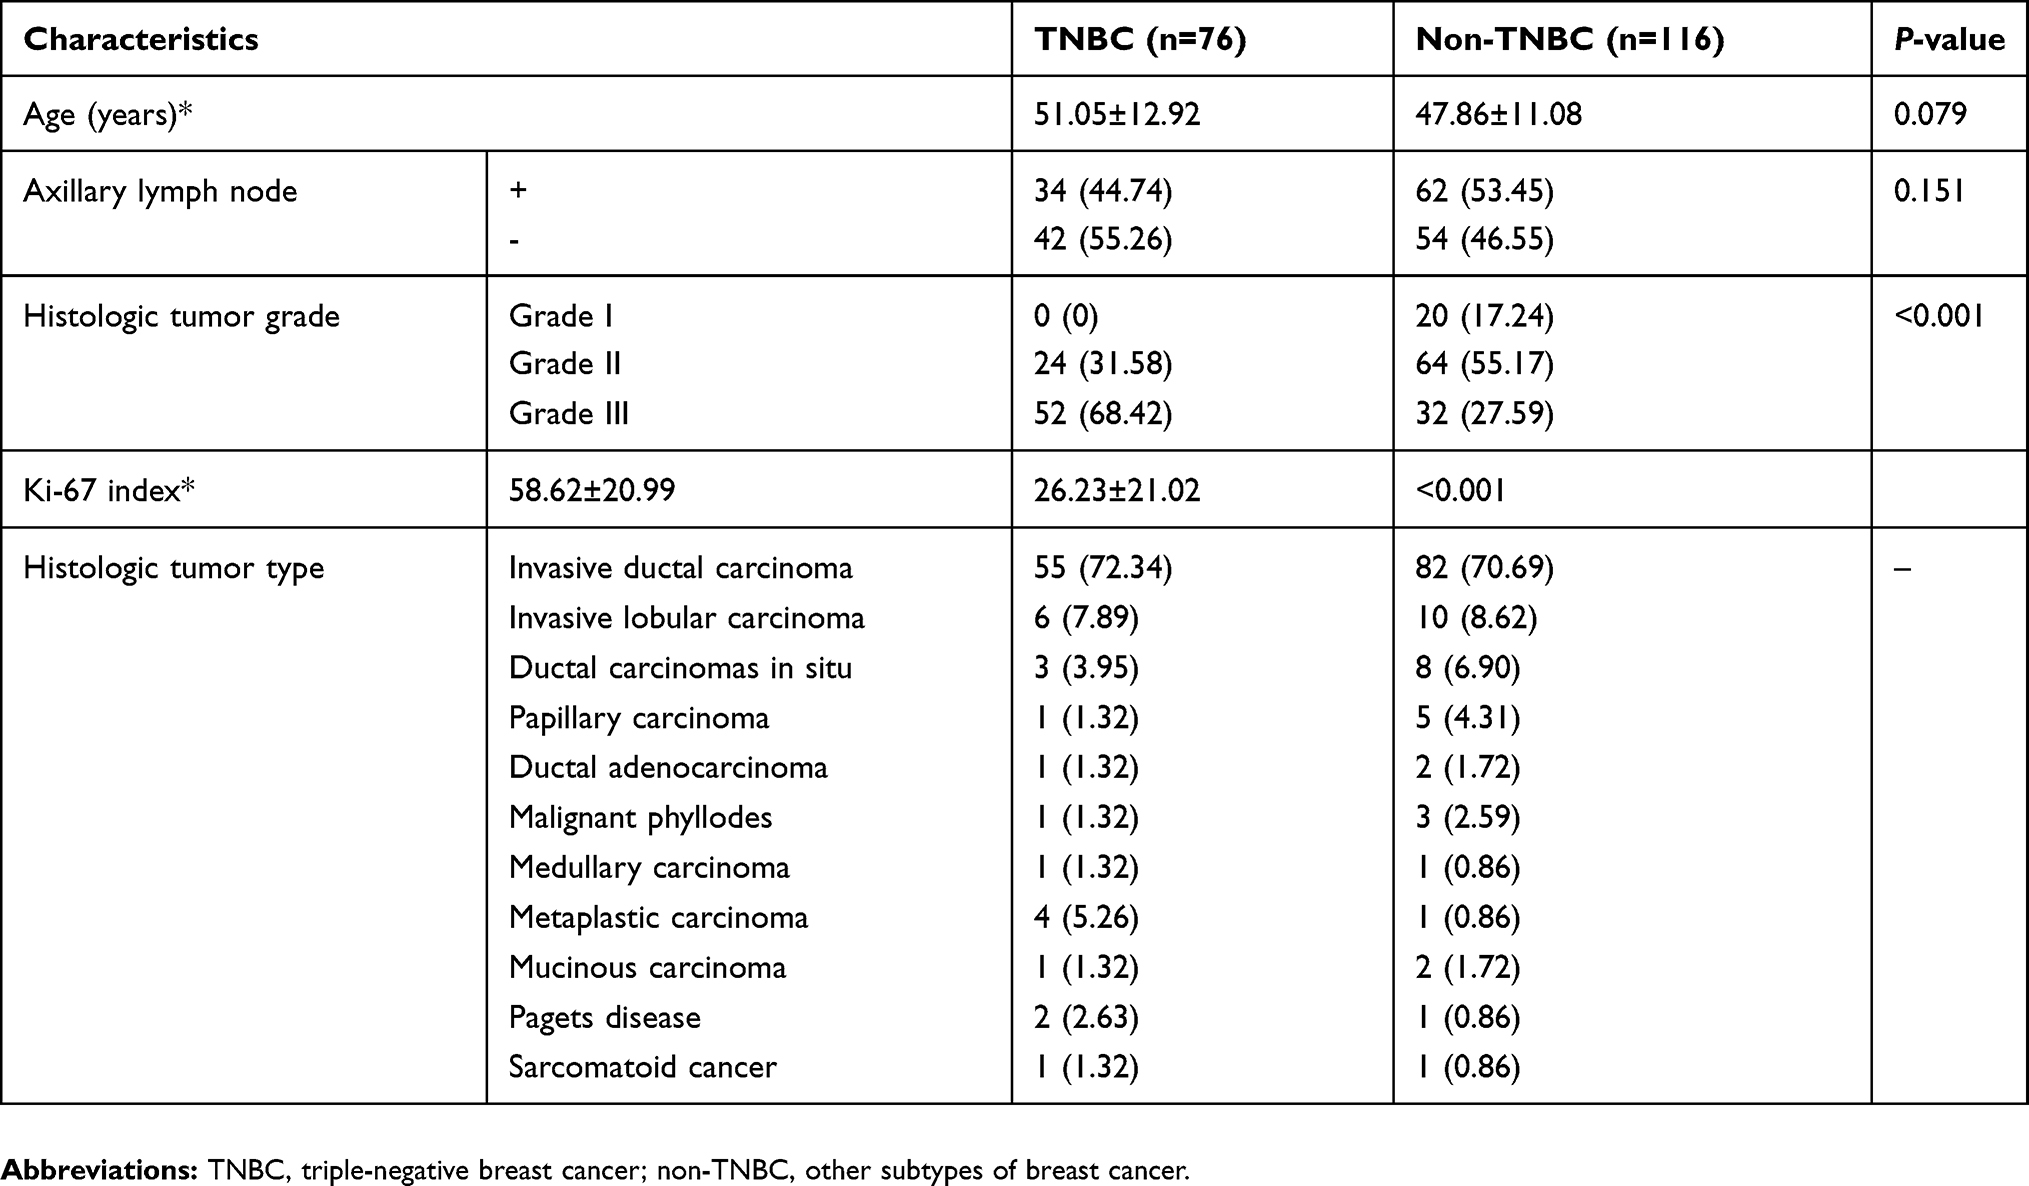 |
Table 1 Clinical-pathological information of study population |
Interpretation of MRI findings
MR images were verified retrospectively by a senior radiologist (YNJ) with more than 10 years’ experience in breast MR imaging, relying on the Breast Imaging Reporting and Data System (BI-RADS) alone,15 blind to the pathological findings. To comply with the time-signal intensity curve (TIC) patterns, all dynamic contrast enhancement MRI (DCE-MRI) data were processed afterward with the mean-curve software on syngoMMWP VE40B workstation. A circular region of interest (ROI) was selected in the most enhanced region of a slice from the largest tumor area, with its diameter of 5–10 mm2 avoiding any necrotic, cystic or hemorrhagic areas. The TICpattern was generated from the selected ROI and categorized into three types, type I (persistent), type II (plateau) and type III (washout). Furthermore, when visually evaluated on T2WIs, the intramural signal intensity of the tumors can be low, equal or high compared with its surrounding breast tissues. For all the masses, the tumor size, foci quantity, tumor shape, mass margin, and the internal enhancement were also evaluated on the DCE-MRI. Tumor size was calculated based on the maximum diameter of the tumor. For patients with more than one lesion, only the largest one was included in our study. And their detailed MRI features are shown in Table 2.
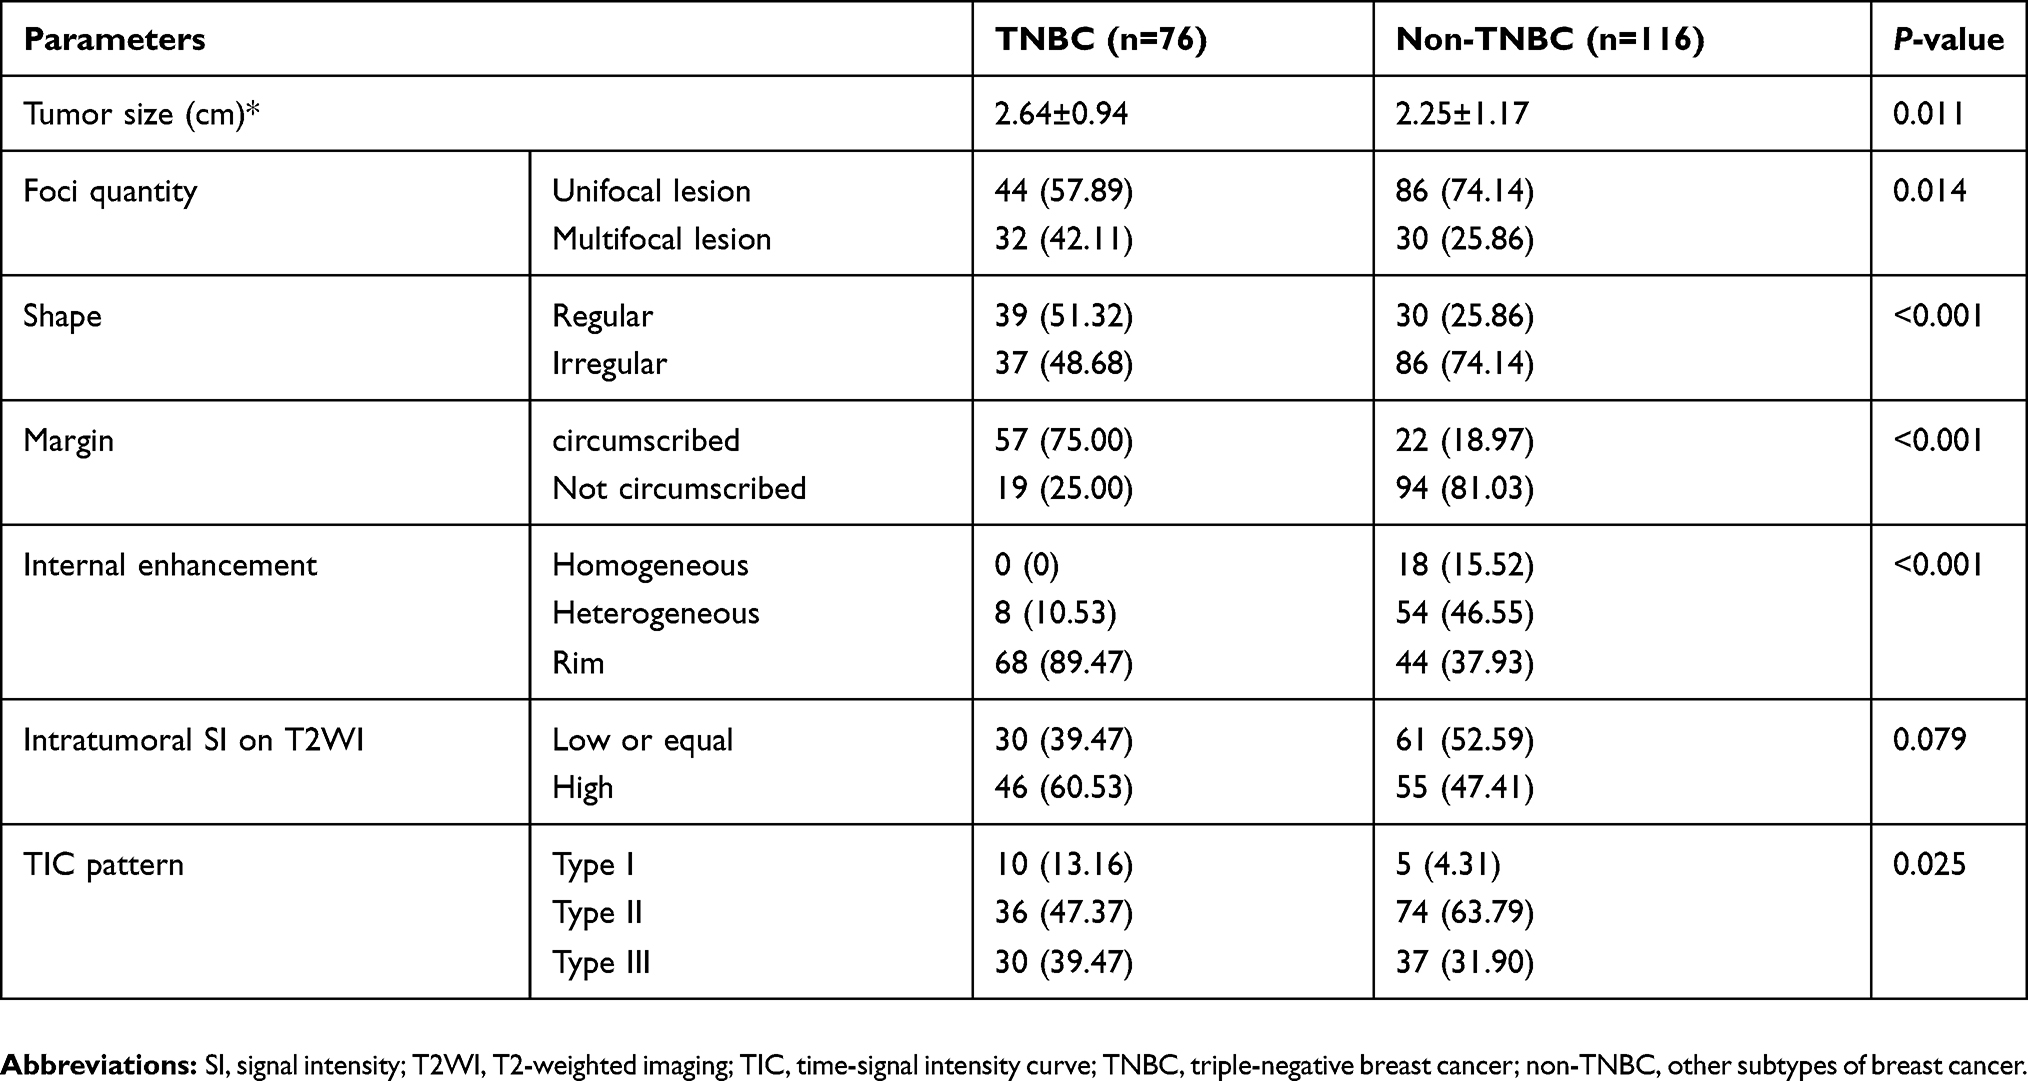 |
Table 2 Magnetic resonance imaging features stratified by TNBC and non-TNBC |
For quantitative assessment of the DWI, all images were converted into digital imaging format for transference and medicine format for communication. Then, both data were further processed offline with in-house software (FireVoxel; CAI2R, New York University, NY). After that, ADC maps were drawn on a mono-exponential fitting model. All ROIs were drawn on the most encompassed lesion area regardless of all necrotic, cystic, or hemorrhagic parts. To minimize the influence of partial volume effect, all ROIs were selected a bit smaller than the real lesion, and whole-lesion ADC histograms providing statistical information were generated based on entire lesion volume. Then, the measurements of various parameters about ROIs in every lesion foci slice were totaled to get the voxel-by-voxel values for histogram analysis. The histogram parameters for each ROI were analyzed with commercial software (SPSS V. 19.0, Chicago, IL, USA). Whereupon, these ADC histograms were drawn with diffusivity on its x-axis and its bin size of 1×10⁻³ mm2/s, and the percentage of lesion volume (frequency in each bin/total number of voxels analyzed) on its y-axis. From ADC histogram analysis, we got the following parameters including ADCmean, ADCmin, ADCmax, ADC10, ADC20, ADC25, ADCmedian, ADC60, ADC70, ADC75, ADC90, skewness, and kurtosis. On each percentile, a certain number of observations were calculated. On this histogram, skewness means the asymmetry of the pixel distribution and kurtosis tells its peakedness.
Statistical analysis
All the parameter values collected were statistically analyzed with software packages (SPSS V. 19.0, Chicago, IL, USA; and MedCalc V. 12.7, Mariakerke, Belgium). For each parameter, their numeric data were averaged over all patients to get mean±SD, and then K–S test was conducted on them for normally distributed analysis. First, univariate analysis was performed on every qualitative and quantitative variable to estimate their ability for TNBC prediction. Furthermore, the frequency distribution of each qualitative MRI parameter as well as their clinical-pathological features was compared by chi-square test. If the sample size of any subgroup was too small, then Fisher exact test was applied instead. While the quantitative parameters of the two groups were compared following the unpaired t-test. Based on these comparisons, multivariate regression analysis was adopted to look for the most significant variables. After that, ROC curve analyses were used to work out the value of these risk variables and compare their efficiency in predicting TNBC. Finally, sensitivity and specificity were calculated with a threshold criterion with maximum Youden index (Youden index=sensitivity+specificity−1). For this analysis, statistically significance parameter P is supposed as P<0.05.
Results
From Table 1, which shows the clinical-pathological data, we noticed among 192 breast cancers, 76 (39.58%) were TNBC and 116 (60.42%) were non-TNBC. There was no age-related bias between these two groups (p=0.079), and no remarkable difference in axillary lymph node status of the two groups (p=0.151), either. However, females suffering from TNBC were more likely to have histologically grade III tumors (68.42% in TNBC vs 27.59% in non-TNBC, p<0.001). And higher Ki-67 index was noticeably associated with TNBC (p<0.001).
From Table 2, which shows the univariate analyses of the MRI parameters between these two groups, we concluded larger tumor size, regular shape (51.32% in TNBC vs 25.86% in non-TNBC), circumscribed mass margin (75.00% in TNBC vs 18.97% in non-TNBC), and rim enhancement (89.47% in TNBC vs 37.93% in non-TNBC) were significantly associated with TNBC (p<0.05). Foci quantity was significantly different between these two groups with the unifocal lesion accounting for 57.89% in TNBC and 74.14% in non-TNBC (p<0.05). And percentage of persistent enhancement pattern was 13.16% for TNBC and 4.31% for non-TNBC, while the TIC pattern was also significantly different in the two groups (p<0.05). However, no big difference was found in signal intensity on T2WI (P>0.05), even 60.53% of the TNBCs have high values.
On DWI, TNBC showed rather higher values than non-TNBCs when the following parameters are considered, ADCmean, ADCmin, ADCmax, ADC10, ADC20, ADC25, ADCmedian, ADC60, ADC70, ADC75, and ADC90. However, no difference in skewness and kurtosis is insignificant. In Table 3, the values of histogram parameters are compared between the two groups. Through ROC curve analysis, we noticed that ADC90=1.47×10⁻³ mm2/s would be an optimal threshold value for differentiating TNBC from non-TNBC when it is used as the index only. Upon this index, a higher AUC could be achieved than ADCmean, and their difference was quite remarkable (AUC, 0.768 vs 0.692; P=0.04). To avoid the possible collinearity, only this quantitative parameter ADC90, which demonstrated the maximum AUC, was included in the multivariate regression analysis, together with tumor size, foci quantity, tumor shape, mass margin, internal enhancement, and TIC types. Multivariate regression analysis results revealed that circumscribed margin, rim enhancement, and ADC90 have important relation with TNBC. Detailed multivariate regression analysis results are shown in Table 4 and its representative cases are shown in Figure 1.
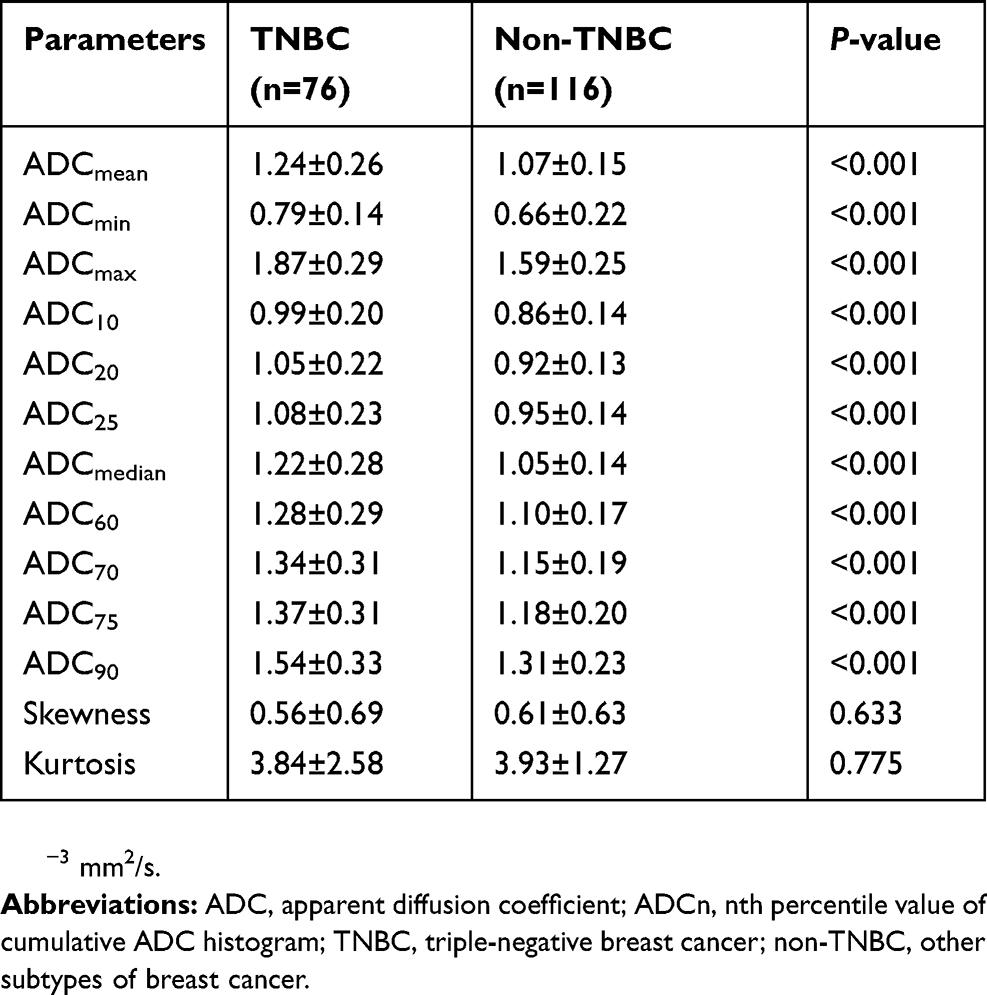 |
Table 3 Histogram parameters generated from ADC maps of the two groups |
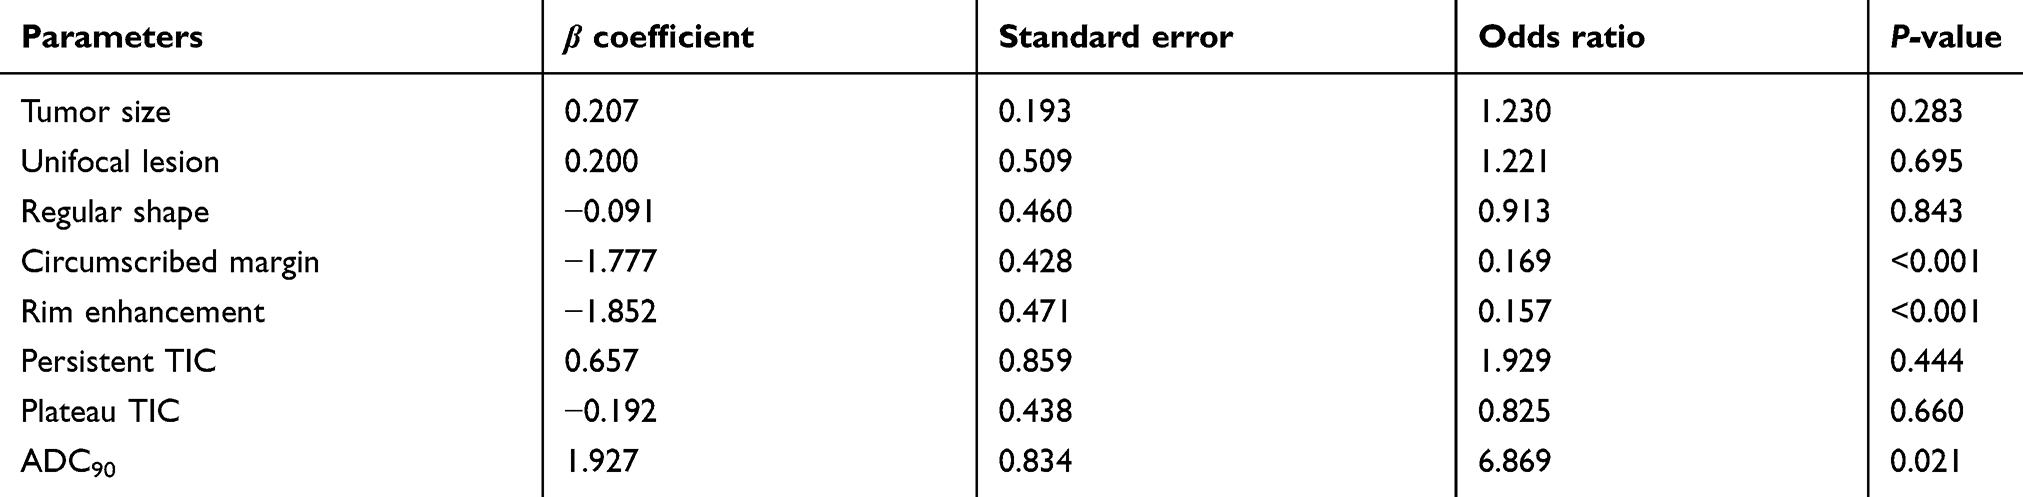 |
Table 4 Multivariate logistic regression results for predicting TNBC |
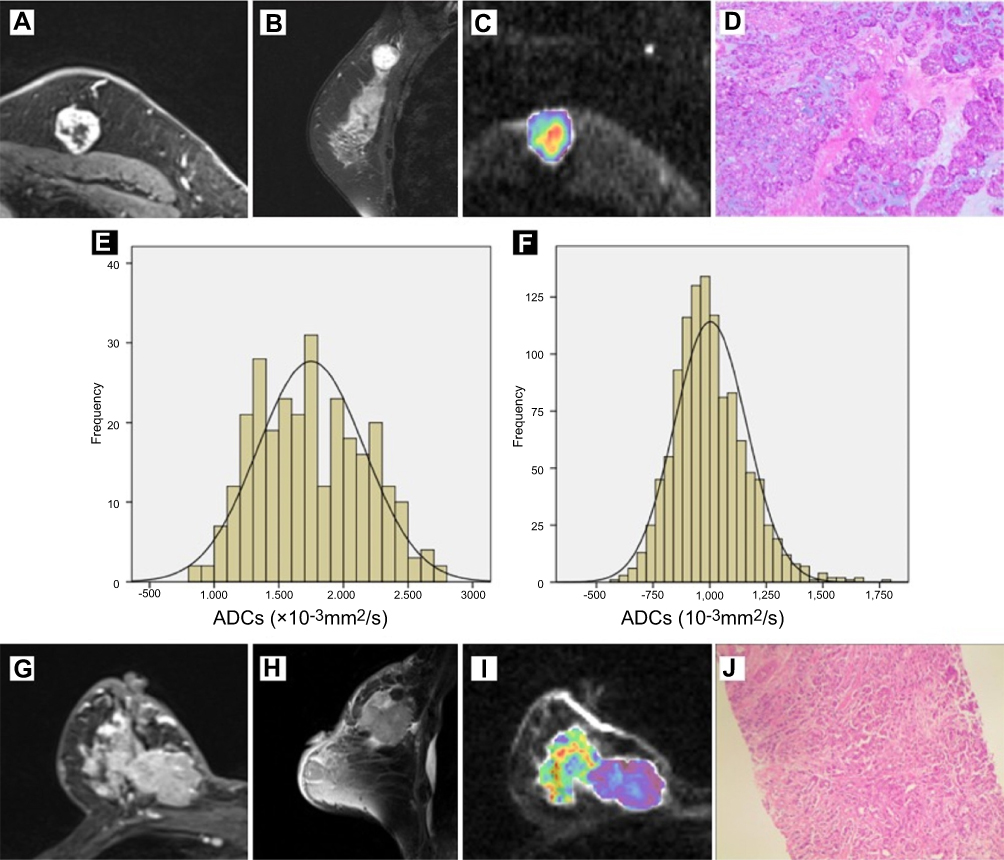 |
Figure 1 MR images in a 54-year-old woman with left TNBC (A–E) and a 75-year-old woman with right non-TNBC (F–J). Dynamic contrast-enhanced images on the largest slice of lesions demonstrate that TNBC (A) is shown as circumscribed margin with rim enhancement and non-TNBC (G) is shown as not circumscribed margin with heterogeneous enhancement. Sagittal T2-weighted images show high signal intensity in TNBC (B) and low signal intensity in non-TNBC (H). Corresponding color maps (C, I) for pixel-by-pixel ADC values of whole lesion delineated with freehand ROI are obtained by diffusion-weighted image (b=800 s/mm2). Photomicrograph of histologic specimen of surgical resection tissue shows invasive ductal carcinoma (IDC) (D) with grade 3 cellular features (Hematoxylin-eosin stain; original magnification, ×100). Photomicrograph of histologic specimen of biopsy tissue shows IDC (J) with grade 3 cellular features (Hematoxylin-eosin stain; original magnification, ×40). The corresponding histograms show a large portion of pixels with higher ADC values with ADC90=1.805×10⁻³ mm2/s of TNBC (E), and a large portion of pixels with lower ADC values with ADC90=1.263×10⁻³ mm2/s of non-TNBC (F). Abbreviations: MR, magnetic resonance; TNBC, triple-negative breast cancer; non-TNBC, other subtypes of breast cancer; ADC , apparent diffusion coefficient; ROI, region of interest. |
According to this result of multivariate regression analysis, we established two diagnostic models (s-MRI: circumscribed margin and rim enhancement; s-MRI+DWI: circumscribed margin, rim enhancement, and ADC90>1.47×10⁻³ mm2/s). And we noticed s-MRI+DWI together help to achieve higher AUC and better specificity than s-MRI alone (s-MRI+DWI vs s-MRI; AUC, 0.833 vs 0.797; specificity, 98.3% vs 89.7%; sensitivity, 68.4% vs 69.7%). And the difference of AUC was statistically significant (P=0.013). The detailed diagnostic performances are summarized in Table 5.
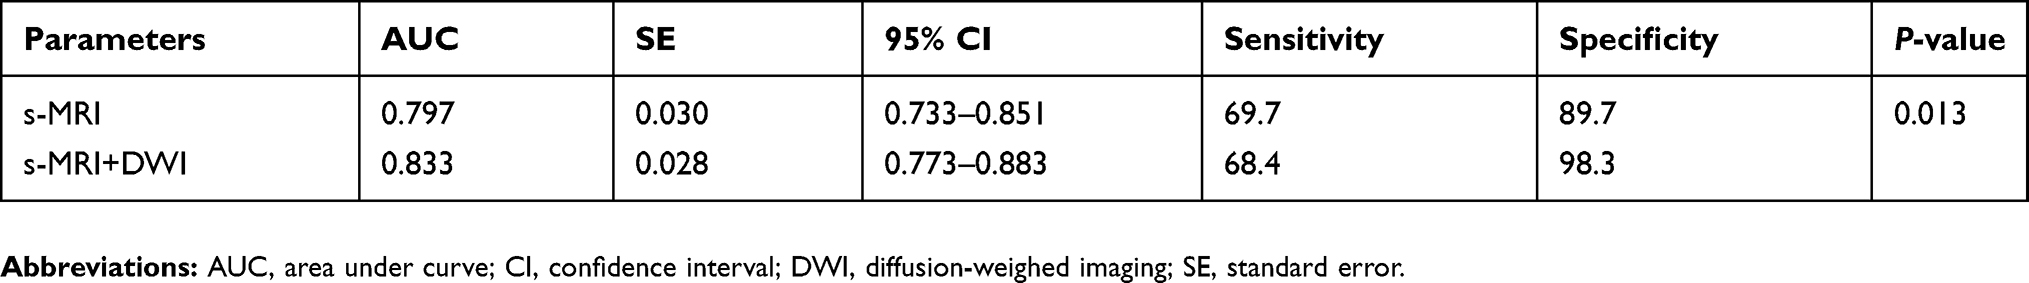 |
Table 5 Diagnostic performance of significant parameters of MRI and the combination of MRI and DWI |
Discussion
Our study demonstrated that circumscribed margin, rim enhancement, and ADC90 were significant predictors for TNBC. ADC histogram analysis can provide added value in clinical diagnosis, especially in specificity.
In our study, TNBCs presented higher histologic grade, and Ki-67 expression was in conformity with previous reports.16–18 Even a higher rate of lymph node positivity was considered to be associated with TNBC,16,17,19 its difference in TNBCs and non-TNBCs was not significant. All features reflecting the higher proliferation rate and more aggressive behavior of TNBC.
Meanwhile, our study also concluded that TNBC had a regular shape and circumscribed margin in morphological features, similar to those reported in previous studies.20,21 In general, regular shape and circumscribed mass margin are frequently considered as benign findings. In addition, Schrading and Kuhl22 revealed that familial breast cancer tends to have circumscribed mass margins. Therefore, specific subtypes of high-grade tumors, such as TNBCs and familial breast cancers, are possible to manifest benign morphologic characteristics. Nevertheless, our logistic regression analysis failed to identify regular shape as an independent predictor of TNBC. Reasonably, this could be affected by the close association of this parameter with other morphological features such as circumscribed margin or rim enhancement, which could have limited the capability of regression analysis to independently demonstrate the effect of regular shape in the prediction of TNBC.
Moreover, rim enhancement was significantly correlated with TNBC in our study, and most TNBCs on T2WI showed high intramural signal intensity. Rim enhancement can be illuminated by peripheral high angiogenesis and central necrosis of the tumor.23–25 Dogan et al26 reported that the areas of high signal intensity on T2WI which located in the center of the tumor are correspondent to non-enhanced areas on dynamic MRI. As a common finding, it could be explained by internal tumor necrosis in majority of TNBCs. Schmitz et al also27 reported that visible rim enhancement was the most accurate prognostic biomarker for ER status. These results suggest that rim enhancement may be the most useful MRI finding for identifying TNBC. In our study, it is also an independent predictor for TNBC in multivariate regression analysis.
In addition to the earlier morphological analyses on the standard MRI, molecular characterization is expected to be beneficial for the diagnosis of TNBC as well. With reference to previous documents, lower ADC values usually accompanied with features reflecting aggressive cancer, such as advanced histological grade, larger tumor size or existence of axillary lymph nodes.28,29 In this view, TNBC manifesting aggressive clinical features is expected to have lower ADC values than other subtypes. However, in our study, it was found TNBC exhibited higher mean ADC value (P<0.001). One possible explanation for the inconsistency is that the intramural necrosis which showed high signal intensity on T2WI was significantly related with tumor aggressiveness and higher ADC value. Areas of tumor necrosis indicated a decrease in tumor cellularity but an increase in its diffusion, loss of signal, and higher ADC value on DWI.30 In spite of the pathological verification of tumor necrosis, it still could be assumed that higher ADC value in TNBC is related with the tumor necrosis.
In ADC histograms analysis, we found that quite a few ADC parameters (ADCmin, ADCmean, ADCmax, ADC10, ADC20, ADC25, ADCmedian, ADC60, ADC70, ADC75, and ADC90; all P<0.001) had a higher value than those of other subtypes. Among them, ADC90 showed the maximum AUC in the ROC curve analysis. For this reason, we believe that high percentile ADC values would keep well with the necrosis component of the lesion tissue. Within lesions with heterogeneous cellularity, focal areas of necrosis components can to a great extent be represented by ADC90 instead of ADCmean. Moreover, in lesions densely packed with necrosis, more pixels display high ADC values. In contrast, ADCmax could be easily affected by outlier noise, artifact, or of the mass margin around in ROI assignment. As a result, ADC90 performed best among all percentile ADC values with the optimal threshold value 1.47×10⁻³ mm2/s in distinguishing TNBC from other subtypes.
By combining the standard MRI features (circumscribed margin, rim internal enhancement) with ADC90, higher AUC and better specificity can be achieved than by using the morphological features only. The standard MRI and DWI may produce complementary information for each other by using the ADC values as the DWI biomarker. As is known, clinical cancer diagnosis still has great limitation for its low specificity, which may lead to unnecessary biopsy.31 Therefore, a statistically significant difference in AUC and better specificity could promote our confidence in TNBC prediction, which will greatly help the communication between doctors and patients and would facilitate clinical decision-making, enable the development of optimal treatment plans, and improve clinical outcomes.
However, there are a few limitations in our study, in addition to the inherent limitations of retrospective design. First, the limited quality of DWI and difficulty in manual selection should take responsibility for excluding small tumors with diameter less than 1 cm and non-mass enhancement lesions from our study. Furthermore, higher ADC values of non-mass enhancement lesions may be caused by the improper inclusion of parenchymal tissue. Considering the incidence of small lesions and non-mass enhancement lesions, this could limit the clinical applicability of our results. Second, both MRI feature analysis and histogram analysis of ADC were performed only once; hence, the inter- and intra-reader variabilities were not assessed. Third, our study examined TNBC and other subtypes, not compared different subtypes based on a detailed one-to-one comparison. Further studies to compare TNBC with different subtype breast cancers in detail and benign lesions such as fibroadenoma are needed. Therefore, the findings of this study should be considered only as preliminary results.
Conclusion
In conclusion, TNBC presented several distinctive morphological features on standard MRI like circumscribed margin and rim enhancement. As is known, clinical cancer diagnosis still has great limitation for the low specificity of standard MRI, which may lead to unnecessary biopsy. Besides the morphological features, ADC histogram analysis has the potential to provide additional value in predicting TNBC with high specificity. The standard MRI and DWI may produce complementary information for each other by using the ADC values as the DWI biomarker. Based on our preliminary results, adding ADC histogram analysis could improve diagnostic specificity and promote our confidence in TNBC prediction, which will greatly help the communication between doctors and patients. Therefore, adding ADC histogram analysis would facilitate clinical decision making, enable the development of optimal treatment plans, and improve clinical outcomes.
Acknowledgment
We would like to thank the patients and families involved in this study. This work was supported by the National Natural Science Foundation of China (Grant No. 81501442) and The Priority Academic Program Development of Jiangsu Higher Education Institutions (PAPD, project number JX10231801).
Disclosure
The authors report no conflicts of interest in this work.
References
1. Leon-Ferre RA, Polley MY, Liu H, et al. Impact of histopathology, tumor-infiltrating lymphocytes, and adjuvant chemotherapy on prognosis of triple-negative breast cancer. Breast Cancer Res Treat. 2018;167(1):89–99. doi:10.1007/s10549-017-4499-7
2. Rapiti E, Pinaud K, Chappuis PO, et al. Opportunities for improving triple-negative breast cancer outcomes: results of a population-based study. Cancer Med. 2017;6(3):526–536. doi:10.1002/cam4.998
3. Klimov S, Rida PC, Aleskandarany MA, et al. Novel immunohistochemistry-based signatures to predict metastatic site of triple-negative breast cancers. Br J Cancer. 2017;117(6):826–834. doi:10.1038/bjc.2017.224
4. Agner SC, Rosen MA, Englander S, et al. Computerized image analysis for identifying triple-negative breast cancers and differentiating them from other molecular subtypes of breast cancer on dynamic contrast-enhanced MR images: a feasibility study. Radiology. 2014;272(1):91–99. doi:10.1148/radiol.14121031
5. Durando M, Gennaro L, Cho GY, et al. Quantitative apparent diffusion coefficient measurement obtained by 3.0 Tesla MRI as a potential noninvasive marker of tumor aggressiveness in breast cancer. Eur J Radiol. 2016;85(9):1651–1658. doi:10.1016/j.ejrad.2016.06.019
6. Mori N, Mugikura S, Takasawa C, et al. Peritumoral apparent diffusion coefficients for prediction of lymphovascular invasion in clinically node-negative invasive breast cancer. Eur Radiol. 2016;26(2):331–339. doi:10.1007/s00330-015-3847-4
7. Tan SL, Rahmat K, Rozalli FI, et al. Differentiation between benign and malignant breast lesions using quantitative diffusion-weighted sequence on 3 T MRI. Clin Radiol. 2014;69(1):63–71. doi:10.1016/j.crad.2013.08.007
8. Yoo H, Shin HJ, Baek S, et al. Diagnostic performance of apparent diffusion coefficient and quantitative kinetic parameters for predicting additional malignancy in patients with newly diagnosed breast cancer. Magn Reson Imaging. 2014;32(7):867–874. doi:10.1016/j.mri.2014.04.012
9. Kul S, Cansu A, Alhan E, Dinc H, Gunes G, Reis A. Contribution of diffusion-weighted imaging to dynamic contrast-enhanced MRI in the characterization of breast tumors. Am J Roentgenol. 2011;196(1):210–217. doi:10.2214/AJR.10.4258
10. Suo S, Zhang K, Cao M, et al. Characterization of breast masses as benign or malignant at 3.0 T MRI with whole-lesion histogram analysis of the apparent diffusion coefficient. J Magn Reson Imaging. 2016;43(4):894–902. doi:10.1002/jmri.25043
11. Bougias H, Ghiatas A, Priovolos D, Veliou K, Christou A. Whole-lesion apparent diffusion coefficient (ADC) metrics as a marker of breast tumour characterization-comparison between ADC value and ADC entropy. Br J Radiol. 2016;89(1068):20160304. doi:10.1259/bjr.20160304
12. Kim EJ, Kim SH, Park GE, et al. Histogram analysis of apparent diffusion coefficient at 3.0 t: correlation with prognostic factors and subtypes of invasive ductal carcinoma. J Magn Reson Imaging. 2015;42(6):1666–1678. doi:10.1002/jmri.24934
13. Liu HL, Zong M, Wei H, et al. Preoperative predicting malignancy in breast mass-like lesions: value of adding histogram analysis of apparent diffusion coefficient maps to dynamic contrast-enhanced magnetic resonance imaging for improving confidence level. Br J Radiol. 2017;90(1079):20170394. doi:10.1259/bjr.20170394
14. Goldhirsch A, Wood WC, Coates AS, et al. Strategies for subtypes–dealing with the diversity of breast cancer: highlights of the St. Gallen International Expert Consensus on the Primary Therapy of Early Breast Cancer 2011. Ann Oncol. 2011;22(8):1736–1747. doi:10.1093/annonc/mdr304
15. Sickles EA, D’Orsi CJ, Bassett LW, et al. ACR BI-RADS mammography. In: ACR BI-RADS Atlas, Breast Imaging Reporting and Data System. Reston (VA): American College of Radiology; 2013:141–167.
16. Carey LA, Perou CM, Livasy CA, et al. Race, breast cancer subtypes, and survival in the Carolina Breast Cancer Study. JAMA. 2006;295(21):2492–2502. doi:10.1001/jama.295.21.2492
17. Dent R, Trudeau M, Pritchard KI, et al. Triple-negative breast cancer: clinical features and patterns of recurrence. Clin Cancer Res. 2007;13(15 Pt 1):4429–4434. doi:10.1158/1078-0432.CCR-06-3045
18. Anders C, Carey LA. Understanding and treating triple-negative breast cancer. Oncology (Williston Park). 2008;22(11):
19. Whitman GJ, Albarracin CT, Gonzalez-Angulo AM. Triple-negative breast cancer: what the radiologist needs to know. Semin Roentgenol. 2011;46(1):26–39. doi:10.1053/j.ro.2010.09.004
20. Sutton EJ, Dashevsky BZ, Oh JH, et al. Breast cancer molecular subtype classifier that incorporates MRI features. J Magn Reson Imaging. 2016;44(1):122–129. doi:10.1002/jmri.25119
21. Sung JS, Stamler S, Brooks J, et al. Breast cancers detected at screening MR imaging and mammography in patients at high risk: method of detection reflects tumor histopathologic results. Radiology. 2016;280(3):716–722. doi:10.1148/radiol.2016151419
22. Schrading S, Kuhl CK. Mammographic, US, and MR imaging phenotypes of familial breast cancer. Radiology. 2008;246(1):58–70. doi:10.1148/radiol.2461062173
23. Youk JH, Son EJ, Chung J, Kim JA, Kim EK. Triple-negative invasive breast cancer on dynamic contrast-enhanced and diffusion-weighted MR imaging: comparison with other breast cancer subtypes. Eur Radiol. 2012;22(8):1724–1734. doi:10.1007/s00330-012-2425-2
24. Sung JS, Jochelson MS, Brennan S, et al. MR imaging features of triple-negative breast cancers. Breast J. 2013;19(6):643–649. doi:10.1111/tbj.12182
25. Uematsu T, Kasami M, Yuen S. Triple-negative breast cancer: correlation between MR imaging and pathologic findings. Radiology. 2009;250(3):638–647. doi:10.1148/radiol.2503081054
26. Dogan BE, Gonzalez-Angulo AM, Gilcrease M, Dryden MJ, Yang WT. Multimodality imaging of triple receptor-negative tumors with mammography, ultrasound, and MRI. AJR Am J Roentgenol. 2010;194(4):1160–1166. doi:10.2214/AJR.09.2355
27. Schmitz AM, Loo CE, Wesseling J, Pijnappel RM, Gilhuijs KG. Association between rim enhancement of breast cancer on dynamic contrast-enhanced MRI and patient outcome: impact of subtype. Breast Cancer Res Treat. 2014;148(3):541–551. doi:10.1007/s10549-014-3170-9
28. Molinari C, Clauser P, Girometti R, et al. MR mammography using diffusion-weighted imaging in evaluating breast cancer: a correlation with proliferation index. Radiol Med. 2015;120(10):911–918. doi:10.1007/s11547-015-0527-z
29. Razek AA, Gaballa G, Denewer A, Nada N. Invasive ductal carcinoma: correlation of apparent diffusion coefficient value with pathological prognostic factors. NMR Biomed. 2010;23(6):619–623. doi:10.1002/nbm.1503
30. Park SH, Moon WK, Cho N, et al. Diffusion-weighted MR imaging: pretreatment prediction of response to neoadjuvant chemotherapy in patients with breast cancer. Radiology. 2010;257(1):56–63. doi:10.1148/radiol.10092021
31. Arponen O, Masarwah A, Sutela A, et al. Incidentally detected enhancing lesions found in breast MRI: analysis of apparent diffusion coefficient and T2 signal intensity significantly improves specificity. Eur Radiol. 2016;26(12):4361–4370. doi:10.1007/s00330-016-4326-2
 © 2019 The Author(s). This work is published and licensed by Dove Medical Press Limited. The
full terms of this license are available at https://www.dovepress.com/terms
and incorporate the Creative Commons Attribution
- Non Commercial (unported, 3.0) License.
By accessing the work you hereby accept the Terms. Non-commercial uses of the work are permitted
without any further permission from Dove Medical Press Limited, provided the work is properly
attributed. For permission for commercial use of this work, please see paragraphs 4.2 and 5 of our Terms.
© 2019 The Author(s). This work is published and licensed by Dove Medical Press Limited. The
full terms of this license are available at https://www.dovepress.com/terms
and incorporate the Creative Commons Attribution
- Non Commercial (unported, 3.0) License.
By accessing the work you hereby accept the Terms. Non-commercial uses of the work are permitted
without any further permission from Dove Medical Press Limited, provided the work is properly
attributed. For permission for commercial use of this work, please see paragraphs 4.2 and 5 of our Terms.