Back to Journals » Drug Design, Development and Therapy » Volume 12
ADAR1 silencing-induced HUVEC apoptosis is mediated by FGFR2 under hypoxia stress
Authors Jiang Y, Wang Z, Chen X, Wang W, Wang X
Received 24 July 2018
Accepted for publication 1 October 2018
Published 10 December 2018 Volume 2018:12 Pages 4181—4189
DOI https://doi.org/10.2147/DDDT.S181312
Checked for plagiarism Yes
Review by Single anonymous peer review
Peer reviewer comments 4
Editor who approved publication: Professor Jianbo Sun
Yun Jiang,1 Zhancheng Wang,1 Xu Chen,1 Wei Wang,1 Xiaowei Wang2
1Department of Cardiology, The Eighth People’s Hospital of Shanghai, Shanghai 200233, China; 2Shanghai Weiang Info Tech Ltd., Shanghai 200233, China
Background: The adenosine deaminase acting on RNA 1 (ADAR1) specifically deaminates adenosine to inosine in double-stranded RNA (dsRNA). Emerging evidence indicated that under hypoxia condition, such as tumor microenvironment, ADAR1 level was increased. Interestingly, we found FGFR2 was also increased under hypoxia stress. The purpose of this study was to investigate the regulation mechanism of ADAR1 and the potential role of ADAR1–FGFR2 axis in cell proliferation and apoptosis.
Methods: Using human umbilical vein endothelial cells as cellular model, we explored the function of ADAR1 in regulating cell survival.
Results: We found manipulation of FGFR2 activity could override the cellular effect of ADAR1, suggesting FGFR2 could be a potential effector of ADAR1. Moreover, our results revealed that PI3K-Akt pathway was involved in ADAR1–FGFR2 axis-induced cell proliferation.
Conclusion: In summary, this study supported the notion that ADAR1 could play a role in tumor cell proliferation, which was mediated by FGFR2.
Keywords: ADAR1, HUVEC, FGFR2, apoptosis, hypoxia, PI3K-Akt pathway
Introduction
Adenosine deaminase acting on RNA1 (ADAR1), an RNA editing enzyme, catalyzes the C6 deamination of adenosine (A) in double-stranded RNA (dsRNA) structures to form inosine (I).1 This process is known as A-to-I RNA editing, which potentially leads to altering the coding capacity and structure of the substrate RNA when it occurs within the coding sequences.2–4 In mammalian, ADAR family consists of three types of ADARs: ADAR1, ADAR2, and ADAR3. However, only ADAR1 and ADAR2 were proven to have RNA editing capacity.5,6
Emerging evidence indicates that ADAR1 plays critical roles in broader area including apoptosis, cell survival, differentiation, tumorigenesis, and autoimmune disease.7–10 In mice, embryos with deficiency in ADAR1 (−/−) displayed widespread apoptosis in many tissues, which demonstrated its functions to enhance cell survival by editing dsRNAs required for protection against stress-induced apoptosis.7 Fibroblast growth factor receptor 2 (FGFR2) has been implicated to function in tumor development and malignant progression. A previous study has reported that FGFR2 increased cell survival by preventing apoptosis.11 This indicates that investigation of ADAR1 and FGFR2 would promote our understanding of fundamental questions in the field of cell survival and apoptosis.
Hypoxia affects cells and tissues during normal embryonic development and pathological conditions such as myocardial infarction, inflammation and tumorigenesis. It was reported that hypoxia environment can stimulate the amount of ADAR1,12 and apoptosis can also be induced in response to hypoxia.13 However, the potential link between FGFR2 and hypoxia remains unclear. In addition, the underlying mechanism of ADAR1 and FGFR2 for apoptosis was not well investigated.
Given above evidence, in this study, we investigated the regulation mechanism of ADAR1 and FGFR2 axis in cell proliferation and apoptosis. We also investigated the involved signaling pathway for cell proliferation and apoptosis induced by ADAR1 and FGFR2.
Materials and methods
Cell culture
Human umbilical vein endothelial cells (HUVECs) were kindly purchased from American Type Culture Collection (ATCC, Rockville, MD, USA). Cells were cultured in F-12K medium (Thermo Fisher Scientific, Waltham, MA, USA) supplemented with 10% heat-inactivated fetal bovine serum (Thermo Fisher Scientific), 100 units/mL of penicillin, 100 μg/mL of streptomycin (Sigma Aldrich Co., St Louis, MO, USA) with a density of 1×10⁶ cells/mL. The cells were incubated in a standard incubator (37°C, 5% CO2). In hypoxia condition, the cells were incubated at 37°C in 1% O2.
Reagents and compounds
FGF2 was obtained from R&D Systems, Inc. (Minneapolis, MN, USA) and FGFR2 inhibitor BGJ398 was provided by Selleck (Houston, TX, USA). Primary antibodies used were anti-ADAR1 (1:1,000; Abcam, Cambridge, MA, USA), anti-FGFR2 (1:1,000; Cell Signaling Technology, Danvers, MA, USA), anti-GAPDH (1:3,000; Cell Signaling Technology), anti-Bax (1:1,000; Cell Signaling Technology), anti-Bcl-2 (1:1,000; Cell Signaling Technology), anti-Akt (1:1,000; Cell Signaling Technology), anti-Akt (phosphor-S473) (1:1,000; Cell Signaling Technology), and anti-vascular endothelial growth factor (VEGF) (1:1,000; Cell Signaling Technology). Secondary antibodies used were anti-rabbit-horseradish peroxidase (1:1,000; Cell Signaling Technology), anti-mouse-horseradish peroxidase (1:1,000; Cell Signaling Technology).
Western blot analysis
HUVECs were seeded at a density of 4×10⁶ in 10 cm dish. Twenty-four hours later, HUVECs were treated with FGF2 or FGFR2 inhibitor BGJ398 and incubated for 48 hours at 37°C. Next, cells were harvested and washed with cold PBS and lysed with radio-immunoprecipitation assay buffer (Thermo Fisher Scientific) supplemented with phenylmethanesulfonyl fluoride, Na-orthovanadate, protease, and phosphatase inhibitor cocktail (Sigma Aldrich Co.). Cell extract was centrifuged at 10,000×g for 20 minutes at 4°C and supernatant was collected for further analysis. The protein concentration was determined by Bradford protein assay (Bio-Rad Laboratories, Hercules, CA, USA) and equivalent amounts (20 μg) of total cellular protein were separated by 4%–10% SDS-PAGE (Thermo Fisher Scientific) and then transferred on to a nitrocellulose blotting membrane (Thermo Fisher Scientific) which was further blocked with 5% nonfat milk in TBST buffer at room temperature for 1 h, and then incubated with primary antibodies at 4°C overnight. After three washes in tris-buffered saline with Tween 20 (TBST) buffer, the membranes were incubated with horseradish peroxidase–conjugated secondary antibody for 1 h. Finally, the protein binding was visualized using an enhanced chemiluminescence detection system (GE Healthcare, Buckinghamshire, UK).
Quantitative real-time PCR
For quantitative reverse transcription-PCR (qRT-PCR), total mRNA was extracted from cultured cells using RNA purification kits (Thermo Fisher Scientific) and RNA was reverse-transcribed into cDNA with SuperScript™ IV Reverse Transcriptase (Thermo Fisher Scientific). SYBR green quantitative real-time PCR was performed using a real-time PCR system (ABI 7300; Applied Biosystems, Foster City, CA, USA). The real-time PCR procedure was performed as follows: initial denaturation at 95°C for 10 minutes; 40 cycles of denaturation at 95°C for 15 seconds and annealing extension at 60°C for 30 seconds. The relative expression of target genes was determined with the comparative Ct method and was normalized to the endogenous level of GAPDH. The primer sequences used for qRT-PCR were as follows: ADAR1, forward 5′-CGGGATCCCCAAGGTGGAGAATGGTGAGTGGTA-3′ and reverse 5′-GCTCTAGAGAATCAAACCCACAAGAGGCCAGTG-3′; FGFR2, forward 5′-TGGGATATCCTTTCACTCTG-3′ and reverse 5′-GTTATCCTCACCAGCGGGGT-3′; VEGF, forward 5′-ACTGGACCCTGGCTTTACTGCT-3′ and reverse 5′-TGATCCGCATGATCTGCATGGTG-3′; Akt, forward 5′-AAGGATCCATGAGCGACGTGGCTATTGTG-3′ and reverse 5′-AACTCGAGCCTCCAAGCTATCGTCCAGC-3′; GAPDH, forward 5′-CATGAGAAGTATGACAACAGCCT-3′ and reverse 5′-AGTCCTTCCACGATACCAAAGT-3′.
Lentiviral introduction of shADAR1 or ADAR1
A lentiviral vector pLKO.1-puro was modified to either knockdown or overexpress ADAR1. For ADAR1 knockdown, an oligonucleotide was synthesized which consisted of a sequence-specific nucleotide stretch designed to target the ADAR1 (forward 5′-CGCGTCCCCGAGGCAGAAACCTAAGAAGTTCAAGAGACTTCTTAGGTTTCTGCCTCTTTTTGGAAAT-3′ and reverse 5′-CGATTTCCAAAAAGAGGCAGAAACCTAAGAAGTCTCTTGAACTTCTTAGGTTTCTGCCTCGGGGA-3′). This shRNA-expressing lentiviral plasmid was co-transfected with plasmids pVSV-G and pCMVd8.9 into 293 T cells. Viral containing media were collected, filtered, and concentrated by ultracentrifugation. Stable cell lines with ADAR1 knocking down were obtained by selection with puromycin. Lentiviral-based ADAR1 overexpression was performed using similar methods.
Apoptosis analysis
For Annexin V/propidium iodide (PI) staining, 0.5–1×10⁶ cells were stimulated to induce cell death. Cells were centrifuged at 500×g for 5 minutes at 4°C and the supernatant was aspirated. Cells were then washed with 1 mL PBS and resuspended in 100 μL staining buffer (Thermo Fisher Scientific) by mixing 2 μL of Annexin-V-FLUOS and 2 μL PI in incubation buffer according to manufacturer’s instructions. The cells were incubated for 15 minutes at room temperature and protected from light. After centrifugation at 500×g for 5 minutes at 4°C, the staining buffer was aspirated and the cells were resuspended in 100 μL PBS and analyzed immediately by flow cytometer. The 488 nm laser was used for excitation. Debris and doublets were gated out. Annexin V-FLUOS (505–560 nm) and PI (595–642 nm) channels were measured, and at least 10,000 events of singlet per sample were collected.
Cell proliferation assay
Cell proliferation was detected with a colorimetric assay using the CellTiter 96 AQueous One Solution (MTS) reagent (Promega Corporation, Fitchburg, WI, USA). In brief, HUVECs at a density of 1×10⁴ cells/well were plated in 96-well plates and then cultured at 24 h intervals for 4 days. Next, 20 μL MTS reagent was added to each well for 4 h at 37°C. The absorbance value (OD) of each well was measured at 450 nm. Image-based proliferation assay was performed based on EdU incorporation. Cells at a density of 5×10³ cells/well in 96-well plates were incubated with 10 μM EdU (EMD Millipore, Billerica, MA, USA) for 3 days and fixed by formaldehyde. After PBS washing, EdU detection cocktail was added to the cells for 15 minutes, and images were collected by fluorescent microscopy.
Immunofluorescence staining
Cells were washed by cold PBS once and then were fixed with 3.7% paraformaldehyde in PBS for 20 minutes at room temperature and treated with 1% hydrogen peroxide for 10 minutes and then incubated for 40 minutes with blocking solution (PBS containing 1% BSA, 0.4% Triton X-100% and 4% FBS). After that, the cells were incubated with FGFR2 antibody at 1:1,000 overnight at 4°C. After washing with TBST (0.2% Tween-20) three times for 50 minutes, the cells were incubated with secondary antibodies.
Capase-3 activity measurement
HUVECs after compound treatments were lysed in radio-immunoprecipitation assay buffer followed by three cycles of freeze–thaw before centrifugation at 18,000×g for 30 minutes. The supernatant (20 μL) was combined with reaction buffer consisting of 100 mM HEPES (pH 7.5), 10% sucrose, and 0.1% 3-(3-cholamidopropyl) dimethylammonio-1-propane sulfonate (CHAPS; Sigma Aldrich Co.), and the mixture was pre-incubated for 30 minutes at 30°C with or without 50 μM of the cell-permeable, peptide inhibitor of caspase-3 (Ac-DEVD-CHO) (Calbiochem-Novabiochem Corporation, San Diego, CA, USA). The fluorogenic substrate DEVD-AMC (50 μM) was added, and the reactions were incubated at 30°C for 60 minutes. Fluorescence was measured using excitation and emission wavelengths of 360 and 460 nm, respectively. Results were calculated as the total caspase-3 activity for each sample.
Cell permeability measurement
HUVECs were seeded onto vitronectin (10 μg/mL)-coated Costar Transwell inserts (6.5-mm diameter and 3-μm pore size; Corning Incorporated, Corning, NY, USA) at a cell density of 2×10⁴ cells and grown in endothelial basal medium-2 with 10% of fetal calf serum. Confluent HUVECs were infected in triplicate with pathogenic Hantaan virus, Andes virus, or New York virus or nonpathogenic Prospect Hill virus or Tula virus at a multiplicity of infection of 0.5 or mock infected. After 1 hour of adsorption or 1, 2, or 3 days post infection, cells were starved overnight with endothelial basal medium-2%–0.5% bovine serum albumin without growth factors. Fluorescein isothiocyanate-dextran (0.5 mg/mL) was added to the upper chamber of monolayers. At various times, fluorescein isothiocyanate-dextran present in the lower chamber was assayed by using a PerkinElmer fluorimeter (490 nm excitation, 530 nm emission; PerkinElmer Inc., Waltham, MA, USA).
Statistical analysis
All data are expressed as the mean ± SE. Graphs were analyzed with GraphPad Prism 5 software. Differences between groups were performed using Student’s t-test or ANOVA. The level of statistical significance was set at 0.05.
Results
Hypoxia upregulated ADAR1 expression and induced cell apoptosis
It has been shown that oxygen deprivation results in apoptotic cell death and that hypoxia inducible factor 1 (HIF1) plays a key role in this process.19 We first cultured the HUVECs in the condition of hypoxia and detected the mRNA level in a time-dependent manner. The data of qPCR assay showed that hypoxia induced the upregulation of ADAR1 gene expression, reaching the plateau at around 8 hours (Figure 1A). Meanwhile, protein levels of ADAR1, FGFR2, VEGF, and HIF1 were all increased by hypoxia, indicating the activation of apoptosis pathway in cells (Figure 1B).
 | Figure 1 Hypoxia could activate ADAR1 expression and consequently affects cell proliferation and tube formation. |
Next, HUVECs were infected with lentivirus expressing scrambled shRNA as negative control and two anti-ADAR1 shRNAs respectively to inhibit endogenous ADAR1 expression. The results showed that sh-ADAR1-1 exhibited a better inhibitory effect with nearly 80%, while sh-ADAR-2 only decreased endogenous ADAR1 expression by 60% (Figure 1C). Furthermore, knockdown of ADAR1 decreased the transcription level of FGFR2, VEGF in concert with HIF1 in condition of hypoxia (Figure 1D), which proved the hypothesis that ADAR1 was highly involved in cell apoptosis via regulation of FGFR2.
Knockdown of ADAR1 increased cell apoptosis and cell permeability
In order to evaluate the effects of ADAR1 knockdown on cell apoptosis, FACS was applied. The results indicated that knockdown of ADAR1 increased the HUVEC apoptosis rates by more than three times (from 9% to 32% and 29%) (Figure 2A). Meanwhile, cell proliferation rates were measured by MTS assay. Consistent with FACS results, the readout of OD 450 showed that cells with sh-ADAR-1 or sh-ADAR-2 exhibited much lower proliferation rate compared to control cells (Figure 2B). As it is an important pattern of endothelia cells to form branching tubes in proliferation with low permeability so that the whole structure is more tight and functional, we further evaluated the branching tube amounts as well as the permeability in control and ADAR1 knockdown cells. The data showed that sh-ADAR-1 or sh-ADAR-2 could significantly decrease the number of cell branching points and increase the cell permeability, respectively (Figure 2C and D). All these results concluded that ADAR1 was involved in regulation of cell proliferation, and knockdown of ADAR1 could promote cell apoptosis and increase cell permeability.
 | Figure 2 ADAR1 affected HUVEC cell apoptosis, proliferation tube branching formation and cell permeability. |
ADAR1 regulated cell apoptosis and permeability through the modulation of FGFR2
As we have proved that knockdown ADAR1 could increase cell apoptosis and decrease cell permeability, this situation is coincided with the function of FGFR2 in HUVECs. To further investigate the connectivity of ADAR1 and FGFR2, we performed the rescue study by introducing FGF2 into sh-ADAR1 HUVECs. The results showed that FGF2 markedly reverse sh-ADAR1-induced cell apoptosis, concluding from the FACS analysis (Figure 3A). Consistently, FGF2 also promoted cell proliferation in sh-ADAR1-treated cells detected by MTS assay (Figure 3B).
 | Figure 3 ADAR1 affects cell tube branching formation and permeability through FGFR2 during proliferation. |
In order to strengthen our hypothesis, we found that both of the two ADAR1 shRNA stable cell lines exhibited higher caspase-3 activity, indicating the pro-apoptosis role of ADAR1 (Figure 3C). In addition, the proteins that were identified as apoptosis markers including Bax and Bcl-2 were detected with Western blot.16 As shown in Figure 3D knockdown ADAR1 could increase Bax and decrease Bcl-2 protein level, which could be rescued by following treatment with FGF2. Consistent result was also observed in cell permeability assay (Figure 3E). Moreover, FGF2 notably reverses sh-ADAR1-induced tube branching decrease as well (Figure 3F).
To further validate the connectivity of ADAR1 and FGFR2, we conducted over-expressed ADAR1 by delivery with lenti-virus containing ADAR1. The mRNA level of ADAR1 was highly upregulated by lenti-virus infection in HUVECs (Figure 4A). In addition, MTS assay revealed that ADAR1 overexpression significantly promoted the proliferation of HUVECs, while BGJ398 (FGFR2 inhibitor) treatment completely attenuated this promotion (Figure 4B). Consistent result was also observed in EdU staining (Figure 4C). In conclusion, our results proved that knockdown of ADAR1 regulated cell apoptosis and permeability through inhibition of FGFR2.
 | Figure 4 The regulation of cell proliferation by ADAR1 was mediated by FGFR2. |
ADAR1 and FGFR2 regulated cell proliferation via activation of PI3K-Akt pathway
The PI3K pathway, activated by many survival factors, leads to the activation of Akt, an important player in survival signaling.17,18 Considering the importance of PI3K pathway, the regulation effect of ADAR1/FGFR2 on PI3K pathway was evaluated. The results showed that inhibition of ADAR1 decreased phosphorylation Akt as well as VEGF levels, which could be reversed by the following treatment of FGF2 (Figure 5A). Consistent results were also demonstrated by qPCR analysis of mRNA levels of Akt and VEGF (Figure 5B). Meanwhile, overexpression of ADAR1 with lenti-virus consequently promoted phosphorylated Akt and total VEGF expressions (Figure 5C). Interestingly, BGJ398 only reversed the upregulation of phosphorylation Akt and VEGF induced by ADAR1 overexpression but had no effects on FGFR2 protein level (Figure 5C). In conclusion, all these data proved that ADAR1 regulated cell proliferation and permeability via activation of PI3K-Akt pathway.
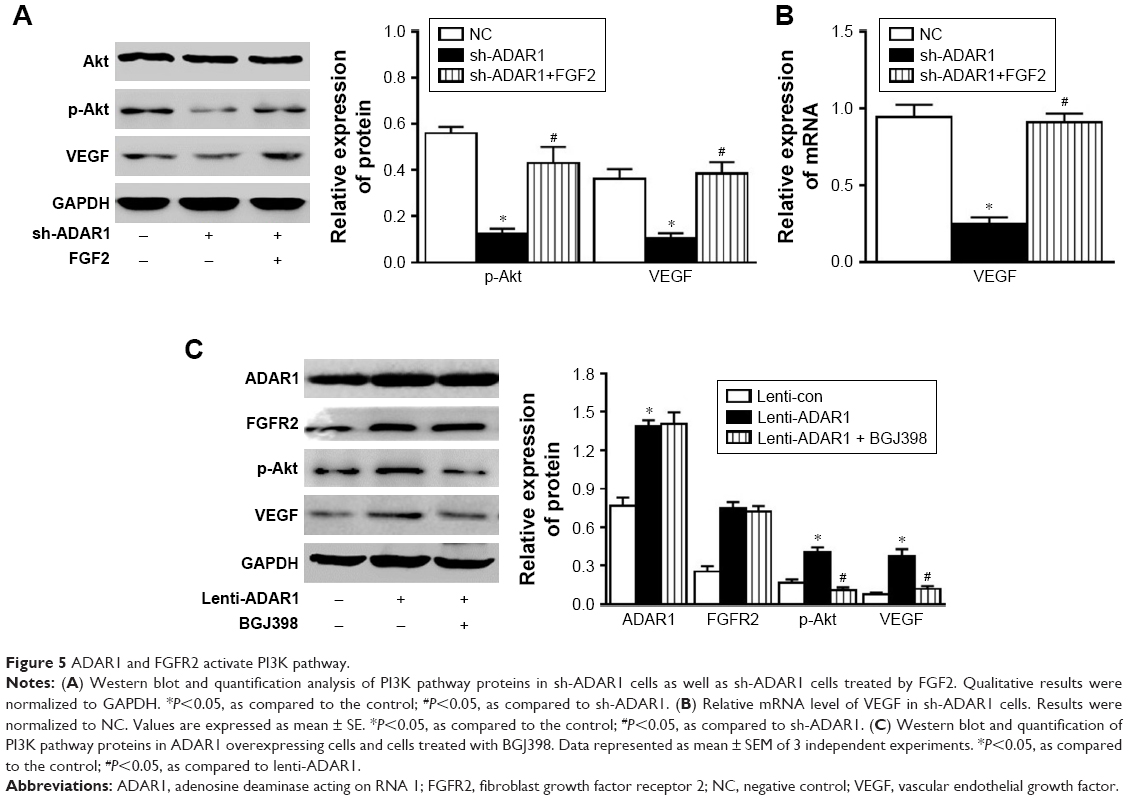 | Figure 5 ADAR1 and FGFR2 activate PI3K pathway. |
Discussion
ADAR1 functions as an RNA editing enzyme that catalyzes the deamination of A to I, which was shown to be essential in the regulation of tissue homeostasis.19,20 Loss-of-function mutation of ADAR1 in mice resulted in embryonic lethality at around E12 and in humans21 such mutation was linked with severe neuroimmune disease.22 Other studies showed the functional role of ADAR1 in the regulation of host defense against viral infection,23 tumor growth and metastasis, and maintenance of pluripotency of stem cells.24,25
It was reported that ADAR1 protects hepatocytes from damage caused by hypoxia. A dramatic increase in cell death was observed following hypoxia when ADAR1 expression was suppressed.26 Wang et al also reported that ADAR1−/− embryos must be a direct result of ADAR1 deletion due to hypoxia, since tissues observed with apoptosis corresponded exactly to the regions where ADAR1 was expressed at high level.7 However, the underlying mechanism of how ADAR1 regulated apoptosis was poorly understood. Toth et al reported that the anti-apoptotic activity of ADAR1 is achieved through suppressing pro-apoptotic and dsRNA-dependent activities, as exemplified by PKR and IRF-3.27 Sakurai et al showed that ADAR1p110 can be activated by stress-induced phosphorylation by MKK6-p38-MSK MAP kinases and translocated to the cytoplasm, and then ADAR1p110 can suppress apoptosis in stressed cells by competitively inhibiting the binding of Staufen1 to the 3-untranslated-region dsRNAs and antagonized Staufen1-mediated mRNA decay.28 Here, we investigated and extended the current knowledge on the mechanism of ADAR1-regulated cell apoptosis and proliferation.
In this report, we described a functional role of ADAR1 in regulation of human endothelial cell function. Silence of ADAR1 not only significantly induced apoptosis of HUVECs but also manifested a phenotype in which the angiogenic sprouting of HUVECs was significantly inhibited in a 2D vascular network formation assay. Next, we investigated the downstream effector of ADAR1. Previous reports have showed that FGFR2 played an important role in angiogenesis and endothelial cell migration and proliferation.14,29 Indeed, we found that ADAR1 knockdown decreased FGFR2 level. Manipulation of FGF signaling can also regulate the homeostasis of endothelial cell, regarding cell survival and hence cell function. Furthermore, FGF signaling can further active PI3K/Akt pathway.30 Meanwhile, FGF-2 was shown to induce VEGF expression in vascular endothelial cells, which was another key player in angiogenesis. Here we showed that silencing of ADAR1 decreased the phosphorylation level of Akt and protein level of VEGF, which well explained the phenotype we have found. With regard to the exact molecular mechanism of how ADAR1 regulates the level of these proteins, whether RNA editing is involved in this regulation process, further study is needed to investigate in the future.
Under hypoxia condition, we found ADAR1 expression was significantly increased, which was consistent with a recent report.31 And the downstream effectors were also increased accordingly, in an ADAR1-dependent manner. Again, these findings suggested ADAR1 was an important player in endothelial cell stress response and hence atherosclerosis.
In conclusion, our study for the first time described that ADAR1 regulated endothelial cell survival which was mediated by FGFR2 and may participate in PI3K/Akt pathway. These findings provide new insights into the biologic and therapeutic relevance of ADAR1 in atherosclerotic vascular disease development.
Availability of data and materials
The data sets used and/or analyzed during the current study are available from the corresponding author on reasonable request.
Acknowledgments
We thank the efforts of the staff from The Eighth People’s Hospital of Shanghai and Shanghai Weiang Info Tech Ltd. This research did not receive any specific grant from funding agencies in the public, commercial, or not-for-profit sectors.
Author contributions
All authors made substantial contributions to conception and design, acquisition of data, or analysis and interpretation of data; took part in drafting the article or revising it critically for important intellectual content; gave final approval of the version to be published; and agree to be accountable for all aspects of the work.
Disclosure
The authors report no conflicts of interest in this work.
References
George CX, John L, Samuel CE. An RNA editor, adenosine deaminase acting on double-stranded RNA (ADAR1). J Interferon Cytokine Res. 2014;34(6):437–446. | ||
Bass BL. RNA editing by adenosine deaminases that act on RNA. Annu Rev Biochem. 2002;71:817–846. | ||
Maas S, Rich A, Nishikura K. A-to-I RNA editing: recent news and residual mysteries. J Biol Chem. 2003;278(3):1391–1394. | ||
Seeburg PH, Hartner J. Regulation of ion channel/neurotransmitter receptor function by RNA editing. Curr Opin Neurobiol. 2003;13(3):279–283. | ||
Nishikura K. Editing the message from A to I. Nat Biotechnol. 2004;22(8):962–963. | ||
Nishikura K. Editor meets silencer: crosstalk between RNA editing and RNA interference. Nat Rev Mol Cell Biol. 2006;7(12):919–931. | ||
Wang Q, Miyakoda M, Yang W, et al. Stress-induced apoptosis associated with null mutation of ADAR1 RNA editing deaminase gene. J Biol Chem. 2004;279(6):4952–4961. | ||
Xufeng R, Boyer MJ, Shen H, et al. ADAR1 is required for hematopoietic progenitor cell survival via RNA editing. Proc Natl Acad Sci U S A. 2009;106(42):17763–17768. | ||
Martinez HD, Jasavala RJ, Hinkson I, et al. RNA editing of androgen receptor gene transcripts in prostate cancer cells. J Biol Chem. 2008;283(44):29938–29949. | ||
Laxminarayana D, Khan IU, O’Rourke KS, Giri B. Induction of 150-kDa adenosine deaminase that acts on RNA (ADAR)-1 gene expression in normal T lymphocytes by anti-CD3-epsilon and anti-CD28. Immunology. 2007;122(4):623–633. | ||
Bryckaert M, Guillonneau X, Hecquet C, Courtois Y, Mascarelli F. Both FGF1 and bcl-x synthesis are necessary for the reduction of apoptosis in retinal pigmented epithelial cells by FGF2: role of the extracellular signal-regulated kinase 2. Oncogene. 1999;18(52):7584–7593. | ||
Ben-Zvi M, Amariglio N, Paret G, Nevo-Caspi Y. F11R expression upon hypoxia is regulated by RNA editing. PLoS One. 2013;8(10):e77702. | ||
Carmeliet P, Dor Y, Herbert JM, et al. Role of HIF-1alpha in hypoxia-mediated apoptosis, cell proliferation and tumour angiogenesis. Nature. 1998;394(6692):485–490. | ||
Garmy-Susini B, Delmas E, Gourdy P, et al. Role of fibroblast growth factor-2 isoforms in the effect of estradiol on endothelial cell migration and proliferation. Circ Res. 2004;94(10):1301–1309. | ||
Greijer AE, van der Wall E. The role of hypoxia inducible factor 1 (HIF-1) in hypoxia induced apoptosis. J Clin Pathol. 2004;57(10):1009–1014. | ||
Wang Q, Zhang L, Yuan X, et al. The relationship between the Bcl-2/Bax proteins and the mitochondria-mediated apoptosis pathway in the differentiation of adipose-derived stromal cells into neurons. PLoS One. 2016;11(10):e0163327. | ||
Brumatti G, Salmanidis M, Ekert PG. Crossing paths: interactions between the cell death machinery and growth factor survival signals. Cell Mol Life Sci. 2010;67(10):1619–1630. | ||
Fuchs Y, Steller H. Programmed cell death in animal development and disease. Cell. 2011;147(4):742–758. | ||
Hartner JC, Schmittwolf C, Kispert A, Müller AM, Higuchi M, Seeburg PH. Liver disintegration in the mouse embryo caused by deficiency in the RNA-editing enzyme ADAR1. J Biol Chem. 2004;279(6):4894–4902. | ||
Hartner JC, Walkley CR, Lu J, Orkin SH. ADAR1 is essential for the maintenance of hematopoiesis and suppression of interferon signaling. Nat Immunol. 2009;10(1):109–115. | ||
Wang G, Wang H, Singh S, et al. ADAR1 Prevents liver injury from inflammation and suppresses interferon production in hepatocytes. Am J Pathol. 2015;185(12):3224–3237. | ||
Rice GI, Kasher PR, Forte GM, et al. Mutations in ADAR1 cause Aicardi-Goutières syndrome associated with a type I interferon signature. Nat Genet. 2012;44(11):1243–1248. | ||
Gandy SZ, Linnstaedt SD, Muralidhar S, Cashman KA, Rosenthal LJ, Casey JL. RNA editing of the human herpesvirus 8 kaposin transcript eliminates its transforming activity and is induced during lytic replication. J Virol. 2007;81(24):13544–13551. | ||
Dou N, Yu S, Ye X, Yang D, Li Y, Gao Y. Aberrant overexpression of ADAR1 promotes gastric cancer progression by activating mTOR/p70S6K signaling. Oncotarget. 2016;7(52):86161–86173. | ||
Katayama S, Shimoda K, Takenaga Y. Loss of ADAR1 in human iPS cells promotes caspase3-mediated apoptotic cell death. Genes Cells. 2015;20(8):675–680. | ||
Wang H, Wang G, Zhang L, et al. ADAR1 Suppresses the activation of cytosolic RNA-sensing signaling pathways to protect the liver from ischemia/reperfusion injury. Sci Rep. 2016;6:20248. | ||
Toth AM, Li Z, Cattaneo R, Samuel CE. RNA-specific adenosine deaminase ADAR1 suppresses measles virus-induced apoptosis and activation of protein kinase PKR. J Biol Chem. 2009;284(43):29350–29356. | ||
Sakurai M, Shiromoto Y, Ota H, et al. ADAR1 controls apoptosis of stressed cells by inhibiting Staufen1-mediated mRNA decay. Nat Struct Mol Biol. 2017;24(6):534–543. | ||
Bai Y, Bai L, Zhou J, Chen H, Zhang L. Sequential delivery of VEGF, FGF-2 and PDGF from the polymeric system enhance HUVECs angiogenesis in vitro and CAM angiogenesis. Cell Immunol. 2018;323:19–32. | ||
Fang X, Yang D, Luo H, et al. SNORD126 promotes HCC and CRC cell growth by activating the PI3K-AKT pathway through FGFR2. J Mol Cell Biol. 2017;9(3):243–255. | ||
Gurung HR, Carr MM, Bryant K, Chucair-Elliott AJ, Carr DJ. Fibroblast growth factor-2 drives and maintains progressive corneal neovascularization following HSV-1 infection. Mucosal Immunol. 2018;11(1):172–185. |
 © 2018 The Author(s). This work is published and licensed by Dove Medical Press Limited. The
full terms of this license are available at https://www.dovepress.com/terms
and incorporate the Creative Commons Attribution
- Non Commercial (unported, 3.0) License.
By accessing the work you hereby accept the Terms. Non-commercial uses of the work are permitted
without any further permission from Dove Medical Press Limited, provided the work is properly
attributed. For permission for commercial use of this work, please see paragraphs 4.2 and 5 of our Terms.
© 2018 The Author(s). This work is published and licensed by Dove Medical Press Limited. The
full terms of this license are available at https://www.dovepress.com/terms
and incorporate the Creative Commons Attribution
- Non Commercial (unported, 3.0) License.
By accessing the work you hereby accept the Terms. Non-commercial uses of the work are permitted
without any further permission from Dove Medical Press Limited, provided the work is properly
attributed. For permission for commercial use of this work, please see paragraphs 4.2 and 5 of our Terms.