Back to Journals » International Journal of General Medicine » Volume 14
Adapting Diabetes Risk Scores for Jordan
Authors Shdaifat AA ![]() , Khader Y
, Khader Y ![]() , Al Hyari M, Shatnawi O
, Al Hyari M, Shatnawi O ![]() , Banat M
, Banat M ![]()
Received 25 May 2021
Accepted for publication 21 July 2021
Published 28 July 2021 Volume 2021:14 Pages 4011—4016
DOI https://doi.org/10.2147/IJGM.S321063
Checked for plagiarism Yes
Review by Single anonymous peer review
Peer reviewer comments 2
Editor who approved publication: Dr Scott Fraser
Amjad Al Shdaifat,1 Yousef Khader,2 Muwafag Al Hyari,3 Omar Shatnawi,1 Mus’ab Banat1
1Department of Medicine and Family Medicine, Faculty of Medicine, Hashemite University, Zarqa, Jordan; 2Department of Public Health, Faculty of Medicine, Jordan University of Science and Technology, Irbid, Jordan; 3Center of Diabetes and Endocrinology, Prince Hamza Hospital, Diabetic Center, Amman, Jordan
Correspondence: Amjad Al Shdaifat
Faculty of Medicine, Hashemite University, Zarqa, Jordan
Tel +962775313022
Email [email protected]
Background: Diabetes risk score can be used as a simple non-invasive screening tool for identifying people with high risk of diabetes. This study aimed to assess the predictive power of various risk-scoring systems to predict pre-diabetes and diabetes in Jordanian adults.
Methods: This cross-sectional study was conducted among people attending 54 primary health care centers distributed throughout the 12 governorates of Jordan. Diabetes risk scores using the American Diabetes Association risk score, Canadian risk score, Finland risk score (FINDRISC), British Risk score, German and Australian risk score were calculated for each patient. Fasting blood sugar (FBS) was measured for all participants.
Results: This study included 392 participants: 231 patients with normal fasting blood sugar (FBG), 101 patients with pre-diabetes and 60 patients with type 2 diabetes. The FINDRISC, British, and Australian risk scores were strongly inter-correlated and weakly correlated with other systems’ risk scores. Moreover, they correlated moderately and significantly with FBS. In contrast, other systems risk scores were associated weekly with FBS. Based on receiving operating characteristics (ROC) analysis and multivariate logistic regression, the FINDRISC risk score was superior to other risk scores to predict high FBS and identify pre-diabetes and diabetes.
Conclusion: FINDRISC risk score performed the best compared to other risk scores for predicting pre-diabetes, diabetes, and absence of diabetes. We recommend using the FINDRISC risk score assessment in Jordan.
Keywords: diabetes, Jordan, Canadian risk score, FINDRISC risk score, German risk score, ADA risk score
Introduction
Type 2 diabetes mellitus (T2DM) is a metabolic disease associated with increased morbidity and mortality mainly because of increased cardiovascular risk.1,2 The overall age-standardized prevalence rate of diabetes increased from 13.0% in 1994 to 17.1% in 2004, 22.2% in 2009 and 23.7% in 2017.3,4 There are many risk factors for developing diabetes. The impact of each of these risk factors differs from nation to nation depending on various variables, including ethnicity, age, sex, family history, sedentary lifestyle, type of food, smoking, coffee consumption, and other factors.5
Various risk scores to predict diabetes were developed worldwide. The most common risk scores include the American Diabetes Association risk score, Canadian risk score, Finland risk score (FINDRISC), British risk score, German and Australian risk score.6–11 A strong argument exists in favor of screening for subjects who are at increased risk for diabetes. Screening helps recognize people at high risk for diabetes as well as patients with undiagnosed diabetes. Those people need lifestyle modification including adequate physical activity and healthy diet consumption to prevent or delay diabetes and its complications.6
As the prevalence of diabetes increases in the Middle East and Jordan, it is imperative either to create a new Jordanian risk score or adopt the most suitable international risk score to predict DM for use in Jordan. Risk scores can be used as a simple non-invasive screening tool for diabetes in order to find high-risk individuals who can then take protective measures to prevent or delay DM by improving modifiable risk factors and arranging to for regular blood glucose testing.12 This study aimed to assess the predictive power of various risk-scoring systems to predict pre-diabetes and diabetes in Jordanian adults.
Materials and Methods
Study Setting and Participants
This cross-sectional study was conducted among people attending 54 primary health care centers distributed throughout the 12 governorates of Jordan. Centers were selected randomly using simple random sampling technique. Within each center, participants who met the inclusion criteria were recruited consecutively. Those who agreed to participate were informed about the purpose of the study and signed the informed consent. Only adults above 18 years old were included in this study. Known cases of diabetes or females with a history of gestational diabetes were excluded.
The study was approved by the institutional review board (IRB) committee at Hashemite University. And all participants were informed about the purpose of the study, and that it was conducted in accordance with the Declaration of Helsinki.
Data Collection
Data collection took 3 months from mid June 2019 to mid-September 2019.
We selected the most commonly used risk scores for diabetes in the world for use in our study: American Diabetes Association risk score, Canadian risk score, Finland risk score (FINDRISC), British Risk score, German and Australian risk score. For each patient, a risk score was calculated by each method.
A structured questionnaire was used to collect the data including demographic data. After completing the questionnaire, each participant had their height measured to the nearest 1 cm with participants standing without shoes using a wall-fixed scaled meter. The weight was measured to the nearest 1 kg with minimal clothing and without shoes using a portable electronic scale.
Blood Tests
All participants had their fasting blood sugar measured either on the same day of visit or the next day. If the patient was not fasting and could not return the next day, they were excluded from the study. A second confirmatory test was done for those with high reading (≥126) to confirm diagnoses.
Statistical Analysis
Statistical analysis was conducted with IBM SPSS 24 (IBM Corp. Released 2016. IBM SPSS Statistics for Windows, Version 24.0. Armonk, NY: IBM Corp.). Mean and standard deviation were used to describe continuous variables. Frequencies and percentages were used to describe categorical variables. Participants were categorized into three groups according to their FBS levels: Normal, prediabetes, and diabetes. The participants’ characteristics were compared among groups using Chi-square test. The differences in the mean risk scores of different systems were compared using One Way ANOVA. The normality assumption was checked graphically using the histogram. The proportions of participants with high-risk scores according to different scoring systems were compared between the three groups using Chi-square test. Pearson’s correlation coefficient was used to assess the correlation between scores of studied scoring systems. Area Under Curve (AUC) was calculated for each scoring system using Receiving Operating Characteristics (ROC) curve to assess the predictability of high-risk score to predict FBG>100, prediabetes, and diabetes. AUC 0.7 to 0.8 is considered acceptable, 0.8 to 0.9 is considered excellent, and more than 0.9 is considered outstanding. Separate binary logistic regression models were conducted to determine the association between high-risk scores of different scoring systems (independent variables) and the studies outcomes including FBG>100, prediabetes, and diabetes (dependent variables). The sensitivity, specificity, predictive value positive, predictive value negative and accuracy of high-risk scores of different scoring systems were calculated for the FBS>100, pre-diabetes, and diabetes. A p-value of 0.05 or less was considered to indicate statistical significance.
Results
This study included 392 participants. Of those, 231 persons had normal FBG, 101 persons had pre-diabetes, and 60 persons had type 2 diabetes mellitus. More than half of participants (57.9%) were females, 50.3% aged more than 40 year, and 65.6% were either overweight or obese. Table 1 shows the demographic and anthropometric characteristics of participants according to diabetes status. The distribution of sex, age, and BMI differed significantly between people according to FBS categories.
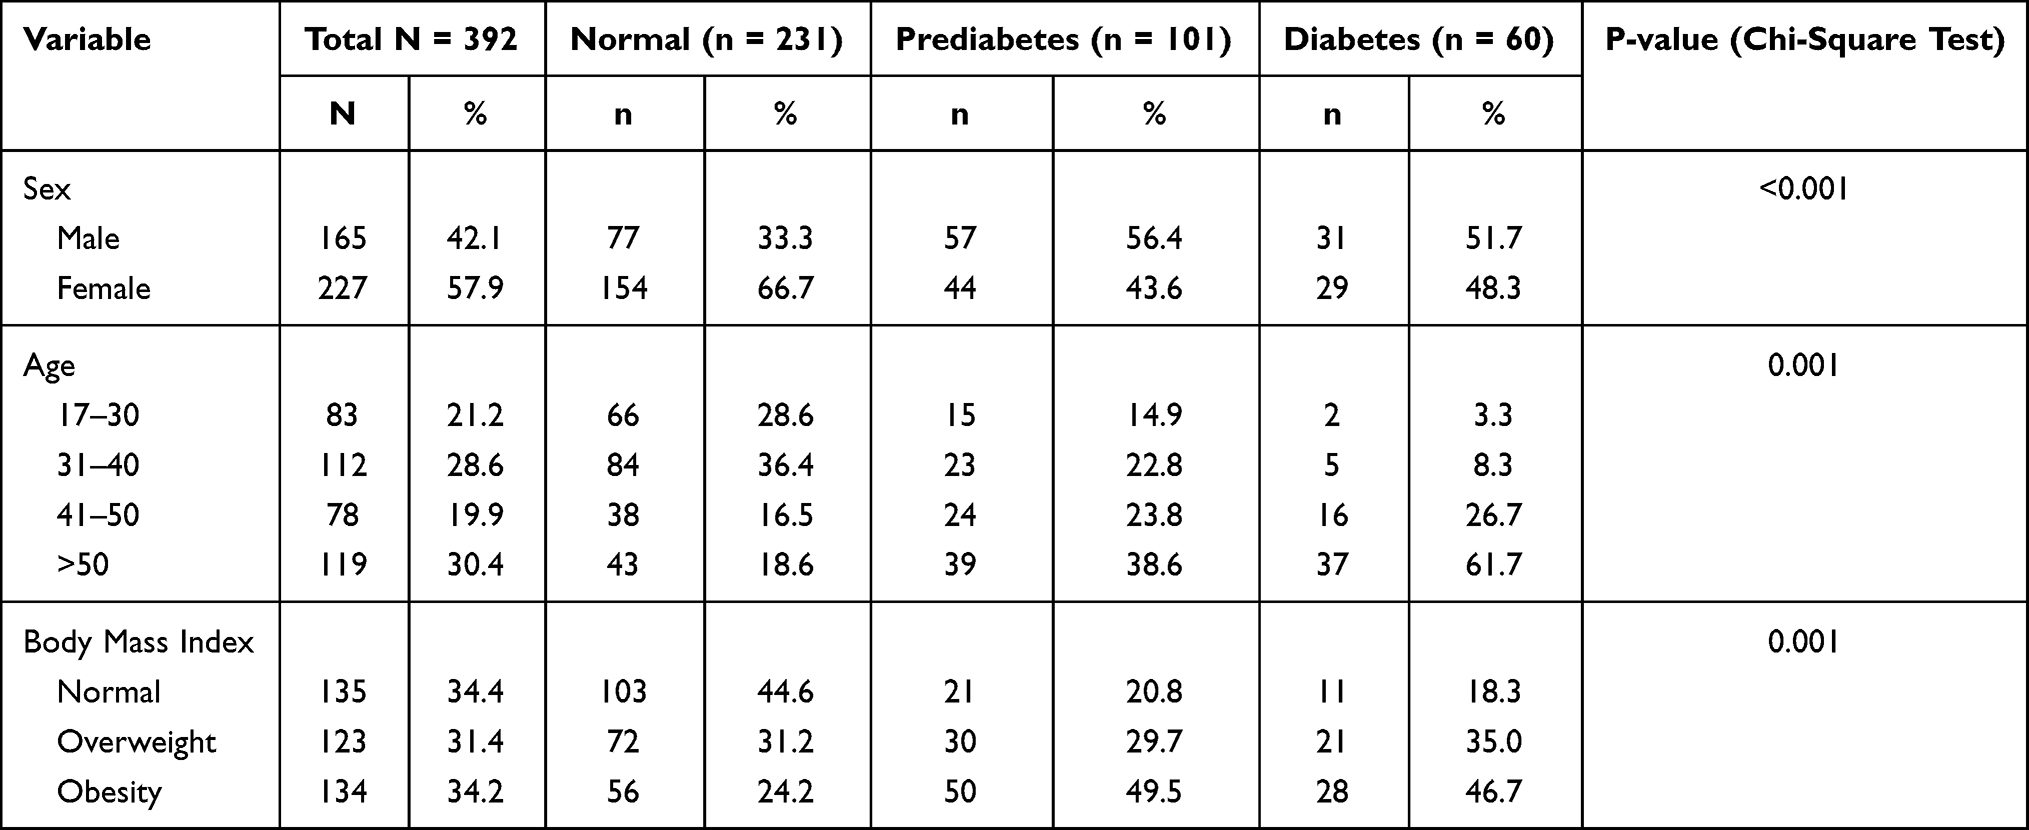 |
Table 1 Shows the Demographic and Anthropometric Characteristics of Participants According to Diabetes Status |
The FINDRISC, British, and Australian risk scores were strongly inter-correlated and weakly correlated with other systems’ risk scores (Table 2). The FINDRISC, British, and Australian risk scores correlated moderately and significantly with FBS. In contrast, other systems risk scores were associated weekly with FBS.
 |
Table 2 Inter-Correlations Between Different Risk Score Systems and Their Correlation with Fasting Blood Sugar |
Table 3 shows the mean risk score using different scoring systems according to diabetes status. The means of risk score for FINDRISC, British, Australian, and Canadian scoring systems were significantly higher among patients with pre-diabetes and patients with type 2 diabetes. The mean risk score using the German scoring system was the highest among people with normal FBG. According to the FINDRISC, British, and Australian risk score, the proportion of participants with high-risk scores was significantly higher among patients with prediabetes and patients with type 2 diabetes than those with normal FBG (Table 4).
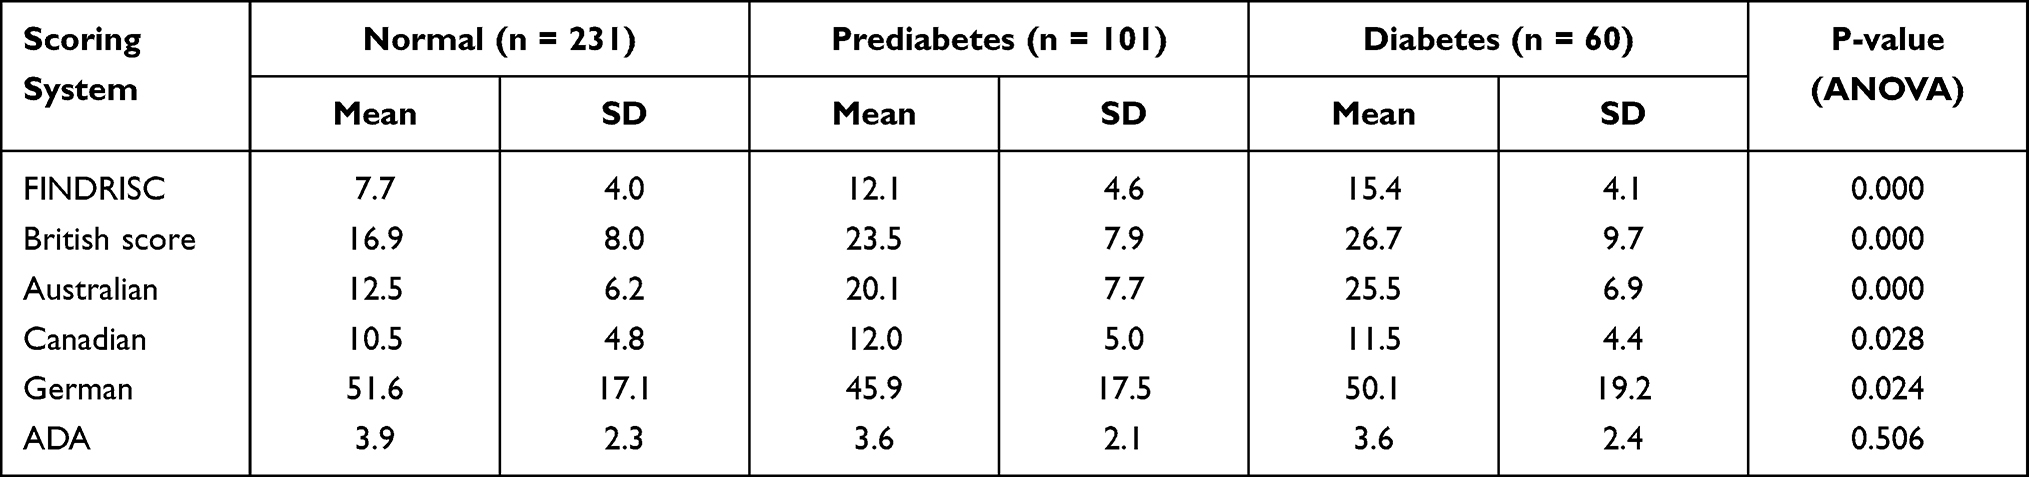 |
Table 3 The Differences in Risk Scores According to Diabetes Status |
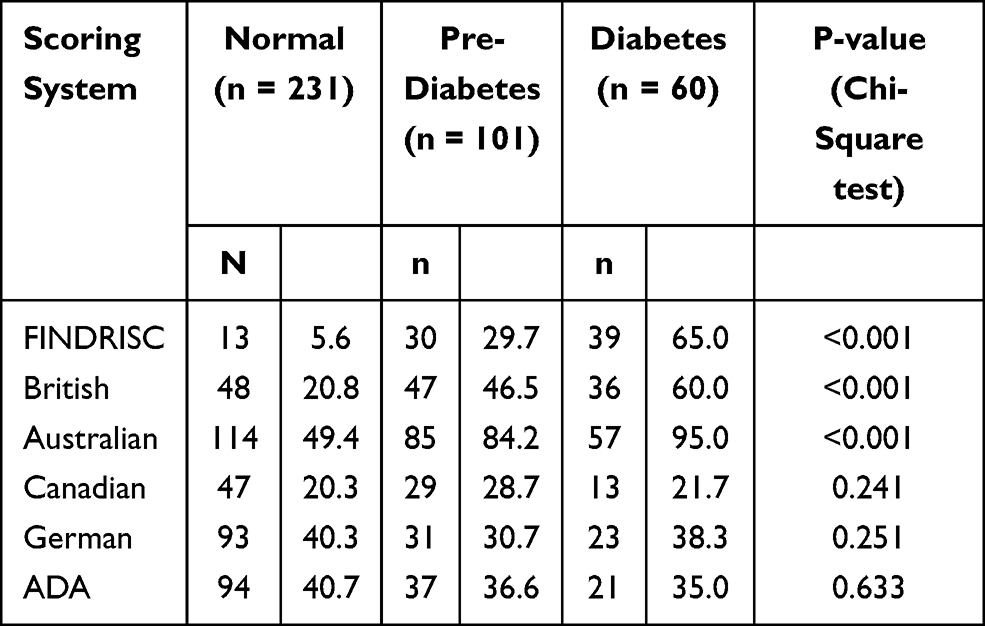 |
Table 4 The Proportion of Participants with High Risk Scores According to Diabetes Status |
According to AUC, the FINDRISC risk score and Australian risk score performance were excellent for predicting FBG>100 and diabetes and acceptable for predicting pre-diabetes (Table 5). The British risk score’s performance to predict FBG>100, pre-diabetes, and diabetes was acceptable The predictability power of other scoring systems was less than adequate.
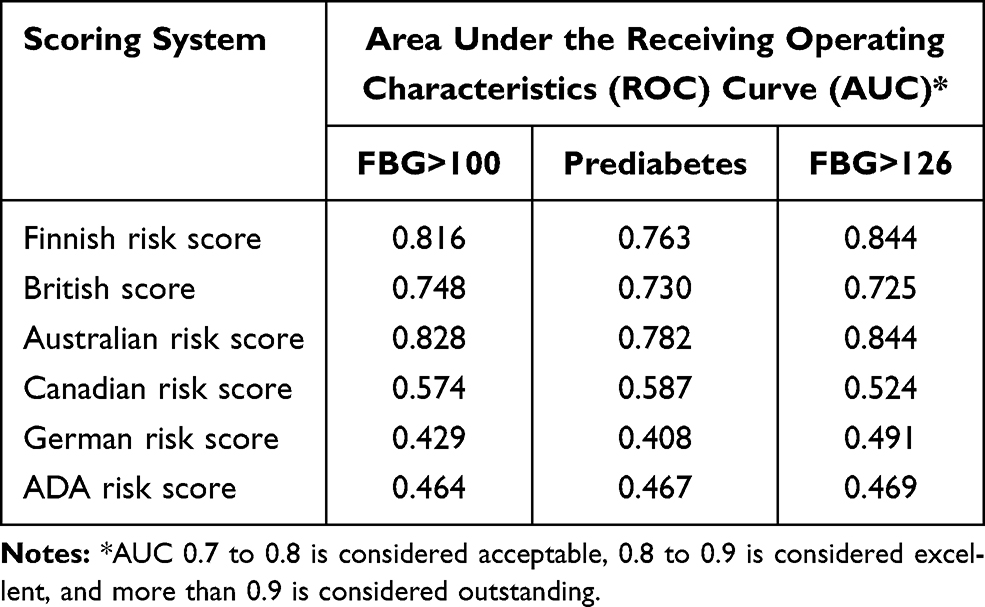 |
Table 5 The Predictability of High Risk Score Using Different Scoring System to Predict FBG>100, Pre-Diabetes, and Diabetes Using Receiving Operating Characteristics (ROC) |
In the multivariate analysis, only the high-risk scores using FINDRISC, British, and Australian scoring systems were significantly associated with FBS>100, pre-diabetes, and diabetes. According to odds ratios, the FINDRISC high-risk score is superior to other systems’ high-risk scores to predict pre-diabetes and diabetes. The sensitivity, specificity, predictive value positive, predictive value negative and accuracy of high-risk scores of different scoring systems to predict FGS>100, pre-diabetes, and diabetes are shown in Table 6.
 |
Table 6 The Predictability of High Risk Score Using Different Scoring System to Predict FBG>100, Pre-Diabetes, and Diabetes Using Binary Logistic Regression Analysis* |
Discussion
Recent studies have shown that type 2 diabetes can be prevented in high-risk subjects with impaired glucose tolerance by lifestyle interventions.13,14 Measuring diabetes scores is both simple and important. Several trials showed that a healthy lifestyle with weight loss and physical activity (PA) decreases short and long-term risk for individuals with impaired glucose tolerance.14,15
There are many validated risk scores for diabetes worldwide. The risk for diabetes differs from one country to another according to lifestyle, type of food, exercise, and ethnicity. For this reason, each country must have developed its own risk score or at least find the best risk score for its population.
This is the first study in Jordan to assess diabetes risk scores in Jordan. This study highlights the magnitude of the problem since diabetes is increasing dramatically. Because of the COVID-19 pandemic, it is expected that the prevalence of NCD will increase due to lockdowns, closure of sports clubs, and limitation of movements.5,16
Our study utilized many popular risk scores for non-diabetic patients. Blood sugar was measured for these patients and compared with the risk scores calculated in order to find which risk score best predicted increased blood sugar.
The results showed that 15.3% of the patients had previously undiagnosed diabetes and 25% had prediabetes. This emphasizes the need for risk score measurement for all health center visitors and blood sugar measurement for high-risk individuals according to risk score screening.
The study statistics showed that the FINDRISC risk score is the best score for predicting prediabetes and diabetes. Therefore, we recommend using the FINDRISC risk score in Jordan in all health centers to screen for diabetes. Furthermore, all screened individuals with high and very high risk should have a fasting blood sugar test performed. This result corresponds with many studies that showed the superiority of FINDRISC risk score in many countries.
The main limitation of this study is inherited in its cross-sectional design. A longitude study would be more appropriate to assess the predictability of different risk scores.
Conclusion
FINDRISC risk score performed the best compared to other risk scores for predicting prediabetes, diabetes, and absence of diabetes. We recommend using the FINDRISC risk score assessment in Jordan.
Declaration of Consent
The authors declare that they have obtained all patient consent.
Disclosure
The authors declare that they have no conflicts of interest.
References
1. Greenland P, Knoll MD, Stamler J, et al. Major risk factors as antecedents of fatal and nonfatal coronary heart disease events. JAMA. 2003;290(7):891–897. doi:10.1001/jama.290.7.891
2. Haffner SM, Lehto S, Rönnemaa T, Pyörälä K, Laakso M. Mortality from coronary heart disease in subjects with type 2 diabetes and in nondiabetic subjects with and without prior myocardial infarction. N Engl J Med. 1998;339(4):229–234. doi:10.1056/NEJM199807233390404
3. Awad SF, Huangfu P, Dargham SR, et al. Characterizing the type 2 diabetes mellitus epidemic in Jordan up to 2050. Sci Rep. 2020;10(1):21001. doi:10.1038/s41598-020-77970-7
4. Ajlouni K, Batieha A, Jaddou H, et al. Time trends in diabetes mellitus in Jordan between 1994 and 2017. Diabet Med. 2019;36(9):1176–1182. doi:10.1111/dme.13894
5. Tuomilehto J, Lindström J, Eriksson JG, et al.; Finnish Diabetes Prevention Study Group. Prevention of type 2 diabetes mellitus by changes in lifestyle among subjects with impaired glucose tolerance. N Engl J Med. 2001;344(18):1343–1350. doi:10.1056/NEJM200105033441801
6. American Diabetes Association (ADA) Risk Calculator. American Diabetes Association (ADA) risk calculator [Internet]; [cited February 3, 2021]. Available from: https://www.mdcalc.com/american-diabetes-association-ada-risk-calculator.
7. Public Health Agency of Canada. The Canadian diabetes risk questionnaire: CANRISK.
8. FINDRISC. FINDRISC (Finnish diabetes risk score) [Internet]; [cited February 3, 2021]. Available from: https://www.mdcalc.com/findrisc-finnish-diabetes-risk-score?__cf_chl_captcha_tk__=7292cf59fe8b5f1408a3e2633ec37dc8f1c06a88-1614700160-0-ATMOyUsKgOuS7-J2y6nqQBftW7u-307PqbgqXiESz8vSTnboWogYesWmJLG7o3Y0Ll43k43ymFGlAreWhw15n-Xa4y-zU3Ukb7k26FRArBi4uLxBC1SRY44.
9. Diabetes UK. Diabetes UK score system [Internet]; [cited February 3, 2021]. Available from: https://riskscore.diabetes.org.uk/start.
10. Mühlenbruch K, Ludwig T, Jeppesen C, et al. Update of the German diabetes risk score and external validation in the German MONICA/KORA study. Diabetes Res Clin Pract. 2014;104(3):459–466. doi:10.1016/j.diabres.2014.03.013
11. The Australian Type 2 Diabetes Risk Assessment Tool (AUSDRISK). Australian government department of health [Internet]; [cited April 18, 2021]. Available from: https://www.health.gov.au/resources/apps-and-tools/the-australian-type-2-diabetes-risk-assessment-tool-ausdrisk
12. Al-Shudifat A-E, Al-Shdaifat A, Al-Abdouh AA, et al. Diabetes risk score in a young student population in Jordan: a cross-sectional study. J Diabetes Res. 2017;2017:1–5. doi:10.1155/2017/8290710
13. Pan X-R, Li G, Hu Y-H, et al. Effects of diet and exercise in preventing NIDDM in people with impaired glucose tolerance: the Da Qing IGT and Diabetes Study. Diabetes Care. 1997;20(4):537–544. doi:10.2337/diacare.20.4.537
14. Group DPPR. Long-term effects of lifestyle intervention or metformin on diabetes development and microvascular complications over 15-year follow-up: the Diabetes Prevention Program Outcomes Study. Lancet Diabetes Endocrinol. 2015;3(11):866–875. doi:10.1016/S2213-8587(15)00291-0
15. Knowler WC, Barrett-Connor E, Fowler SF, et al. Diabetes Prevention Program Research Group Reduction in the incidence of type 2 diabetes with lifestyle intervention or metformin. N Engl J Med. 2002;346:393–403.
16. Hartmann-Boyce J, Morris E, Goyder C, et al. Diabetes and COVID-19: risks, management, and learnings from other national disasters. Diabetes Care. 2020;43(8):1695–1703. doi:10.2337/dc20-1192
 © 2021 The Author(s). This work is published and licensed by Dove Medical Press Limited. The
full terms of this license are available at https://www.dovepress.com/terms
and incorporate the Creative Commons Attribution
- Non Commercial (unported, 3.0) License.
By accessing the work you hereby accept the Terms. Non-commercial uses of the work are permitted
without any further permission from Dove Medical Press Limited, provided the work is properly
attributed. For permission for commercial use of this work, please see paragraphs 4.2 and 5 of our Terms.
© 2021 The Author(s). This work is published and licensed by Dove Medical Press Limited. The
full terms of this license are available at https://www.dovepress.com/terms
and incorporate the Creative Commons Attribution
- Non Commercial (unported, 3.0) License.
By accessing the work you hereby accept the Terms. Non-commercial uses of the work are permitted
without any further permission from Dove Medical Press Limited, provided the work is properly
attributed. For permission for commercial use of this work, please see paragraphs 4.2 and 5 of our Terms.