Back to Journals » Medical Devices: Evidence and Research » Volume 15
Acquisition and Classification of Lung Sounds for Improving the Efficacy of Auscultation Diagnosis of Pulmonary Diseases
Authors Abera Tessema B ![]() , Daba Nemomssa H
, Daba Nemomssa H ![]() , Lamesgin Simegn G
, Lamesgin Simegn G
Received 14 February 2022
Accepted for publication 25 March 2022
Published 7 April 2022 Volume 2022:15 Pages 89—102
DOI https://doi.org/10.2147/MDER.S362407
Checked for plagiarism Yes
Review by Single anonymous peer review
Peer reviewer comments 2
Editor who approved publication: Dr Scott Fraser
Biruk Abera Tessema,1,2 Hundessa Daba Nemomssa,1 Gizeaddis Lamesgin Simegn1
1School of Biomedical Engineering, Jimma Institute of Technology, Jimma University, Jimma, Ethiopia; 2School of Medicine, Haramaya University College of Health and Medical Sciences, Haramaya University, Harar, Ethiopia
Correspondence: Hundessa Daba Nemomssa, Tel +251913763777, Email [email protected]
Purpose: Lung diseases are the third leading cause of death worldwide. Stethoscope-based auscultation is the most commonly used, non-invasive, inexpensive, and primary diagnostic approach for assessing lung conditions. However, the manual auscultation-based diagnosis procedure is prone to error, and its accuracy is dependent on the physician’s experience and hearing capacity. Moreover, the stethoscope recording is vulnerable to different noises that can mask the important features of lung sounds which may lead to misdiagnosis. In this paper, a method for the acquisition of lung sound signals and classification of the top 7 lung diseases has been proposed for improving the efficacy of auscultation diagnosis of pulmonary disease.
Methods: An electronic stethoscope has been constructed for signal acquisition. Lung sound signals were then collected from people with COPD, upper respiratory tract infections (URTI), lower respiratory tract infections (LRTI), pneumonia, bronchiectasis, bronchiolitis, asthma, and healthy people. Lung sounds were analyzed using a wavelet multiresolution analysis. To choose the most relevant features, feature selection using one-way ANOVA was performed. The classification accuracy of various machine learning classifiers was compared, and the Fine Gaussian SVM was chosen for final classification due to its superior performance. Model optimization was accomplished through the application of Bayesian optimization techniques.
Results: A test classification accuracy of 99%, specificity of 99.2%, and sensitivity of 99.04%, have been achieved for the 7 lung diseases using the optimized Fine Gaussian SVM classifier.
Conclusion: Our experimental results demonstrate that the proposed method has the potential to be used as a decision support system for the classification of lung diseases, especially in those areas where the expertise and the means are limited.
Keywords: auscultation, classification, denoising, discrete wavelet transform, feature extraction, lung diseases, lung sounds
Introduction
Lungs, the principal organs of the human respiratory system, can be affected by a variety of disorders. Chronic obstructive pulmonary disease (COPD), asthma, pneumonia, upper respiratory tract infection (URTI), lower respiratory tract infection (LRTI), bronchiectasis, bronchiolitis, and other disorders are examples. COPD is a common chronic inflammatory lung disease that is primarily caused by smoking.1–3 It causes breathing difficulty, cough, production of mucus (sputum), and wheezing.2,3 These symptoms are also common in asthma disease,4 which is another most common and widespread lung diseases that is associated with airway obstruction in the lungs.4–6 It causes recurrent episodes of wheezing, breathlessness, chest tightness, and coughing, particularly at night or early in the morning.5 Pneumonia is an infection that can be caused by bacteria, viruses, and fungi and inflames the air sacs called alveoli in one or both lungs.7 It causes coughing that may cause mucus production, fever, chest pain, and shortness of breath. An upper respiratory tract infection (URTI) is a respiratory illness that occurs commonly in both children and adults and is a major cause of mild morbidity.8 It is caused by several families of viruses, such as rhinovirus, coronavirus, parainfluenza, respiratory syncytial virus (RSV), adenovirus, human metapneumovirus, influenza, enterovirus, and the recently discovered bocavirus.8 URTIs affect the upper respiratory tract, including the nose, sinuses, pharynx, or larynx.9,10 LRTI symptoms, on the other hand, vary and depend on the severity of the infection, and it is the leading cause of pediatric mortality and morbidity in low and middle-income countries.10 The less severe infections can have the same symptoms as bronchiolitis or bronchiectasis. Bronchiectasis is a long-term condition where the airways of the lungs become abnormally widened.11 It can make the lungs more vulnerable to infection, resulting in a build-up of excess mucus. It causes a persistent cough which usually brings up phlegm (sputum), and breathlessness. Bronchiolitis is also a common lung infection among infants that occurs when small breathing tubes (bronchioles) become infected.
There are several clinical options for diagnosing pulmonary diseases. For the diagnosis of pulmonary problems, imaging modalities such as chest x-rays, CT scans, and magnetic resonance imaging (MRI) are employed. In contrast, the risk of repeated doses of harmful radiation, the cost of machines, and the inconvenience of deploying them in remote regions are only a few of the challenges of adopting imaging modalities, particularly for many third-world patients. Spirometers are also commonly used to measure the volume of inspired and expired air by the lungs, as well as to detect abnormal ventilation patterns. However, a spirometer requires a skilled operator, is expensive, ineffective at detecting obstructive-restrictive defects, and necessitates a large number of patient breathing motions and forceful breathing.12 An arterial blood gas analyzer (ABG) can also be used to assess lung problems using arterial blood gas exchange (pO2 and pCO2).13 However, the ABG test is expensive and requires an invasive procedure.
Despite rapid and continual technological advancements in the field of chest disease detection, auscultation remains the most widely used and indispensable lung disease diagnostic tool.14 Lung sounds, which are collected using a stethoscope, are key indicators of respiratory health and diseases. They provide vital information regarding the health of the lungs.15,16 A stethoscope is a handy, easy, low-cost and completely non-invasive diagnostic tool used to identify lung disorders based on lung sounds. On the other hand, auscultation with a stethoscope gives a limited and subjective perception of respiratory sounds. Subjectivity leads to discrepancies in the interpretation of lung sounds by various medical experts. Subjectivity and inconsistency are caused by the physician’s hearing capability, experience, and ability to distinguish and define various sound patterns. Furthermore, the stethoscope recording is highly susceptible to noise. Noise signals mask crucial characteristics of lung sound signals, thus leading to incorrect diagnosis of lung diseases.
To overcome the constraints of the manual diagnosis technique, many machine learning and deep learning approaches for automatic classification of lung disease based on lung sound signals have been developed in various literatures.12,17–22 For instance, Islam et al,12 proposed a Welch spectral method for estimation of power spectral density (PSD) of lung sounds and a support vector machine (SVM) for classification of lung diseases as normal, asthma, and COPD claiming an accuracy of 93.3%. Similarly, Haider et al,20 proposed a respiratory sound-based classification of pulmonary diseases as normal or COPD using SVM and an accuracy of 83.6% was reported. Convolutional neural network (CNN) and deep neural network (DNN) techniques have been also proposed in the literature for the classification of lung abnormalities.15,23 Demir et al,15 employed a CNN-based approach for the classification of lung diseases (crackles, crackles combined with wheezes, wheezes, and normal) and an accuracy of 63.09% was reported using spectrogram images. Likewise, Quan et al,23 performed classification of asthma severity using DNN to classify asthma severity, achieving a maximum classification accuracy of 91.1%.
However, the majority of these and other approaches proposed for lung disease classification are either designed for specific or limited lung disease classification, are less accurate, or use the exclusive time or frequency domain analysis technique, which is inefficient for analysis of non-stationary lung sound signals. This study presents the design and construction of an electronic stethoscope for effective lung sound signal acquisition, as well as a multiresolution signal analysis technique for multi-classification of the most common lung disorders using a machine learning approach.
Materials and Methods
The general procedure used in this study for the classification of pulmonary diseases using lung sound signals is demonstrated in Figure 1. These methods involve the design and construction of an electronic stethoscope, data acquisition, data pre-processing, feature extraction, feature selection, feature visualization and normalization, data splitting, model training and evaluation, model optimization, and multi-class classification.
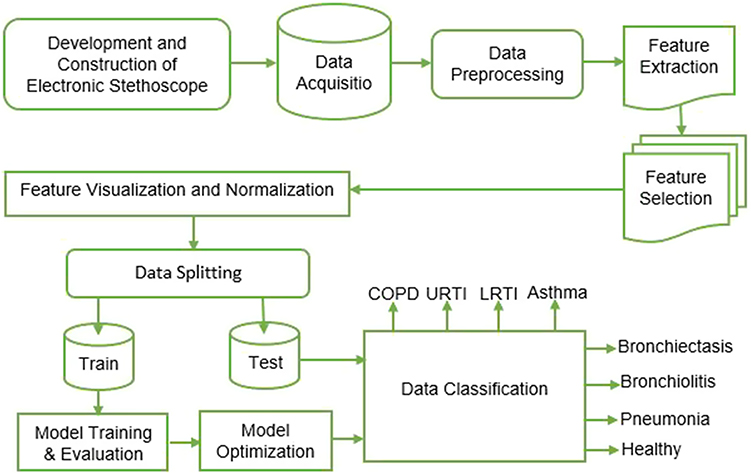 |
Figure 1 A Proposed procedure for analysis of lungs sounds and classification of lung diseases. |
Design and Construction of Electronic Stethoscope
Constructing an electronic stethoscope by modifying an acoustic stethoscope necessitates the use of a transduction device to transform acoustic waves into comparable electrical signals. A dependable, cost-effective, and lightweight condenser microphone with a consistent frequency response (working frequency range of 20 Hz to 16 KHz and a high (> 62 dB) signal to noise ratio (SNR) was chosen and installed onto the stethoscope head for this purpose. The sensor (microphone) was chosen in accordance with the recommendations of the computerized respiratory sound analysis (CORSA) specification.24 The materials used for the construction of the electronic stethoscope include head of traditional stethoscope, medical grade tubing, condenser microphone, audio cable and computer installed with audacity software (audacity 2.4.2) (Figure 2)
 |
Figure 2 An electronic stethoscope for acquisition of lung sounds. |
Data Acquisition
Lungs’ sound data was collected using the constructed electronic stethoscope from the Pulmonology Unit at Jimma University Medical Center (JUMC). Each record was obtained from a clinically hospitalized patient with a different chest location, such as the left and right anterior, left and right posterior, and left and right lateral areas of the chest wall. The data was collected from nine asthmatic patients, six bronchiectasis patients, four pneumonia patients, three URTI patients, six bronchiolitis patients, seven LRTI patients, six COPD patients, and six healthy participants. A total of 60 asthma, 49 bronchiectasis, 23 pneumonia, 15 URTI, 47 bronchiolitis, 48 LRTI, 30 healthy, and 15 COPD lung sound signals were gathered from these patients. In addition, we incorporated annotated lung sound recordings from the International Conference on Biomedical and Health Informatics (ICBHI) respiratory sound dataset (10 asthma, 16 bronchiectasis, 37 pneumonia, 45 URTI, 13 bronchiolitis, 2 LRTI, 45 healthy, and 45 COPD). In total, 500 lung sound signals (287 from JUMC and 213 from the online dataset), including 75 healthy, 70 asthmatic, 60 pneumonia, 60 URTI, 50 LRTI, 60 COPD, 65 bronchiectasis, and 60 bronchiolitis lung sound recordings, were evaluated and used for machine learning model training. For data uniformity, only lung sound signals that were acquired using a single channel stethoscope were selected from the ICBHI database. In addition, all the local lung sound records were acquired (local records) or resampled (public datasets) with the sampling rate of 44.1KHz and 16 bit-depths of analog to digital (A/D) conversion. Table 1 demonstrates the demographic information of self-collected (local) and online lung sounds.
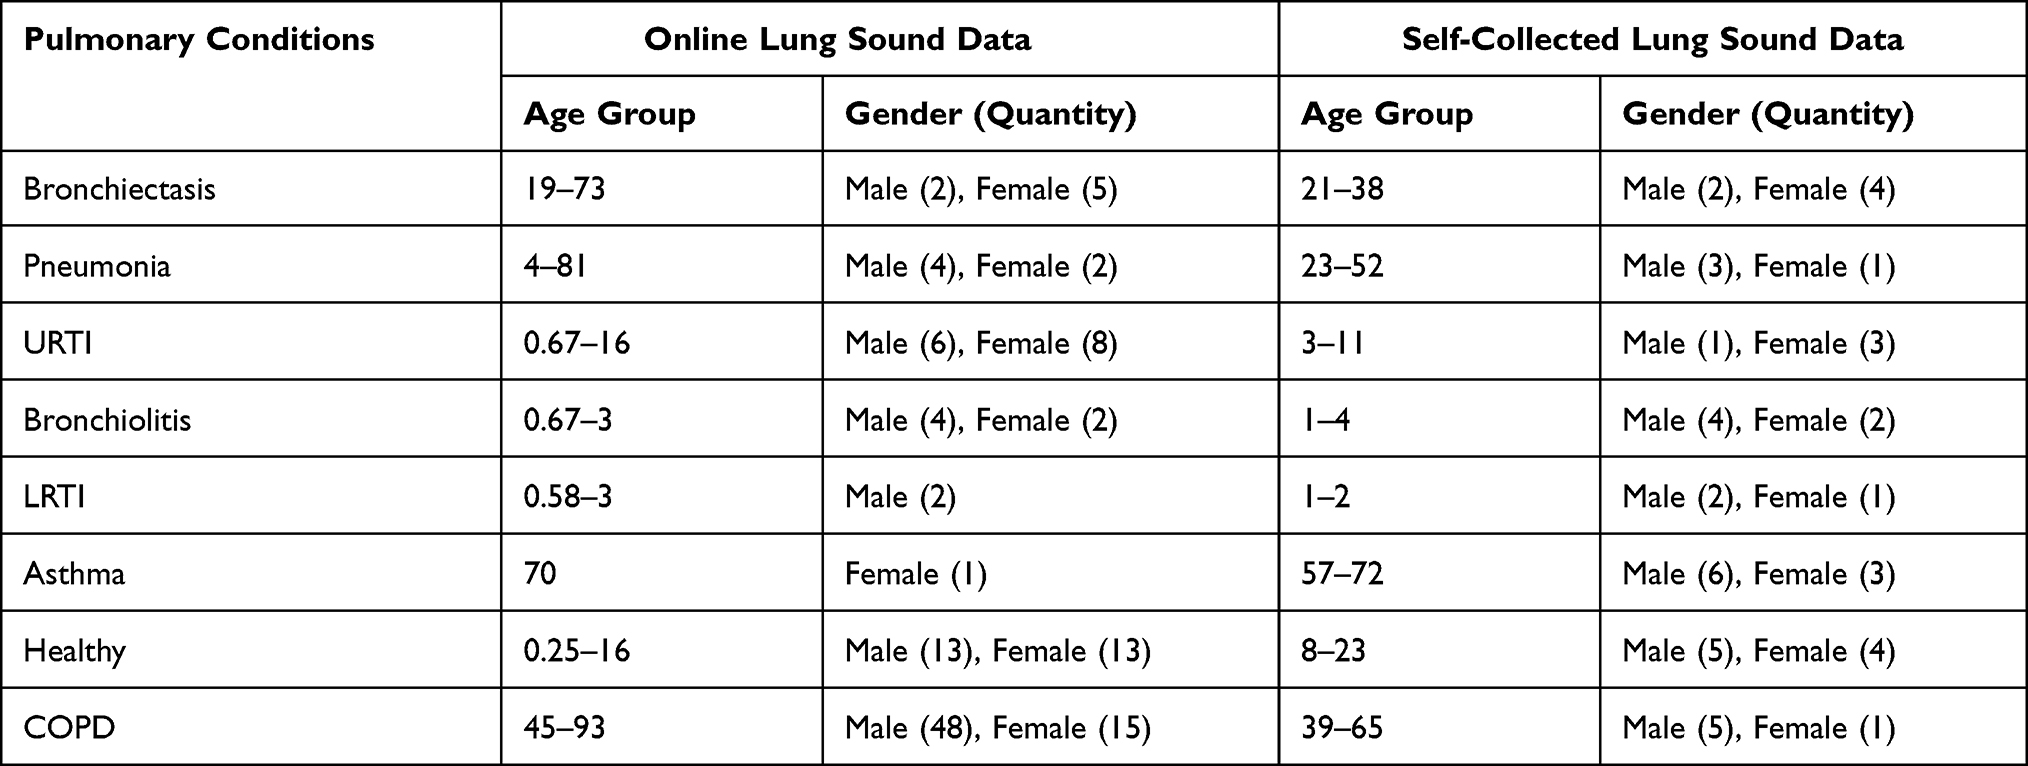 |
Table 1 Demographic Information of Self-Collected and Online Lung Sound Data |
Data Pre-Processing
Wavelet-based denoising techniques were employed to denoise the signals without affecting essential aspects of the lung sounds. The discrete wavelet transform (DWT) is a time-frequency signal analysis approach that provides good localization in both the time and frequency domains. DWT was used to denoise lung sound signals in three steps: decomposition, detail coefficient thresholding, and reconstruction. Denoising the lung sound signals was accomplished using several wavelet functions and threshold selection criteria. For the final denoising procedure, a wavelet function and level of decomposition with a higher SNR value were used. The first (decomposition) phase involved selecting a suitable wavelet function and determining the level of wavelet decomposition (sym13 at 6th level of decomposition). In the second step, for each wavelet decomposition level 1 to  , soft thresholding was applied to the detail (high frequency) coefficients of the signal. The final step, reconstruction, was done using the original approximation coefficients of level
  and the modified detail coefficients of levels from 1 to
  . Furthermore, the performance of the two thresholding methods (soft and hard thresholding) for the denoising of lung sounds was investigated using four well-known standard threshold selection rules: heursure, rigrsure, minimaxi, and sqtwolog.25,26
Feature Extraction
The DWT-based feature extraction algorithm was used for the extraction of features of the lung sound signals. Feature extraction was conducted using MATLAB (MATLAB R2019b). The extraction was performed in 7 steps.
Step 1: The lung sound signals were decomposed into six detail sub bands using DWT at level  . The sub bands are the details (high-frequency band coefficients) and the approximation (low-frequency band coefficients).
Step 2: The approximation coefficients were further decomposed to extract localized information from the sub bands of detail coefficients. A six-level decomposition was performed using the Sym13 wavelet.
Step 3: All the six level detail band coefficients were then selected for further analysis and processing.
Step 4: For six detail sub bands, the frequency vector (in radians/sample) was extracted using the periodogram function in MATLAB.
Step 5: The decomposed and modified signals were reconstructed using inverse-DWT.
Step 6: Then different time and frequency domain features were computed from the reconstructed signals.
Step 7: Finally, the extracted features for all the lung sound classes were tabulated in the feature table for classification. The extracted features and their mathematical descriptions are illustrated in Table 2.
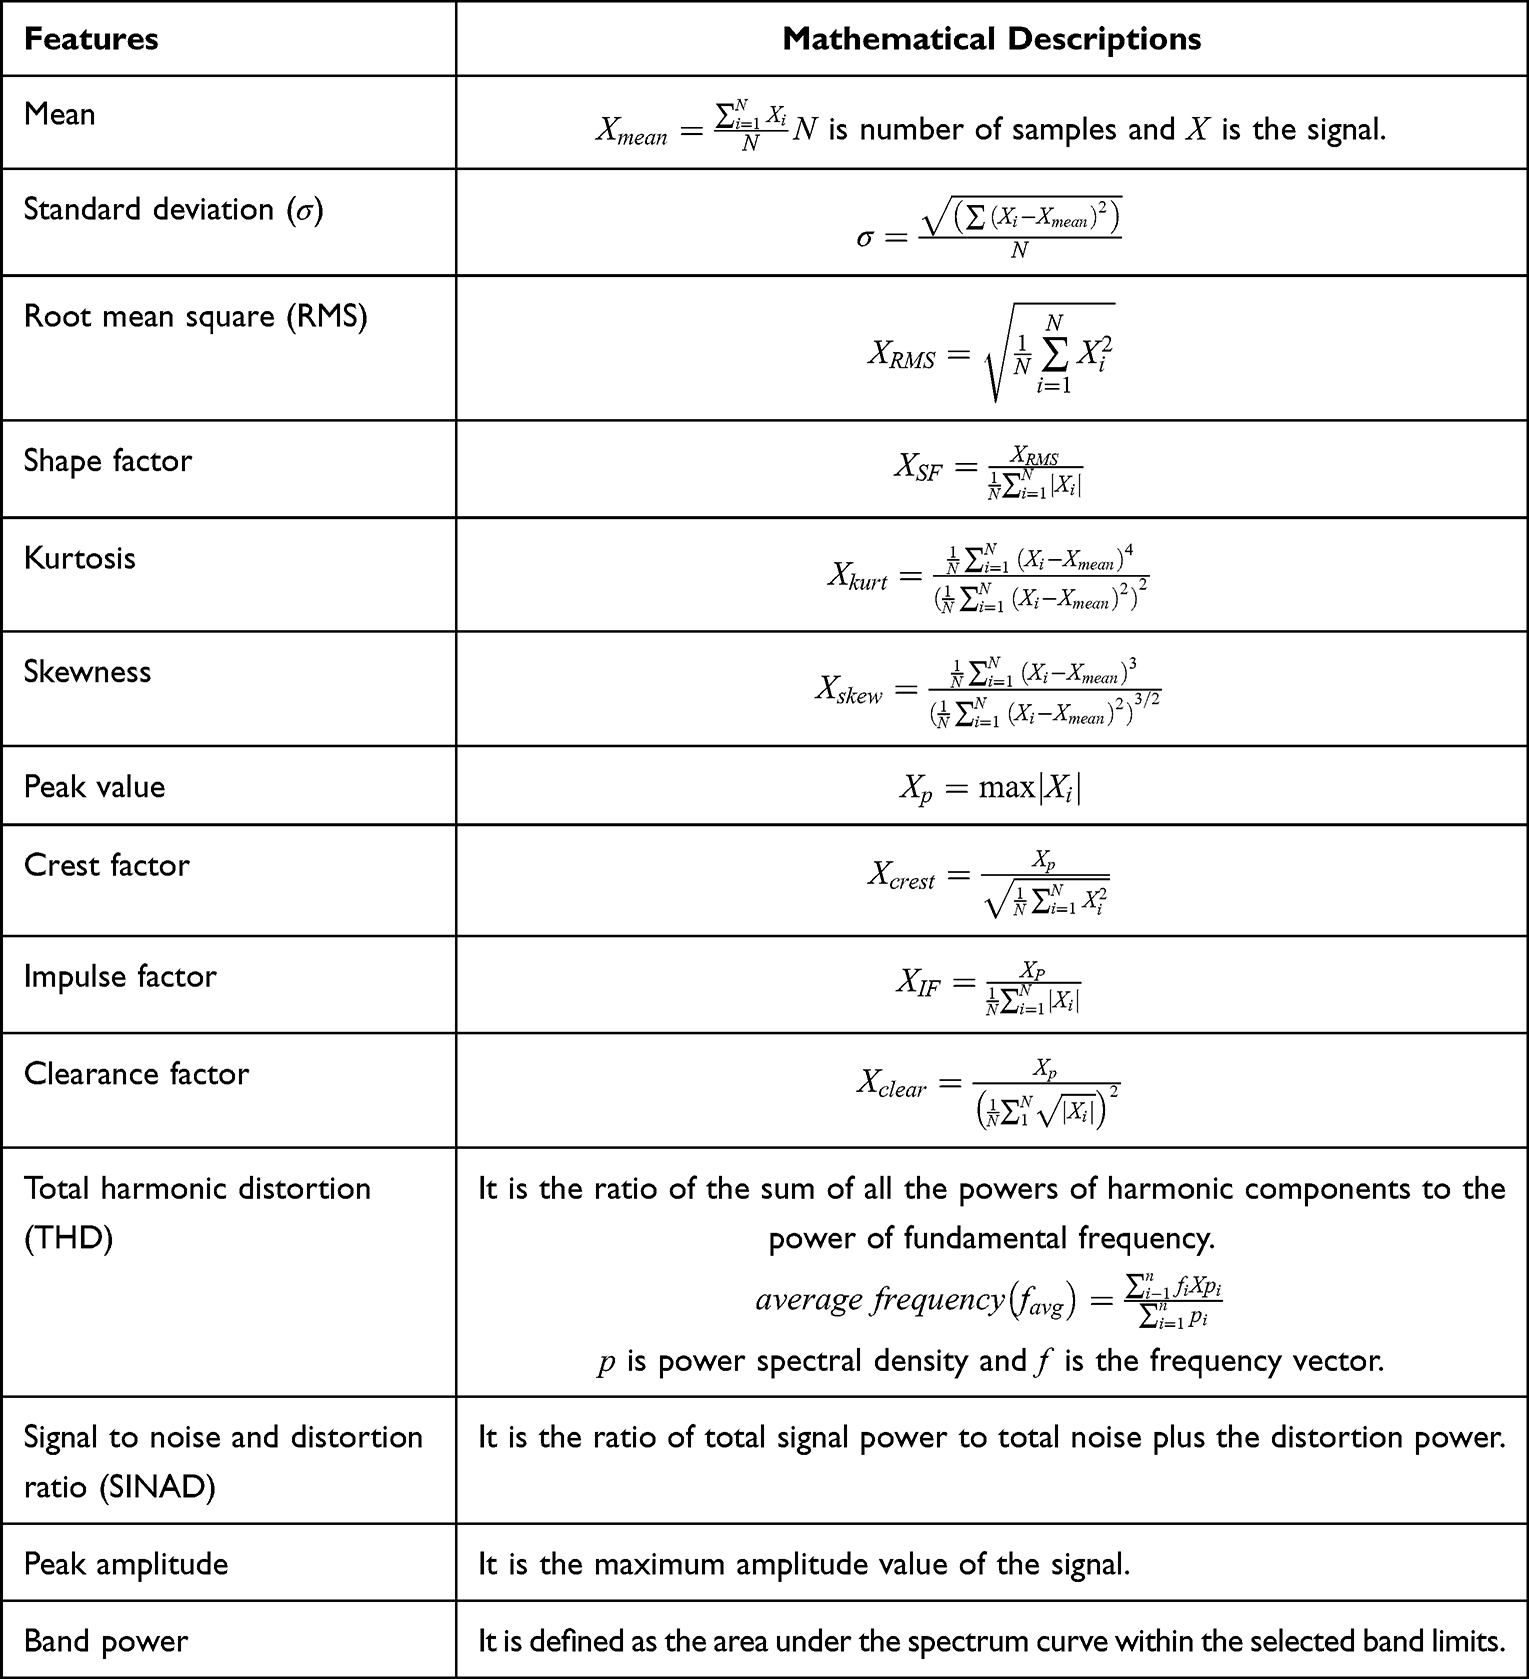 |
Table 2 Mathematical Description of Time Domain and Frequency Domain Features |
Feature Selection and Normalization
Prior to training machine learning models, feature selection was undertaken to choose the most important features and remove undesired or redundant features. We chose and used one of the statistical filter feature selection approaches, One-way ANOVA, with a minmax normalization scheme to choose the most important features in this study. ANOVA is the process of ranking or ordering retrieved features based on the value of a scoring function. It typically assesses the usefulness of features.27 Moreover, for numerical input and categorical output classification issues, ANOVA is the preferred method.27 After feature ranking and selection of the most relevant features, feature normalization was performed to avoid bias during data training and classification.
Data Splitting
Prior to model training and classification, the data was divided into training and testing. Initially, the dataset was split using the hold-out method. Then, an eightfold cross-validation was applied. This allows the training and validation sets to cross-over in successive rounds so that each data point will have a chance of being validated against 8 separate times. Accordingly, 80% of the data (400) were used for training and the rest 20% (100) were used for testing.
Model Training and Evaluation
A total of 8 models from the 4 machine learning models including Naive Bayes, K-nearest neighbor (KNN), Ensemble and support vector machine (SVM) models were trained and compared for classification of lung diseases. Naive Bayes models are a group of classification algorithms based on Bayes’ theorem. Naive Bayes algorithms classify the data in two steps. In the first step, using the training data, the method estimates the probability distribution of the parameters by assuming each predictor is conditionally independent given the class. Then, in the prediction step, for any new data, the method computes the posterior probability distribution of that sample belonging to each class. KNN classifiers, on the other hand, classify the object based on the distance between the new object and the defined objects. The new object is assigned to the class K that has the shortest distance to class K which is defined as the nearest neighbor.28 Ensemble classifiers mix results from many weak learners into one high-quality ensemble model. The SVM algorithm represents the training data as points in a flat separated space by an apparent gap. Then, the new objects are mapped into space with the forecast category based on which side of the gap they fall. It classifies the data by finding the best hyperplane which separates data points of one class from those of the other classes.
After training of the selected machine learning models using the extracted and selected features, the best model with higher classification accuracy was selected. Then, the classification performance of the selected algorithm was further evaluated using different performance metrics.
Model Optimization and Evaluation
Bayesian optimization techniques were used to optimize our model for improving classification performance. There are different ways to perform Bayesian optimization technique including  and
and  , classification learner and regression learner apps, fit function, and
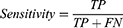
  .29 In this study, we used a classification learner app to automatically build an optimized model using Bayesian optimization scheme. Finally, different performance metrics such as accuracy, sensitivity, and specificity of the final optimized model were determined from the true positives (TP), false negatives (FN), true negatives (TN), and false positives (FP) of the model classification result (Equations 1–3).
Results
Data Pre-Processing
A DWT-based denoising of the lung sound signals which involves three steps including decomposition, detail coefficient thresholding, and reconstruction was applied for all recorded signals prior to feature selection and model training. Figure 3 demonstrates sample signal decomposition using the DWT technique. Following the decomposition, performance of soft and hard thresholding techniques using different wavelet functions at different levels of decomposition was evaluated as demonstrated in Table 3. The highest SNR values were obtained for Symlet 13 (Sym13) wavelet function at the 6th level of decomposition (SNR values of 22.50 dB and 22.48 dB using soft and hard thresholding methods, respectively). Hence, the Sym13 wavelet function at 6th level decomposition with soft thresholding method was selected for decomposition and denoising of the lung sound signals. The effect of the four threshold selection rules including Rigrsure, Sqtwolog, Heursure, and Minmax, were also compared during denoising of lung sound signals using the selected wavelet function (demonstrated in Table 4). As indicated in Table 3, the highest SNR values of the Sym13 wavelet function were observed when using the Sqtwolog threshold selection rule. Hence, the sym13 wavelet function with soft thresholding method and Sqtwolog threshold selection rule was selected and applied to denoise all the lung sound signals. Sample results of DWT decomposition on healthy and COPD patient lung sound signals are demonstrated in Figure 3. Figure 4 shows samples of the denoised and reconstructed lung sound signals of healthy and COPD subjects.
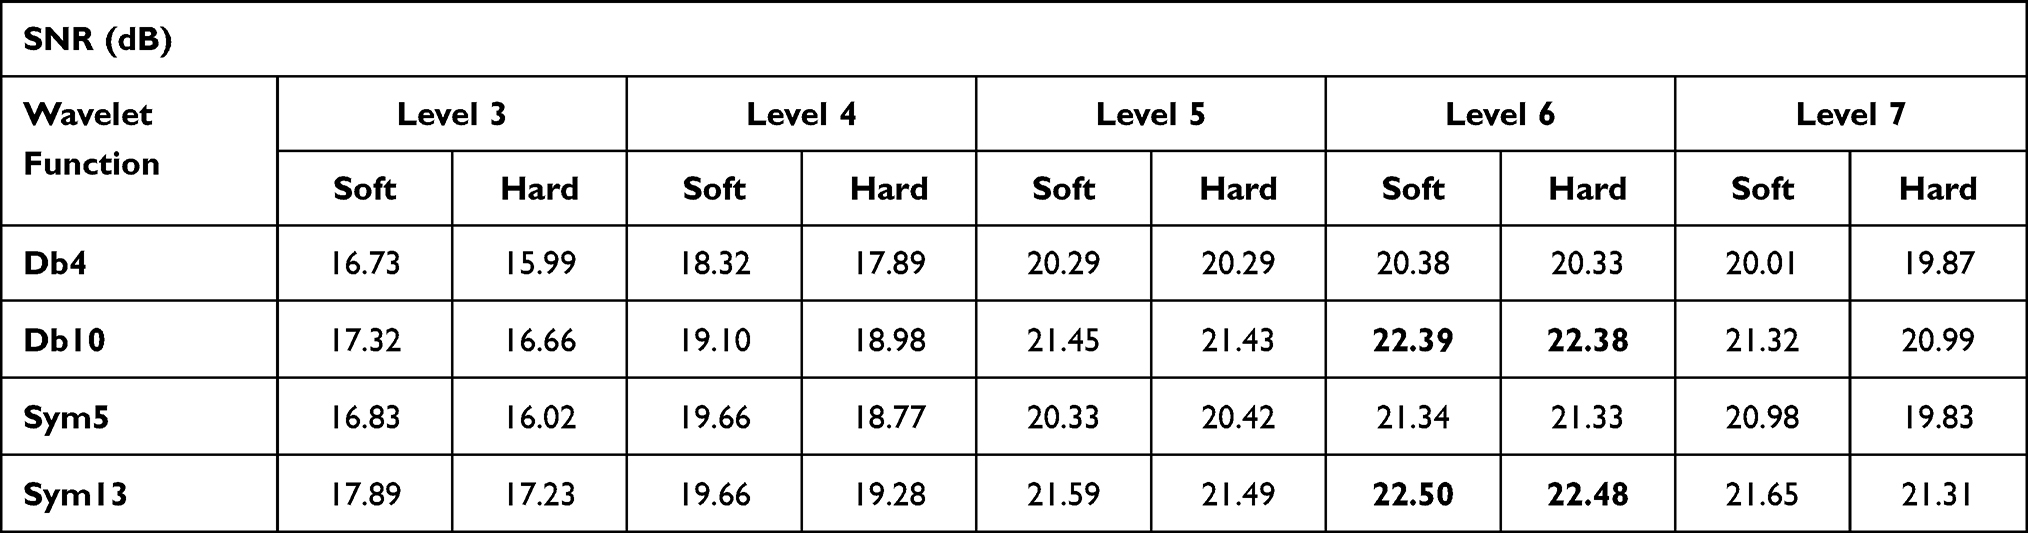 |
Table 3 SNR Results Obtained When Denoising the Lung Sound Signals Using Different Wavelet Functions at Different Levels of Decomposition with Soft and Hard Thresholding Methods and Sqtwolog Threshold Selection Rule. (Db4=Daubechies 4, Db10= Daubechies 10, Sym5= Symlet 5, and Sym13= Symlet 13.) |
 |
Table 4 SNR Values of the Four Threshold Selection Rules for Denoising Lung Sound Signals Using Sym13 Wavelet Function at 6th Level Decomposition with Soft Thresholding Method |
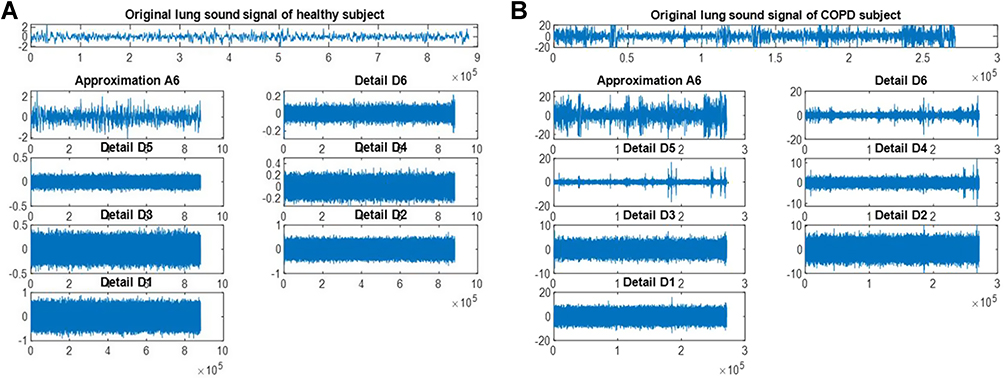 |
Figure 3 Wavelet decomposition of lung sound signals using Sym13 at 6th level from (A) healthy patient (B) COPD subjects. |
 |
Figure 4 Denoising of lung sound signals using Sym13 wavelet function at 6th level with soft thresholding method. (A) healthy, (B) COPD. |
Feature Extraction, Selection and Normalization
Following denoising, important features were extracted from all of the lung sound signals. Then, feature ranking was utilized to choose the greatest predictors or characteristics for discriminating between distinct classes. For the selection of the most discriminative features, a one-way ANOVA feature ranking approach was used. Table 5 displays the results of feature ranking using one-way ANOVA. The final three time-domain features with the lowest score values (skewness, peak value, and total harmonic distortion (THD)) were removed from the feature list, and the remaining features were chosen for model training. Following feature selection, features were normalized by removing each mean from the value of the feature and dividing it by the standard deviation.
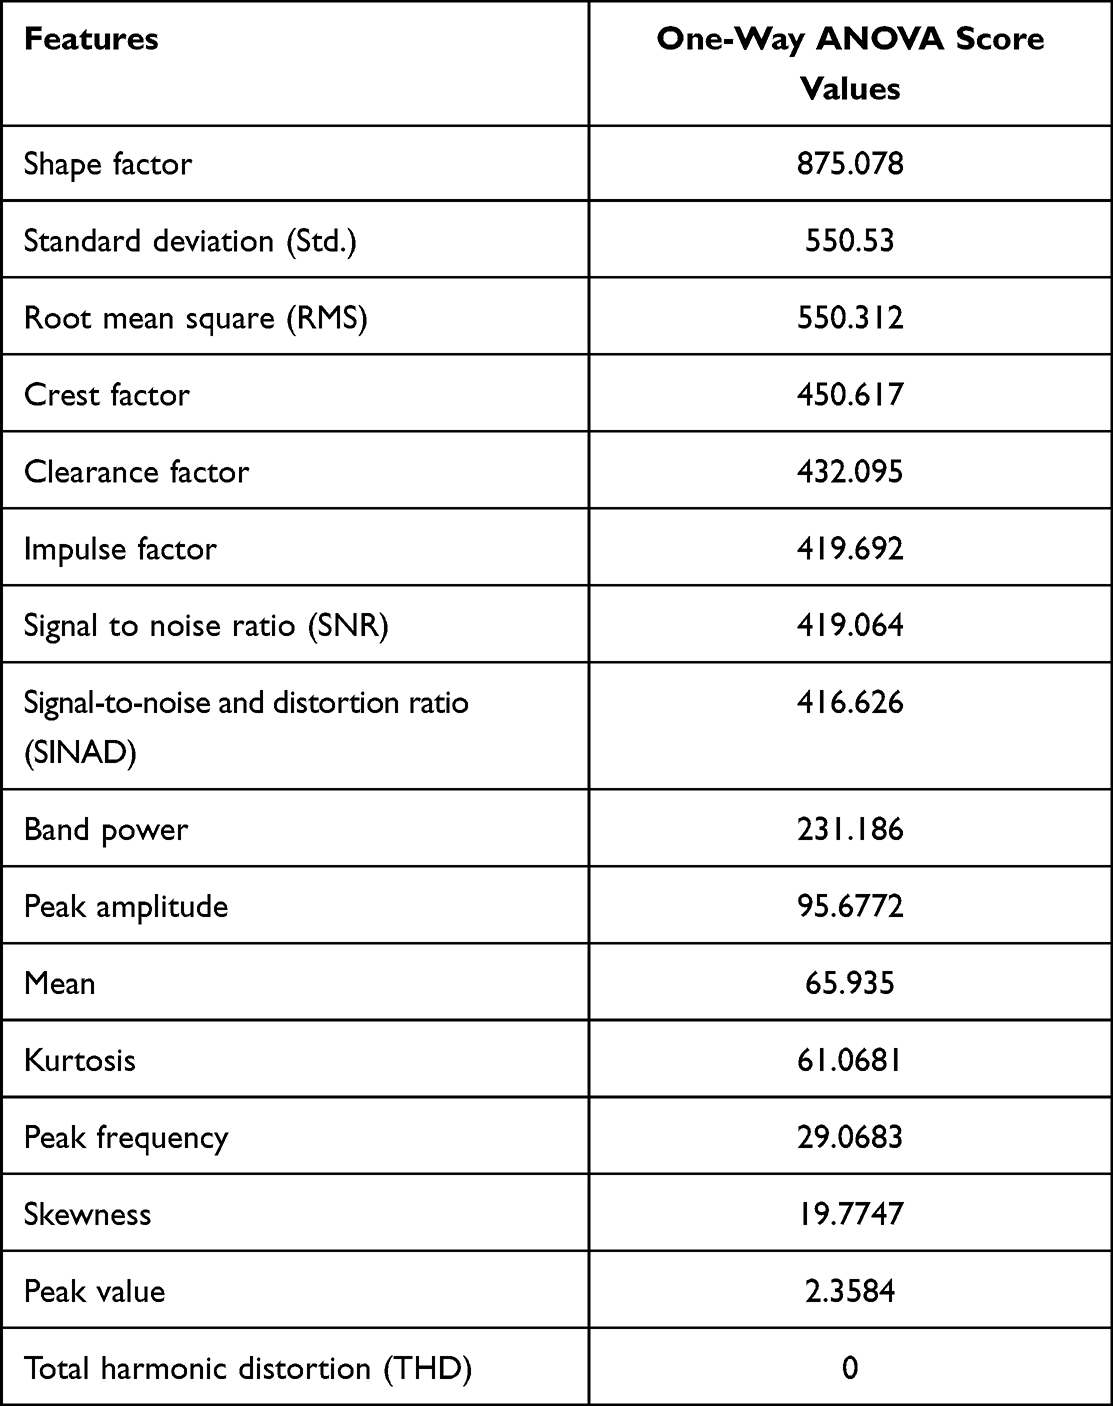 |
Table 5 Results of Features Rank Using One-Way ANOVA Feature Ranking Method |
Model Training, Evaluation and Optimization
The classification accuracy of 8 machine learning models trained using the same data and extracted features are demonstrated in Figure 5. Among the 8 models, Fine Gaussian SVM outperformed the rest with training classification accuracy of 97.8%, and was selected for our purpose. For further improvement of classification accuracy, the selected model was optimized using Bayesian optimization technique and a final accuracy of 98.8% was achieved. The performance of the Fine Gaussian SVM classifier after optimization is demonstrated in the confusion matrix of Figure 6.
 |
Figure 5 Accuracy achieved on different machine learning models. |
 |
Figure 6 Confusion matrix demonstrating the performance of optimized Fine Gaussian SVM classifier per each true class. |
Model Testing
As a final evaluation, testing was performed on the final optimized model with a new dataset. A total of 100 lung sound signals were used for testing. The classification performance of the final optimized model is demonstrated in the confusion matrix presented in Figure 7. Accordingly, an average classification accuracy of 99%, sensitivity of 99.04% and specificity of 99.2% were achieved using the new dataset.
 |
Figure 7 Test result of the final optimized model using unseen dataset. |
Discussion
Auscultation of lung sounds provide vital information about the physiology and pathology of lungs and airways obstruction.19 Accurate lung diagnosis of lung sounds requires the ability to distinguish normal breathing sounds from various abnormal adventitious sounds. Many spectral analysis techniques including Fourier transform (FT), fast Fourier transform (FFT)-Welch, autoregressive (AR), AR-Burg, autoregressive moving average (ARMA), and Mel-frequency cepstral coefficients (MFCC) have been used in the literature for lung sound signal analysis.19,20,30,31 Time domain analysis techniques such as empirical mode decomposition and multiscale entropy techniques have been also used for analysis of lung sounds.32–34
However, frequency-domain or time-domain analysis techniques alone cannot provide enough information of the non-stationary lung sound signals. Due to this, time-frequency domain analysis techniques have been also employed in literature for analysis of the non-stationary lung sound signals.15,19,35 Short-time Fourier transform (STFT)-based analysis techniques provide both time and frequency information of signals but unable to extract multiple features due to single and fixed window regions.
In this study, acquisition and wavelet multiresolution analysis of lung sounds using DWT and classification of most common lung diseases using machine learning techniques has been proposed. Lung sounds of 7 top lung diseases and health subjects were recorded using a custom designed and constructed electronic stethoscope. In addition, online annotated lung sound signals were also included in our dataset. All the lung sound records were normalized at the same sampling rate of 44.1KHz and bit-depth of 16 bits. Furthermore, DWT-based denoising of the lung sound signals involving decomposition, detail coefficient thresholding, and reconstruction was performed on all signals. Four wavelet functions (Db4, Db10, Sym5, and Sym13) and four different threshold selection rules (Rigrsure, Sqtwolog, Heursure, and Minmax) were compared in denoising the lung sound signals. The SNR results for the different wavelet functions were calculated at different levels of decomposition (3rd to 7th) for comparison. After evaluation, the Sym13 wavelet function at 6th level decomposition with soft thresholding method and Sqtwolog threshold selection rule outperformed the others and was selected for denoising operation.
A DWT-based feature extraction technique was applied to extract important features from the lung sound signals. A total of 16 features were extracted from the lung sound signals. After pertinent feature extractions, feature selection by a means of variable or feature ranking was done to select the most discriminative features. A one-way ANOVA feature ranking method using  normalization scheme was implemented and 13 out of 16 most discriminative features were selected to train different machine learning models. Then, feature normalization was performed to all extracted feature values to avoid bias to the classifier during model training and classification. After feature normalization, the whole data was split into training (80%) and testing (20%). Then, an eightfold cross-validation technique was applied to the training dataset. 8 machine learning models from 4 families were trained and validated to select the best performing model.
Better results were achieved by Gaussian Naive Bayes and Kernel Naive Bayes algorithms with an accuracy of 94.8% and 95.8%, respectively. KNN classifiers typically have best predictive accuracy in low dimensions but might not be good in high dimensions.22 Additionally, KNN classifiers have high memory usage and are not easy to interpret. Naive Bayes classifiers are easy to interpret and useful for multiclass classification.22 However, the Naive Bayes algorithms need a small amount of training data for estimating the vital parameters which made the algorithms extremely fast compared to more sophisticated methods.36 In addition, ensemble algorithms, RUS Boosted trees and Bagged trees were trained, and an accuracy of 96.5% and 97.3%, respectively, were achieved. Ensemble classifiers tend to be slow to fit because they often need many weak learners.36 SVM algorithms including Cubic SVM and Fine Gaussian SVM were also trained and a relatively higher accuracy of 97.5% and 97.8%, respectively, were achieved. Accordingly, the model with the highest classification accuracy, Fine Gaussian SVM was selected and further optimized using Bayesian optimization technique for accuracy improvement. After model optimization, the accuracy of our model was improved to 98.8%. Furthermore, the optimal model parameter values of box constraint level and kernel scale were found to be 417.88 and 24.82, respectively. Finally, the optimized model was tested using unseen (new) dataset and an overall accuracy of 99%, sensitivity of 99.04% and specificity of 99.2% were achieved.
The proposed method delivered considerably improved results compared to similar lung sound signal processing, analysis and classification methods proposed in the literature. A summary of comparison between related works and the current work is illustrated in Table 6.
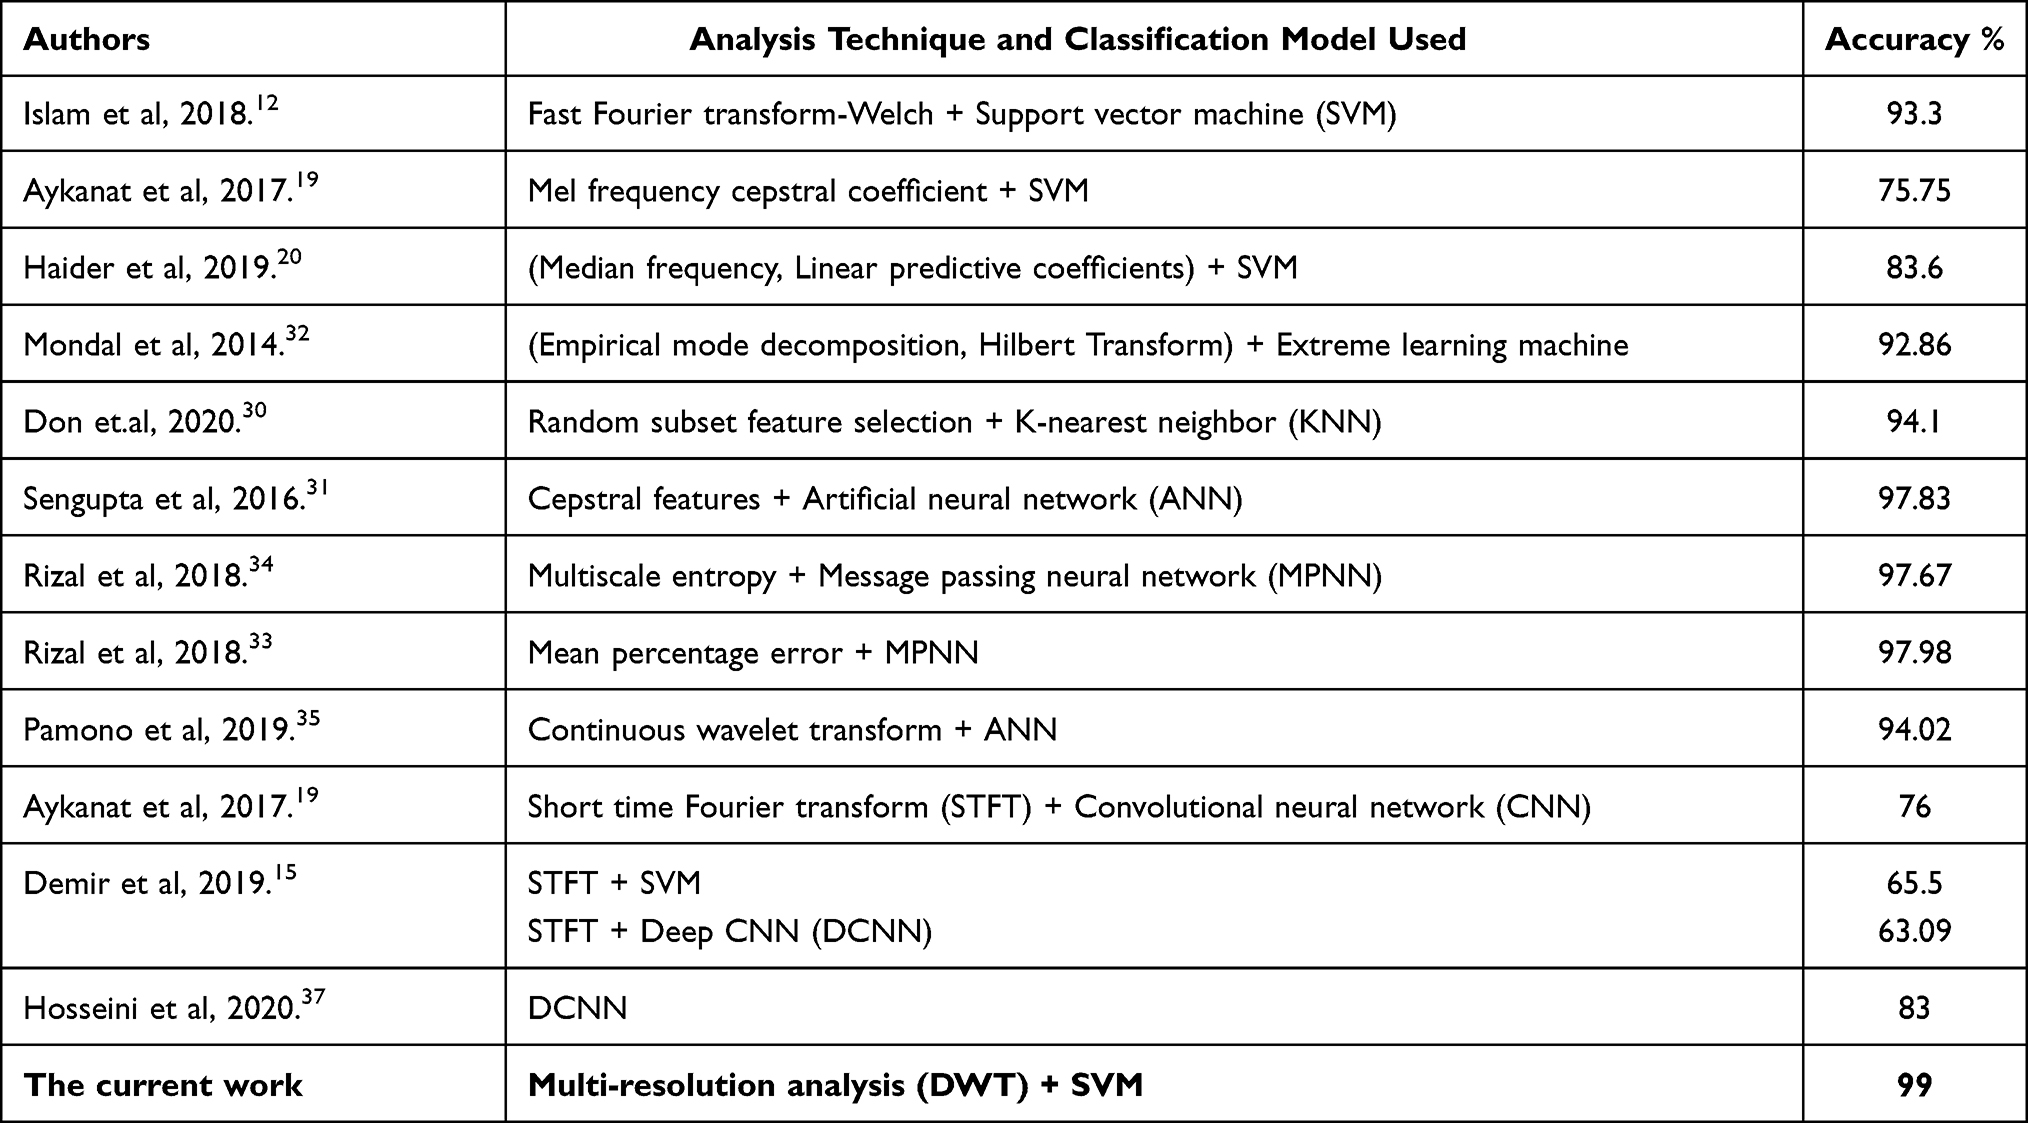 |
Table 6 Comparison of the Current Work with Related Literature |
The results found in the current work for the classification of most common lung disease using lung sound signals demonstrate the proposed methods’ potential in helping physicians in the diagnosis of lung disease. We acknowledge that the lung sound signals used for model training were acquired using a single channel data acquisition system. Multichannel data acquisition systems could be more efficient to gather more adequate information about the lungs pathology.
Conclusion
In this study, a cost-effective electronic stethoscope for acquisition of lung sounds, DWT for the time-frequency multiresolution analysis of lung sound signals, and different machine learning classifiers were employed for multi-class classification of most common lung diseases.
The Sym13 wavelet function with soft thresholding method and sqtwolog threshold selection rule was used for decomposition and denoising of the lung sound signal. DWT-based feature extraction was performed for the extraction of different features from the lung sound signals. A single way ANOVA was used to select the most discriminative features used to train different machine learning models. After model selection, optimization, training, and testing, an overall accuracy of 99%, a sensitivity of 99.04%, and a specificity of 99.2% were acquired using a Fine Gaussian SVM model. The proposed method delivered a considerably improved result for the classification of most common lung diseases including asthma, pneumonia, COPD, URTI, LRTI, bronchiectasis, bronchiolitis, and healthy. The experimental results demonstrate that the developed system has the potential to be used as a decision support system for physicians, especially in low resource settings and in the diagnosis of lung disease.
Data Sharing Statement
The datasets used and/or analyzed during the current study are available from the corresponding author on reasonable request.
Ethics Approval and Consent to Participate
This research has been approved by Jimma University’s research ethics institutional review board (IRB). This research has been performed in accordance with the ethical standards as laid down in the 1964\Declaration of Helsinki and its later amendments or comparable ethical standards. An informed written consent form was obtained from all participants prior to data collection.
Acknowledgments
The resources required for this research were provided by the school of Biomedical Engineering, Jimma institute of Technology, Jimma University and Jimma University Medical Center (JUMC). We would like to acknowledge our clinical collaborators Prof. Yoo, Dr. Assefa, Dr. Bekela, and Dr. Aneso, who are the medical doctors working in JUMC, Department of Internal Medicine, Pulmonology Unit, for their valuable advice and guidance from clinical perspectives.
Author Contributions
All authors made a significant contribution to the work reported, whether that is in the conception, study design, execution, acquisition of data, analysis and interpretation, or in all these areas; took part in drafting, revising or critically reviewing the article; gave final approval of the version to be published; have agreed on the journal to which the article has been submitted; and agree to be accountable for all aspects of the work.
Disclosure
The authors report no conflicts of interest in this work.
References
1. Prasad B. Chronic Obstructive Pulmonary Disease (COPD). IJPRT. 2020;10(1):67LP- 71.
2. Vestbo J. COPD: definition and phenotypes. Clin Chest Med. 2014;35(1):1–6. doi:10.1016/J.CCM.2013.10.010
3. Calverley PMA, Georgopoulos D. Chronic obstructive pulmonary disease: symptoms and signs. Eur Respir Monogr. 1998;3(7):6–24. doi:10.1183/1025448X.00038002
4. Kirenga BJ, Schwartz JI, De Jong C, van der Molen T, Okot-Nwang M. Guidance on the diagnosis and management of asthma among adults in resource limited settings. Afr Health Sci. 2015;15(4):1189. doi:10.4314/AHS.V15I4.18
5. Kim H, Mazza J. Asthma. Allergy Asthma Clin Immunol. 2011;7(Suppl1):S2. doi:10.1186/1710-1492-7-S1-S2
6. Cukic V, Lovre V, Dragisic D, Ustamujic A. Asthma and Chronic Obstructive Pulmonary Disease (COPD) – differences and similarities. Mater Sociomed. 2012;24(2):100. doi:10.5455/MSM.2012.24.100-105
7. Grief SN, Loza JK. Guidelines for the evaluation and treatment of pneumonia. Prim Care. 2018;45(3):485–503. doi:10.1016/J.POP.2018.04.001
8. Cotton MF, Innes S, Jaspan H, Madide A, Rabie H. Management of upper respiratory tract infections in children. S Afr Fam Pract. 2008;50(2):6. doi:10.1080/20786204.2008.10873685
9. Rohilla A, Sharma VK, Kumar S. Upper respiratory tract infections: an overview; Int J Curr Pharmaceut Res. 2013;5:1–3.
10. Mirkarimi M, Alisamir M, Saraf S, Heidari S, Barouti S, Mohammadi S. Clinical and epidemiological determinants of lower respiratory tract infections in hospitalized pediatric patients. Int J Pediatr. 2020;2020:1–7. doi:10.1155/2020/8844420
11. Rademacher J, Welte T. Bronchiectasis. Dtsch Arztebl Int. 2011;108(48):809–815. doi:10.3238/ARZTEBL.2011.0809
12. Islam MA, Bandyopadhyaya I, Bhattacharyya P, Saha G. Classification of normal, Asthma and COPD subjects using multichannel lung sound signals.
13. Dukić L, Kopčinović LM, Dorotić A, Baršić I. Blood gas testing and related measurements: national recommendations on behalf of the Croatian Society of Medical Biochemistry and Laboratory Medicine. Biochem Medica. 2016;26(3):318–336. doi:10.11613/BM.2016.036
14. Altan G, Kutlu Y, Garbi Y, Pekmezci AÖ, Nural S, Altan G. Multimedia respiratory database (RespiratoryDatabase@TR): auscultation sounds and Chest X-rays. Nat Eng Sci. 2021. doi:10.48550/arxiv.2101.10946
15. Demir F, Sengur A, Bajaj V. Convolutional neural networks based efficient approach for classification of lung diseases. Heal Inf Sci Syst. 2020;8(1). doi:10.1007/S13755-019-0091-3
16. Andrès E, Gass R, Charloux A, Brandt C, Hentzler A. Respiratory sound analysis in the era of evidence-based medicine and the world of medicine 2.0. J Med Life. 2018;11(2):89–106.
17. Göğüş FZ, Karlık B, Harman G. Identification of pulmonary disorders by using different spectral analysis methods. Int J Comput Intell Syst. 2016;9(4):595–611. doi:10.1080/18756891.2016.1204110
18. Gökçen A. Computer-aided diagnosis system for chronic obstructive pulmonary disease using empirical wavelet transform on auscultation sounds. Comput J. 2021;64(11):1775–1783. doi:10.1093/COMJNL/BXAA191
19. Aykanat M, Kılıç Ö, Kurt B, Saryal S. Classification of lung sounds using convolutional neural networks. Eurasip J Image Video Process. 2017;2017(1):1–9. doi:10.1186/S13640-017-0213-2/TABLES/2
20. Haider NS, Singh BK, Periyasamy R, Behera AK. Respiratory sound based classification of chronic obstructive pulmonary disease: a risk stratification approach in machine learning paradigm. J Med Syst. 2019;43(8):8. doi:10.1007/s10916-019-1388-0
21. Vora S, Shah PC. COPD classification using machine learning algorithms. Int Res J Eng Technol. 2019;6:608–611.
22. Osisanwo FY, Akinsola JE, Awodele O, Hinmikaiye JO, Olakanmi O, Akinjobi J. Supervised machine learning algorithms: classification and comparison. Int J Comput Trends Technol. 2017;48(3):128–138. doi:10.14445/22312803/IJCTT-V48P126
23. Do Q, Son TC, Chaudri J. Classification of asthma severity and medication using tensorflow and multilevel databases. Procedia Comput Sci. 2017;113:344–351. doi:10.1016/j.procs.2017.08.343
24. Rao A, Huynh E, Royston TJ, Kornblith A, Roy S. Acoustic methods for pulmonary diagnosis. IEEE Rev Biomed Eng. 2019;12:221. doi:10.1109/RBME.2018.2874353
25. Verma N, Verma AK. Performance analysis of wavelet thresholding methods in denoising of audio signals of some Indian musical instruments. Int J Eng Sci Technol. 2012;4:2040–2045.
26. Devnath L, Kumer S, Nath D, Das AK, Islam R. Selection of wavelet and thresholding rule for denoising the ECG signals. Annals of Pure and Applied Mathematics. 2015;10(1):65–73.
27. Elssied NOF, Ibrahim O, Osman AH. A novel feature selection based on one-way ANOVA F-test for e-mail spam classification. Res J Appl Sci Eng Technol. 2014;7(3):625–638. doi:10.19026/RJASET.7.299
28. Neili Z, Fezari M, Redjati A. ELM and K-nn machine learning in classification of breath sounds signals. Int J Electr Comput Eng. 2020;10(4):3528–3536. doi:10.11591/IJECE.V10I4.PP3528-3536
29. Gambella C, Ghaddar B, Naoum-Sawaya J. Optimization problems for machine learning: a survey. Eur J Oper Res. 2021;290(3):807–828. doi:10.1016/J.EJOR.2020.08.045
30. Don S. Random subset feature selection and classification of lung sound. Procedia Comput Sci. 2020;167(2019):313–322. doi:10.1016/j.procs.2020.03.228
31. Sengupta N, Sahidullah M, Saha G. Lung sound classification using cepstral-based statistical features. Comput Biol Med. 2016;75:118–129. doi:10.1016/J.COMPBIOMED.2016.05.013
32. Mondal A, Bhattacharya P, Saha G. Detection of lungs status using morphological complexities of respiratory sounds. Sci World J. 2014;2014:1–9. doi:10.1155/2014/182938
33. Rizal A, Hidayat R, Nugroho HA. Multiscale tsallis entropy for pulmonary crackle detection. Int J Adv Intell Informatics. 2018;4(3):192–201. doi:10.26555/ijain.v4i3.273
34. Rizal A, Hidayat R, Nugroho HA. Comparison of multiscale entropy techniques for lung sound classification. Indones J Electr Eng Comput Sci. 2018;12(3):984–994. doi:10.11591/IJEECS.V12.I3.PP984-994
35. Adhi Pramono RX, Imtiaz SA, Rodriguez-Villegas E. Evaluation of features for classification of wheezes and normal respiratory sounds. PLoS One. 2019;14(3):e0213659. doi:10.1371/JOURNAL.PONE.0213659
36. Alsheref FK, Gomaa WH. Blood diseases detection using classical machine learning algorithms. Int J Adv Comput Sci Appl. 2019;10(7):77–81. doi:10.14569/IJACSA.2019.0100712
37. Hosseini M, Ren H, Rashid H-A, Mazumder AN, Prakash B, Mohsenin T. Neural networks for pulmonary disease diagnosis using auditory and demographic information. arXiv preprint arXiv. 2020. doi:10.48550/arxiv.2011.13194
 © 2022 The Author(s). This work is published and licensed by Dove Medical Press Limited. The
full terms of this license are available at https://www.dovepress.com/terms
and incorporate the Creative Commons Attribution
- Non Commercial (unported, 3.0) License.
By accessing the work you hereby accept the Terms. Non-commercial uses of the work are permitted
without any further permission from Dove Medical Press Limited, provided the work is properly
attributed. For permission for commercial use of this work, please see paragraphs 4.2 and 5 of our Terms.
© 2022 The Author(s). This work is published and licensed by Dove Medical Press Limited. The
full terms of this license are available at https://www.dovepress.com/terms
and incorporate the Creative Commons Attribution
- Non Commercial (unported, 3.0) License.
By accessing the work you hereby accept the Terms. Non-commercial uses of the work are permitted
without any further permission from Dove Medical Press Limited, provided the work is properly
attributed. For permission for commercial use of this work, please see paragraphs 4.2 and 5 of our Terms.