Back to Journals » Neuropsychiatric Disease and Treatment » Volume 13
Abnormal whole-brain functional connectivity in patients with primary insomnia
Authors Li C, Dong M ![]() , Yin Y
, Yin Y ![]() , Hua K, Fu S, Jiang G
, Hua K, Fu S, Jiang G
Received 27 November 2016
Accepted for publication 19 December 2016
Published 13 February 2017 Volume 2017:13 Pages 427—435
DOI https://doi.org/10.2147/NDT.S128811
Checked for plagiarism Yes
Review by Single anonymous peer review
Peer reviewer comments 2
Editor who approved publication: Professor Wai Kwong Tang
Chao Li, Mengshi Dong, Yi Yin, Kelei Hua, Shishun Fu, Guihua Jiang
Department of Medical Imaging, The Affiliated Guangdong No 2 Provincial People’s Hospital of Southern Medical University, The Third Clinical Medical College of Southern Medical University, Guangzhou, People’s Republic of China
Abstract: The investigation of the mechanism of insomnia could provide the basis for improved understanding and treatment of insomnia. The aim of this study is to investigate the abnormal functional connectivity throughout the entire brain of insomnia patients, and analyze the global distribution of these abnormalities. Whole brains of 50 patients with insomnia and 40 healthy controls were divided into 116 regions and abnormal connectivities were identified by comparing the Pearson’s correlation coefficients of each pair using general linear model analyses with covariates of age, sex, and duration of education. In patients with insomnia, regions that relate to wakefulness, emotion, worry/rumination, saliency/attention, and sensory-motor showed increased positive connectivity with each other; however, regions that often restrain each other, such as regions in salience network with regions in default mode network, showed decreased positive connectivity. Correlation analysis indicated that some increased positive functional connectivity was associated with the Self-Rating Depression Scale, Insomnia Severity Index, and Pittsburgh Sleep Quality Index scores. According to our findings, increased and decreased positive connectivities suggest function strengthening and function disinhibition, respectively, which offers a parsimonious explanation for the hyperarousal hypothesis in the level of the whole-brain functional connectivity in patients with insomnia.
Keywords: primary insomnia, hyperarousal hypothesis, resting-state functional magnetic resonance imaging, functional connectivity, whole brain
Introduction
Sleep is as vital to human as water and food. However, many sleep disorders’ neural mechanisms are still elusive. Among them, insomnia has received relatively more attention as one of the most prevalent sleep disorders.1 Insomnia2 is an independent psychiatric syndrome that results in difficulties in falling asleep or maintaining sleep for at least 1 month and is associated with a sequela of daytime impairment or clinically significant distress unrelated to any other medical, physical, or psychiatric disorder. Insomnia confers an increased risk for physiological and psychiatric disorders, such as increased cardiovascular morbidity and mortality, and especially depression and anxiety, causing pronounced direct and indirect socioeconomic burden.3
In the past decade, neuroimaging techniques have made significant contributions to the study of insomnia. A series of studies4–9 found that patients with insomnia showed abnormal metabolism, function, and structure related to widespread cortical and subcortical areas, including the ascending reticular activating system, amygdala, hippocampus, cingulate cortex, insula, parietal, frontal cortex, and caudate nucleus. From the functional connectivity network’s point of view,10–13 these regions mainly belong to the default mode network (DMN), salience network (SN), affective network (AN), central-executive network (CEN), and subcortical regions (SUB). However, little is known about the functional connectivities among these regions.
Indeed, a few studies14–18 have emerged to investigate functional connectivity in patients with insomnia. However, results of some of these studies are inconsistent.17,18 Most importantly, most of these studies only focused on single or a few seed regions. It was difficult to fully clarify the neural mechanism of insomnia because the brain interconnects among widespread regions.10 Given the possibility that distributed abnormality of functional connectivity may exist in the rest of the brain of insomnia patients, we think it will be helpful to study functional connectivity from the perspective of whole brain for a better understanding of the neural mechanism of insomnia.
Thus, the aim of this study is to investigate the abnormal functional connectivities on the whole-brain level and analyze the global distribution of these abnormalities. Considering the overarching neural mechanism of insomnia, namely hyperarousal hypothesis,19 we hypothesized that global distribution of these abnormal functional connectivities throughout the entire brain of insomnia patients supports the hyperarousal hypothesis.
Patients and methods
Subjects
All patients with insomnia were recruited from Guangdong No 2 Provincial People’s Hospital from April 2014 to May 2016. Each study participant gave written informed consent, and the guidelines of the Declaration of Helsinki were followed in the study protocol. The study protocol was approved by the Ethics Committee of Guangdong No 2 Provincial People’s Hospital. The inclusion criteria for patients with insomnia were as follows: 1) conformity to the definition of primary insomnia by the Diagnostic and Statistical Manual of Mental Disorders, Fourth Edition;20 2) insomnia lasting at least 1 month, with a complaint of difficulty falling asleep, maintaining sleep, or early awakening; 3) no other sleep disorders (such as sleep-related movement disorders, hypersomnia, or parasomnia) or other psychiatric disorders determined by a semistandardized psychiatric and sleep-related interview conducted by an experienced psychiatrist; 4) insomnia not due to the effects of any medications or substance abuse, such as caffeine, nicotine, or alcohol; 5) right-hand dominance; 6) no serious organic disease; 7) no foreign implants in the body; 8) age 25–60 years; 9) no abnormal signal as verified by conventional T1-weighted or T2 fluid-attenuated inversion recovery magnetic resonance (MR) imaging; and 10) head motion less than 1.5 mm or 1.5° during MR imaging. The exclusion criterion for recruitment of patients was that patients must meet all of the above inclusion criteria; if not, the patient would be excluded. Five patients were excluded because of head motion greater than 1.5 mm or 1.5° and 5 patients were excluded because of brain infarcts and abnormal signal intensity. Finally, 50 patients with insomnia (21 men, 29 women; mean age, 39.64±10.42 years) were included in this study.
We also recruited 40 healthy control subjects matching in levels age, sex, and education (10 men and 30 women; mean age 39.20±8.47 years) from the local community by using advertisements. All control subjects met the following criteria: 1) good sleep quality and an Insomnia Severity Index (ISI) score of less than 7; 2) no history of swing shifts, shift work, or sleep complaints; 3) no medication or substance abuse, such as caffeine, nicotine, or alcohol; and 4) fulfillment of inclusion criteria 5–10 for the patients with insomnia.
Questionnaires
All volunteers were asked to complete a number of questionnaires, including the Pittsburgh Sleep Quality Index (PSQI),21 the ISI,22 the Self-Rating Anxiety Scale (SAS),23 and the Self-Rating Depression Scale (SDS).24
MR imaging
MR imaging data were obtained by using a 1.5T MR scanner (Achieva Nova-Dual; Philips, Best, the Netherlands) in the *BLINDED*. Head motion was restricted by a belt and foam pads. During the resting state of the functional MR imaging scanning, subjects were instructed to rest with their eyes closed and heads still. The resting-state functional MR images were obtained using a gradient-echo planar imaging sequence (interleaved scanning, repetition time/echo time =2,500 ms/50 ms, matrix =64×64, field of view =224×224 mm, flip angle =90°, section thickness =4 mm, gap =0.8 mm, 27 sections covering the whole brain were positioned along the anterior commissure-posterior commissure line). A total of 240 volumes were acquired in approximately 10 minutes.
Data preprocessing
An overview of the data processing framework is summarized in Figure 1. Data Processing Assistant for Resting-State Functional MR Imaging toolbox (http://www.restfmri.net/forum/DPARSF) was used to preprocess the imaging data. Volumes at the first 10 time points were discarded so that magnetization reached a steady state and subjects had adapted to the MR scanning noise. The slice timing and realignment for head motion correction and spatial normalization were conducted according to the standard Montreal Neurologic Institute template, resampled into a voxel size of 3×3×3 mm3. In order to avoid introducing artificial local spatial correlations, we did not apply spatial smoothing.25,26 To reduce the effects of low-frequency drift and high-frequency noise, the data were processed to remove linear trends and be filtered temporally (band pass, 0.01–0.08 Hz). Nuisance covariates including cerebrospinal fluid signals, white matter signals, and 6 head motion parameters were regressed from the functional MR imaging data. Of note, we did not regress out the global signal because of an ongoing controversy over removing the global signal during the preprocessing of resting-state functional MR imaging data.27 The residuals of these regressions were used for the following analysis. Then, mean time series of 116 regions of interests (ROI) defined by Automated Anatomic Labeling atlas28 were extracted for each individual by averaging the functional MR imaging time series throughout all voxels in each ROI. Functional connectivity between each pair of ROI was evaluated using Pearson’s correlation coefficients, producing (116×115)/2=6,670 functional connectivities for each subject. Fisher r-to-z transformation was performed for all functional connectivities to improve the normality of the correlation coefficients.
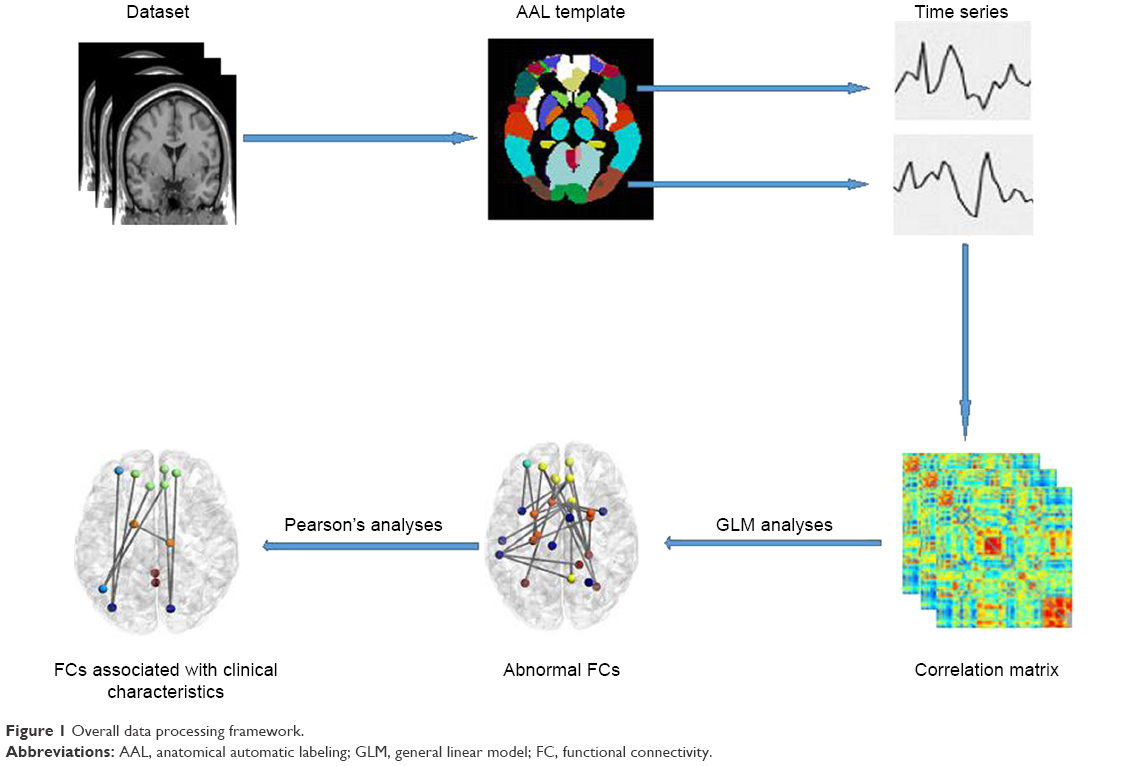 | Figure 1 Overall data processing framework. |
Statistical analysis
Two-sample 2-tailed t-tests were used to compare differences in age, duration of education, PSQI, ISI, SAS, and SDS scores between patients with insomnia and healthy controls. Two-tailed Pearson’s chi-square test was performed to determine differences of sex between the 2 groups.
General linear model analyses with covariates of age, duration of education, and sex were used to compare the differences of functional connectivities between the 2 groups. Significantly different connectivities were chosen as connectivities of interest (COIs).
Correlations between clinical characteristics and COIs were computed using Pearson’s correlation analyses (P<0.05).
Results
Demographic and clinical characteristics
As shown in Table 1, the patients with insomnia and the healthy controls showed no significant differences regarding age (P=0.83), sex (P=0.09), and education level (P=0.07). Patients with insomnia had higher PSQI, ISI, SAS, and SDS scores than the healthy controls (all P<0.001).
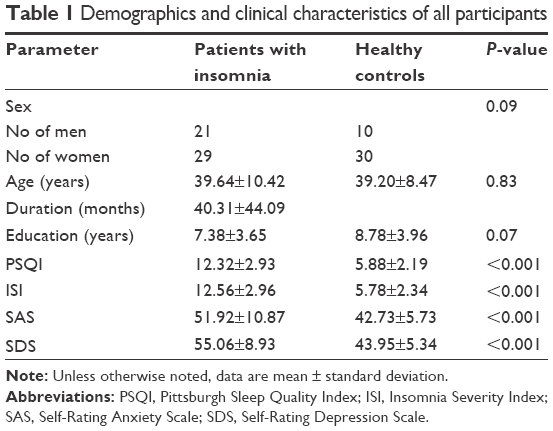 | Table 1 Demographics and clinical characteristics of all participants |
Functional connectivity of the whole brain
Overall, there were 36 functional connectivities that showed significant differences between the patients with insomnia and the healthy controls (all P<0.05, uncorrected). These included 28 increased functional connectivities (Table 2 and Figure 2) and 8 decreased functional connectivities (Table 3 and Figure 3). Regions (nodes) that constituted the 36 functional connectivities are shown in Table S1.
 | Table 2 Increased positive functional connectivities in patients with insomnia |
 | Figure 2 Increased positive functional connectivities in patients with insomnia. |
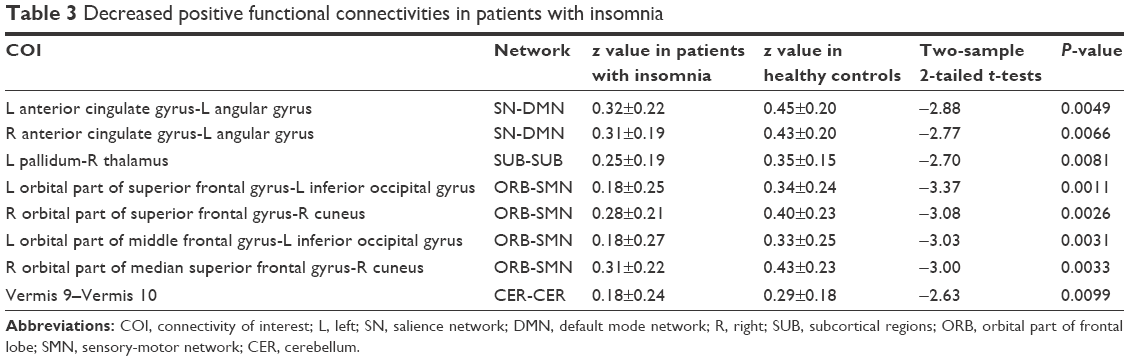 | Table 3 Decreased positive functional connectivities in patients with insomnia |
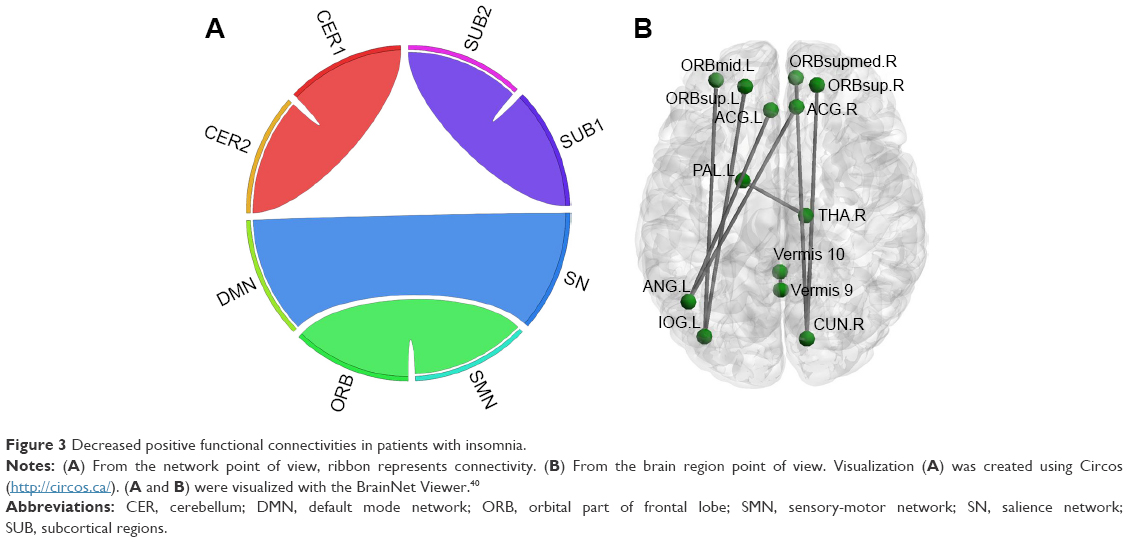 | Figure 3 Decreased positive functional connectivities in patients with insomnia. |
Compared with the healthy controls, patients with insomnia showed increased functional connectivities among widespread regions, and these regions belong to some functional connectivity networks as follows: between DMN and sensory-motor network (SMN) and orbital part of frontal lobe (ORB), between SN and SMN and ORB, between AN and SMN and cerebellum (CER), between ORB and SMN and CER, between SUB and SMN and ORB, between SMN and SMN and CER, and between CEN and CER. Details can be seen in Table 2 and Figure 2.
Compared with the healthy controls, patients with insomnia showed decreased functional connectivities among several regions, and these regions belong to some functional connectivity networks as follows: between DMN and SN, between ORB and SMN, and between SUB and CER. Details can be seen in Table 3 and Figure 3.
Relationship between aberrant functional connectivities and clinical characteristics
Table 4 shows the results of correlation analysis. We found that only regions with increased functional connectivity correlated with PSQI, ISI, and SDS (all P<0.05). Functional connectivities between some CER regions and 3 ORB regions, 1 AN region, 1 CEN region, and 1 SMN region were significantly correlated with PSQI (r=−0.34, −0.34, −0.33, −0.29, −0.40, −0.38). In addition, functional connectivities between a DMN region and an ORB region and between 2 SMN regions were significantly positively correlated with ISI (r=0.29, 0.31). Besides, functional connectivities between a DMN region and an SMN region and between an ORB region and an SN region were significantly negatively correlated with SDS (r=−0.28, −0.30).
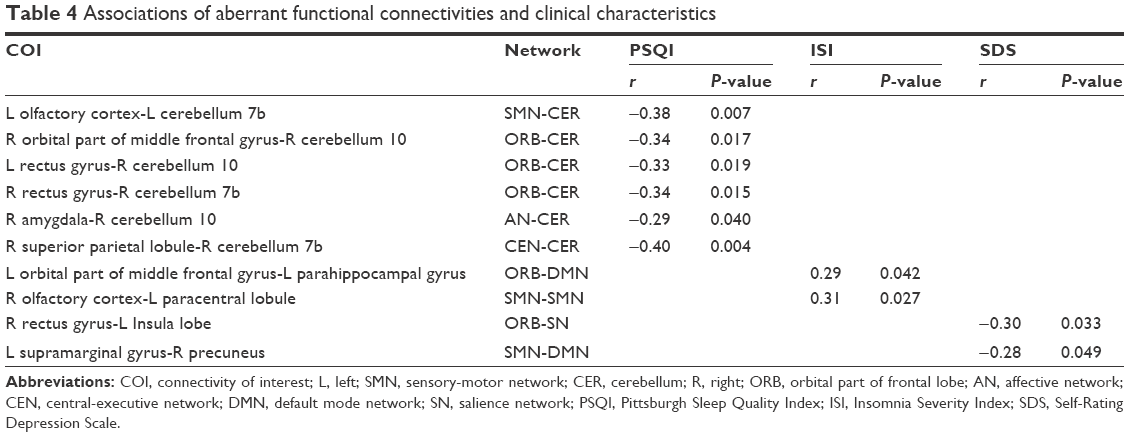 | Table 4 Associations of aberrant functional connectivities and clinical characteristics |
Discussion
The current study investigated the whole-brain functional connectivity in patients with insomnia and healthy controls. The most interesting finding is global distribution of these abnormal functional connectivities throughout the entire brain of insomnia patients. Regions that relate to wakefulness, emotion, worry/rumination, saliency/attention, and sensory-motor showed increased positive connectivity with each other; however, regions that often restrain each other, such as SN with DMN and pallidum with thalamus, showed decreased positive connectivity in patients with insomnia. These increased or decreased positive connectivity may contribute to hyperarousal in patients with insomnia.
We should note that the results of our study should be regarded as descriptive. Since there are so many comparisons (116×115/2=6,670), correction for multiple comparisons may make most of the differences not statistically significant. However, from the perspective of the whole brain, this study offers a descriptive representation of the global distribution of the abnormal connectivity in patients with insomnia.
Although the neural mechanisms of insomnia are largely unknown, the most compelling hypothesis that explains insomnia is hyperarousal hypothesis.19 According to this hypothesis, insomnia patients commonly show increased glucose metabolism in multiple brain areas29 and elevated energy requirements in the whole gray matter.30 Consistent with previous studies and as complementary, our study expalins the hyperarousal hypothesis in the level of the whole-brain functional connectivity.
In the current study, we tended to interpret increased positive connectivity among regions in patients with insomnia as function strengthening, while interpreting decreased positive connectivity among regions in patients with insomnia as function disinhibition. Both function strengthening and function disinhibiting may cause hyperarousal in patients with insomnia. To be specific, increased positive connectivity was mainly between DMN, SN, and SUB (bilateral putamen) and SMN and ORB, between AN (right amygdala) and ORB and SMN and CER, and between SMN and CER. It is not difficult to see that the aforementioned networks and SUB are closely associated with wakefulness (putamen),31 self-referential processing, introspection, worry and rumination (DMN),32,33 saliency, switching, attention and control (SN),34 emotion (amygdala, ORB),35,36 and sensory-motor (SMN). Consequently, it is very possible that increased positive connectivity indicates that these networks promote each other, resulting in hyperemotion, hypersensorimotor, and finally hyperarousal, which is in line with hyperarousal hypothesis.19 Our speculations were also partially supported by previous studies that found emotion impairment in insomnia patients37,38 as well as our correlation analyses that several increased connectivities were associated with depressive emotion, severity of insomnia, and sleep quality.
However, temporal coupling between left pallidum and right thalamus and between SN and DMN showed decreased positive connectivity. An important function of the external pallidum was promoting sleep31 through inhibiting pyramidal cells. Animal studies have shown that rats with cell body-specific lesioning of the external pallidum lead to a dramatic increase in total wakefulness and pronounced fragmentation of non-rapid eye movement sleep and wakefulness. Interestingly, however, the thalamus is responsible for promoting wakefulness and is a component of the ascending reticular activating system.39 Thus, decreased positive connectivity between these 2 SUB may indicate that the mutual inhibited effect between the 2 SUB has been compromised, which may result in decreased suppression of the thalamus during sleep, causing insomnia. We also detected decreased positive connectivity between SN and DMN. One key function of SN was switching between DMN and CEN by deactivating DMN and activating CEN.34 Weakened association between SN and DMN in patients with insomnia indicated that the deactivating effect of SN on DMN is diminished, resulting in hyperactivity of DMN. Taking into account the functions of DMN,32,33 weakened association between SN and DMN may underpin the high levels of self-referential processing, introspection, worry, and rumination in patients with insomnia.18
Limitations
Our study had some limitations. First, in addition to correlation coefficient, there are many indexes to measure functional connectivity and network properties, including degree, clustering coefficient, lengths of paths, and so on. Further studies could use more indexes to investigate neural mechanism in insomnia. Second, although we found aberrant functional connectivity in patients with insomnia, we did not know the direction of the functional connectivity, which needs further study with Granger causality analysis or other methods. Third, this was a cross-sectional study, and the causal relationship between insomnia and aberrant functional connectivity remains unclear. Longitudinal studies may help to resolve the question.
Conclusion
Our findings provide evidence for aberrant functional connectivity in widespread regions in insomnia patients. Furthermore, this offers a parsimonious explanation for the hyperarousal hypothesis in the level of the whole-brain functional connectivity.
Acknowledgments
The current study was funded by the National Natural Science Foundation of China (Grant No: 81471639), the Science and Technology Foundation of Guangzhou City (Grant No: 201607010056), and the Natural Science Foundation of Guangdong Province (Grant No: 2015A030313723).
Disclosure
The authors report no conflicts of interest in this work.
References
Morin CM, Benca R. Chronic insomnia. Lancet. 2012;379(9821):1129–1141. | ||
American Psychiatric Association. Diagnostic and statistical manual of mental disorders. DSM-IV. 4th ed. Washington, DC: American Psychiatric Association; 1994:866. | ||
Morin CM, Drake CL, Harvey AG, et al. Insomnia disorder. Nat Rev Dis Primers. 2015;1:15026. | ||
Dai XJ, Nie X, Liu X, et al. Gender differences in regional brain activity in patients with chronic primary insomnia: evidence from a resting-state fMRI study. J Clin Sleep Med. 2016;12(3):363–374. | ||
Li C, Ma X, Dong M, et al. Abnormal spontaneous regional brain activity in primary insomnia: a resting-state functional magnetic resonance imaging study. Neuropsychiatr Dis Treat. 2016;12:1371–1378. | ||
Liu CH, Liu CZ, Zhang J, et al. Reduced spontaneous neuronal activity in the insular cortex and thalamus in healthy adults with insomnia symptoms. Brain Res. 2016;1648(Pt A):317–324. | ||
Riemann D, Spiegelhalder K, Feige B, et al. The hyperarousal model of insomnia: a review of the concept and its evidence. Sleep Med Rev. 2010;14(1):19–31. | ||
Spiegelhalder K, Regen W, Baglioni C, Nissen C, Riemann D, Kyle SD. Neuroimaging insights into insomnia. Curr Neurol Neurosci Rep. 2015;15(3):9. | ||
Wang T, Li S, Jiang G, et al. Regional homogeneity changes in patients with primary insomnia. Eur Radiol. 2016;26(5):1292–1300. | ||
Barkhof F, Haller S, Rombouts SA. Resting-state functional MR imaging: a new window to the brain. Radiology. 2014;272(1):29–49. | ||
Liu F, Guo W, Fouche JP, et al. Multivariate classification of social anxiety disorder using whole brain functional connectivity. Brain Struct Funct. 2015;220(1):101–115. | ||
Raichle ME, MacLeod AM, Snyder AZ, Powers WJ, Gusnard DA, Shulman GL. A default mode of brain function. Proc Natl Acad Sci U S A. 2001;98(2):676–682. | ||
Seeley WW, Menon V, Schatzberg AF, et al. Dissociable intrinsic connectivity networks for salience processing and executive control. J Neurosci. 2007;27(9):2349–2356. | ||
Chen MC, Chang C, Glover GH, Gotlib IH. Increased insula coactivation with salience networks in insomnia. Biol Psychol. 2014;97:1–8. | ||
Huang Z, Liang P, Jia X, et al. Abnormal amygdala connectivity in patients with primary insomnia: evidence from resting state fMRI. Eur J Radiol. 2012;81(6):1288–1295. | ||
Li Y, Wang E, Zhang H, et al. Functional connectivity changes between parietal and prefrontal cortices in primary insomnia patients: evidence from resting-state fMRI. Eur J Med Res. 2014;19:32. | ||
Nie X, Shao Y, Liu SY, et al. Functional connectivity of paired default mode network subregions in primary insomnia. Neuropsychiatr Dis Treat. 2015;11:3085–3093. | ||
Regen W, Kyle SD, Nissen C, et al. Objective sleep disturbances are associated with greater waking resting-state connectivity between the retrosplenial cortex/hippocampus and various nodes of the default mode network. J Psychiatry Neurosci. 2016;41(5):295–303. | ||
Bonnet MH. Hyperarousal and insomnia. Sleep Med Rev. 2010;14(1):33. | ||
Sheehan DV, Lecrubier Y, Sheehan KH, et al. The Mini-International Neuropsychiatric Interview (M.I.N.I.): the development and validation of a structured diagnostic psychiatric interview for DSM-IV and ICD-10. J Clin Psychiatry. 1998;59(Suppl 20):22–33;quiz 34–57. | ||
Buysse DJ, Reynolds CF 3rd, Monk TH, Berman SR, Kupfer DJ. The Pittsburgh Sleep Quality Index: a new instrument for psychiatric practice and research. Psychiatry Res. 1989;28(2):193–213. | ||
Bastien CH, Vallières A, Morin CM. Validation of the Insomnia Severity Index as an outcome measure for insomnia research. Sleep Med. 2001;2(4):297–307. | ||
Zung WW. A rating instrument for anxiety disorders. Psychosomatics. 1971;12(6):371–379. | ||
Faravelli C, Albanesi G, Poli E. Assessment of depression: a comparison of rating scales. J Affect Disord. 1986;11(3):245–253. | ||
Achard S, Salvador R, Whitcher B, Suckling J, Bullmore E. A resilient, low-frequency, small-world human brain functional network with highly connected association cortical hubs. J Neurosci. 2006;26(1):63–72. | ||
Zhang Z, Liao W, Chen H, et al. Altered functional-structural coupling of large-scale brain networks in idiopathic generalized epilepsy. Brain. 2011;134(Pt 10):2912–2928. | ||
Saad ZS, Gotts SJ, Murphy K, et al. Trouble at rest: how correlation patterns and group differences become distorted after global signal regression. Brain Connect. 2012;2(1):25–32. | ||
Tzourio-Mazoyer N, Landeau B, Papathanassiou D, et al. Automated anatomical labeling of activations in SPM using a macroscopic anatomical parcellation of the MNI MRI single-subject brain. Neuroimage. 2002;15(1):273–289. | ||
Nofzinger EA, Buysse DJ, Germain A, Price JC, Miewald JM, Kupfer DJ. Functional neuroimaging evidence for hyperarousal in insomnia. Am J Psychiatry. 2004;161(11):2126–2128. | ||
Harper DG, Plante DT, Jensen JE, et al. Energetic and cell membrane metabolic products in patients with primary insomnia: a 31-phosphorus magnetic resonance spectroscopy study at 4 tesla. Sleep. 2013;36(4):493–500. | ||
Lazarus M, Chen JF, Urade Y, Huang ZL. Role of the basal ganglia in the control of sleep and wakefulness. Curr Opin Neurobiol. 2013;23(5):780–785. | ||
Hamilton JP, Furman DJ, Chang C, Thomason ME, Dennis E, Gotlib IH. Default-mode and task-positive network activity in major depressive disorder: implications for adaptive and maladaptive rumination. Biol Psychiatry. 2011;70(4):327–333. | ||
Servaas MN, Riese H, Ormel J, Aleman A. The neural correlates of worry in association with individual differences in neuroticism. Hum Brain Mapp. 2014;35(9):4303–4315. | ||
Menon V, Uddin LQ. Saliency, switching, attention and control: a network model of insula function. Brain Struct Funct. 2010;214(5–6):655–667. | ||
Davis M, Whalen PJ. The amygdala: vigilance and emotion. Mol Psychiatry. 2001;6(1):13–34. | ||
Milad MR, Rauch SL. The role of the orbitofrontal cortex in anxiety disorders. Ann N Y Acad Sci. 2007;1121:546–561. | ||
Yoo SS, Gujar N, Hu P, Jolesz FA, Walker MP. The human emotional brain without sleep – a prefrontal amygdala disconnect. Curr Biol. 2007;17(20):R877–R878. | ||
Kirov R, Brand S, Kolev V, Yordanova J. The sleeping brain and the neural basis of emotions. Behav Brain Sci. 2012;35(3):155–156. | ||
Saper CB, Fuller PM, Pedersen NP, Lu J, Scammell TE. Sleep state switching. Neuron. 2010;68(6):1023–1042. | ||
Xia M, Wang J, He Y. BrainNet Viewer: a network visualization tool for human brain connectomics. PLoS One. 2013;8(7):e68910. |
Supplementary material
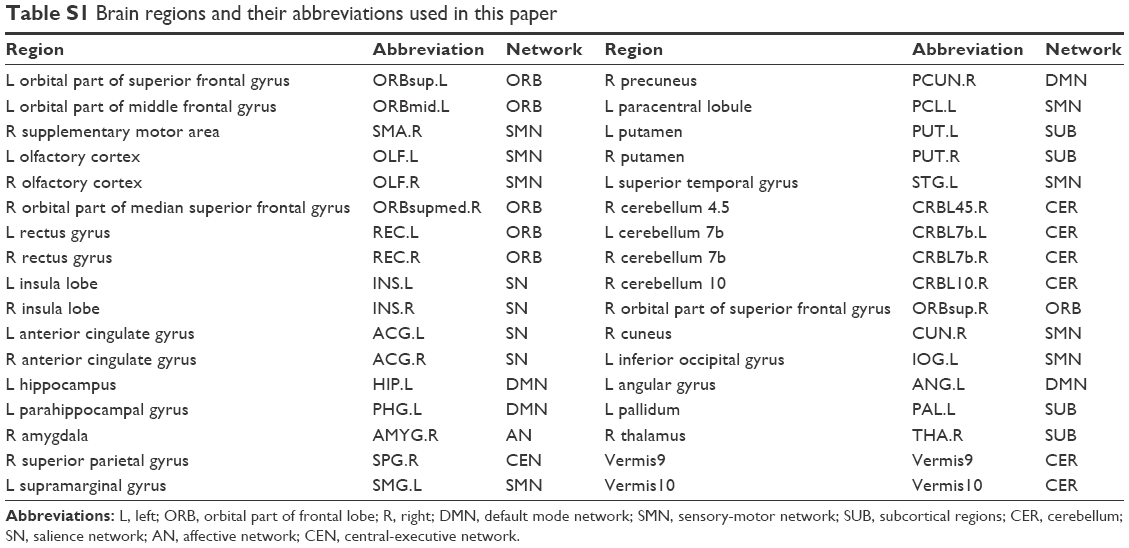 | Table S1 Brain regions and their abbreviations used in this paper |
 © 2017 The Author(s). This work is published and licensed by Dove Medical Press Limited. The
full terms of this license are available at https://www.dovepress.com/terms
and incorporate the Creative Commons Attribution
- Non Commercial (unported, 3.0) License.
By accessing the work you hereby accept the Terms. Non-commercial uses of the work are permitted
without any further permission from Dove Medical Press Limited, provided the work is properly
attributed. For permission for commercial use of this work, please see paragraphs 4.2 and 5 of our Terms.
© 2017 The Author(s). This work is published and licensed by Dove Medical Press Limited. The
full terms of this license are available at https://www.dovepress.com/terms
and incorporate the Creative Commons Attribution
- Non Commercial (unported, 3.0) License.
By accessing the work you hereby accept the Terms. Non-commercial uses of the work are permitted
without any further permission from Dove Medical Press Limited, provided the work is properly
attributed. For permission for commercial use of this work, please see paragraphs 4.2 and 5 of our Terms.