Back to Journals » Nature and Science of Sleep » Volume 14
Abnormal Spontaneous Brain Activity and Cognitive Impairment in Obstructive Sleep Apnea
Authors Xie W, Shu Y, Liu X, Li K, Li P, Kong L, Yu P, Huang L, Long T, Zeng L ![]() , Li H
, Li H ![]() , Peng D
, Peng D
Received 29 May 2022
Accepted for publication 28 August 2022
Published 5 September 2022 Volume 2022:14 Pages 1575—1587
DOI https://doi.org/10.2147/NSS.S376638
Checked for plagiarism Yes
Review by Single anonymous peer review
Peer reviewer comments 4
Editor who approved publication: Prof. Dr. Ahmed BaHammam
Wei Xie,1 Yongqiang Shu,1 Xiang Liu,1 Kunyao Li,1 Panmei Li,1 Linghong Kong,1 Pengfei Yu,2 Ling Huang,1 Ting Long,1 Li Zeng,1 Haijun Li,1,3 Dechang Peng1,3
1Medical Imaging Center, The First Affiliated Hospital of Nanchang University, Nanchang, People’s Republic of China; 2Big Data Research Center, The Second Affiliated Hospital of Nanchang University, Nanchang, People’s Republic of China; 3PET Center, The First Affiliated Hospital of Nanchang University, Nanchang, People’s Republic of China
Correspondence: Dechang Peng; Haijun Li, The First Affiliated Hospital of Nanchang University, No. 17, Yongwai Zheng Street, Donghu District, Nanchang City, Jiangxi Province, 330006, People’s Republic of China, Tel +86 79186427560 ; +86 18970025300, Email [email protected]; [email protected]
Purpose: This study aimed to explore the alterations in spontaneous brain activity in obstructive sleep apnea (OSA) using percent amplitude of fluctuation (PerAF) and investigate the relationship between abnormal spontaneous brain activity and cognitive impairment in OSA.
Patients and Methods: Overall, 52 patients with moderate to severe OSA and 61 healthy controls (HCs) were eventually enrolled in this study. All participants underwent resting-state functional magnetic resonance (rs-fMRI) and T1-weighted imaging. The PerAF was calculated and compared between patients with OSA and HCs, with voxel level P < 0.001 and cluster level P < 0.05 corrected with Gaussian Random Field was be considered statistically different. A partial correlation analysis was used to assess the relationship between altered PerAF and clinical assessments in patients with OSA.
Results: Compared to HCs, patients with OSA had significantly lower PerAF values in the right rectal gyrus and left superior frontal gyrus, but higher PerAF values in the right cerebellum posterior lobe and left middle frontal gyrus. The PerAF values of some specific regions in patients with OSA correlated with sleep efficiency and Montreal Cognitive Assessment scores. Additionally, support vector machine analysis showed that PerAF values in all differential brain regions could differentiate patients with OSA from HCs with good accuracy.
Conclusion: Specific brain areas in OSA patients may exhibit aberrant neuronal activity, and these anomalies may be linked to decreased cognitive performance. This discovery offers fresh perspectives on these patients’ neurocognition.
Keywords: cerebellum, cognitive function, frontal lobe, functional magnetic resonance imaging, percent amplitude of fluctuation
Introduction
Obstructive sleep apnea (OSA) is a common sleep breathing disease marked by repeated, brief, and reversible constriction or obstruction of the upper airway, resulting in recurrent hypotonia, hypoxemia, and sleep fragmentation. The prevalence of OSA among women and men aged 30–49 and 50–70 years is estimated to be 3% and 10%, and 9% and 17%, respectively; these numbers increase with age and body weight.1,2 Previous studies have revealed that not only is OSA associated with a higher risk of motor vehicle accidents, but it also results in depression and cognitive impairment.3,4 Additionally, OSA has also been linked to cognitive abnormalities in attention, executive function, episodic memory, visuospatial and constructive abilities, and psychomotor speed; however, language skills deficits are infrequent.5,6 Cognitive dysfunction associated with OSA is mainly mild cognitive impairment (MCI).7 Combining information from previous investigations on the connection between OSA and MCI revealed that patients with moderate to severe OSA had a prevalence of MCI more than 70% and that, in MCI, all MoCA total scores were decreased except for orientation.7,8 OSA is considered a risk factor for dementia because MCI has a high probability of progressing to dementia.9,10
While the particular cognitive abnormalities in OSA are becoming apparent, the fundamental processes of OSA-related poor cognition remain unknown. Hypoxia, hypercarbia, and sleep disturbance are the primary theoretical frameworks for cognitive damage.4,11 The evidence for these processes, however, is mixed. In a previous study, a framework was proposed to characterize the fundamental pathophysiological processes behind these relationships, such as hypoperfusion, endothelial dysfunction, and neuroinflammation.5 Intermittent hypoxia is important in the initiation and amplification of these pathological processes. Another study showed that OSA is linked to poor verbal episodic memory and microvascular damage in older adults with depression and cognitive impairments.12 Furthermore, neuroimaging studies suggest that cognitive impairment in patients with OSA is associated with reduced fractional anisotropy values in the frontal lobe of the right uncinate fasciculus;13 however, the specific association between the altered neuroimaging findings in OSA and cognitive impairment remain unclear.
Resting-state functional magnetic resonance imaging (fMRI) is a method that measures spontaneous low-frequency fluctuations in blood oxygen level-dependent (BOLD) signals when investigating the functional architecture of the brain.14 In recent years, rs-fMRI has become a key component in the investigation of neurocognitive and psychiatric behavior, and it has been used in various disorders, including schizophrenia and Alzheimer’s disease.15,16 Using resting-state fMRI, several studies have shown that patients with OSA demonstrate defects in resting-state functional connectivity (FC). In a previous study, the thalamus, para-hippocampal gyrus, medial and superior temporal gyrus, insula, and posterior cingulate cortex revealed a disturbed FC, whereas the left and right caudate nuclei showed an impaired FC with the bilateral inferior frontal gyrus and right angular gyrus.17 This suggested that impaired hippocampal–cortical function may underlie depression and anxiety among patients with OSA, whereas impaired caudate–cortical function may indicate deficits in reward processing and cognition. Correspondingly, a previous study has revealed that the bilateral insular lobes, right thalamus, and right anterior cingulate gyrus had considerably lower FC, whereas the right superior and middle temporal gyrus, left posterior cingulate gyrus, and left angular gyrus had significantly higher FC.18 This indicated that abnormalities in the FC of the hippocampal network could be a potential biomarker of neurocognitive dysfunction in OSA. Based on these findings, OSA may be associated with an abnormal resting-state FC between different brain regions, such as the default mode network (DMN), hippocampus, and insula; however, the region responsible for the observed abnormal connectivity remains unclear. Our previous studies revealed that patients with OSA exhibit altered spontaneous brain activity, especially altered regional homogeneity (ReHo) values, in the frontal lobes and DMN.19,20 However, these results were not always consistent. The location of aberrant regional spontaneous brain activity in patients with OSA during the resting state and its correlations with behavioral performance are critical.
The percent amplitude of fluctuation (PerAF) is a new method of fMRI analysis. Rather than detecting BOLD signals at the voxel level, the PerAF measures the percentage of BOLD fluctuations compared to the average BOLD signal intensity at each time point and averages these across the whole time series, directly indicating the resting state of BOLD signal fluctuations.21 PerAF values are less influenced by signal intensity mistakes, as they do not contain arbitrary units and are not affected by the original signal. Hence, they are more accurate than other magnetic resonance imaging (MRI) analysis methods, such as amplitude of low-frequency fluctuation (ALFF), ReHo, and degree centrality, and are more suitable for subsequent statistical analysis.14,22,23 Furthermore, because there is no confounding effect of voxel-specific fluctuation amplitudes in the low-frequency fluctuation amplitude method, PerAF can be used for population statistical analysis.21 PerAF is a potential approach for analyzing spontaneous BOLD activity because it can assess changes in brain activity at the voxel level with excellent accuracy and efficiency. Recently, PerAF has been utilized extensively to investigate brain diseases with potential functional alterations, including Moyamoya disease, type 2 diabetes mellitus, and nocturnal enuresis.24–26 However, no studies related to PerAF have been performed to explore spontaneous brain activity in OSA.
Based on the above, we hypothesized that patients with OSA exhibit abnormalities in the percentage amplitude of spontaneous brain activity oscillations, which are associated with the cognitive function. To identify the deficient domains of neurocognition and particular brain regions with aberrant PerAF in patients with OSA, we first evaluated differences in neurocognitive performance and PerAF between patients with OSA and healthy controls (HCs). Following that, we explored the connection between changed PerAF values in specific brain areas and the severity of OSA and cognitive impairment in patients. Finally, we employed a support vector machine (SVM) to determine if changed PerAF in these brain areas might be used to distinguish patients with OSA from HCs. Our results may be a step forward to determine the relationship between abnormal spontaneous brain activity and cognitive impairment in OSA and to provide potential imaging indicators for better understanding and treatment of this neurological and sleep disorder.
Materials and Methods
Participants
A total of 53 male patients newly diagnosed with OSA and 63 HCs with similar age, gender and education were included in this study. 52 patients with moderate to severe OSA and 61 healthy controls (HCs) were eventually enrolled in this study. 1 OSA patient and 2 HCs were excluded because of suboptimal quality of imaging data. The HCs group was recruited through community advertisements. All patients with OSA were recruited from the sleep monitoring room at the Department of Otolaryngology or Respiratory Department of the First Affiliated Hospital of Nanchang University. The patients were diagnosed in accordance with the diagnostic criteria from the Clinical Practice Guidelines for Obstructive Sleep Apnea Syndrome in Adults proposed by the American Academy of Sleep Medicine in 2017.27 Patients with moderate to severe OSA (apnea hypoventilation index [AHI] ≥15) were included in this study. All participants were male, right-handed, native Chinese speakers aged 18–65 years. The exclusion criteria for all participants were as follows: (1) sleep disorders other than OSA; (2) history of cardiovascular disease, respiratory disease, diabetes, hypothyroidism, or central nervous system disease (including neurodegenerative disease, epilepsy, depression, tumors, traumatic brain injury, or infarction); (3) alcohol or illicit drug abuse or current intake of psychotropic medications; (4) MRI contraindications such as claustrophobia, metallic implants, or cardiac pacemakers; and (5) suboptimal quality of imaging data. 1 OSA patient and 2 HCs were excluded because of these. Additionally, the HCs had no current or lifetime history of sleep-related disorders and no history of psychiatric, mood, or sleep-related disorders in first-degree relatives. This study adhered to the principles of the Declaration of Helsinki, and it was approved by the Medical Ethics Committee of the First Affiliated Hospital of Nanchang University [2020 (94)]. All participants signed a written informed consent form for this study.
Polysomnography (PSG)
For an accurate diagnosis while ruling out sleep breathing disorders or underlying sleep disorders other than OSA, all HCs and patients with OSA were required to undergo nocturnal PSG using a Respironics LE series physiological monitoring system (Respironics Alice 5 LE, Orlando, FL, USA). A sleep specialist guides the patient through the sleep test and analyzes and interprets the results recorded by the machine with reliable results. The day before PSG, all participants were asked to avoid taking hypnotics, alcoholic beverages, and coffee. PSG was performed from 10 pm to 6 am the following day. The PSG monitor assessed standard electroencephalogram (EEG)-derived values F4/M1, C4/M1, and O2/M1 from the frontal, central, and occipital regions, as well as alternate-derived values F3/M2, C3/M2, and O1/M2. Additionally, the PSG obtained electrooculograms from the cornea and retina, obtained a chin electromyogram from chin electrodes; obtained an electrocardiogram, determined the body position, monitored chest and abdominal respiratory movements, measured oral and nasal airflow, detected snoring, and measured oxyhemoglobin saturation (SaO2). The total sleep time, sleep latency, sleep efficiency, sleep stages, awakenings, and respiratory events were recorded. OSA was defined as a sustained decrease in airflow of ≥90% for ≥10 s accompanied by significant respiratory effort. Hypoventilation was defined as either a ≥30% decrease in airflow for ≥10 s accompanied by ≥4% oxyhemoglobin desaturation, or a ≥50% sustained decrease in airflow for ≥10 s accompanied by ≥3% oxyhemoglobin desaturation, or EEG arousal. The AHI was obtained from the total number of apnea and hypoventilation events per hour during sleep. According to the Clinical Practice Guidelines for Adult Obstructive Sleep Apnea Syndrome proposed by the American Academy of Sleep Medicine,28 AHI from 5 to 15/h, ≥15/h and <30/h, and ≥30/h were considered as mild, moderate, and severe OSA, respectively.
Neuropsychological Assessments
All participants completed neuropsychological assessments, including the Montreal Cognitive Assessment (MoCA) and Epworth Sleepiness Scale (ESS). The ESS is a simple self-assessment questionnaire for daytime sleepiness that includes eight different conditions, each with a score of 0 to 3, a total score of 0 to 24, and scores of 0, 6, 11, and 16 corresponding to four different sleep levels.29 The MoCA was used to assess cognitive function, which included executive function, orientation, abstraction, attention, computation, conceptual thinking, language, and memory.30 A MoCA score of <26 points indicates MCI; otherwise, cognitive function is normal.31
MRI Data Acquisition
All images were acquired using a 3.0 Tesla MRI system (Siemens, Munich, Germany) with an 8-channel phased-array head coil. First, conventional axial T2-weighted imaging (repetition time [TR] = 4000 ms, echo time [TE] = 113 ms, thickness = 5 mm, gap = 1.5 mm, field of view [FOV] = 220 mm × 220 mm, slice = 19) and axial T1-weighted imaging (TR = 250 ms, TE = 2.46 ms, thickness = 5 mm, gap = 1.5 mm, FOV = 220 mm × 220 mm, slice size = 19) were performed. High-resolution three-dimensional (3D) T1-weighted images were then obtained using a brain volume sequence (TR = 1900 ms, TE = 2.26 ms, thickness = 1.0 mm, gap = 0.5 mm, FOV = 250 mm × 250 mm, matrix = 256 × 256, flip angle = 9°, 176 sagittal slices). Finally, the rs-fMRI data were collected using an echo-planar imaging sequence with the following parameters: TR = 2000 ms, TE = 30 ms, flip angle = 90°, FOV = 230 mm × 230 mm, matrix = 64, thickness = 4 mm, gap = 1.2 mm. Each brain volume consisted of 30 axial sections, and each functional run consisted of 240 volumes. During the MRI scan, all participants were asked to close their eyes, remain as still as possible, not think about anything, and not fall asleep. Foam pads and earplugs were used to reduce head movement and scanner noise exposure. Two senior radiologists analyzed the images to exclude lesions and motion artifacts visible to the naked eye.
fMRI Data Preprocessing
Raw data were examined using the MRIcro software package (www.MRIcro.com) to screen out data with large or incomplete image artifacts. Data processing was based on the brain imaging toolbox SPM12 and RESTplus V1.211,21 which was run on MATLAB 2018b (MathWorks, Natick, MA, USA). First, DICOM format images, which contain important information about the left and right hemispheres, were converted to NifTI file format. The first 10 time points were removed, and the remaining 230 volumes were slice-time and 3D head motion-corrected. The slice timing is then performed. All functional data were then spatially normalized to the Montreal Neurological Institute template using the nonlinear transformation procedure of SPM1232 and resampled to 3 mm × 3 mm × 3 mm voxels. Next, linear convergence effects arising from several factors, including machine temperature and subject adaptation, were removed and smoothed using a 6-mm full width at half maximum filter. Finally, a temporal filter (0.01–0.08 Hz) was used to suppress the effects of low-frequency drift and high-frequency noise. To further reduce the effect of confounding factors, a multiple regression method was used to regress interfering signals, including those from the white matter, cerebrospinal fluid, global signal, and Friston 24-parameter head motion (six head motion parameters, six head motion parameters before a time point, and 12 corresponding squared terms).33–35
PerAF Calculation
PerAF was successively conducted based on the preprocessed images using RESTplus. The PerAF value for each voxel was calculated as follows:
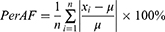

where  is the signal intensity at the
  time point,
  represents the number of time points in the series, and
  is the mean of all the values in the time series.21
Statistical Analysis
The Kolmogorov–Smirnov test was used to test the normality of the data. The IBM SPSS software (version 26.0; Chicago, IL, USA) was used to compare the differences between the HCs and OSA groups in terms of demographic and clinical data and neuropsychological assessments. For normally distributed data with homogeneity of variance, an independent two-sample t-test was performed, and the Mann–Whitney non-parametric test was utilized for the remaining data. P < 0.05 was used to determine statistical significance.
For PerAF, a two-sample t-test was applied to analyze the differences between patients with OSA and HCs using SPM12 and RESTplus V1.211, with head motion, age and years of education as covariates. Statistical thresholds were set at P < 0.001 at the voxel level and P < 0.05 at the cluster level, which were corrected using Gaussian Random Field was considered statistically different. The results were displayed using the Xjview and REST software packages.
Brain regions with significant differences based on two-sample t-tests were identified. Regions of interest (ROIs) were saved using the REST package. For each ROI, the mean PerAF was extracted. Using partial correlation analysis with BMI and years of education as covariates, mean PerAF values for aberrant brain areas were associated with clinical data in patients with OSA in SPSS 26.0. It was statistically significant at p<0.05.
Participants’ Classification with SVM
In recent years, a growing number of researchers have used multivariate pattern analysis of neuroimaging data to uncover patterns and assign individual observations to different categories.36,37 To classify the patients in this study, we employed a multivariate pattern analysis approach noted as SVM. Here, we implement the SVM algorithm under pycharm based on the sklearn library in Python. Individual rs-fMRI was considered as points located in a high-dimensional space defined by the preprocessed pictures’ PerAF values. Significant clusters from the PerAF analysis results were extracted and considered masks. This mask was applied to each preprocessed fMRI to select the normalized PerAF values as features in the modeling. The classifier created in the present study (OSA vs HCs) is based on binary SVM. A “leave-one-subject-out” approach was applied during the cross-validation process. The data were divided into two sets: a training set with samples from all participants except one, and a validation set with samples from the omitted participant. To measure the overall accuracy of SVM, this method was performed for each participant pair. The classification procedure was carried out 52 times in total.
Results
Demographics, Clinical Characteristics, and Neuropsychological Assessments
The demographic and clinical data and neuropsychological assessments of each group are summarized in Table 1. The OSA group had a significantly higher BMI than the HCs group and was younger than the HCs group. Regarding sleep-related respiratory parameters, the OSA group had higher AHI, arousal index, oxygen desaturation index, total sleep time, and N1 stage sleep, more frequently had an SaO2 <90%, significantly lower N3 + 4 state sleep, rapid eye movement (REM) sleep, mean SaO2, and nadir SaO2. Compared to HCs, patients with OSA had higher ESS scores and lower total MoCA scores. 23 patients with OSA were classified as MCI according to the total MoCA score, and the remaining 26 were cognitively normal, with MCI accounting for 44.2% of the OSA patients. Additionally, patients with OSA had poorer visual space and execution, delayed memory, language, and abstraction (Figure 1).
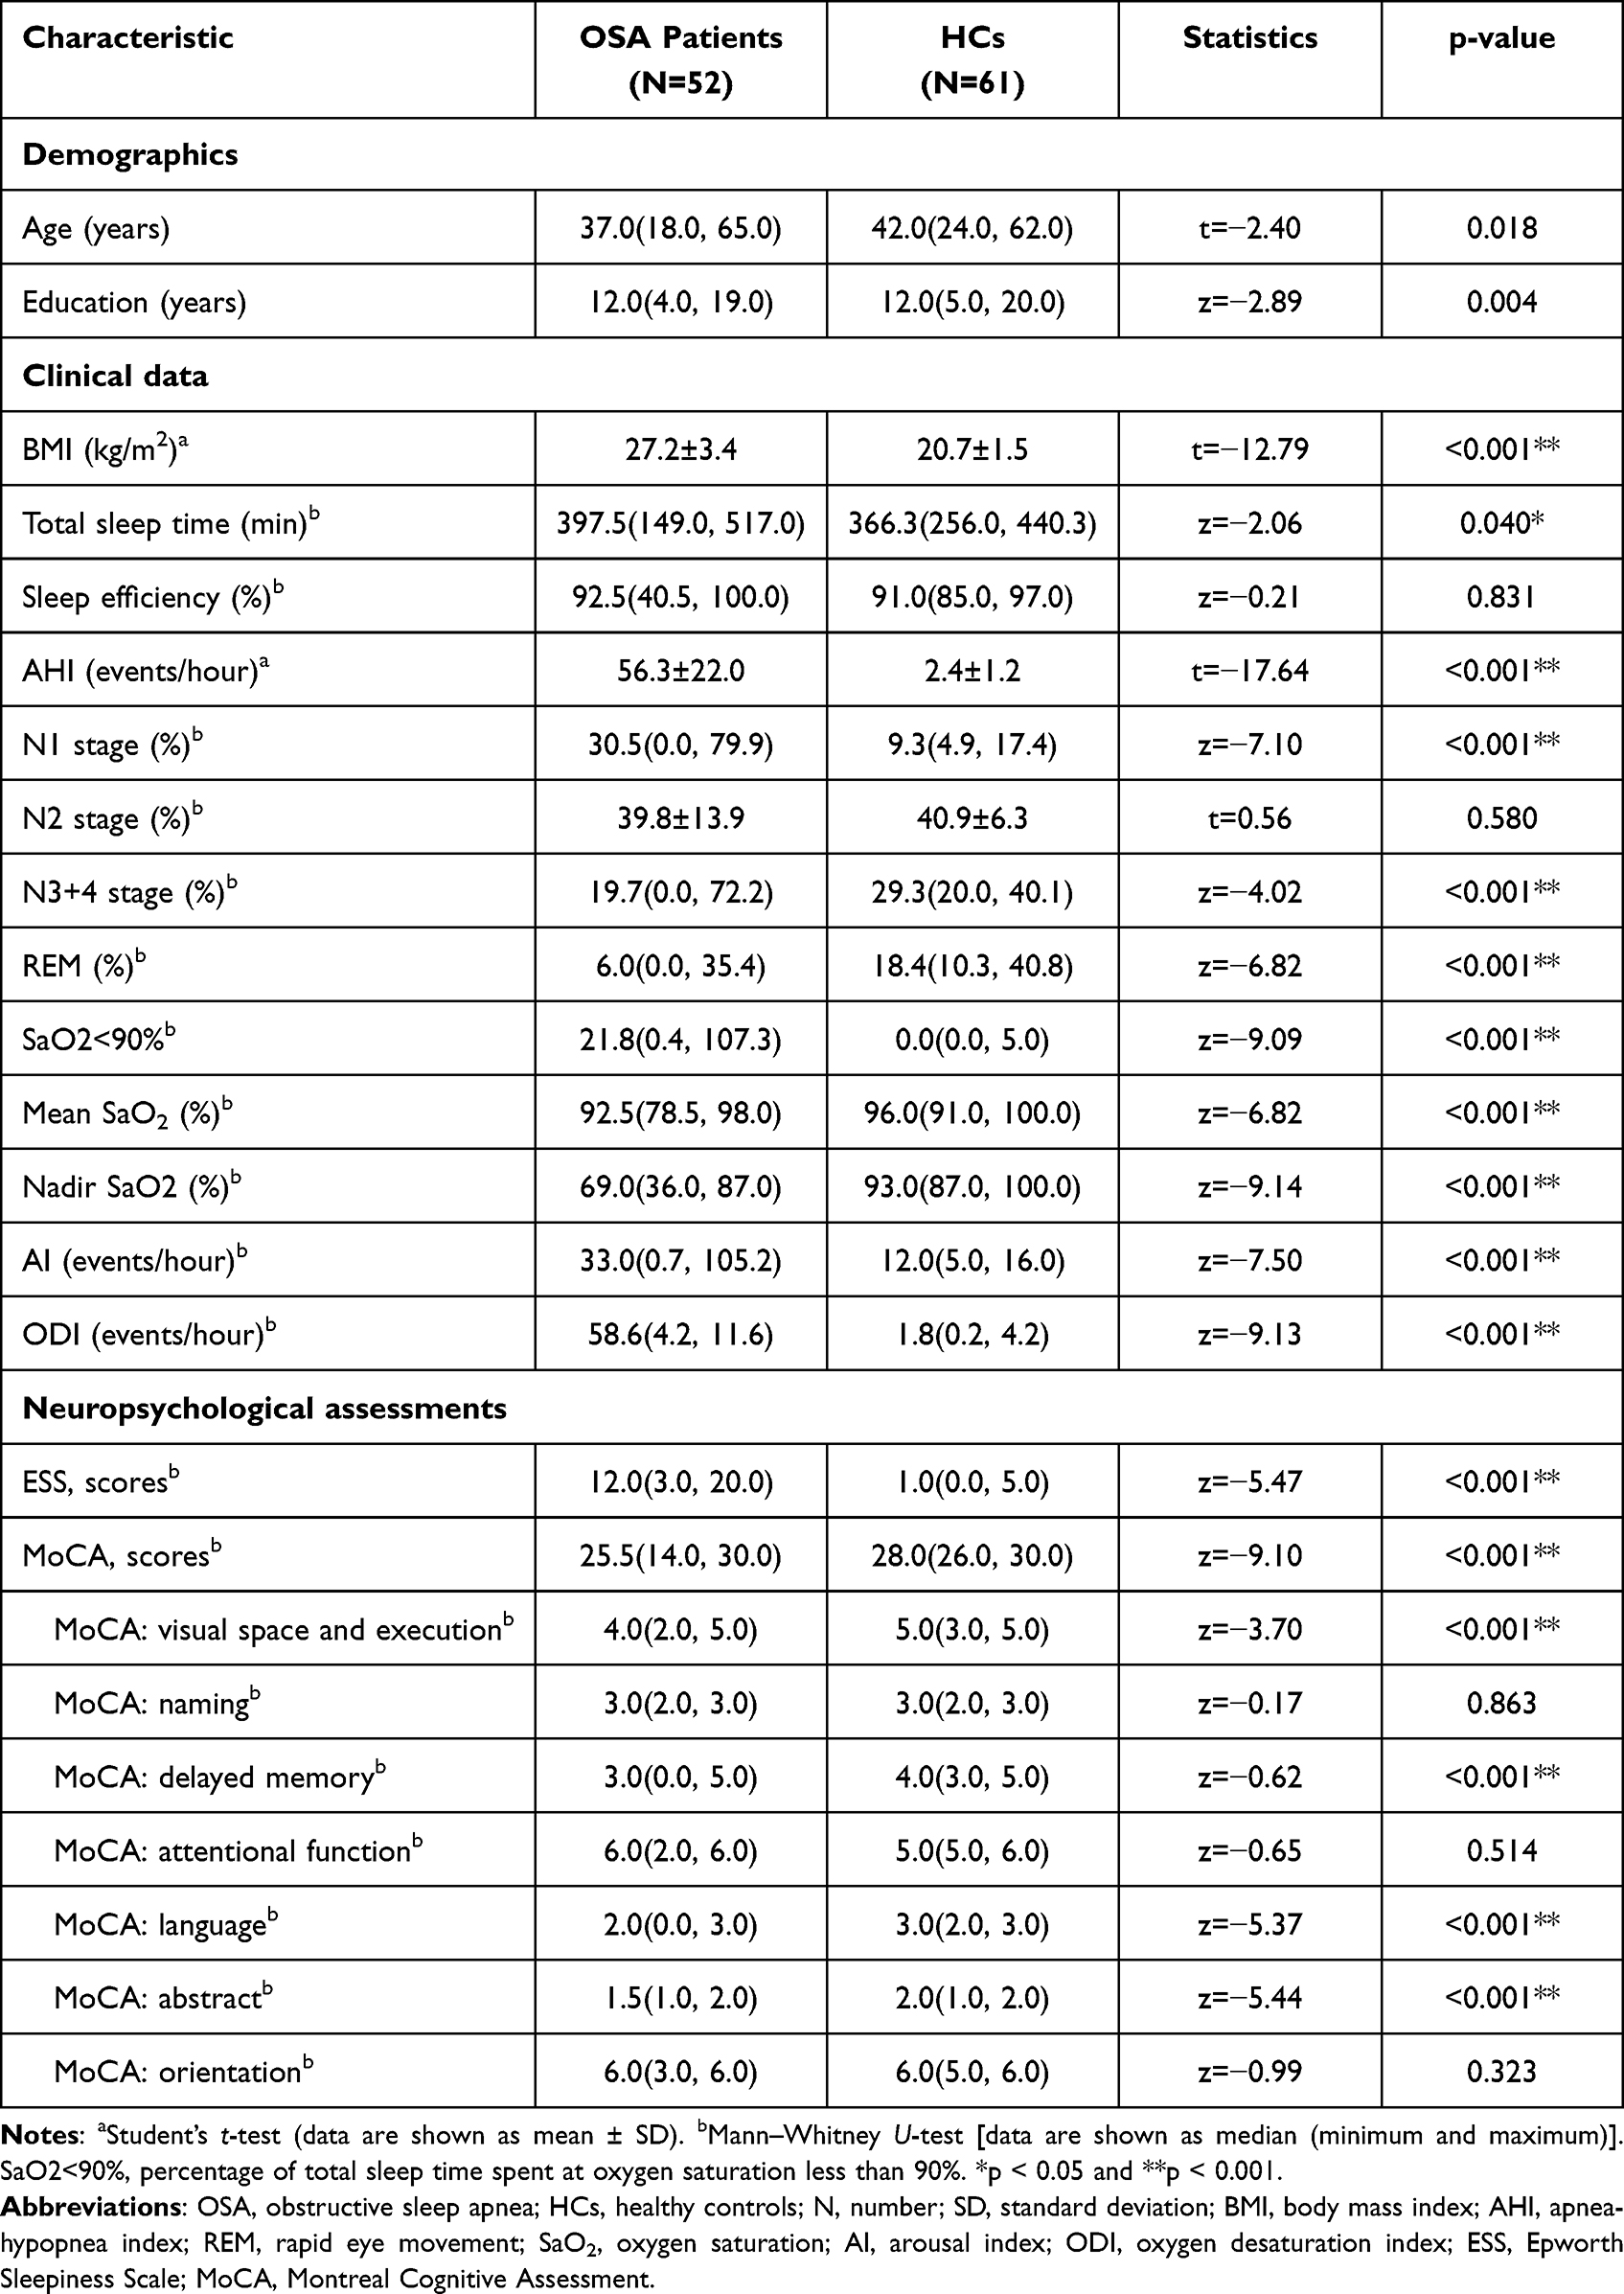 |
Table 1 Demographics, Clinical Data, Cognitive Assessment of OSA and HCs |
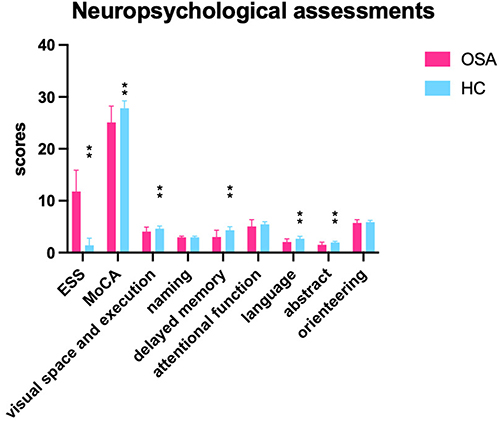 |
Figure 1 Significant differences in neurological assessment between OSA patients and HC. **Means the statistical significance p < 0.001. Abbreviations: MoCA, Montreal Cognitive Assessment; ESS, Epworth Sleepiness Scale. |
Inter-Group Differences in PerAF
Two-sample t-tests showed that the PerAF values in several brain regions were significantly different between the OSA and HC groups (Table 2). In contrast to the findings in HCs, patients with OSA had significantly lower PerAF values in the right rectal gyrus and left superior frontal gyrus but higher PerAF values in the right cerebellum posterior lobe and left middle frontal gyrus (Figure 2).
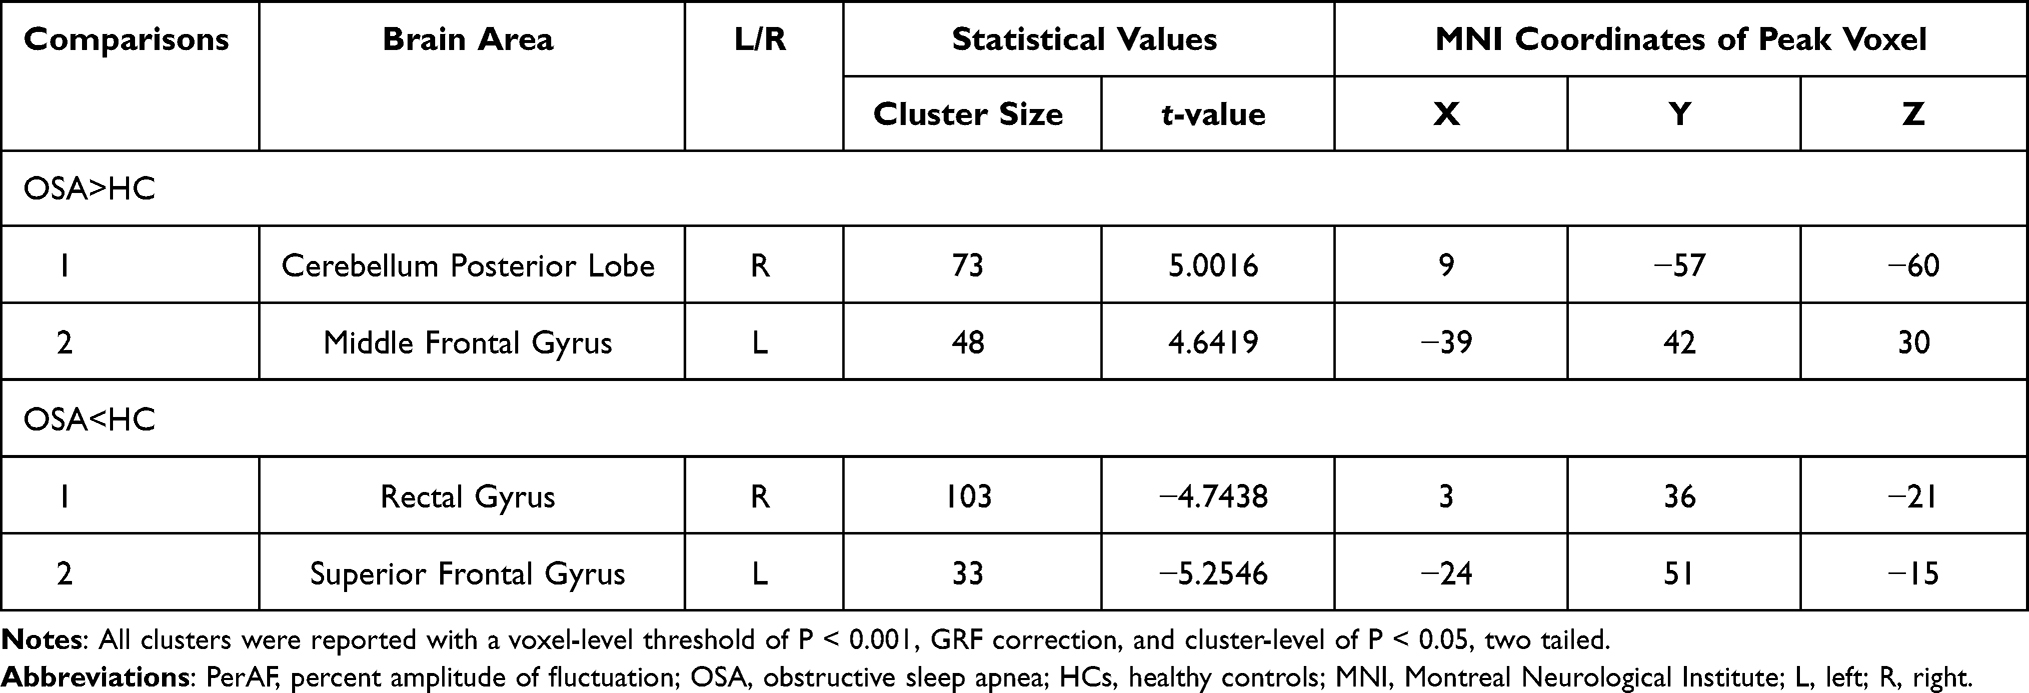 |
Table 2 Significant Difference of PerAF Between OSA Patients and HCs |
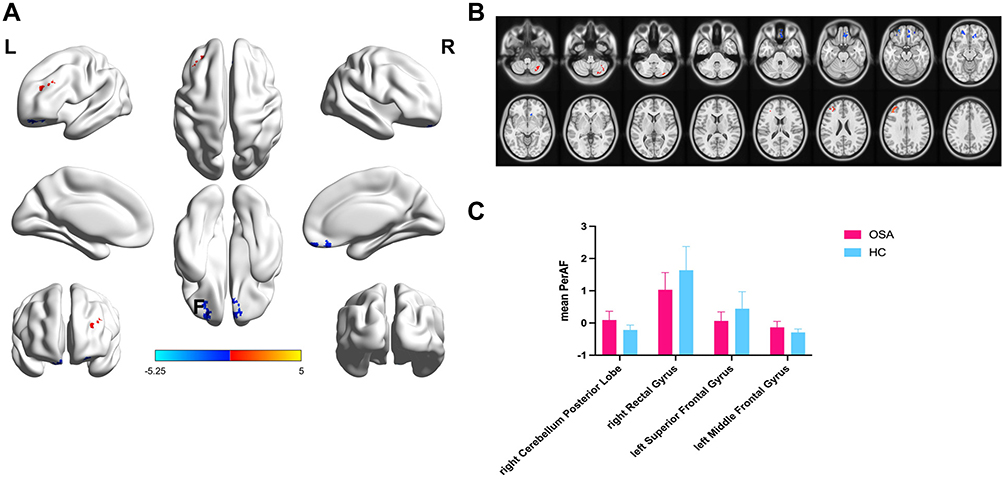 |
Figure 2 Comparison of the PerAF signal in patients OSA and HCs. (A and B) The different brain regions were observed in the right rectal gyrus, left superior frontal gyrus, right cerebellum posterior lobe and left middle frontal gyrus in the OSA group. The red areas denote higher PerAF brain regions, and the blue areas denote lower PerAF brain regions. (C) The mean PerAF values in the 2 groups. Abbreviations: OSA, obstructive sleep apnea; HCs, healthy controls; PerAF, percent amplitude of fluctuation; L, left; R, right. |
Correlations Between Alerted PerAF and Clinical Variables in Patients with OSA
We selected regions showing significant changes in the abovementioned between-group PerAF comparisons as our ROI (Table 2), and the correlations between PerAF and the clinical data were tested. In OSA patients, the PerAF value of the right rectal gyrus showed significantly positive correlations with sleep efficiency (Figure 3A). The PerAF value of the left superior frontal gyrus showed a significantly positive correlation with orientation of MoCA scores (Figure 3B).
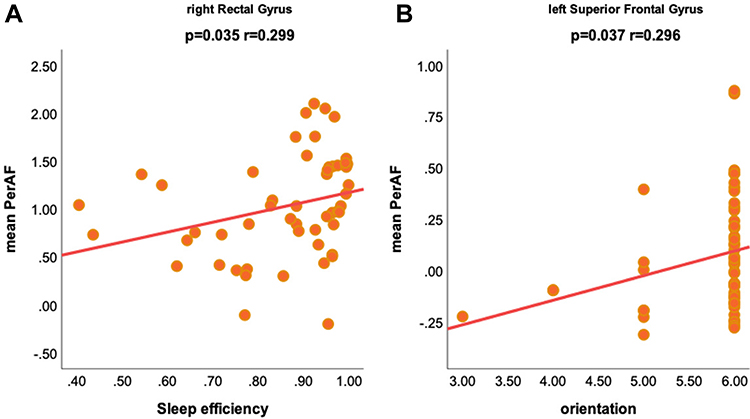 |
Figure 3 In OSA patients, there was a significant correlation between mean PerAF values with intergroup differences (OSA patients vs HCs) and clinical assessments. (A) The correlation between mean PerAF values in right Rectal Gyrus and sleep efficiency. (B) The correlation between mean PerAF values in left Superior Frontal Gyrus and orientation. Abbreviation: PerAF, percent amplitude of fluctuation. |
SVM Classification Results
PerAF in the brain regions of patients with OSA were significantly different from those in HCs. The SVM classification between the OSA and HC groups achieved a classification accuracy of 88.70% (sensitivity, 84.91%; specificity, 91.94%; AUC, 96.59%; P < 0.001) (Figure 4).
 |
Figure 4 ROC curve analysis of mean PerAF values for all differential brain areas. The AUC was 96.59%, sensitivity was 84.91%, specificity was 91.94%. Abbreviations: ROC, receiver operating characteristic; AUC, area under the ROC curve; PerAF, percentage amplitude of fluctuations. |
Discussion
In this research, we used correlation and SVM analyses to investigate the functional relevance of variations in PerAF values in the brain areas of moderate to severe OSA and HCs. The results showed that, compared with HCs, PerAF values in OSA patients were decreased in the right rectal gyrus and left superior frontal gyrus, but were increased in the right cerebellum posterior lobe and left middle frontal gyrus. These results suggest that patients with OSA not only develop specific cognitive impairments, but also have abnormal PerAF in multiple brain regions. Furthermore, abnormal PerAF values in right rectal gyrus and left superior frontal gyrus were significantly associated with the MoCA scores and sleep efficiency. Therefore, abnormal neural activity in these brain regions may be an important clue of cognitive dysfunction in patients with OSA. Additionally, SVM analysis showed that the PerAF values for all differential brain regions in these patients could be used to differentiate them from HCs with good accuracy, sensitivity, and specificity.
In this study, only male OSA patients participated, and OSA patients had a lower age and BMI than HCs. Obesity and OSA may have an effect on resting-state brain activity.38,39 However, some studies have suggested that changes in resting-state brain activity in OSA patients are caused by OSA itself rather than obesity.17,20 Nevertheless, in this study we included BMI as a covariate to mitigate its effect, and thus, we hypothesized that although there was a difference in BMI between OSA patients and healthy controls, this change was caused by OSA rather than obesity.
The present study showed that patients with OSA had higher ESS scores and lower stage 3 + 4 sleep and REM sleep, indicating that these patients are more likely to experience daytime sleepiness due to poor sleep efficiency. The MoCA scores of these patients were significantly lower than those of HCs, especially in terms of visual space and execution, delayed memory, language, and abstraction. This implies that patients with OSA may have impairments in visual space and execution, memory, language, and abstract thinking, which are in accordance with those of previous studies.4,40 A previous research showed a significant cognitive impairment in patients with OSA, especially in attention, executive function, episodic memory, and visuospatial and constructional abilities.4 In addition, the authors of another study conducted an exhaustive review of the current literature on OSA and cognitive performance, and noted that there is impairment in attention, long-term verbal and visual memory, and all aspects of executive functioning.40 Based on these studies and the results of the present study, we speculated that OSA patients may have impaired cognitive function and altered resting-state function in some brain regions.
Difference in PerAF Between Patients with OSA and HCs
The PerAF values of the left superior frontal gyrus and right rectal gyrus were significantly lower in patients with OSA, suggesting decreased spontaneous neural activity. Motor tasks, working memory, introspection, and high-order cognition are mostly promoted by the superior frontal gyrus.41 Several studies have revealed that the different parts of the superior frontal gyrus are involved in the DMN, and the cognitive control network (CCN) pins it as a point of interconnection to these two networks.41 The CCN, also known as the frontoparietal control system, facilitates executive function in a variety of domains.42 The DMN is hypothesized to be involved in a variety of sophisticated cognitive tasks, including visuospatial imagery, consciousness, attention, adaptability, episodic memory, executive cognitive control, and behavioral inhibition.43,44 In a recent review, it was found that most OSA findings implicate dysfunction in the DMN and other cognitive networks.45 Additionally, another study and our previous study reported that patients with OSA showed decreased ReHo in the superior frontal gyrus that was correlated with cognitive impairment, which partially overlaps with our findings.20,46 Similar to these studies, we found that the PerAF values in the left superior frontal gyrus were positively correlated with the MoCA scores in orientation, suggesting that OSA-induced functional abnormalities in the left superior frontal gyrus may be associated with abnormalities in the DMN or other cognitive networks, and the exact association is yet to be further confirmed.
The role of the rectal gyrus in patients with OSA is unclear; however, relevant studies suggest that reduced gray matter volume and the functional response in the orbital frontal cortex in patients with OSA may demonstrate that the orbital frontal cortex is a fragile and sensitive area in the brain.47 The orbital frontal cortex is a crucial structure that facilitates cognitive functions, integrates cognitive and emotional processes, and guides decision-making.48 Our study found that a decrease in PerAF values in the right rectal gyrus in patients with OSA was correlated with sleep efficiency, and a recent study showed that poor sleep quality and hypoxia during sleep may lead to gray matter atrophy in the orbitofrontal cortex, resulting in cognitive deficits and emotional problems in OSA patients,49 which may be associated with the degenerative process in the orbital frontal cortex of patients with OSA. However, the exact mechanism remains unclear and requires further study.
Additionally, the PerAF value of the left middle frontal gyrus was higher in patients with OSA than in HCs. The middle frontal gyrus has been associated with multiple attention-related processes, and the right middle frontal gyrus is linked to ventral attention processing and the ventral attention network (VAN), and it is conceived to operate as a bridge between the dorsal attention network (DAN) and the VAN during attention processing50 The left middle frontal gyrus, like the right middle frontal gyrus, is engaged during attention reorientation activities. The middle frontal gyrus is activated bilaterally in both the DAN and VAN, with distinct regions of the middle frontal gyrus participating in both networks.50 The VAN has been proposed to be responsible for bottom-up visual attention processing in a sensory-driven fashion, and the DAN facilitates top-down visual attention processing in a stimulus-driven manner.51 However, the relationship between the right middle frontal gyrus and cognitive function in OSA patients is unclear, but a recent study found that children with OSA showed decreased ALFF in the left middle frontal gyrus, which was significantly related to multiple sleep parameters.52 However, in the present study, we found that increased PerAF values in the left middle frontal gyrus had no statistically correlation existed with sleep characteristics or cognitive function testing. This contradiction may point to a difference in the role of middle frontal gyrus in OSA in adults and children.
According to the available evidence, the frontal lobe is the upper cortex of cognitive executive function and is involved in emotion, language, attention, working memory, problem-solving skills, impulse control, and social conduct. The impact of impaired prefrontal cortex function in cognitive impairment in schizophrenia has been reported.53,54 The prefrontal cortex and insula may be important areas in OSA and are strongly associated with disease severity.55 Taken together, we hypothesize that there is some association between the frontal lobes and cognitive function in OSA, although the exact process behind this association is not clear.
The PerAF values of the right cerebellum posterior lobe were significantly higher in patients with OSA. Cerebellar malfunction significantly affects the regulation of the sleep-wakefulness transition.56 Combined with our previous findings,20 the increase in PerAF values in the right cerebellum posterior lobe may be compensatory to hypoxia caused by sleep fragmentation. But the increased intensity of spontaneous neural activities were have no correlation with sleep characteristics and cognitive function testing in present study. The relationship between the cerebellum and cognitive function in OSA is unclear. A recent study showed that patients with OSA showed reduced FC in cerebrocerebellar connections linking different functional networks, they speculated that the cerebellum may influence cognitive function in patients with OSA by affecting the DMN and other cognitive networks.57 Our previous study found that patients with OSA exhibit FC disorders from the dorsal anterior insula to the bilateral posterior cerebellar lobes, and that the insular cortex is a cortical regulatory area involved in dyspnea and cognitive, emotional, and sensorimotor functions, this suggests that cerebellar dysfunction due to OSA may further impair cognitive function by affecting the function of the insula and its subregions.58 However, the present study did not find a correlation between changes in spontaneous activity in the posterior cerebellum and cognitive scale scores. Hence, further studies are required.
Potential Clinical Value of SVM Analysis
In the present study, we performed an SVM analysis of all differential brain regions and PerAF values in patients with OSA to investigate the possibility of using the altered PerAF values to differentiate them from HCs. The SVM analysis showed that the PerAF values in different brain regions can differentiate patients with OSA from HCs with high accuracy, sensitivity, and specificity. SVM is a promising analytical method for classifying individual observations into different groups based on high-dimensional data and has the potential to produce highly translatable results in clinical practice, both diagnostic and therapeutic.59 SVM has been applied in biomedical applications to differentiate patients from HCs in the diagnosis of various disorders, such as Alzheimer’s disease and schizophrenia.60,61 Our results showed that PerAF values in different brain regions had good accuracy, specificity, and sensitivity (>77%) for differentiating patients with OSA from HCs, suggesting that PerAF can be used as an imaging biomarker to differentiate patients with OSA from HCs.
Limitations
The present study had several limitations. First, we only investigated changes in the low-frequency amplitudes of the brain and did not explore the altered functional connectivity between regions with abnormal spontaneous brain activity and other regions. Second, due to the high BMI of OSA patients, the effect of this factor cannot be completely avoided, although we try to control it. Finally, although we told patients not to sleep before the scan and asked them if they were asleep during the scan. However, it was not possible to fully guarantee the presence of short sleep in some patients, which is a limitation of the study. In the future, we intend to refine our study by using multiple resting-state fMRI methods and to expand the sample size by including female patients. Subsequent studies will also investigate whether resting-state functional indicators can distinguish whether OSA patients have cognitive impairment.
Conclusion
Using resting-state fMRI data, we found altered spontaneous brain activity in OSA based on PerAF. The frontal lobe and cerebellum are two areas with abnormal neuronal activity in OSA. Additionally, we found that PerAF alterations in the superior frontal gyrus and rectal gyrus were correlated with the MoCA scores in OSA. This discovery may open up new avenues for research into OSA patients’ neurocognition by pointing to a connection between aberrant frontal lobe spontaneous activity and decreased cognitive performance. Furthermore, patients with OSA can be differentiated from HCs based on the PerAF values by SVM analysis.
Abbreviations
AHI, apnea hypoventilation index; ALFF, amplitude of low-frequency fluctuation; BMI, body mass index; CCN, cognitive control network; CPL, cerebellum posterior lobe; DAN, dorsal attention network; DMN, default mode network; EEG, electroencephalogram; ESS, Epworth Sleepiness Scale; FC, functional connectivity; FOV, field of view; HC, healthy controls; MCI, mild cognitive impairment; MFG, middle frontal gyrus; MoCA, Montreal Cognitive Assessment; OSA, obstructive sleep apnea; PerAF, percent amplitude of fluctuation; ReHo, regional homogeneity; REM, rapid eye movement; fMRI, functional magnetic resonance imaging; SaO2, oxyhemoglobin saturation; SVM, support vector machine; TE, echo time; TR, repetition time; VAN, ventral attention network.
Acknowledgments
This study was supported by the National Natural ScienceFoundation of China (Grant Nos. 81860307 and 81560285), Natural Science Foundation Project of Jiangxi Province, China (Grant Nos. 20202BABL216036, 20181ACB20023,), Education Department Project of Jiangxi Province, China (Grant Nos. GJJ160035 and GJJ190133), and Department of Health Project of Jiangxi Province, China (Grant No. 20181039, 202210211).
Disclosure
The authors declare no potential conflicts of interest in this work.
References
1. Veasey SC, Rosen IM, Solomon CG. Obstructive sleep apnea in adults. N Engl J Med. 2019;380(15):1442–1449. doi:10.1056/NEJMcp1816152
2. Peppard PE, Young T, Barnet JH, Palta M, Hagen EW, Hla KM. Increased prevalence of sleep-disordered breathing in adults. Am J Epidemiol. 2013;177(9):1006–1014. doi:10.1093/aje/kws342
3. Gottlieb DJ, Ellenbogen JM, Bianchi MT, Czeisler CA. Sleep deficiency and motor vehicle crash risk in the general population: a prospective cohort study. BMC Med. 2018;16(1):44. doi:10.1186/s12916-018-1025-7
4. Olaithe M, Bucks RS, Hillman DR, Eastwood PR. Cognitive deficits in obstructive sleep apnea: insights from a meta-review and comparison with deficits observed in COPD, insomnia, and sleep deprivation. Sleep Med Rev. 2018;38:39–49. doi:10.1016/j.smrv.2017.03.005
5. Kerner NA, Roose SP. Obstructive sleep apnea is linked to depression and cognitive impairment: evidence and potential mechanisms. Am J Geriatr Psychiatry. 2016;24(6):496–508. doi:10.1016/j.jagp.2016.01.134
6. Vanek J, Prasko J, Genzor S, et al. Obstructive sleep apnea, depression and cognitive impairment. Sleep Med. 2020;72:50–58. doi:10.1016/j.sleep.2020.03.017
7. Liu Y, Han J, Ning L, et al. Cognitive function and life quality of patients with moderate-to-severe obstructive sleep apnea-hypopnea syndrome in China. Expert Rev Respir Med. 2021;15(3):435–440. doi:10.1080/17476348.2021.1852081
8. Seda G, Matwiyoff G, Parrish JS. Effects of obstructive sleep apnea and CPAP on cognitive function. Curr Neurol Neurosci Rep. 2021;21(7):32. doi:10.1007/s11910-021-01123-0
9. Petersen RC, Caracciolo B, Brayne C, Gauthier S, Jelic V, Fratiglioni L. Mild cognitive impairment: a concept in evolution. J Intern Med. 2014;275(3):214–228. doi:10.1111/joim.12190
10. Pagani M, Nobili F, Morbelli S, et al. Early identification of MCI converting to AD: a FDG PET study. Eur J Nucl Med Mol Imaging. 2017;44(12):2042–2052. doi:10.1007/s00259-017-3761-x
11. Lim DC, Pack AI. Obstructive sleep apnea and cognitive impairment: addressing the blood-brain barrier. Sleep Med Rev. 2014;18(1):35–48. doi:10.1016/j.smrv.2012.12.003
12. Kerner NA, Roose SP, Pelton GH, et al. Association of obstructive sleep apnea with episodic memory and cerebral microvascular pathology: a preliminary study. Am J Geriatr Psychiatry. 2017;25(3):316–325. doi:10.1016/j.jagp.2016.11.009
13. Koo DL, Kim HR, Kim H, Seong JK, Joo EY. White matter tract-specific alterations in male patients with untreated obstructive sleep apnea are associated with worse cognitive function. Sleep. 2020;43(3):zsz247. doi:10.1093/sleep/zsz247
14. Smitha KA, Akhil Raja K, Arun KM, et al. Resting state fMRI: a review on methods in resting state connectivity analysis and resting state networks. Neuroradiol J. 2017;30(4):305–317. doi:10.1177/1971400917697342
15. Saarinen AIL, Huhtaniska S, Pudas J, et al. Structural and functional alterations in the brain gray matter among first-degree relatives of schizophrenia patients: a multimodal meta-analysis of fMRI and VBM studies. Schizophr Res. 2020;216:14–23. doi:10.1016/j.schres.2019.12.023
16. Chandra A, Dervenoulas G, Politis M. Alzheimer’s Disease Neuroimaging Initiative. Magnetic resonance imaging in Alzheimer’s disease and mild cognitive impairment. J Neurol. 2019;266(6):1293–1302. doi:10.1007/s00415-018-9016-3
17. Song X, Roy B, Kang DW, et al. Altered resting-state hippocampal and caudate functional networks in patients with obstructive sleep apnea. Brain Behav. 2018;8(6):e00994. doi:10.1002/brb3.994
18. Zhou L, Liu G, Luo H, et al. Aberrant hippocampal network connectivity is associated with neurocognitive dysfunction in patients with moderate and severe obstructive sleep apnea. Front Neurol. 2020;11:580408. doi:10.3389/fneur.2020.580408
19. Peng DC, Dai XJ, Gong HH, Li HJ, Nie X, Zhang W. Altered intrinsic regional brain activity in male patients with severe obstructive sleep apnea: a resting-state functional magnetic resonance imaging study. Neuropsychiatr Dis Treat. 2014;10:1819–1826. doi:10.2147/NDT.S67805
20. Li H, Li L, Kong L, et al. Frequency‑specific regional homogeneity alterations and cognitive function in obstructive sleep apnea before and after short-term continuous positive airway pressure treatment. Nat Sci Sleep. 2021;13:2221–2238. doi:10.2147/NSS.S344842
21. Jia XZ, Sun JW, Ji GJ, et al. Percent amplitude of fluctuation: a simple measure for resting-state fMRI signal at single voxel level. PLoS One. 2020;15(1):e0227021. doi:10.1371/journal.pone.0227021
22. Zhao N, Yuan LX, Jia XZ, et al. Intra- and inter-scanner reliability of voxel-wise whole-brain analytic metrics for resting state fMRI. Front Neuroinform. 2018;12:54. doi:10.3389/fninf.2018.00054
23. Yang YC, Li QY, Chen MJ, et al. Investigation of changes in retinal detachment-related brain region activities and functions using the percent amplitude of fluctuation method: a resting-state functional magnetic resonance imaging study. Neuropsychiatr Dis Treat. 2021;17:251–260. doi:10.2147/NDT.S292132
24. Li CQ, Ge QM, Shu HY, et al. Investigation of altered spontaneous brain activities in patients with moyamoya disease using percent amplitude of fluctuation method: a resting-state functional MRI study. Front Neurol. 2021;12:801029. doi:10.3389/fneur.2021.801029
25. Li Y, Li M, Feng Y, et al. Aberrant brain spontaneous activity and synchronization in Type 2 diabetes mellitus subjects without mild cognitive impairment. Front Neurosci. 2021;15:749730. doi:10.3389/fnins.2021.749730
26. Zheng X, Sun J, Lv Y, et al. Frequency-specific alterations of the resting-state BOLD signals in nocturnal enuresis: an fMRI Study. Sci Rep. 2021;11(1):12042. doi:10.1038/s41598-021-90546-3
27. Kapur VK, Auckley DH, Chowdhuri S, et al. Clinical practice guideline for diagnostic testing for adult obstructive sleep apnea: an American academy of sleep medicine clinical practice guideline. J Clin Sleep Med. 2017;13(3):479–504. doi:10.5664/jcsm.6506
28. Berry RB, Brooks R, Gamaldo C, et al. AASM scoring manual updates for 2017 (Version 2.4). J Clin Sleep Med. 2017;13(5):665–666. doi:10.5664/jcsm.6576
29. Johns MW. A new method for measuring daytime sleepiness: the Epworth sleepiness scale. Sleep. 1991;14(6):540–545. doi:10.1093/sleep/14.6.540
30. Chen KL, Xu Y, Chu AQ, et al. Validation of the Chinese version of Montreal cognitive assessment basic for screening mild cognitive impairment. J Am Geriatr Soc. 2016;64(12):e285–e290. doi:10.1111/jgs.14530
31. Nasreddine ZS, Phillips NA, Bédirian V, et al. The Montreal Cognitive Assessment, MoCA: a brief screening tool for mild cognitive impairment. J Am Geriatr Soc. 2005;53(4):695–699. doi:10.1111/j.1532-5415.2005.53221.x
32. Pirzada S, Uddin MN, Figley TD, et al. Spatial normalization of multiple sclerosis brain MRI data depends on analysis method and software package. Magn Reson Imaging. 2020;68:83–94. doi:10.1016/j.mri.2020.01.016
33. Friston KJ, Williams S, Howard R, Frackowiak RS, Turner R. Movement-related effects in fMRI time-series. Magn Reson Med. 1996;35(3):346–355. doi:10.1002/mrm.1910350312
34. Satterthwaite TD, Elliott MA, Gerraty RT, et al. An improved framework for confound regression and filtering for control of motion artifact in the preprocessing of resting-state functional connectivity data. Neuroimage. 2013;64:240–256. doi:10.1016/j.neuroimage.2012.08.052
35. Saad ZS, Gotts SJ, Murphy K, et al. Trouble at rest: how correlation patterns and group differences become distorted after global signal regression. Brain Connect. 2012;2(1):25–32. doi:10.1089/brain.2012.0080
36. Li Y, Tao L, Chen H, et al. Identifying depressed essential tremor using resting-state voxel-wise global brain connectivity: a multivariate pattern analysis. Front Hum Neurosci. 2021;15:736155. doi:10.3389/fnhum.2021.736155
37. Hu X, Liu Q, Li B, et al. Multivariate pattern analysis of obsessive-compulsive disorder using structural neuroanatomy. Eur Neuropsychopharmacol. 2016;26(2):246–254. doi:10.1016/j.euroneuro.2015.12.014
38. Drager LF, Togeiro SM, Polotsky VY, Lorenzi-Filho G. Obstructive sleep apnea: a cardiometabolic risk in obesity and the metabolic syndrome. J Am Coll Cardiol. 2013;62(7):569–576. doi:10.1016/j.jacc.2013.05.045
39. Zhang Q, Wang D, Qin W, et al. Altered resting-state brain activity in obstructive sleep apnea. Sleep. 2013;36(5):651–659B. doi:10.5665/sleep.2620
40. Bucks RS, Olaithe M, Rosenzweig I, Morrell MJ. Reviewing the relationship between OSA and cognition: where do we go from here? Respirology. 2017;22(7):1253–1261. doi:10.1111/resp.13140
41. Briggs RG, Khan AB, Chakraborty AR, et al. Anatomy and white matter connections of the superior frontal gyrus. Clin Anat. 2020;33(6):823–832. doi:10.1002/ca.23523
42. Niendam TA, Laird AR, Ray KL, Dean YM, Glahn DC, Carter CS. Meta-analytic evidence for a superordinate cognitive control network subserving diverse executive functions. Cogn Affect Behav Neurosci. 2012;12(2):241–268. doi:10.3758/s13415-011-0083-5
43. Andrews-Hanna JR. The brain’s default network and its adaptive role in internal mentation. Neuroscientist. 2012;18(3):251–270. doi:10.1177/1073858411403316
44. Andrews-Hanna JR, Reidler JS, Sepulcre J, Poulin R, Buckner RL. Functional-anatomic fractionation of the brain’s default network. Neuron. 2010;65(4):550–562. doi:10.1016/j.neuron.2010.02.005
45. Khazaie H, Veronese M, Noori K, et al. Functional reorganization in obstructive sleep apnoea and insomnia: a systematic review of the resting-state fMRI. Neurosci Biobehav Rev. 2017;77:219–231. doi:10.1016/j.neubiorev.2017.03.013
46. Zhou L, Shan X, Peng Y, et al. Reduced regional homogeneity and neurocognitive impairment in patients with moderate-to-severe obstructive sleep apnea. Sleep Med. 2020;75:418–427. doi:10.1016/j.sleep.2020.09.009
47. Huang X, Tang S, Lyu X, Yang C, Chen X. Structural and functional brain alterations in obstructive sleep apnea: a multimodal meta-analysis. Sleep Med. 2019;54:195–204. doi:10.1016/j.sleep.2018.09.025
48. Burks JD, Conner AK, Bonney PA, et al. Anatomy and white matter connections of the orbitofrontal gyrus. J Neurosurg. 2018;128(6):1865–1872. doi:10.3171/2017.3.JNS162070
49. Shi Y, Chen L, Chen T, et al. A meta-analysis of voxel-based brain morphometry studies in obstructive sleep apnea. Sci Rep. 2017;7(1):10095. doi:10.1038/s41598-017-09319-6
50. Briggs RG, Lin YH, Dadario NB, et al. Anatomy and white matter connections of the middle frontal gyrus. World Neurosurg. 2021;150:e520–e529. doi:10.1016/j.wneu.2021.03.045
51. Japee S, Holiday K, Satyshur MD, Mukai I, Ungerleider LG. A role of right middle frontal gyrus in reorienting of attention: a case study. Front Syst Neurosci. 2015;9:23. doi:10.3389/fnsys.2015.00023
52. Bai J, Wen H, Tai J, et al. Altered spontaneous brain activity related to neurologic and sleep dysfunction in children with obstructive sleep apnea syndrome. Front Neurosci. 2021;15:595412. doi:10.3389/fnins.2021.595412
53. Menon V, D’Esposito M. The role of PFC networks in cognitive control and executive function. Neuropsychopharmacology. 2022;47(1):90–103. doi:10.1038/s41386-021-01152-w
54. Pu S, Nakagome K, Itakura M, Iwata M, Nagata I, Kaneko K. Association of fronto-temporal function with cognitive ability in schizophrenia. Sci Rep. 2017;7:42858. doi:10.1038/srep42858
55. Wu Y, Zhao W, Chen X, Wan X, Lei X. Aberrant awake spontaneous brain activity in obstructive sleep apnea: a review focused on resting-state EEG and resting-state fMRI. Front Neurol. 2020;11:768. doi:10.3389/fneur.2020.00768
56. Song B, Zhu JC, Narrative A. Review of Cerebellar Malfunctions and Sleep Disturbances. Front Neurosci. 2021;15:590619. doi:10.3389/fnins.2021.590619
57. Park HR, Cha J, Joo EY, Kim H. Altered cerebrocerebellar functional connectivity in patients with obstructive sleep apnea and its association with cognitive function. Sleep. 2022;45(1):zsab209. doi:10.1093/sleep/zsab209
58. Kong L, Li H, Shu Y, et al. Aberrant resting-state functional brain connectivity of insular subregions in obstructive sleep apnea. Front Neurosci. 2021;15:765775. doi:10.3389/fnins.2021.765775
59. Mourão-Miranda J, Bokde ALW, Born C, Hampel H, Stetter M. Classifying brain states and determining the discriminating activation patterns: support Vector Machine on functional MRI data. Neuroimage. 2005;28(4):980–995. doi:10.1016/j.neuroimage.2005.06.070
60. Rondina JM, Ferreira LK, de Souza Duran FL, et al. Selecting the most relevant brain regions to discriminate Alzheimer’s disease patients from healthy controls using multiple kernel learning: a comparison across functional and structural imaging modalities and atlases. Neuroimage Clin. 2018;17:628–641. doi:10.1016/j.nicl.2017.10.026
61. Wang S, Zhang Y, Lv L, et al. Abnormal regional homogeneity as a potential imaging biomarker for adolescent-onset schizophrenia: a resting-state fMRI study and support vector machine analysis. Schizophr Res. 2018;192:179–184. doi:10.1016/j.schres.2017.05.038
 © 2022 The Author(s). This work is published and licensed by Dove Medical Press Limited. The
full terms of this license are available at https://www.dovepress.com/terms
and incorporate the Creative Commons Attribution
- Non Commercial (unported, 3.0) License.
By accessing the work you hereby accept the Terms. Non-commercial uses of the work are permitted
without any further permission from Dove Medical Press Limited, provided the work is properly
attributed. For permission for commercial use of this work, please see paragraphs 4.2 and 5 of our Terms.
© 2022 The Author(s). This work is published and licensed by Dove Medical Press Limited. The
full terms of this license are available at https://www.dovepress.com/terms
and incorporate the Creative Commons Attribution
- Non Commercial (unported, 3.0) License.
By accessing the work you hereby accept the Terms. Non-commercial uses of the work are permitted
without any further permission from Dove Medical Press Limited, provided the work is properly
attributed. For permission for commercial use of this work, please see paragraphs 4.2 and 5 of our Terms.