Back to Journals » International Journal of Chronic Obstructive Pulmonary Disease » Volume 18
A2M Serves as Promising Biomarker for Chronic Obstructive Pulmonary Disease
Authors Xiao X ![]() , Cai W, Ding Z, Shi Y, Fan L, Zhang Q
, Cai W, Ding Z, Shi Y, Fan L, Zhang Q ![]()
Received 6 February 2023
Accepted for publication 13 April 2023
Published 24 April 2023 Volume 2023:18 Pages 683—692
DOI https://doi.org/10.2147/COPD.S407491
Checked for plagiarism Yes
Review by Single anonymous peer review
Peer reviewer comments 2
Editor who approved publication: Professor Min Zhang
Xinru Xiao,1,2 Wei Cai,1 Ziqi Ding,1 Yujia Shi,1 Liang Fan,1 Qian Zhang1,3
1Department of Respiratory and Critical Care Medicine, The Affiliated Changzhou Second People’s Hospital of Nanjing Medical University, Changzhou, People’s Republic of China; 2Department of the Second Clinical College, Dalian Medical University, Dalian, People’s Republic of China; 3Changzhou Medical Center, Nanjing Medical University, Changzhou, People’s Republic of China
Correspondence: Qian Zhang, Tel +86-519-81087391, Fax +86-519-88115560, Email [email protected]
Background: Chronic obstructive pulmonary disease (COPD) often associated with cigarette smoking. However, increasing evidence suggests that non-smoking COPD is much higher than previously thought. This study aims to identify a nonsmoking COPD biomarker and examined its value in diagnosis and prediction of acute exacerbation.
Methods: A total of 35 stable COPD patients, 70 acute exacerbation chronic obstructive pulmonary disease (AECOPD) patients and 35 healthy control subjects were included. Plasma α 2 macroglobulin (A2M) and matrix metalloproteinase-9 (MMP-9) levels were measured using the enzyme-linked immunosorbent assay (ELISA) method on all participants. Their association with clinical characteristics and lung function parameters were determined by regression analysis. Receiver operating characteristic (ROC) curve was used to determine the diagnostic sensitivity and specificity. Correlation coefficients were evaluated using Pearson’s correlation.
Results: Plasma A2M concentration was decreased and MMP-9 concentration, MMP-9/A2M ratio were elevated in stable COPD patients compared with control groups. And MMP-9 expression was significantly higher in AECOPD patients. A2M level was increased in AECOPD patients with infection compared with those without. In addition, there was no statistical difference in A2M levels between smokers and nonsmokers COPD or healthy control subjects. Furthermore, A2M, MMP-9 and MMP-9/A2M were correlated with forced expiratory volume in one second (FEV1)%, FEV1/ forced vital capacity (FVC), CAT and mMRC score in COPD patients, but had no correlation with fraction of exhaled nitric oxide (FeNO) and concentration of alveolar nitric oxide (CaNO).
Conclusion: A2M is altered in peripheral blood of COPD patients and correlated with severity and infection. Moreover, there was no significant correlation between the change in A2M and smoking, FeNO and CaNO, suggesting A2M may reflect the overall rather than local inflammation in COPD patients and serve as a potential biomarker for nonsmoking COPD patients.
Keywords: chronic obstructive pulmonary disease, α 2 macroglobulin, matrix metalloproteinase-9
Introduction
Chronic obstructive pulmonary disease (COPD) is a leading cause of morbidity and mortality worldwide.1 Patients with persistent airflow limitation, respiratory symptoms, and a post-bronchodilator forced expiratory volume in one second (FEV1)/forced vital capacity (FVC) ratio of 70% are considered to have COPD.2 It is common knowledge that smoking cigarettes causes COPD. Epithelial cells and alveolar macrophages (AMs) become activated by tobacco smoke inhalation and emit chemoattractants that draw circulating neutrophils, monocytes, and lymphocytes into the lung.3 The deterioration of the lung parenchyma, mucus hypersecretion, and small airway fibrosis are caused by these cells in COPD patients releasing more proteinases and growth factors.4–7 However, mounting research points to the significance of other risk factors, particularly in developing nations. According to estimates, 25% to 45% of COPD patients have never smoked, which suggests the prevalence of non-smoking COPD is substantially higher than previously believed.8 COPD in smokers was reported to show features of emphysema than nonsmoking COPD patients.9,10 Nonsmoking COPD patients were less likely to have a chronic cough and expectoration.11 The frequency of acute symptomatic worsening, emergency visits and hospitalization were higher in non-smokers with COPD.12,13 However, most of the biomarkers of COPD found so far cannot exclude the influence of smoking. Looking for biomarkers in nonsmokers with COPD is of great significance.
Major human plasma protease inhibitor alpha-2-macroglobulin (A2M) has been thought to be involved in the control of lung protease activity.14 A2M attracts active proteases into its snap-trap using a special protease trapping mechanism, protects these from possible substrates, and marks their complex for destruction by receptor-mediated endocytosis.15 To reduce the lung’s protease load in response to proteinases, alveolar macrophages’ ability to synthesize A2M locally in the lung and receptor-mediated phagocytosis of A2M-protease complexes may be crucial. Additionally, as A2M is transformed, it gains the ability to bind to growth factors, cytokines, and cellular receptors.16,17 In recent years, it has been proposed that the pathogenesis of COPD may be influenced by the degradation of the protease-antiprotease equilibrium. Matrix metalloproteinases (MMPs) are indispensable elements of tissue reconstruction, which have an impact on this equilibrium.18,19
Dysregulation of A2M was found in smoking and non-smoking COPD patients compared with normal controls in previous studies.14,20 We also reported that A2M levels were reduced in both smoking and non-smoking COPD patients,21 suggesting that it may be a potential biomarker of both nonsmoking and smoking COPD.
Emphysema is brought on by MMPs that macrophages release into the environment.22 MMP-9, a member of MMPs family, is one of the main proteolytic enzyme produced by AMs from COPD patients but is also secreted by neutrophils, epithelial cells, mast cells, and fibroblasts.3 Extracellular matrix (ECM) proteins such as collagen, gelatin, and elastin are proteolytically digested by MMP-9, which also activates dormant pro-MMP-9 and pro-MMP-13.23 Alpha 1-antitrypsin (AAT), tissue inhibitors of metalloproteinases (TIMPs), and A2M, which can block a variety of serine proteinases and MMPs, are the principal serum inhibitors of activated proteinases and quickly inhibit them. Several studies have found that the activity of MMP-9 is regulated by A2M.24–27 It is likely that the imbalance between MMP-9 and A2M is involved in the occurrence and development of COPD.
COPD pathogenesis may occur when there is an imbalance between proteases and antiproteases as a result of either the increased activity of proteases or the malfunction of protease inhibitors.28–30 In this study, we hypothesize that A2M may be a promising biomarker of nonsmoking COPD patients and defined the connection between the levels of circulating MMP-9, A2M, MMP-9/A2M ratio with the clinical features of COPD, thereby evaluated their value in diagnosing COPD and predicting acute exacerbation of COPD.
Methods
Study Design and Subjects
In this study, we collected 35 stable COPD patients, 70 AECOPD patients and 35 gender- and age-matched healthy controls from the Department of Respiratory and Critical Care Medicine, Changzhou Second Hospital Affiliated to Nanjing Medical University from January 2022 to November 2022. According to the Global Initiative for Chronic Obstructive Lung Disease (GOLD) guidelines,31 all COPD patients in this study were divided into four groups according to the lung function (I: FEV1%pre ≥80%, II: 50%≤ FEV1%pre <80%, III: 30%≤ FEV1%pre <50%, and IV: FEV1%pre <30%). These patients, whose imaging findings consistent with COPD, had negative bronchodilation tests and stable airflow limitation with FEV1/FVC <70% after inhaled β2-agonist (exclude specific pathologic obstructive diseases such as cystic fibrosis, bronchiolitis obliterans, etc.). Participants were excluded if they had bronchiectasis, tuberculosis, asthma, malignancy, or other confounding inflammatory diseases, such as arthritis, connective tissue disorders or inflammatory bowel disease. All participants were classified into the following three groups, ie, Group I (Stable COPD group): Stability was defined as no COPD exacerbation requiring hospitalization, oral corticosteroids, or antibiotics within the previous three months; Group II (AECOPD group): an exacerbation was defined as the presence of a rise in any two of the following respiratory symptoms: wheezing, coughing, purulent sputum, symptoms of the common cold, for at least two days straight; Group III (Healthy control group): normal FEV1%pre >70% and no medical history of lung disease. Those who had smoked at least 100 cigarettes in their lives and either continued to smoke or had quit within the previous year were considered current smokers. The amount of smoking among current smokers was determined on a pack-year basis (PYs). “Never smokers” were defined as those who had smoked fewer than 100 cigarettes, including those who had never smoked. Current nonsmokers and tobacco smokers were divided into Healthy-Nonsmoking (Healthy-NS), Healthy-Smoking (Healthy-S), COPD-Smoking (COPD-S), and COPD-Nonsmoking (COPD-NS). Infection was defined as increased cough and sputum production, increasing dyspnea, pyrexia, and a positive bacterial culture from their sputum. At clinic visit, height, weight, fraction of exhaled nitric oxide (FeNO) and concentration of alveolar nitric oxide (CaNO), and lung function were measured, and blood was sampled. All participants provided written informed consent, and the study was approved by the Ethics Committee of Changzhou Second People’s Hospital (2022KY113-01).
Measurements of Pulmonary Function
Pulmonary function was performed according to the 2019 spirometry standards.32 In brief, a spirometer (Jaeger, Baglia, Germany) was used to record the results of pulmonary function tests while the patient was sitting. Volume and flow curves were continuously observed throughout the test. FVC, FEV1, and FEV1/FVC, among other pulmonary function test parameters, were measured, and the anticipated values were computed. Three appropriate measurements were recorded, the highest being considered the base value, and the difference between the best and second-best values of FVC and FEV1 was less than 0.10 L.
FeNO and CaNO Measurements
All patients performed conventional FeNO and CaNO measurements (Sunvou, Wuxi, China) under control of feedback signals. This was done before bronchial provocation and body plethysmography since the breathing maneuvers required could alter the results of the FeNO test.
Measurements of A2M and MMP-9
Total concentrations of A2M and MMP-9 in the plasma samples were measured by using enzyme-linked immunosorbent assay (ELISA) kits (Meibiao, Jiangsu, China) according to the manufacturer’s instructions. Absorbance values for the standards and samples were obtained at 450 nm and the standard curves constructed for each assay were compared and used to minimize inter-assay variation. To avoid any bias, all samples were analyzed blindly.
Statistical Analysis
Statistical software SPSS 21.0 was used for analysis. The image was drawn by GraphPad Prism 7. Kolmogorov–Smirnov test was used to test the normality of measurement data. Measurement data conforming to normal distribution were expressed as mean ± standard error of the mean (SEM), measurement data not conforming to normal distribution were expressed as median (quartile), and categorical variable data were expressed as proportion. Dichotomous variables were analyzed using Pearson’s χ2, and T-test (normally distributed data) or Mann–Whitney U-test (non-normally distributed data) was used for continuous variables. Pearson correlation analysis (normally distributed data) or Spearman rank correlation analysis (non-normally distributed data) was used for correlation analysis. The receiver operating characteristic (ROC) curve was used to determine the sensitivity and specificity of diagnosis, and the area under the curve (AUC) was used to determine the diagnostic effect. A P-value <0.05 was considered significant.
Results
The Overall Characteristics of the Groups
The overall characteristics of the groups are summarized in Table 1. As shown in Table 1, there were no significant differences in gender, age, body mass index (BMI) and smoking history between healthy control and patients with stable COPD (S-COPD). S-COPD patients had lower FEV1/FVC and FEV1%. However, FeNO and CaNO were higher in stable COPD patients when compared with the control groups.
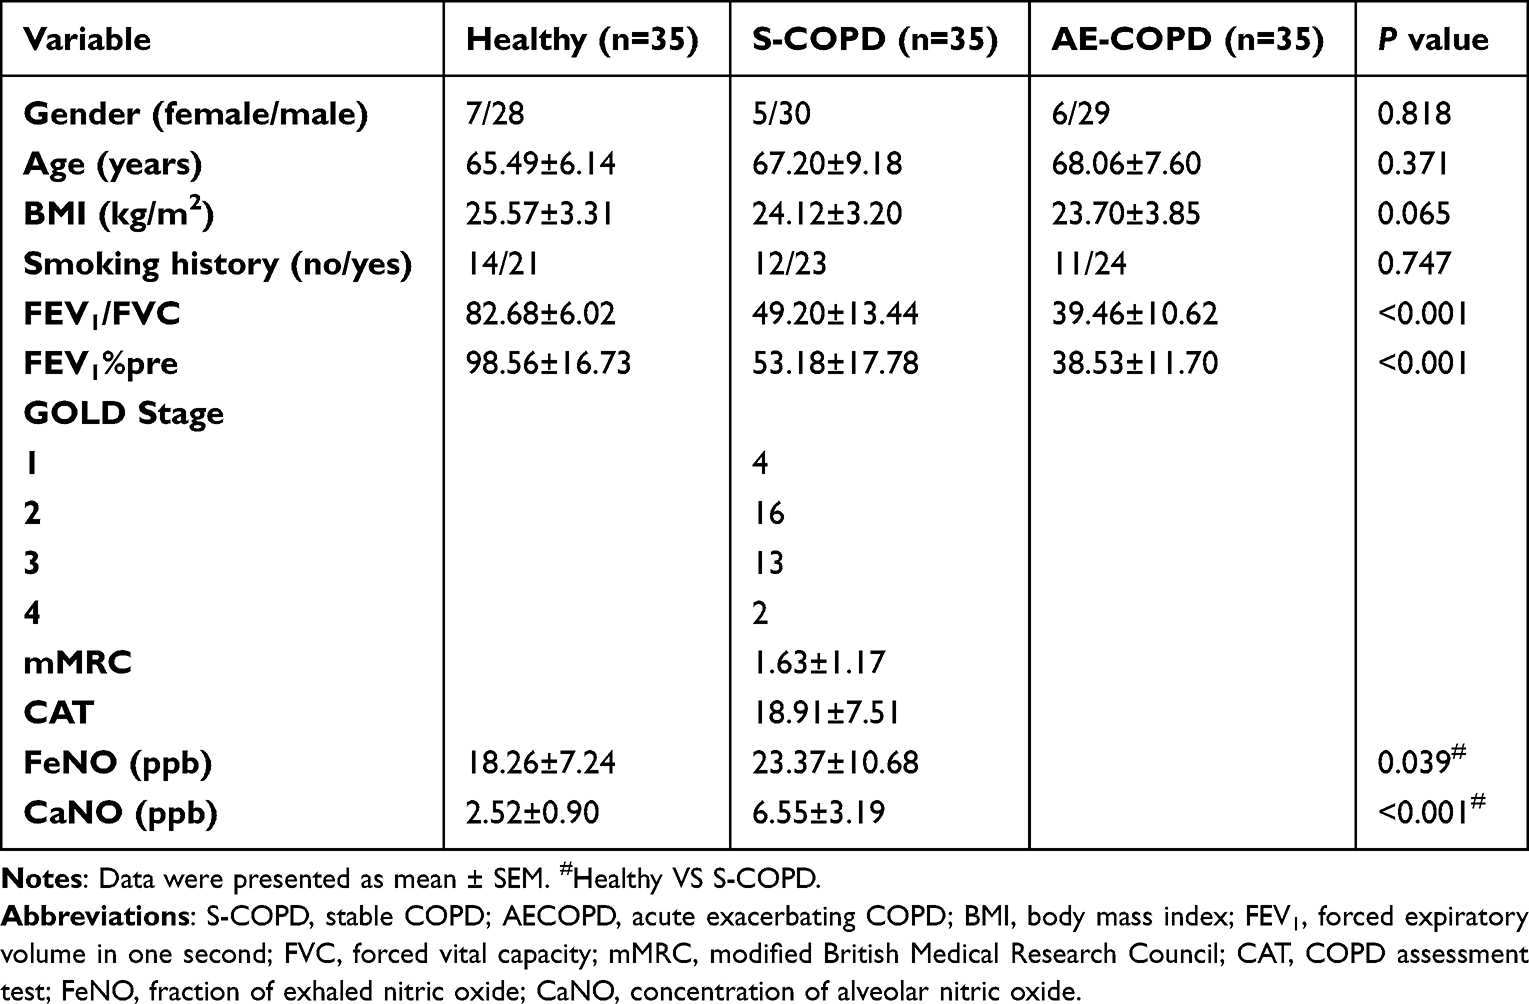 |
Table 1 Characteristics of Study Population |
A2M, MMP-9 in Plasma of Stable COPD Patients and Healthy Controls
The groups’ levels of protease-antiprotease are displayed in Figure 1. Peripheral blood A2M concentration was decreased (P < 0.0001) (Figure 1A) and MMP-9 concentration was elevated (P < 0.0001) in S-COPD compared with the control groups (Figure 1B). Pearson correlation analysis showed that A2M level in plasma of COPD patients was negatively correlated with MMP-9 (r=−0.726, P < 0.0001) (Figure 1C). A higher MMP-9/A2M ratio was found in S-COPD patients compared with the control groups (P < 0.0001) (Figure 1D).
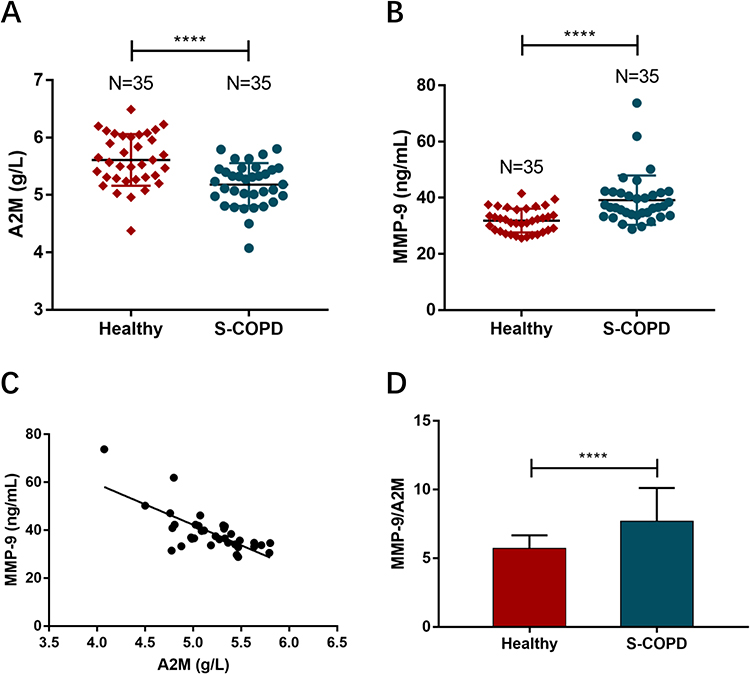 |
Figure 1 (A and B) Expression levels of A2M and MMP-9 in plasma between stable COPD patients and healthy group by ELISA were measurement. (C) Pearson’s correlation analysis was employed to reveal the relationship between A2M and MMP9. (D) MMP-9/A2M ratio in stable COPD patients compared with the control groups. Differences between the groups were assessed by two-sample independent Student’s t-test analysis. ****P < 0.0001. |
A2M, MMP9 and Stable COPD Indexes, Lung Function
Correlation between A2M, MMP-9, A2M/MMP-9 and clinical indexes of S-COPD patients were presented in Table 2. Plasma A2M level of S-COPD patients was positively correlated with FEV1%pre and FEV1/FVC, but negatively correlated with CAT score and mMRC score. MMP-9 level and MMP-9/A2M were negatively correlated with FEV1%pre and FEV1/FVC, but positively correlated with CAT score and mMRC score.
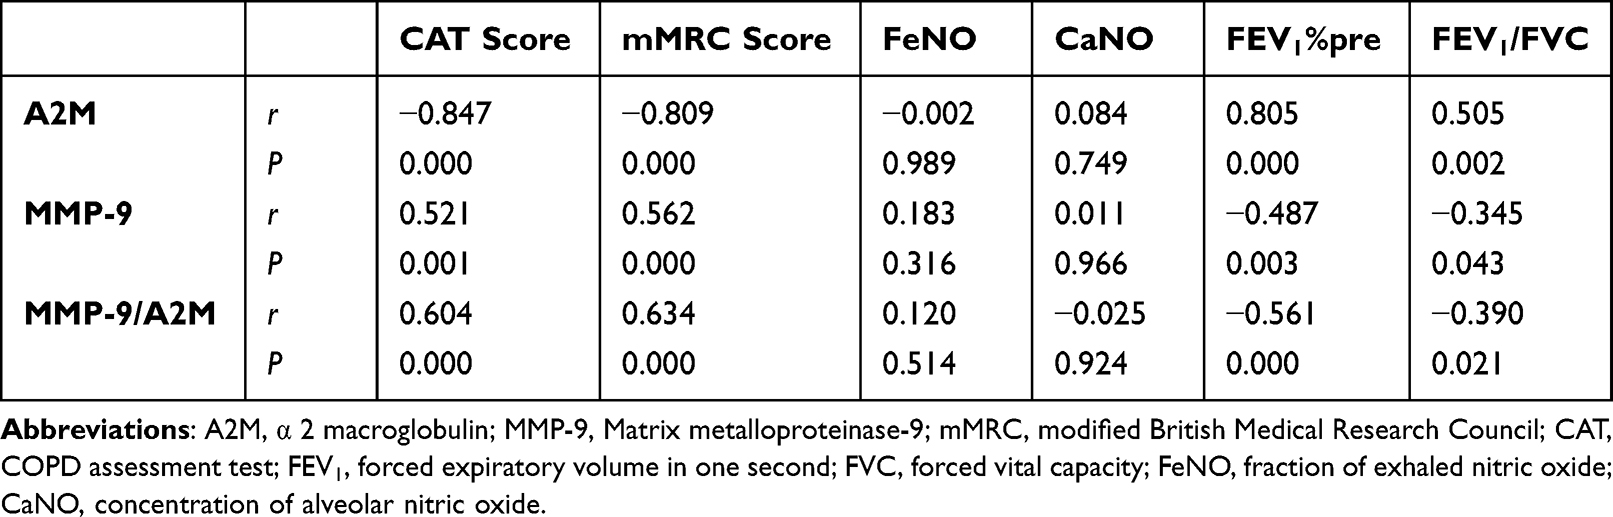 |
Table 2 Correlation Between A2M, MMP-9, MMP-9/A2M and Clinical and Lung Function Indexes of Stable COPD Patients |
A2M, MMP9 and Smoking Status
A lower A2M concentration was found in COPD-NS compared with Healthy-NS (P < 0.01), which was also found in COPD-S compared with Healthy-S (P < 0.01). Moreover, there was no statistically significant difference in plasma A2M between Healthy-NS and Healthy-S. Also, no statistically significant difference was found in plasma A2M between COPD-NS and COPD-S (Figure 2A), which meant A2M expression level was unaffected by smoking. Plasma MMP-9 concentration was increased in Healthy-S compared with Healthy-NS. Also, when we compared COPD-NS with COPD-S, higher concentrations of MMP-9 were found in COPD-S (Figure 2B).
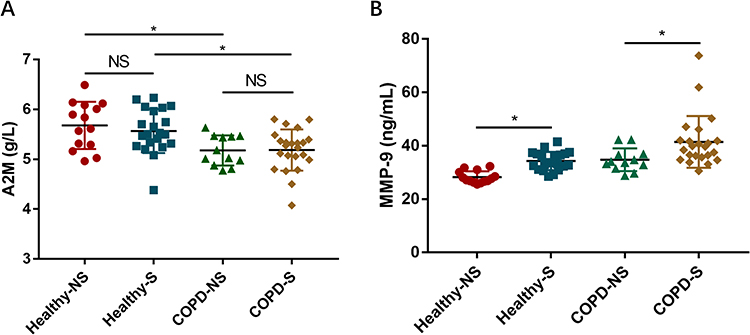 |
Figure 2 (A and B) Expression levels of A2M and MMP-9 between healthy nonsmoking group, healthy smoking group, COPD nonsmoking group and COPD smoking group. Differences between the groups were assessed by one-way analysis of variance. NS: no significant (P > 0.05), *P < 0.05. |
Diagnostic Effect of A2M and A2M/MMP-9 in Stable COPD
Receiver operating characteristic curve (ROC) analysis was used to assess the value of A2M and MMP-9/A2M as COPD biomarker (Figure 3A and B). When the cut-off value was 5.49, the sensitivity of A2M as a biomarker for COPD was 0.8571, the specificity was 0.6, and the AUC was 0.7669 (95% CI = 0.6569–0.877, P < 0.0001), which has the best diagnostic value as a biomarker for COPD. When the cut-off value was 6.418, the sensitivity of MMP-9/A2M as a biomarker for COPD was 0.7429, the specificity was 0.8, and the AUC was 0.84 (95% CI = 0.7495–0.9305, P < 0.0001), which has higher diagnostic value as a biomarker for stable COPD than A2M.
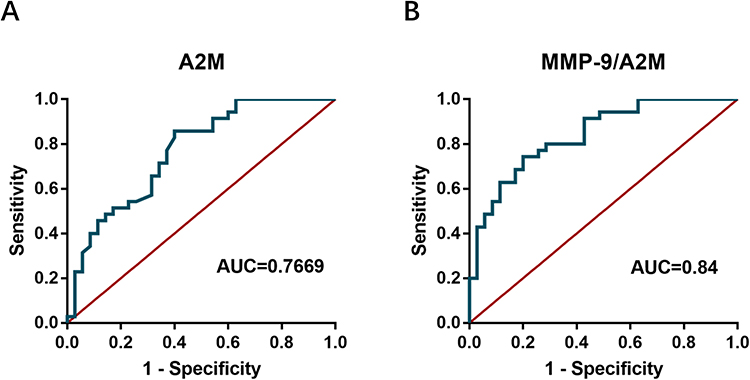 |
Figure 3 (A and B) Performances of A2M and MMP-9/A2M in the diagnosis of COPD. |
A2M, MMP9 and Acute Exacerbation of COPD
As shown in Table 1, there was no significant difference in gender, age, BMI, smoking between patients with S-COPD and AECOPD. The level of MMP-9 in plasma of AECOPD patients was significantly higher than that of patients with S-COPD (P < 0.0001) (Figure 4A). When the cut-off value was 42.69, the sensitivity of MMP-9 to AECOPD progression was 91.43% and the specificity was 85.71% (Figure 4B). However, there were no significant differences of plasma A2M levels between AECOPD and stable COPD (Figure 4C).
 |
Figure 4 (A) Expression levels of MMP-9 between stable COPD group and AECOPD group. (B) Value of MMP-9 in predicting acute exacerbation of COPD. (C) Based on two-sample independent Student’s t-test analysis, expression levels of A2M between stable COPD group and AECOPD group. Differences between the groups were assessed by two-sample independent Student’s t-test analysis. NS: no significant (P > 0.05), ****P < 0.0001. |
A2M and Infection
As we know, infection is one of the main causes of AECOPD.33 Burnett et al34 found that bacterial or viral infections were associated with changes in the levels of A2M of patients with stable or AECOPD. In order to explore whether plasma A2M levels were affected by infection during acute exacerbation of COPD, we further expanded the sample size, and 70 AECOPD patients were divided into infected groups and non-infected groups. The overall characteristics of non-infection acute exacerbating COPD (NI-AECOPD) and infection acute exacerbating COPD (I-AECOPD) are summarized in Table 3. Clinical characteristics of patients with NI-AECOPD and I-AECOPD were similar. Our results showed that the plasma A2M level in the infected group was significantly higher than that in the non-infected group (Figure 5), indicating that the increase of plasma A2M in COPD patients during acute exacerbation was associated with infection.
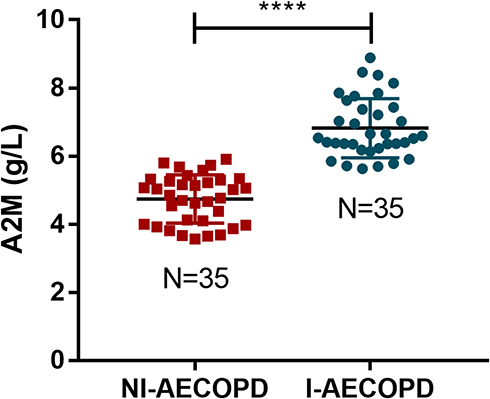 |
Figure 5 Expression levels of A2M between non-infection AECOPD group and infection AECOPD group. Differences between the groups were assessed by two-sample independent Student’s t-test analysis. ****P < 0.0001. |
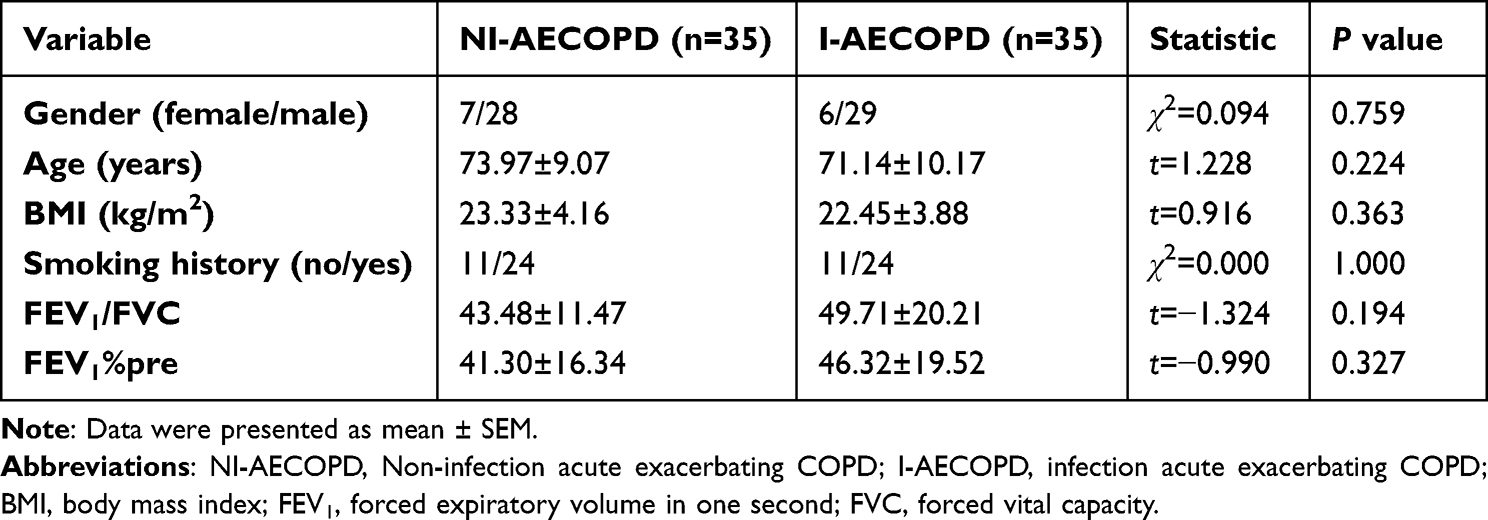 |
Table 3 Characteristics of AECOPD Patients (with or Without Infection) |
Discussion
Environmental and genetic variables both have an impact on COPD. It and smoking tobacco have a strong correlation. But at least one-fourth of COPD sufferers do not smoke. Only 35% of the population’s attributable risk for COPD is linked to tobacco use; the other risks include exposure to ozone, household air pollution, occupational exposures, ambient air pollution, and various other risk factors.1,35 An essential part of the development of the disease is played by molecular biomarkers that are closely related to the pathogenesis of COPD. Smoking can affect the expression of COPD-related genes, which may have a potential impact on these genes as markers. In this study, we identified a potential biomarker, α2 macroglobulin (A2M), that is not affected by smoking and is associated with the severity of COPD.
Poller et al identified a patient with A2M gene mutation and partial serum A2M deficiency who had an early onset of pulmonary disease and rapid progression to extremely severe COPD.14 A2M mRNA was previously discovered to be downregulated in the peripheral blood of COPD patients, whether they smoked or not,21 and this finding was further supported by the current investigation. In addition, plasma A2M was found to be significantly reduced with increasing disease severity based on GOLD stages in COPD patients. A2M is a cytokine transporter and protease inhibitor.36 It inhibits a broad spectrum of proteases through bait-and-trap mechanisms. In recent years, protease-antiprotease imbalance has been proposed to be involved in the etiology of COPD, and proteolytic biomarkers were identified to be connected with the prognosis of COPD in a population-based investigation.37
Arbeláez et al24 identified the cleavage sites in the “bait” regions following production of high-molecular-weight complexes of MMP-9 with the A2M. Ricardo et al26 found that the activity of MMP-9 was regulated by A2M. Serifova et al revealed that A2M effectively traps MMP-9.27 Fontana et al found that MMP-9⁄A2M ratios in plasma samples from hypertensives were higher than those from healthy controls.38 MMP-9, a prominent protease in alveolar tissue, which has a substantial positive correlation with the level of inflammatory metalloproteinase cell infiltration in COPD patients.39 Patients with COPD were shown to have greater peripheral blood levels of MMP-9.40 Uysal et al found that higher plasma MMP-9 levels correlated with disease severity, with the highest concentrations in patients with emphysema.41
In our study, it was discovered that controls had lower plasma MMP-9 concentrations, which rose as the condition got worse. The proportional decrease in the production of TIMP-1, the specific endogenous inhibitor of MMP-9, could be the cause of the elevated MMP-9. Evidence suggests that TIMP-1 inhibits MMP-9 in both its active and precursor forms, and that an imbalance in the MMP-9/TIMP-1 ratio may contribute to the pathophysiology of COPD.42–44 Smokers with airway hyperresponsiveness have higher levels of MMP-9/TIMP-1.45 However, the expression level of TIMP-1 is affected by smoking, COPD patients and smokers had lower levels of TIMP-1 expression than that of nonsmokers,46,47 suggesting that the decrease in TIMP-1 may be caused by smoking. Here, we identified a metalloproteinase inhibitor, α2 macroglobulin (A2M), that was not affected by smoking, suggesting its potential role as a biomarker for COPD.
In our study, there was no statistically significant difference in the amount of A2M expression between smokers with retained lung function and nonsmokers. Patients with COPD often experience higher disrupted protease-imbalance along with impaired pulmonary function. MMP-9/A2M was found to have an inverse relationship with changes in FEV1%pre and FEV1/FVC in COPD patients, which may help determine the severity of the disease and the prognosis of the patient. We also found a significantly negative correlation between A2M levels and CAT score and mMRC dyspnea score. Considering A2M anti-inflammatory role reported by various studies, its reduction may be somewhat consistent with the reduction in the physical activity of patients with COPD and reflect the effects of systemic inflammation on the quality of life in these patients. In addition, A2M has no correlation with FeNO and CaNO, this suggests that A2M may be involved in the systemic pathogenesis of COPD rather than local airway inflammation.
However, the present results contrast with a previous study reporting A2M was upregulated in COPD.48 We considered that the study did not exclude the influence of infectious factors on A2M level. Burnett et al34 reported that concentrations of A2M in infected samples were significantly higher than in the non-infected samples. Therefore, at variance with previous studies, airway infection was systemically excluded because it enhances lung inflammation.
Some limitations of our study should be considered. First, the study population was relatively small, a larger size study with a robust design is needed to confirm these results. Second, patients with asthma-COPD overlap syndrome (ACOS) may not be completely excluded, since high FeNO levels were found in part of participants. Third, only expression of A2M and MMP9 was analyzed, not activity. In addition, we only measured plasma A2M and MMP9; A2M and MMP9 in sputum and bronchoalveolar lavage (BAL) specimens need further study. There are many other protease-antiprotease components such as MMP-9/TIMP-1, and their role in COPD need further exploration. Genetic and mechanistic studies are required in the future.
The data presented in this study indicate that COPD patients’ altered expression of A2M is correlated with severity and infection. Moreover, there was no significant correlation between the change in A2M and smoking, FeNO and CaNO, suggesting that A2M may reflect the overall rather than local inflammation in COPD patients and serve as a potential biomarker for nonsmoking COPD patients. A2M has potential value in diagnosing COPD patients with or without smoking and may be an indicator to determine whether AECOPD patients have infection.
Statement of Ethics
Changzhou Second Hospital granted Ethical approval to carry out the study within its facilities ([2022]KY113-01). This study was designed, implemented, and reported in accordance with the ethical principles laid down in the Declaration of Helsinki.
Funding
This study was supported by grants from the Jiangsu province social development project (BE2020651 to Q.Z.), and in part from the Jiangsu province “333 talents” project (BRA2020015 to Q.Z.), the Changzhou Sci & Tech Program (CE20205023 to Q.Z.), and the Changzhou High-Level Medical Talents Training Project (2022CZLJ013 to Q.Z.).
Disclosure
The authors report no conflicts of interest in this work.
References
1. Collaborators GCRD. Global, regional, and national deaths, prevalence, disability-adjusted life years, and years lived with disability for chronic obstructive pulmonary disease and asthma, 1990–2015: a systematic analysis for the global burden of disease study 2015. Lancet Respir Med. 2017;5(9):691. doi:10.1016/S2213-2600(17)30293-X
2. Singh D, Agusti A, Anzueto A, et al. Global strategy for the diagnosis, management, and prevention of chronic obstructive lung disease: the GOLD science committee report 2019. Eur Respir J. 2019;53(5):1900164. doi:10.1183/13993003.00164-2019
3. Barnes PJ. Inflammatory mechanisms in patients with chronic obstructive pulmonary disease. J Allergy Clin Immunol. 2016;138(1):16–27. doi:10.1016/j.jaci.2016.05.011
4. Chung K, Adcock I. Multifaceted mechanisms in COPD: inflammation, immunity, and tissue repair and destruction. Eur Respir J. 2008;31(6):1334–1356. doi:10.1183/09031936.00018908
5. Bchir S, Nasr HB, Bouchet S, et al. Concomitant elevations of MMP‐9, NGAL, proMMP‐9/NGAL and neutrophil elastase in serum of smokers with chronic obstructive pulmonary disease. J Cell Mol Med. 2017;21(7):1280–1291. doi:10.1111/jcmm.13057
6. de Boer WI, Hau CM, van Schadewijk A, Stolk J, van Krieken JHJ, Hiemstra PS. Expression of epidermal growth factors and their receptors in the bronchial epithelium of subjects with chronic obstructive pulmonary disease. Am J Clin Pathol. 2006;125(2):184–192. doi:10.1309/W1AXKGT7UA37X257
7. Lee SH, Lee SH, Kim CH, et al. Increased expression of vascular endothelial growth factor and hypoxia inducible factor-1α in lung tissue of patients with chronic bronchitis. Clin Biochem. 2014;47(7–8):552–559. doi:10.1016/j.clinbiochem.2014.01.012
8. Salvi SS, Barnes PJ. Chronic obstructive pulmonary disease in non-smokers. Lancet. 2009;374(9691):733–743. doi:10.1016/S0140-6736(09)61303-9
9. Salvi SS, Brashier BB, Londhe J, et al. Phenotypic comparison between smoking and non-smoking chronic obstructive pulmonary disease. Respir Res. 2020;21(1):1–12. doi:10.1186/s12931-020-1310-9
10. Jindal S, Jindal A. COPD in biomass exposed nonsmokers: a different phenotype. Expert Rev Respir Med. 2021;15(1):51–58. doi:10.1080/17476348.2021.1835476
11. Zhou Y, Wang C, Yao W, et al. COPD in Chinese nonsmokers. Eur Respir J. 2009;33(3):509. doi:10.1183/09031936.00084408
12. Jindal S, Aggarwal A, Jindal A, et al. COPD exacerbation rates are higher in non-smoker patients in India. Int J Tuberc Lung Dis. 2020;24(12):1272–1278. doi:10.5588/ijtld.20.0253
13. Ocakli B, Acarturk E, Aksoy E, et al. The impact of exposure to biomass smoke versus cigarette smoke on inflammatory markers and pulmonary function parameters in patients with chronic respiratory failure. Int J Chron Obstruct Pulmon Dis. 2018;Volume 13:1261–1267. doi:10.2147/COPD.S162658
14. Poller W, Barth J, Voss B. Detection of an alteration of the α2 gene in a patient with chronic lung disease and serum α2 deficiency. Hum Genet. 1989;83(1):93–96. doi:10.1007/BF00274157
15. Harwood SL, Lyngsø J, Zarantonello A, et al. Structural investigations of human A2M identify a hollow native conformation that underlies its distinctive protease-trapping mechanism. Mol Cell Proteomics. 2021;20:100090. doi:10.1016/j.mcpro.2021.100090
16. Borth W. α2 Macroglobulin, a multifunctional binding protein with targeting characteristics. FASEB J. 1992;6(15):3345–3353. doi:10.1096/fasebj.6.15.1281457
17. Vandooren J, Itoh Y. Alpha-2-macroglobulin in inflammation, immunity and infections. Front Immunol. 2021;12. doi:10.3389/fimmu.2021.803244
18. Demedts IK, Brusselle GG, Bracke KR, Vermaelen KY, Pauwels RA. Matrix metalloproteinases in asthma and COPD. Curr Opin Pharmacol. 2005;5(3):257–263. doi:10.1016/j.coph.2004.12.005
19. Culpitt S, Rogers D, Traves S, Barnes P, Donnelly L. Sputum matrix metalloproteases: comparison between chronic obstructive pulmonary disease and asthma. Respir Med. 2005;99(6):703–710. doi:10.1016/j.rmed.2004.10.022
20. Arellano-Orden E, Calero-Acuña C, Cordero JA, et al. Specific networks of plasma acute phase reactants are associated with the severity of chronic obstructive pulmonary disease: a case-control study. Int J Med Sci. 2017;14(1):67. doi:10.7150/ijms.16907
21. Qian Y, Mao Z-D, Shi Y-J, Liu Z-G, Cao Q, Zhang Q. Comprehensive analysis of miRNA-mRNA-lncRNA networks in non-smoking and smoking patients with chronic obstructive pulmonary disease. Cell Physiol Biochem. 2018;50(3):1140–1153. doi:10.1159/000494541
22. Sharafkhaneh A, Hanania NA, Kim V. Pathogenesis of emphysema: from the bench to the bedside. Proc Am Thorac Soc. 2008;5(4):475–477. doi:10.1513/pats.200708-126ET
23. Löffek S, Schilling O, Franzke C. Series ‘matrix metalloproteinases in lung health and disease’edited by J. Müller-Quernheim and O. Eickelberg number 1 in this series: biological role of matrix metalloproteinases: a critical balance. Eur Respir J. 2011;38(1):191–208. doi:10.1183/09031936.00146510
24. Arbeláez LF, Bergmann U, Tuuttila A, Shanbhag VP, Stigbrand T. Interaction of matrix metalloproteinases-2 and-9 with pregnancy zone protein and α2-macroglobulin. Arch Biochem Biophys. 1997;347(1):62–68. doi:10.1006/abbi.1997.0309
25. de Lorenc LB, Ramos AM, Sánchez MC, Montenegro R, Chiabrando GA. Structural evaluation of plasma α2-macroglobulin in acute pancreatitis. Clin Chem Lab Med. 2005;43(11):1183–1189.
26. Rodríguez-Calvo R, Ferrán B, Alonso J, et al. NR4A receptors up-regulate the antiproteinase alpha-2 macroglobulin (A2M) and modulate MMP-2 and MMP-9 in vascular smooth muscle cells. Thromb Haemost. 2015;113(06):1323–1334. doi:10.1160/TH14-07-0645
27. Serifova X, Ugarte-Berzal E, Opdenakker G, Vandooren J. Homotrimeric MMP-9 is an active hitchhiker on alpha-2-macroglobulin partially escaping protease inhibition and internalization through LRP-1. Cell Mol Life Sci. 2020;77(15):3013–3026. doi:10.1007/s00018-019-03338-4
28. Navratilova Z, Kolek V, Petrek M. Matrix metalloproteinases and their inhibitors in chronic obstructive pulmonary disease. Arch Immunol Ther Exp (Warsz). 2016;64(3):177–193. doi:10.1007/s00005-015-0375-5
29. Pandey KC, De S, Mishra PK. Role of proteases in chronic obstructive pulmonary disease. Front Pharmacol. 2017;8:512. doi:10.3389/fphar.2017.00512
30. Gilowska I, Kasper Ł, Bogacz K, et al. Impact of matrix metalloproteinase 9 on COPD development in Polish patients: genetic polymorphism, protein level, and their relationship with lung function. Biomed Res Int. 2018;2018:1–11. doi:10.1155/2018/6417415
31. Halpin DM, Criner GJ, Papi A, et al. Global initiative for the diagnosis, management, and prevention of chronic obstructive lung disease. The 2020 GOLD science committee report on COVID-19 and chronic obstructive pulmonary disease. Am J Respir Crit Care Med. 2021;203(1):24–36. doi:10.1164/rccm.202009-3533SO
32. Graham BL, Steenbruggen I, Miller MR, et al. Standardization of spirometry 2019 update. An official American thoracic society and European respiratory society technical statement. Am J Respir Crit Care Med. 2019;200(8):e70–e88. doi:10.1164/rccm.201908-1590ST
33. Ko FW, Chan KP, Hui DS, et al. Acute exacerbation of COPD. Respirology. 2016;21(7):1152–1165. doi:10.1111/resp.12780
34. Burnett D, Stockley RA. Serum and sputum alpha 2 macroglobulin in patients with chronic obstructive airways disease. Thorax. 1981;36(7):512–516. doi:10.1136/thx.36.7.512
35. Sood A, Assad NA, Barnes PJ, et al. ERS/ATS workshop report on respiratory health effects of household air pollution. Eur Respir J. 2018;51(1):1700698. doi:10.1183/13993003.00698-2017
36. Rehman AA, Ahsan H, Khan FH. Alpha‐2‐macroglobulin: a physiological guardian. J Cell Physiol. 2013;228(8):1665–1675. doi:10.1002/jcp.24266
37. Linder R, Rönmark E, Pourazar J, Behndig AF, Blomberg A, Lindberg A. Proteolytic biomarkers are related to prognosis in COPD-report from a population-based cohort. Respir Res. 2018;19(1):1–7. doi:10.1186/s12931-018-0772-5
38. Fontana V, Silva PS, Belo VA, et al. Consistent alterations of circulating matrix metalloproteinases levels in untreated hypertensives and in spontaneously hypertensive rats: a relevant pharmacological target. Basic Clin Pharmacol Toxicol. 2011;109(2):130–137. doi:10.1111/j.1742-7843.2011.00698.x
39. Zhang Y, Ni H, Zhou H. Study on the expression of Toll-like receptor 4 and matrix metalloproteinase-9 in patients with chronic obstructive pulmonary disease and their clinical significance. Eur Rev Med Pharmacol Sci. 2017;21(9):2185–2191.
40. Sng JJ, Prazakova S, Thomas PS, Herbert C. MMP-8, MMP-9 and neutrophil elastase in peripheral blood and exhaled breath condensate in COPD. J Chronic Obstr Pulm Dis. 2017;14(2):238–244. doi:10.1080/15412555.2016.1249790
41. Uysal P, Uzun H. Relationship between circulating Serpina3g, matrix metalloproteinase-9, and tissue inhibitor of metalloproteinase-1 and-2 with chronic obstructive pulmonary disease severity. Biomolecules. 2019;9(2):62. doi:10.3390/biom9020062
42. Montaño M, Sansores RH, Becerril C, et al. FEV1 inversely correlates with metalloproteinases 1, 7, 9 and CRP in COPD by biomass smoke exposure. Respir Res. 2014;15(1):1–7. doi:10.1186/1465-9921-15-74
43. Pinto-Plata V, Casanova C, Müllerova H, et al. Inflammatory and repair serum biomarker pattern. Association to clinical outcomes in COPD. Respir Res. 2012;13(1):1–8. doi:10.1186/1465-9921-13-1
44. Yao H, Hwang J-W, Sundar IK, et al. SIRT1 redresses the imbalance of tissue inhibitor of matrix metalloproteinase-1 and matrix metalloproteinase-9 in the development of mouse emphysema and human COPD. Am J Physiol Lung Cell Mol Physiol. 2013;305(9):L615–L624. doi:10.1152/ajplung.00249.2012
45. Lo C-Y, Huang H-Y, He J-R, et al. Increased matrix metalloproteinase-9 to tissue inhibitor of metalloproteinase-1 ratio in smokers with airway hyperresponsiveness and accelerated lung function decline. Int J Chron Obstruct Pulmon Dis. 2018;13:1135. doi:10.2147/COPD.S161257
46. Esa SA, Rawy AM, EL-Behissy MM, Kamel MH, El-Hwaitty HMMM. Study of the level of sputum matrix metalloproteinase-9 (MMP-9) and tissue inhibitor metalloproteinase-1 (TIMP-1) in COPD patients. Egypt J Chest Dis Tuberc. 2014;63(4):861–867. doi:10.1016/j.ejcdt.2014.06.014
47. Pons A, Sauleda J, Noguera A, et al. Decreased macrophage release of TGF-β and TIMP-1 in chronic obstructive pulmonary disease. Eur Respir J. 2005;26(1):60–66. doi:10.1183/09031936.05.00045504
48. Verrills NM, Irwin JA, Yan HX, et al. Identification of novel diagnostic biomarkers for asthma and chronic obstructive pulmonary disease. Am J Respir Crit Care Med. 2011;183(12):1633–1643. doi:10.1164/rccm.201010-1623OC
 © 2023 The Author(s). This work is published and licensed by Dove Medical Press Limited. The
full terms of this license are available at https://www.dovepress.com/terms
and incorporate the Creative Commons Attribution
- Non Commercial (unported, 3.0) License.
By accessing the work you hereby accept the Terms. Non-commercial uses of the work are permitted
without any further permission from Dove Medical Press Limited, provided the work is properly
attributed. For permission for commercial use of this work, please see paragraphs 4.2 and 5 of our Terms.
© 2023 The Author(s). This work is published and licensed by Dove Medical Press Limited. The
full terms of this license are available at https://www.dovepress.com/terms
and incorporate the Creative Commons Attribution
- Non Commercial (unported, 3.0) License.
By accessing the work you hereby accept the Terms. Non-commercial uses of the work are permitted
without any further permission from Dove Medical Press Limited, provided the work is properly
attributed. For permission for commercial use of this work, please see paragraphs 4.2 and 5 of our Terms.