Back to Journals » Clinical Ophthalmology » Volume 15
A Virtual Reality Orientation and Mobility Test for Inherited Retinal Degenerations: Testing a Proof-of-Concept After Gene Therapy
Authors Aleman TS, Miller AJ ![]() , Maguire KH, Aleman EM, Serrano LW, O'Connor KB, Bedoukian EC, Leroy BP
, Maguire KH, Aleman EM, Serrano LW, O'Connor KB, Bedoukian EC, Leroy BP ![]() , Maguire AM, Bennett J
, Maguire AM, Bennett J
Received 20 November 2020
Accepted for publication 22 January 2021
Published 2 March 2021 Volume 2021:15 Pages 939—952
DOI https://doi.org/10.2147/OPTH.S292527
Checked for plagiarism Yes
Review by Single anonymous peer review
Peer reviewer comments 2
Editor who approved publication: Dr Scott Fraser
Supplementary video 1: Practice Course showing virtual obstacles including swinging pendulum
Views: 611
Tomas S Aleman,1– 3 Alexander J Miller,4 Katherine H Maguire,1,2 Elena M Aleman,2 Leona W Serrano,1,2 Keli B O’Connor,1,2 Emma C Bedoukian,5 Bart P Leroy,3,6– 8 Albert M Maguire,1– 3 Jean Bennett1,2
1Scheie Eye Institute at the Perelman Center for Advanced Medicine, University of Pennsylvania, Philadelphia, PA, USA; 2Center for Advanced Retinal and Ocular Therapeutics, University of Pennsylvania, Philadelphia, PA, USA; 3Division of Ophthalmology at the Children’s Hospital of Philadelphia of the Department of Ophthalmology, University of Pennsylvania, Philadelphia, PA, USA; 4Neurology Virtual Reality Laboratory of the Department of Neurology, University of Pennsylvania, Philadelphia, PA, USA; 5Division of Human Genetics, The Children’s Hospital of Philadelphia, Philadelphia, PA, USA; 6Department of Pediatrics, Ghent University, Ghent, Belgium; 7Department of Ophthalmology, Ghent University, Ghent, Belgium; 8Center for Medical Genetics, Ghent University Hospital, Ghent, Belgium
Correspondence: Tomas S Aleman
Perelman Center for Advanced Medicine, University of Pennsylvania, 3400 Civic Center Boulevard, Philadelphia, PA, 19104, USA
Tel +1 215 662 8676
Fax +1 215 615 0527
Email [email protected]
Purpose: To test the ability of a virtual reality (VR) orientation and mobility (O&M) protocol to serve a measure of functional vision for patients with inherited retinal degenerations (IRDs).
Methods: A VR-O&M protocol designed using a commercially available VR hardware was tested in normally sighted control subjects (n=7; ages 10– 35yo; Average 22.5yo) and patients with RPE65-associated Leber Congenital Amaurosis (n=3; ages 7– 18yo; Average 12.7yo), in two of them before and after gene therapy. Patients underwent perimetry and full-field sensitivity testing. VR-O&M parameters correlated with the visual dysfunction.
Results: Visual acuities in RPE65 patients were on average worse than 20/200, dark-adapted sensitivity losses > 5 log units, and fields constricted between 20° and 40°. Before treatment, patients required ∼ 1000-fold brighter environment to navigate, had at least x4 more collisions, and were slower both to orient and navigate compared to control subjects. Improvements in cone- (by 1– 2 L.u.) and rod-mediated (by > 4 L.u.) sensitivities post-treatment led to fewer collisions (at least by half) at ∼ 100-fold dimmer luminances, and to x4 times faster navigation times.
Conclusion: This study provides proof-of-concept data in support for the use of VR-O&M systems to quantify the impact that the visual dysfunction and improvement of vision following treatments has on functional vision in IRDs. The VR-O&M was useful in potentially challenging scenarios such as in pediatric patients with severe IRDs.
Translational Relevance: A VR-O&M test will provide much needed flexibility, both in its deployment as well as in the possibility to test various attributes of vision that may be impacted by gene therapy in the setting of translational studies.
Precis: This study provides proof-of-concept data in support for the use of a virtual reality orientation and mobility test to quantify the impact of the disease and of treatments thereof on functional vision in inherited retinal degenerations.
Keywords: virtual reality, mobility, orientation, gene therapy, LCA, RPE65
Introduction
Visual function describes the perception by the visual system of physical attributes of objects as they are illuminated, such as detail (visual resolution), position of objects in space (visual field extent and sensitivity, binocularity), the ability to perceive objects by the difference in luminance or color against a background (contrast sensitivity and color vision), the sensitivity to light in dark-adapted conditions and in ranges of background light levels (absolute light sensitivity and incremental sensitivity), the ability to perceive movements (motion detection), or to adjust to transitions through different ambient light levels (dark- and light-adaptation). Functional vision, on the other hand, refers to the ability of a subject to use his or her vision to perceive the environment.1 The various attributes of vision, such as visual resolution or acuity, are commonly tested in isolation, both in experimental environments as well as in the clinic, a scenario detached from the use of functional vision. An approach to explore functional vision has been the assessment of orientation and mobility (O&M), defined as the “ability to correctly recognize one’s position with respect to the immediate environment and to travel safely and independently”. This is usually accomplished by evaluating performance in selected scenarios or on standardized mobility courses.2–4
The successful treatment of patients with vision loss due to bi-allelic mutations in RPE65 in Phase III clinical trials led to the recent approval by the FDA of the first gene therapy product for use in the clinic as a treatment for an inherited retinal degeneration (IRD).5,6 This landmark translational research has ushered a number of clinical trials for other forms of inherited retinal degenerations (IRDs), which will hopefully result in clinically available treatments. Among the challenges to the transition from clinical trial research to the clinic is a need for testing paradigms that can quickly, accurately, and reproducibly define the level of visual function, not only in the strict conditions of a clinical trial but in the less ideal conditions of a clinic, as well as the need to characterize the patient’s functional vision.
The need for clinically relevant simulations as end points for clinical trials for IRDs became obvious during the initial phases of the RPE65 gene therapy trials and was addressed through the design and implementation of O&M courses.5,7–9 While the various O&M courses used were able to provide a measure of the impact of the severe retinal dysfunction and of the improvement in vision that followed these treatments, the experience confirmed a number of limitations of physical mobility courses for the assessment of functional vision, particularly for the extended group of patients with IRDs.5,7–15 Among the most obvious limitations was the need to address the diverse mechanisms of vision loss (for example, central vs peripheral vision loss, predominant rod- vs cone-mediated dysfunction, etc.), as well as to accommodate the wide spectrum of severity encountered in this clinically heterogeneous group of disorders with easily modifiable, disease- and stage-specific simulation algorithms. Additional limitations are the need for a dedicated, light-tight, homogenously illuminated physical space, and the time-consuming assembly of numerous hardware and assisting personnel.5,7–9,16
In the current work, a VR O&M testing protocol and algorithm was developed using a commercially available VR hardware and custom-built software to try to overcome some of these challenges. There is great promise for the use of augmented reality and virtual reality (VR) in vision research and rehabilitation given the recent commercial releases of consumer headsets.1,17–22 The ultimate goal of our work was to determine if it would be worth taking this path and invest the time and resources required to fully develop and validate VR-O&M protocols as endpoints for translational research in severe retinal degenerations. We present proof-of-concept data in support of a VR-O&M test to detect changes in visual behavior resulting from severe outer retinal degenerations as well as following retinal gene therapy. The work should serve as a starting point to fully develop and validate the approach.
Methods
Subject Details
Various versions of an evolving VR-O&M protocol were evaluated in 8 patients (ages 17 to 43 years) with Leber congenital amaurosis (LCA) (RPE65-LCA, n = 7; CEP290-LCA, n = 1) as well as normally sighted control subjects (n = 3; ages 18–64 years) (Supplemental Table 1). The resulting VR-O&M protocol was then tested in three patients with RPE65-LCA who underwent retinal imaging and psychophysical testing, two of them before and after gene therapy, as well as in 7 control subjects (Table 1). All subjects underwent a complete ophthalmic examination. Informed consent or assent and parental permission were obtained from the subjects; the procedures adhered to the Declaration of Helsinki and the studies approved by the Institutional Review Board of the University of Pennsylvania (protocol # 815348). The subjects can wear corrective glasses comfortably under the VR headpiece so that the test is performed using best-corrected distance visual acuity.
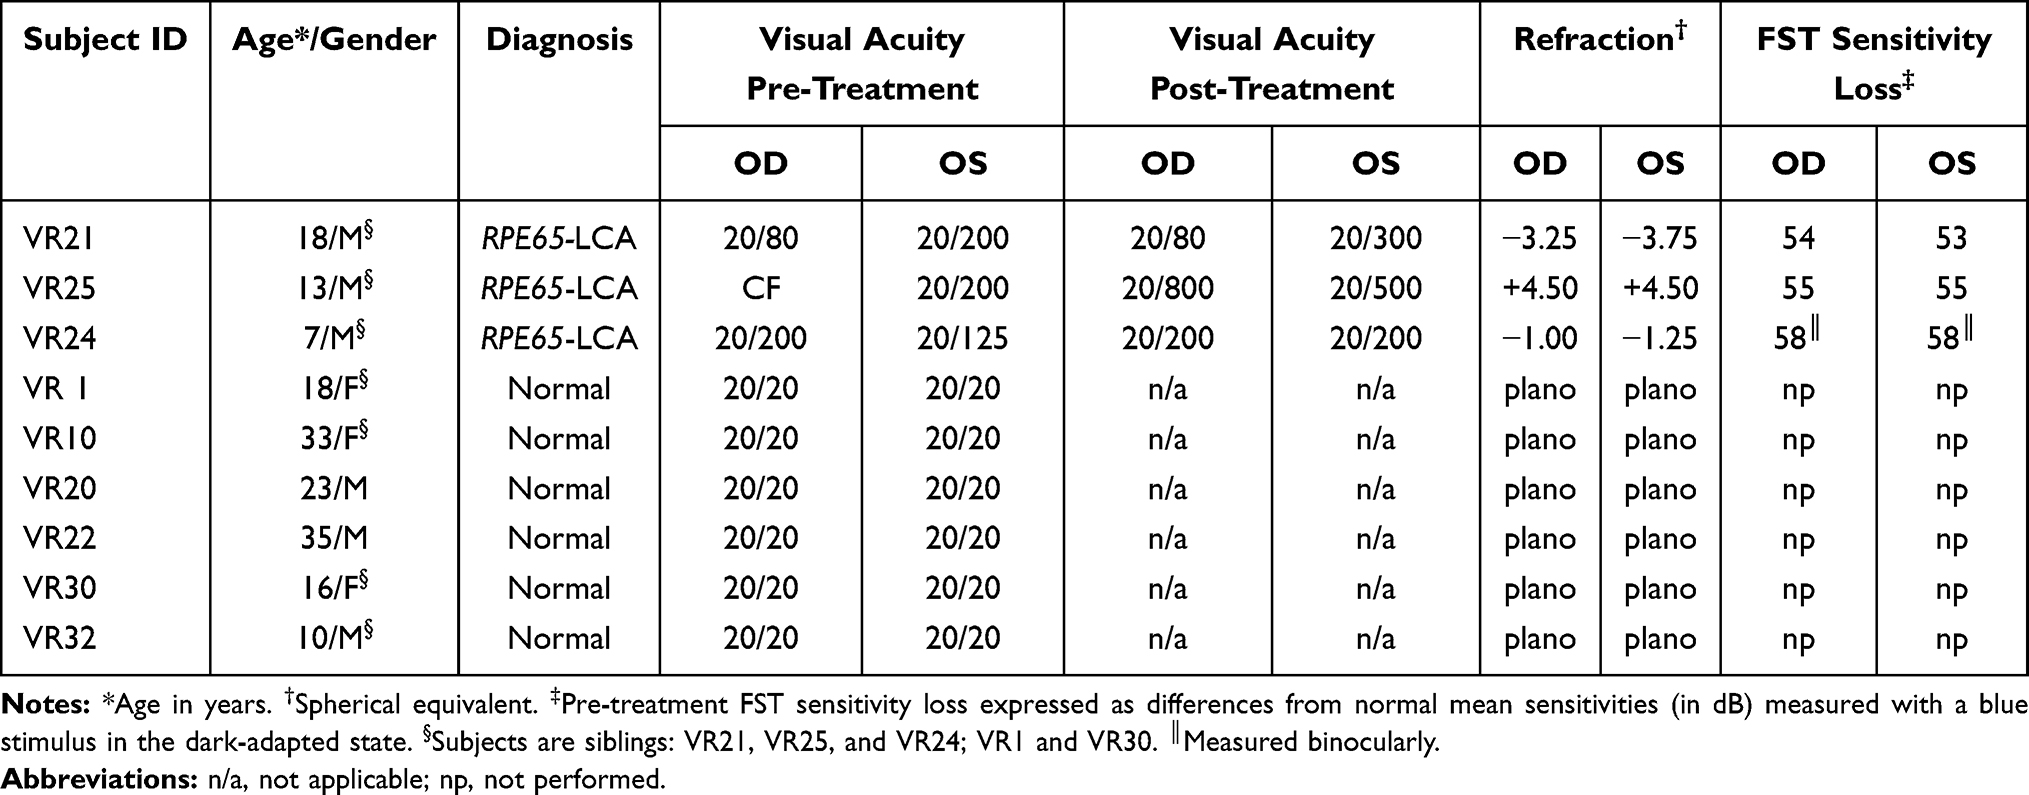 |
Table 1 General Characteristic of Study Participants |
Virtual Reality System and Environment
VR Test Overview
The virtual reality mobility test paradigm is similar to but not an exact replica of the physical mobility test used in studies that led to approval of the gene therapy drug, Luxturna.12 Like the “Luxturna” mobility course, subjects follow arrows through a course while avoiding collisions and find a door at the end and are scored on accuracy and speed. However, for the VR course, subjects are fitted with goggles (which include a head tracker), hand trackers held at waist level, and foot trackers. The VR course (unlike the Luxturna physical course) employs arrows that are red (not black) and tuned to be sure that they are just bright enough to be visible to the subject. Also, unlike the Luxturna course, there is no mechano-sensory feedback and no possibility that the subject can echo-locate an object given that the objects are virtual. As the subject navigates the practice course, a course that is displayed under bright illumination, the path and obstacles can be highlighted one by one to be sure that the subject learns to recognize the obstacles and avoid colliding with them (Figure 1A, Supplementary Video 1). Obstacles include stepover objects, boxes and spheres at designated heights, a swinging ball (pendulum) and a hanging sign. The subject is given the option to “step” on cylinders that may appear during the course (in order to mimic a physical step).
 |
Figure 1 Diagrams of custom-built VR-O&M course used in this study. (A) Different views of the colorized and bright practice test run delivered to each subject prior to dark-adaptation and formal testing shows the relative size of the subject with respect to the obstacles. (B and C) Subject’s position relative to the course run as seen from the system’s computer station. Shown are scenes from the “arrows only” simulation (A) and the “arrows plus obstacles” simulation (B). The trackers on the feet appear as pale grey ovals and, on the hands, as pale grey controllers. There is no door at the end of the “arrows only” course, but there is a door at the end of the “arrows plus obstacles” course. A caricature of a head (in white) wearing the headset is used to know the general direction of the subject’s gaze and position in the virtual space relative to the path and objects. (D and E) Additional perspectives of the VR&O&M course. The starting platform is an orange circle with a polyhedral pattern at the beginning of the path of arrows both simulations. The tester receives a feedback alert (green arrows) when the software automatically detects collisions, small red circles point to the “site of contact” between the subject’s body controllers with the obstacles. A view from above in (E) shows the subject negotiating the threshold of the “exit door” that signals the end of the run. |
After subjects were comfortable with the equipment and the test paradigm, they were dark adapted prior to a series of two-part tests. The first test series was designated to select the red arrow illuminance. For each individual test, the path of arrows was displayed when the subject found (or was directed to stand) on a virtual orange polyhedron. The arrow illuminance was increased in a staircase fashion for each test until the subject was able to successfully navigate the course. The path configuration was changed for each test to minimize learning effect. Success was based on accuracy and speed of completing the course. The arrow illuminance at which the subject could successfully navigate then was used to set the arrow illuminance for the second set of tests.
In the second series of tests, once the participant stepped on the starting point, both arrows (at the luminance that established in the first series of tests) and the obstacles (initially at very dim levels) appeared. At the end of each path was a “door” which marked the end of the course. As in the first series of tests, the subject followed the path illuminated by the red arrows but this time also avoiding obstacles. The luminance of the obstacles was increased in a staircase fashion until the subject could avoid collisions and accurately and quickly navigate the course. This object luminance level at which they could carry out the test accurately and quickly defined the threshold object luminance.
VR Test Technical Details
Custom-built software was designed for use on a commercially available virtual reality hardware (HTC VIVE, HTC America, Inc., Seattle, WA) to simulate virtual scenarios and test the visual abilities of patients with vision loss from IRDs (Supplementary text). The head-mounted VR device is fitted under dim (red) illumination after 30 minutes of dark-adaptation (Figure 1B and C). The field of view subtends 110°. Performance of right or left eyes alone can be measured by using the software to enable only the relevant eyepiece in the goggles.
While measuring luminance is appropriate and easy in physical O&M tests, as we have done in the past by placing sensors in the middle of the course or room and assuming that all surfaces are illuminated equally, we worried that in the optically complex VR space such measure would require undertaking assumptions that could compromise the reproducibility of the test by other investigators. For simplicity, we measured instead the maximal luminance of the system by pointing our radiometer (ILT1700, International Light Technologies, Inc. Peabody, MA, USA) to the empty achromatic or red background screen, considered a homogeneous surface illuminated at the maximal output of the VR device. From here on the values were then expressed as the aggregate luminances of all of the objects present in any given scene, each of them being fractions of the whole. Every object had the same luminance value. The maximal luminance of the white empty background was 144 cd.m−2. The maximum illuminance of the system is 345 Lux (measured with a Sekonic Flash Master L-358; Tokyo, Japan).
The virtual testing area was comprised of square tiles arranged in a rectangle 5 tiles wide and 10 tiles long (Figure 1A), thus occupying an area that is 2m X 3m. This area occupies the center of a larger room (5m X 6m). Thus, the subject is not at risk of accidentally bumping into the physical walls. The position of the subject is tracked around 360°. The testing at each session is done in two steps.
Arrow tests. The software controlling the VR system (wirelessly from a desktop computer) first uses a “shrinking staircase method” to elicit the threshold luminance for detection of red arrows on a dark background (Figure 1B, Supplementary Video 2A). The choice of color for the arrows was meant to keep interference with dark-adaptation of the extrafoveal retina to a minimum at the lowest “ambient” luminance levels. The starting ‘platform (orange polyhedron) is rendered with the same luminance as the arrows (see below) (Figure 1D). Control dark-adapted subjects can barely perceive (if at all) the arrows at the lowest luminance. The arrows are set in different path configurations for each test and these are presented randomly. The subject receives vibratory feedback after going off course. The layouts differ in location of starting points, directions of arrows, and ending point, but each test has the same number of objects and turns.
The scene with the red arrows has a maximum luminance of 41 cd.m−2. Each subject performs three runs per luminance level. Designation of pass vs fail at a given light level is made by the software on the basis of a “pass” for at least two of the three runs. The staircase configuration thus serves to converge on the lowest luminance at which the subject can follow the path reproducibly.
Arrow and Obstacle tests. The luminance of the arrows is kept invariant (at ~1 log unit higher than the “threshold” level measured in the “arrows only” test) with the goal that the subjects would use their most central vision to follow the path of arrows while using extrafoveal vision/peripheral vision to avoid collisions with objects (Figure 1C, Supplementary Video 2B). The obstacles are achromatic and are presented first at the dimmest setting. As with the initial arrow test, control, dark-adapted subjects, can barely perceive the objects at the lowest luminance. The tester receives feedback of collisions and position of the subject in the computer station (Figure 1D and E). Square and cylindrical objects are positioned randomly to the side, above and on the path below. One obstacle positioned either overhead or at waist level is a moving pendulum that the subject must recognize and avoid. Layouts are standardized to contain the same number of turns, obstacles (n=17) and obstacle types. Similar to the arrow test protocol, each object-containing test is carried out with a different randomly assigned layout. Objects are of variable size, ranging from approximately 5° to 20° in angular subtend. Their height and vertical positions scale with the height of the subject so that low-level obstacles are always at foot/tracker level, mid-level obstacles are always at controller/hand level (subjects are instructed to hold controllers at their side), and high-level obstacles are always at head level. Low level obstacles included “stepover” objects - those that were in the path delineated by arrows. Additional obstacles included signs that were the same level as the subject’s head that had to be ducked under, a swinging pendulum to be avoided, and black tiles (indicating virtual holes in the ground that should be avoided).
Scoring the Arrow and Obstacle Test Results
The software automatically recognizes and tabulates the speed (amount of time necessary to complete the test) and accuracy (departures from the path and collisions). The accuracy of the path was assessed by determining whether the subject stepped on each one of the arrows (or whether any were missed), whether the subject went off course, and whether the subject repeated any arrows. There were penalties for such mistakes (and also often an increase in the amount of time it took to complete the test due to going off course). The time and accuracy penalties were based on those used in the MLMT physical mobility course grading system.12 An excursion from the path was defined as two feet landing outside of the path (not just one), Instances where an individual leaned over, extended a foot outside of the path or directed their gaze in a different direction than indicated by the arrows, were not counted as excursions.
The entire performance is monitored from the desktop computer. Each collision is indicated to the test giver on the computer screen by a red sphere and a green arrow, where the sphere is centered on the point of the collision and the arrow is oriented to show the direction in which the relevant tracker was moving (Figure 1D and E).
VR Mobility Test Performance Pre- and Post-Treatment with Luxturna
Two patients diagnosed with RPE65-LCA were evaluated before and within 30 days after subretinal administration of the gene therapy product, voretigene neparvovec-rzyl (LuxturnaTM, Spark Therapeutics, Inc.), by pars-plana vitrectomy and subretinal injection to one or both eyes.5 Treatment was delivered sequentially to each eye (two weeks apart) and evaluations took place at baseline, between each eye administration and after both eyes had received treatment. The patients had their vision measured with psychophysics and their retinas imaged with multimodal imaging (Table 1 and Figure 2).
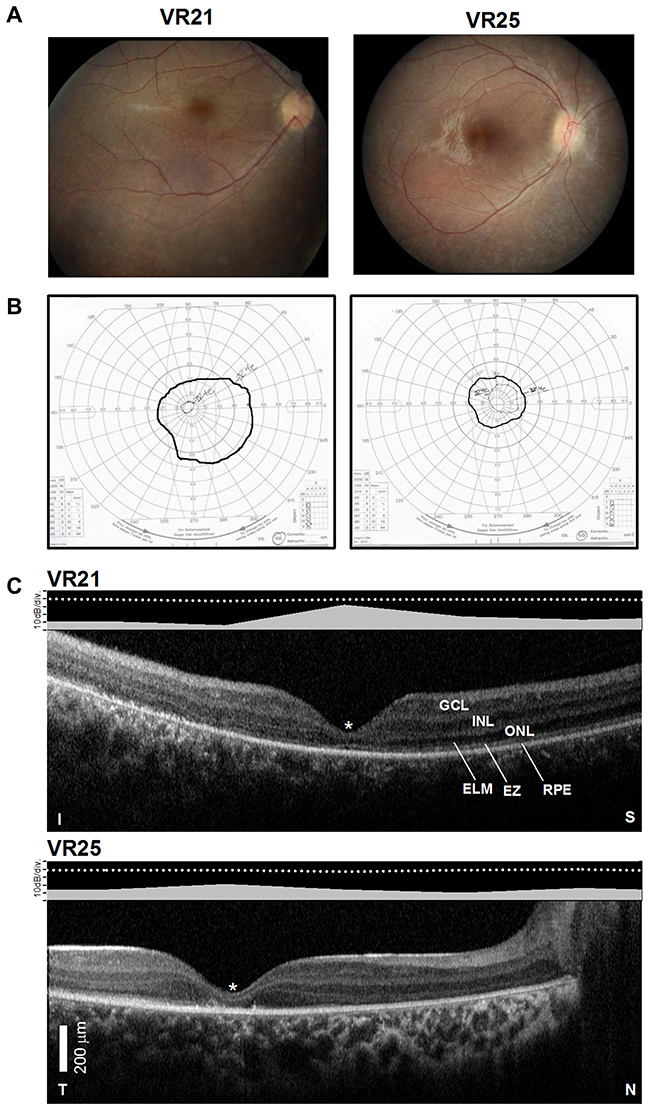 |
Figure 2 Structural–functional relationships in patients included in the study.Notes: (A) Color fundus images of the right eye of two of the patients. (B) Goldmann kinetic perimetry with large targets (V-4e and IV-4e) in untreated patients demonstrating limited extent of the visual fields (to the central 20–40°) and no perception of smaller targets. (C) 7 mm-long, non-straightened, SD-OCT cross-sections along the vertical (VR21) and horizontal (VR25) meridian through the fovea in two patients. Nuclear layers are labeled (ONL, outer nuclear layer, INL, inner nuclear layer, GCL, ganglion cell layer). Visible outer photoreceptor/RPE sublaminae are labeled (ELM, external limiting membrane; EZ, inner segment/outer segment ellipsoid region) following conventional terminology. T, temporal; N, nasal; I, inferior, S, superior retina. Calibration bar to the bottom left. The images illustrate severe foveal abnormalities and the asymmetric extent of the degree photoreceptor preservation around the foveal center (T > N, S > I) at this stage in patients from this family with RPE65-LCA. Asterisk denotes points to severe foveal ONL thinning with approximation of the EZ band to the RPE (VR21) or interruption (VR25). Bar above the scan show psychophysically determined cone (light-adapted, white stimulus). Dotted line above bar defines lower limit (mean – 2SD) of sensitivity for control subjects. Images illustrate structural functional dissociation with severe retinal dysfunction contrasting with relatively preserved central retinal structure. Adapted with permission from Maguire AM, Bennett, J, Aleman E, et al. Clinical Perspective: Treating RPE65-Associated Retinal Dystrophy. Mol Ther. 2021;29(2):442-463.5 |
Visual Psychophysics
A subset of patients had psychophysical estimates of their visual function measured (Table 1). Kinetic Goldmann visual fields were measured using size V-4e, IV-4e and I-4e stimuli. In patients who could reliably perform static perimetry, sensitivities were measured using 200-ms duration, Goldmann V targets presented in the light-adapted (achromatic stimuli) and dark-adapted (>45 min) (500 nm and 650 nm stimuli) state, using a modified Humphrey Field Analyzer (HFA II–I, Carl Zeiss Meditec, Dublin, CA), following published methodology.23,24 Thresholds were measured along the horizontal meridian at 2° intervals, extending to 30° of eccentricity. Visual sensitivity was also measured using a full-field sensitivity test (FST). Dark-adapted, full-field, sensitivity thresholds (FST) were determined with chromatic (blue, peak 467 nm and red, peak 637 nm) stimuli using a thresholding algorithm built-in into a computer-driven electroretinography (ERG) system.25–28 At least three separate determinations of the sensitivity for each stimulus type were performed. Spectral sensitivity differences were used to determine photoreceptor mediation of each stimulus condition.25–28 For simplicity, dark-adapted sensitivities and/or sensitivity losses reported throughout the manuscript refer to sensitivities determined with the blue stimulus.
Multimodal Retinal Imaging
Retinal imaging was done with spectral domain optical coherence tomography (SD-OCT) with 9-mm long horizontal sections crossing the anatomic fovea and with en-face near infrared (NIR) reflectance and fundus autofluorescence (FAF) imaging to NIR and short-wavelength (SW) excitation lights using a Spectralis-HRA system (Heidelberg Engineering GmbH, Heidelberg, Germany).
Results
The VR-O&M protocol was tested in six control subjects and in three of four affected siblings from a large consanguineous Emirati family in which an LCA phenotype segregates with novel homozygous multi-exon deletions (c.-544_1128del1672) in RPE65 (Table 1) (Supplementary text, Supplemental Figure 1).
The patients exemplify the severe dysfunction characteristic of the RPE65- associated disease. Visual acuity pre-treatment was greatly impaired and all patients had a low amplitude, intermittently fast beating mostly horizontal nystagmus (Table 1). Their fundus exam was typical of RPE65 disease, with mottled retinal pigment epithelium (RPE) in the midperiphery and a blunt foveal reflex (Figure 2A). Kinetic visual fields measured with a large V-4e target were constricted while the smallest (I-4e) target was undetectable (Figure 2B). SD-OCT demonstrated preservation of the photoreceptor outer nuclear layer (ONL) and inner segment/outer segment ellipsoid region band (EZ) superior and temporal retina, where the ONL could be within normal limits (Figure 2C). In contrast, there was severe foveal ONL thinning (VR21 = 27 μm, VR25 = 23 μm; normal ± 2SD = 106 ± 34 μm) and approximation of the EZ to the RPE within the central retina from outer segment shortening or loss in both patients (Figure 2C). Patient VR25 shows an interrupted EZ band (Figure 2C). Co-localized light-adapted static perimetry confirmed small fields with at least 1.5 log unit of sensitivity loss except for near fixation where sensitivities were within 5 dB of the lower limit of normal (Figure 2C). Absolute dark-adapted sensitivities by FST were reduced by at least 5 log units in all three patients (Table 1).
Virtual Reality Orientation and Mobility Performance
Arrow-Only Tests
All control subjects were able to quickly orient themselves and locate the starting platform and trigger the start of the runs. They could also reliably orient themselves at luminances ≤0.2 cd.m−2 and take the first step from 3 to 7 seconds of the start of the run (Figure 3A; Supplementary Video 2A). At the threshold luminance at which control subjects could reliably follow the path of arrows (≤0.2 cd.m−2), they still stepped off the path accidentally (on average 1.5 times; range 1–4 ‘missed floor tiles’). They completed the run in less than 40 seconds (Figure 3B). Interestingly, with increases in luminance (at ~2 cd.m−2) control subjects tended to spend at least twice as much time (~20 s) orienting themselves before taking the first step onto the path of arrows although they always completed the runs accurately without wandering off course (Figure 2B).
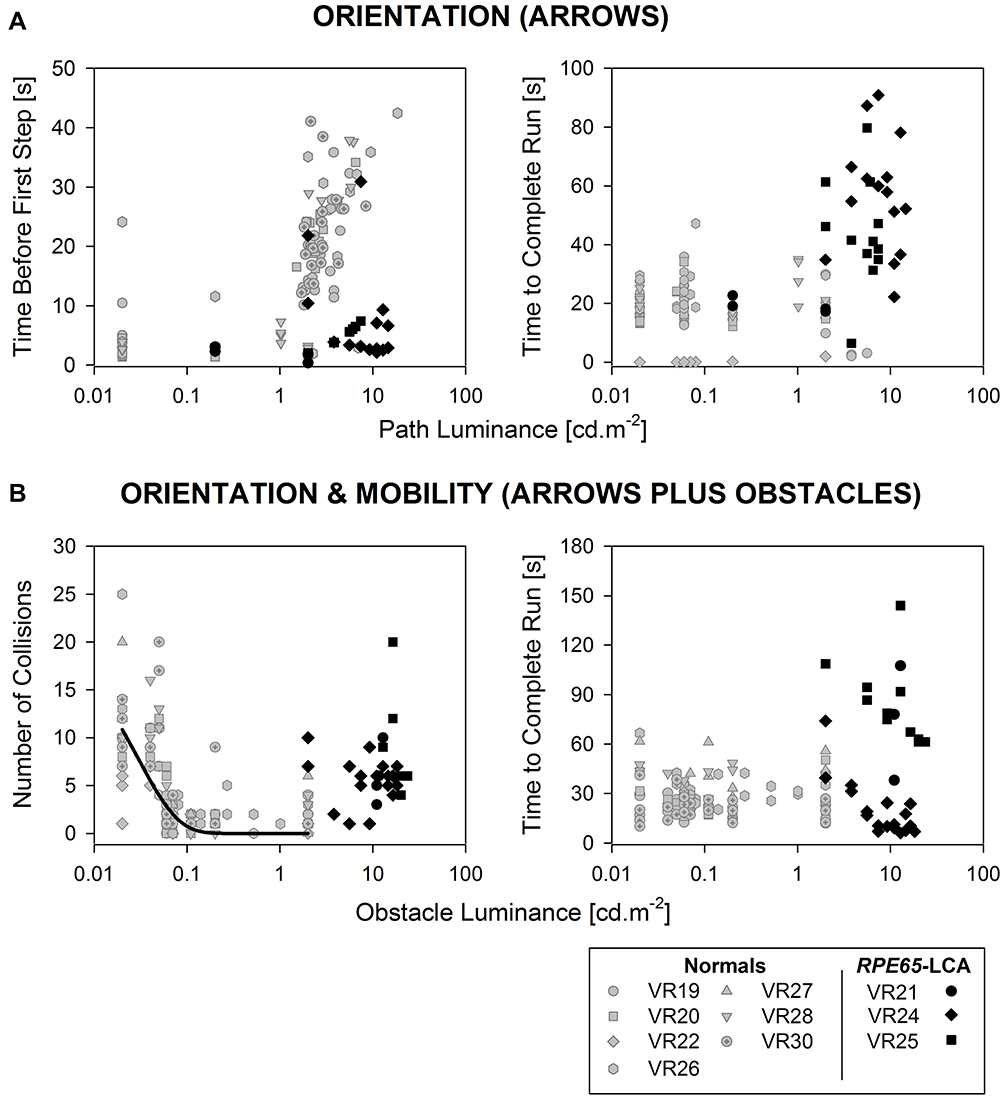 |
Figure 3 Performance parameters of the virtual reality orientation and mobility test. Shown are data points for timing and collision parameters for each run as a function of the luminance of the path of arrows (A) or of the arrows + obstacles (B) in control subjects (gray symbols) compared to patients (black symbols). Thick black line in (B) fits a preliminary exponential decay function [y=21.2*exp(−33.5*x); r=0.68] describing the relationship between the number of collisions and the luminance of the objects in the VR-O&M course in control subjects. |
Although all three RPE65-LCA patients were able to complete the test (Table 1) none of them could properly find and follow the path when the arrows’ luminance was <3.0 cd.m−2, a level that allowed perfect performance in control subjects (Figure 3A). They were much slower compared to control subjects, although the time to complete the task varied between runs and between the patients, ranging from 10 to 80 seconds (Figure 3B).
Arrows Plus Objects Tests
At the lowest “ambient” luminance (~0.02 cd.m−2), control subjects tracked the path of arrows correctly, but frequently collided with objects, from 2 to as many as 25 collisions (Figure 3B). Increasing luminance of objects (keeping the luminance of the path of arrows invariant) improved performance, although they occasionally collided with objects (4 ± 2.6 collisions at luminances >0.1 cd.m−2) (Figure 3B; Supplementary Video 2B). The time to complete the runs was variable at the lowest luminance (10–66 s), taking them about a half a minute (mean ± 2SD= 39 ± 32 s) to complete the run, a slightly slower performance compared with the time required to follow the track without obstacles mean (20 ± 6 s). Increasing the luminance of the objects shortens the time to complete the task (12–56 s).
At the lowest luminances, untreated patients could not find or follow the path or avoid collisions with objects. As in the arrows only test, they left the path with greater frequency compared to control subjects and often leaned over or walked back and forth and turned his head frequently in order to try to resolve the path and obstacles (Supplementary Video 3A). With increasing luminance, they were able to perform better as evidenced by less frequent departures from the path and by fewer collisions and shorter intervals to complete the runs; however, none of them attained a “Pass” by the software.
The increase in object luminance required for the patients to complete the O&M test was roughly equivalent (1–2 log units) to the level of threshold elevation measured with light-adapted perimetry (Figures 2C and 3B). Control subjects were able to complete the entire testing protocol (arrows-only and arrows pus obstacles); typically, ~30 different runs) in about half an hour, whereas patients took about twice as long.
Virtual Reality Orientation and Mobility After Gene Therapy
Two of the VR subjects in a consanguineous family with RPE65 mutations (Supplementary Figure 1) received gene therapy (VR21 and VR25). Preserved photoreceptors by SD-OCT supported treatment potential (Figure 2C). NIR-FAF imaging at baseline showed better preservation of the NIR-FAF signal around the nerve and in the far pericentral retina/near midperiphery, albeit overall grossly reduced compared to normal Figure 4A. The subretinal injections were performed uneventfully and the subretinal blebs carrying the treating solution extended from superior retina crossing the fovea into the inferior pericentral retina in both patients Figure 4A. After treatment, there was no improvement in visual acuity (Table 1) and only a modest expansion of their kinetic visual field (Supplemental Figure 2). There was a dramatic increase (45–60 dB) in dark-adapted sensitivities with all locations measured within the central retina becoming rod-mediated by two-color dark-adapted perimetry, reaching near normal levels in some locations Figure 4B. Light-adapted sensitivities showed improvements (by 10–25 dB) supporting partial recovery of cone function Figure 4B. Foveal sensitivities remained unchanged post-treatment. Improvements were confirmed by FST and occurred as early as 9–10 days post-treatment (Figure 4C). The magnitude of change by FST was similar (within ~5 dB) compared to that documented by static perimetry. Both treated patients reported great improvements in their ability to navigate in everyday life within a week of the interventions, especially indoors and in dim places. They required less assistance to move about after treatment. Both patients were tested with the finalized VR-O&M test before and two weeks to a month after treatment.
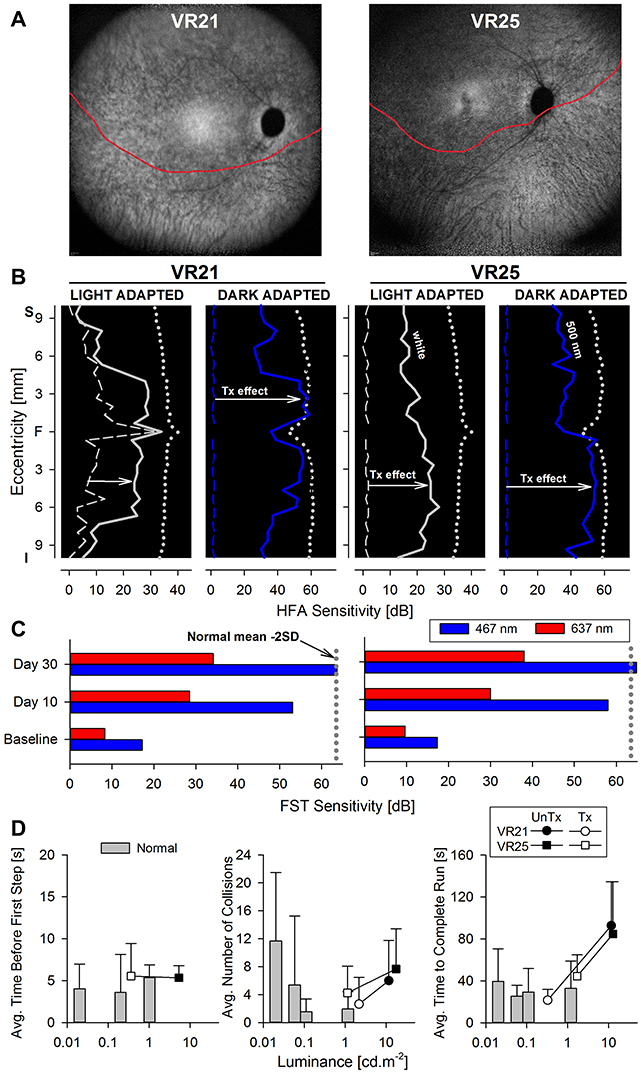 |
Figure 4 Changes in retinal sensitivity and performance of RPE65-LCA patients on the virtual reality orientation and mobility test after gene therapy.Notes: (A) NIR-FAF, 55°-wide images of the posterior retina of the right eye of the two with RPE65-LCA treated with bilateral subretinal gene therapy (Luxturna, Sparks Therapeutics Inc., Philadelphia, PA, USA). Red line denotes the inferior boundary of a subretinal bleb that contains the treating agent, which extended from the superior retina crossing the fovea and into the inferior pericentral retina. (B and C) Changes in retinal sensitivity measured by automated static perimetry (B) and FST (C) after gene therapy. (B) Light-adapted achromatic and dark-adapted two-color chromatic static perimetry (shown only responses to a blue 500 nm stimulus) in the patients before (dashed lines) and after (continuous line) gene therapy. Dotted lines define lower limit (mean – 2SD) of sensitivity in control subjects. S, superior; I, inferior visual field. Horizontal arrows show the improvement in sensitivity supporting a treatment effect. (C) FST sensitivity estimates measured with spectral stimuli (blue, 467 nm; red, 637 nm) in dark-adapted (>30 min) patients. Dotted gray line is the lower limit (mean-2SD) of the sensitivity to the short wavelength 467 nm stimulus in control subjects. Values are converted into positive dB values from possible negative outputs from the FST instrument. (D) Summary VR-O&M parameters in patients compared to control subjects in this study for timing orientation parameter in the “arrows only” test (left panel), and for collisions (middle panel) and performance timing (right panel) of the “arrows plus obstacles” test. Shown are mean values + 2SD. Data points for patients before treatment (pre-Tx = black symbols) are connected to post-treatment (post-Tx; white symbols) values to demonstrate the main shift in performance. VR21 did not undergo “arrows only” testing post-treatment. Panels A-C reproduced with permission from Maguire AM, Bennett, J, Aleman E, et al. Clinical Perspective: Treating RPE65-Associated Retinal Dystrophy.Mol Ther. 2021;29(2):442–463.5 |
Representative VR-O&M videos demonstrate the results qualitatively. VR25 received VR testing prior to injection of either eye with Luxturna. Before treatment he could reliably follow the path of arrows in the absence of obstacles at ~7 cd.m−2. In the “arrows plus obstacles” test sequence, he had great difficulty (Supplementary Video 3A), even when the obstacles were brightly illuminated at (13 cd.m−2).
VR25 received follow-up testing 2 weeks after his second eye had been injected. As shown in Supplementary Video 3B where objects were at greatly reduced luminance compared to baseline (5 cd.m−2 instead of 13 cd.m−2), VR25 rapidly assessed the course layout and took decisive and accurate steps. He passed with a time score of 29 seconds and after colliding with 3 different obstacles.
VR21, the older brother of VR25, received baseline VR testing starting 10 days after treatment of his first (left) eye with Luxturna. His second (right) eye was untreated. VR21’s test results reflect his status pre-treatment when tested monocularly for the right eye. At baseline, VR21 was able to follow the arrows (“arrows only” task) when they were at a luminance of 3 cd.m−2. However, he was unable to successfully navigate the arrow path + obstacle course even at high object luminance (13 cd.m−2). As shown in Supplementary Videos 4A and 4B, under dim (2 cd.m−2) illumination, VR21 successfully navigated the course in 26 secs monocularly with both his right eye and left eye two weeks after intervention, bumping into only one obstacle in each test.
In summary, both VR25 and VR21 were able to navigate the VR mobility course more accurately and faster and at lower luminances using each eye independently after treatment than they had been able to using either eye alone or even both eyes together prior to treatment.
Preliminary summary parameters for the VR-O&M test are presented in Figure 4D. For the arrows only test, VR25 after treatment (VR21 did not have the arrows only test on his post-treatment visit) was able to orient himself and take the first step within 5 seconds, at a level of path luminance that was approximately a hundred-fold dimmer than baseline (Figure 4D, left panel). For the arrows plus obstacles test, both patients showed improved performance after treatment with ≤50% the number of collisions (Figure 4D, middle panel), four times faster navigation times (Figure 4D, right panel), at object luminance levels that were at least ten-fold dimmer compared to the pre-treatment, baseline tests. The behavioral changes by VR-O&M appear to relate better to the changes in cone-mediated vision measured by light-adapted perimetry. That is, although the patients navigated better in dimmer environments (by 1–2 log units) after treatment, the shift was modest compared to the dramatic improvement in rod-mediated vision (>4 log units) after gene therapy measured with dark-adapted perimetry and FST.
Discussion
The assessment of orientation and mobility, either by observing subjects accomplish specific tasks of daily living, or by grading their performance in standardized physical or virtual environments, has a long history of use in vision research.1,17,18 Recently, physical O&M courses were introduced as endpoint measures of functional vision in various clinical trials for IRDs.5,7–15 Their use in various RPE65-LCA clinical trials, while successful, confronted researchers with their limitations. In addition to the obvious dependency on a large physical space and cumbersome hardware, the O&M tests may not easily accommodate the various patterns of visual dysfunctions (for example, central vs peripheral vision loss, cone vs rod dysfunction), as well as the wide spectrum of disease severity encountered in the much larger group of IRDs. Current platforms are limited to specific visual attributes, being usually constrained to modulation of luminance and the position and size of obstacles. The number of O&M layouts is somewhat limited and the physical set-up laborious and time-consuming. The videos capture information which can be used to identify the subject, thus threatening patient confidentiality and conferring risk of bias in the grading process. Scoring of the tests requires review of videos by masked observers who subjectively grade collisions and other aspects of the performance. In addition, subjects with severe vision loss can use echolocation to orient themselves and navigate potentially confounding the interpretation of the results and the physical obstacles that can constitute tripping hazards.2,29 Unlike physical O&M courses, VR simulations promise potentially endless combinations of randomizable spatial arrangements, apparent ease of modulation of the visual attributes of both objects and surrounding scenery (for example, shape, size, height, contrast, color, luminance, textures), offer relative independence from the need of a physical space and provide automatic detection and quantitation of performance parameters, such as speed and number of collisions or events.
The modest goal of the current study was to test the ability of commercially available VR hardware and custom-built software to simulate a virtual environment in which the functional vision of patients with IRDs could be tested. We were particularly interested to know the limitations of the system and whether we could design a VR environment capable of detecting visual impairment and improvements in vision following gene therapy in severe retinal degenerations, especially in pediatric populations.
A VR-O&M environment was designed and tested in a small number of patients with severe vision loss in the category of LCA. Practice tests were administered prior to the full test sequence in order to familiarize the subjects with the test and to minimize the potential complications of learning effects. All control subjects and the great majority of patients tested during the development and final version of the test, including children, were able to complete the O&M tasks. By repeating tests, using multiple different test course layouts with different starting and ending points, and placing obstacles at different locations of each layout, we attempted to further minimize learning effects. Results of patient testing provided clear evidence of severe problems in both orientation and mobility. Patients who were able to complete the courses required greater objects luminance to perform the tasks, incurred at least twice as many incidents and were at least twice as slow compared to control subjects to complete the O&M tasks. Dramatic improvements in cone- and rod-mediated vision documented by automatic static perimetry and full-field sensitivity testing after gene therapy in two patients were accompanied by improvements in functional vision on the VR-O&M test, confirming the ability of this technology to track changes in function following gene therapy.
In the current VR studies, the subjects and their caretakers provided detailed feedback on the improvements that they observed after subretinal delivery of the gene therapy, voretigene neparvovec-rzyl. Similar to what was reported in the Phase 3 O&M studies, the individuals in this VR study were able to accurately, independently, and successfully navigate dimly lit hallways and sidewalks after gene therapy whereas before intervention, they were completely dependent on help from sighted individuals. Thus, the results of this pilot study of a VR mobility test also appear to reflect the subject’s visual performance in “real world” situations.
Although there is potential for VR devices to complement or even substitute in some cases conventional visual function tests such as perimetry, we constrained our simulated reality at least in this iteration, to a simple virtual environment that could be related to perimetric results or full-field psychophysics, while avoiding replicating a visual field test in the virtual space.30 Likewise, for this initial design, we avoided creating visually rich scenery, which would introduce multiple, complex visual cues complicating the interpretation of the results. With this in mind, the design resulted in two sequential test paradigms. The “arrows only” sequence fulfilled the role of an orientation task. A path of large red arrows was chosen to minimize interference with rod-mediated vision, allow perception by patients with low visual acuity and to serve as a simultaneous measure of central vision. Once a “threshold” for successful orientation was estimated, then the subjects were exposed to the mobility (arrow plus obstacle) tests, where achromatic obstacles placed on or to the side of the path of arrows were to be avoided. The use of achromatic objects on a dark-background extended the upper range of luminances allowing potential perception by the most severely affected patients and reduce the complexities that visually complex objects would introduce in transitions from rod-mediated to cone-mediated vision.31–37 The requirement to follow the path of arrows while measuring orientation and mobility also “locked” or oriented the subjects’ visual field in relationship to the track, reminiscent of the scenarios such as walking down a path while avoiding obstacles such as desks, or focusing on fixation targets used in clinical perimetry. Of course, other simulations may wish to probe other aspects of visual dysfunction or to replicate the visual world more faithfully once the basis for the changes in visual performance is better understood.
Although the test was easily implemented and completed in a relatively short time, the ability of the VR-O&M test to become an end-point in clinical trials demands validation studies focusing on the reproducibility and variability of the measures. Such studies could also carefully monitor for potential learning effects. In formal validation studies, we should be able to evaluate potential learning effects by testing untreated subjects at pre-specified time points before they receive Luxturna and then later, after they have received this intervention. Such studies could also explore the role that diminution of nystagmus (which has been reported after injection of the first eye) Although we considered designing the layouts to relate to activities of daily living such as stepping over or onto objects, entry through thresholds, and ducking under objects, work is needed to formally relate better parametrized VR-O&M tests with results of conventional instruments of visual behavior such as visual function questionnaires.38–47
In summary, the present work supports the utility of a VR-O&M test as a measure of functional vision in severe IRDs, including young patients, as well as a measure of improved visually guided navigation after gene therapy. Our preliminary work justifies the investment in time and resources needed to validate the reliability and variability of results obtained in this VR-O&M protocol as an endpoint of functional vision in larger populations of normally sighted subjects and patients with IRDs both prior to and concurrent with implementing this test in a clinical trial.
Acknowledgments
Our deepest gratitude to the families and patients for their participation in this study. Thanks are also due to Ms. Isabella A. Aleman and Ms. Denise J. Pearson for their help during the conduct of the experiments and with some of the data analyses.
Funding
Supported by grants from Hope for Vision, The Pennsylvania Lions Sight Conservation and Research Foundation, the F.M. Kirby Foundation and Center for Advanced Retinal and Ocular Therapeutics (CAROT), University of Pennsylvania.
Disclosure
TSA, AJM and JB are co-authors on intellectual property describing the virtual reality mobility test (PCT/US2019/029173 pending). BPL reports consultancy fees paid into research account at Ghent University Hospital from Bayer, Biogen, IVERIC Bio and Vedere Bio; reports research grants and consultancy fees paid into research account at Ghent University Hospital from GenSight Therapeutics, Novartis, and ProQR Therapeutics, outside the submitted work. The authors report no other conflicts of interest in this work.
References
1. Bennett CR, Bex PJ, Bauer CM, Merabet LB. The assessment of visual function and functional vision. Semin Pediatr Neurol. 2019;31:30–40. doi:10.1016/j.spen.2019.05.006
2. Shingledecker CA, Foulke E. A human factors approach to the assessment of the mobility of blind pedestrians. Hum Factors. 1978;20(3):273–286. doi:10.1177/001872087802000303
3. Marron JA, Bailey IL. Visual factors and orientation-mobility performance. Am J Optom Physiol Opt. 1982;59(5):413–426. doi:10.1097/00006324-198205000-00009
4. Chang KJ, Dillon LL, Deverell L, Boon MY, Keay L. Orientation and mobility outcome measures. Clin Exp Optom. 2020;103(4):434–448. doi:10.1111/cxo.13004
5. Maguire AM, Bennett, J, Aleman E, et al. Clinical Perspective: Treating RPE65-Associated Retinal Dystrophy. Mol Ther. 2021;29(2):442–463. doi:10.1016/j.ymthe.2020.11.029.
6. Russell S, Bennett J, Wellman JA, et al. Efficacy and safety of voretigene neparvovec (AAV2-hRPE65v2) in patients with RPE65-mediated inherited retinal dystrophy: a randomised, controlled, open-label, phase 3 trial. Lancet. 2017;390(10097):849–860. doi:10.1016/S0140-6736(17)31868-8
7. Bainbridge JW, Smith AJ, Barker SS, et al. Effect of gene therapy on visual function in Leber’s congenital amaurosis. N Engl J Med. 2008;358(21):2231–2239. doi:10.1056/NEJMoa0802268
8. Jacobson SG, Cideciyan AV, Ratnakaram R, et al. Gene therapy for leber congenital amaurosis caused by RPE65 mutations: safety and efficacy in 15 children and adults followed up to 3 years. Arch Ophthalmol. 2012;130(1):9–24. doi:10.1001/archophthalmol.2011.298
9. Bainbridge JW, Mehat MS, Sundaram V, et al. Long-term effect of gene therapy on Leber’s congenital amaurosis. N Engl J Med. 2015;372(20):1887–1897. doi:10.1056/NEJMoa1414221
10. Shapiro A, Corcoran P, Sundstrom C, et al. Development and validation of a portable visual navigation challenge for assessment of retinal disease in multi-centered clinical trials. Invest Ophthalmol Vis Sci. 2017;58(8).
11. Jacobson SG, Cideciyan AV, Sumaroka A, et al. Outcome measures for clinical trials of leber congenital amaurosis caused by the intronic mutation in the CEP290 gene. Invest Ophthalmol Vis Sci. 2017;58(5):2609. doi:10.1167/iovs.17-21560
12. Chung DC, McCague S, Yu Z-F, et al. Novel mobility test to assess functional vision in patients with inherited retinal dystrophies: multi-luminance mobility test. Clin Exp Ophthalmol. 2018;46(3):247–259.
13. Cideciyan AV, Jacobson SG, Drack AV, et al. Effect of an intravitreal antisense oligonucleotide on vision in Leber congenital amaurosis due to a photoreceptor cilium defect. Nat Med. 2019;25(2):225–228. doi:10.1038/s41591-018-0295-0
14. Black A, Lovie‐Kitchin JE, Woods RL, Arnold N, Byrnes J, Murrish J. Mobility performance with retinitis pigmentosa. Clin Exp Optom. 1997;80(1):1–12. doi:10.1111/j.1444-0938.1997.tb04841.x
15. Jacobson SG, Cideciyan AV, Peshenko IV, et al. Determining consequences of retinal membrane guanylyl cyclase (RetGC1) deficiency in human leber congenital amaurosis en route to therapy: residual cone-photoreceptor vision correlates with biochemical properties of the mutants. Hum Mol Genet. 2013;22(1):168–183. doi:10.1093/hmg/dds421
16. Chung DC, McCague S, Yu ZF, et al. Novel mobility test to assess functional vision in patients with inherited retinal dystrophies. Clin Exp Ophthalmol. 2018;46(3):247–259. doi:10.1111/ceo.13022
17. Warren WH, Kay BA, Zosh WD, Duchon AP, Sahuc S. Optic flow is used to control human walking. Nat Neurosci. 2001;4(2):213–216. doi:10.1038/84054
18. Bowers AR, Ananyev E, Mandel AJ, Goldstein RB, Peli E. Driving with hemianopia: IV. Head scanning and detection at intersections in a simulator. Invest Ophthalmol Vis Sci. 2014;55(3):1540–1548. doi:10.1167/iovs.13-12748
19. Apfelbaum H, Pelah A, Peli E. Heading assessment by “tunnel vision” patients and control subjects standing or walking in a virtual reality environment. ACM Trans Appl Percept. 2007;4(1):8. doi:10.1145/1227134.1227142
20. Peli E, Apfelbaum H, Berson EL, Goldstein RB. The risk of pedestrian collisions with peripheral visual field loss. J Vis. 2016;16(15):5. doi:10.1167/16.15.5
21. Jones PR, Somoskeoy T, Chow-Wing-Bom H, Crabb DP. Seeing other perspectives: evaluating the use of virtual and augmented reality to simulate visual impairments (OpenVisSim). NPJ Digit Med. 2020;3(1):32. doi:10.1038/s41746-020-0242-6
22. Lam AKN, To E, Weinreb RN, et al. Use of virtual reality simulation to identify vision-related disability in patients with glaucoma. JAMA Ophthalmol. 2020;138(5):490–498. doi:10.1001/jamaophthalmol.2020.0392
23. Jacobson S, Voigt W, Parel J-M, et al. Automated light- and dark-adapted perimetry for evaluating retinitis pigmentosa. Ophthalmology. 1986;93(12):1604–1611. doi:10.1016/S0161-6420(86)33522-X
24. Aleman TS, Han G, Serrano LW, et al. Natural history of the central structural abnormalities in choroideremia: a prospective cross-sectional study. Ophthalmology. 2017;124(3):359–373. doi:10.1016/j.ophtha.2016.10.022
25. Roman AJ, Schwartz SB, Aleman TS, et al. Quantifying rod photoreceptor-mediated vision in retinal degenerations: dark-adapted thresholds as outcome measures. Exp Eye Res. 2005;80(2):259–272. doi:10.1016/j.exer.2004.09.008
26. Roman AJ, Cideciyan AV, Aleman TS, Jacobson SG. Full-field stimulus testing (FST) to quantify visual perception in severely blind candidates for treatment trials. Physiol Meas. 2007;28(8):N51–56. doi:10.1088/0967-3334/28/8/N02
27. Aleman TS, Uyhazi KE, Serrano LW, et al. RDH12 mutations cause a severe retinal degeneration with relatively spared rod function. Invest Ophthalmol Vis Sci. 2018;59(12):5225–5236. doi:10.1167/iovs.18-24708
28. Uyhazi K, Aravand P, Bell B, et al. Treatment potential for LCA5-associated leber congenital amaurosis. Invest Ophthalmol Vis Sci. 2020;61(5):30. doi:10.1167/iovs.61.5.30
29. Kolarik AJ, Cirstea S, Pardhan S, Moore BC. A summary of research investigating echolocation abilities of blind and sighted humans. Hear Res. 2014;310:60–68. doi:10.1016/j.heares.2014.01.010
30. Mees L, Upadhyaya S, Kumar P, et al. Validation of a head-mounted virtual reality visual field screening device. J Glaucoma. 2020;29(2):86–91. doi:10.1097/IJG.0000000000001415
31. Walkey HC, Barbur JL. Guest editorial: shedding new light on the twilight zone. Ophthalmic Physiol Opt. 2006;26(3):223–224. doi:10.1111/j.1475-1313.2006.00420.x
32. Walkey HC, Barbur JL, Harlow JA, Hurden A, Moorhead IR, Taylor JA. Effective contrast of colored stimuli in the mesopic range: a metric for perceived contrast based on achromatic luminance contrast. J Opt Soc Am A Opt Image Sci Vis. 2005;22(1):17–28. doi:10.1364/JOSAA.22.000017
33. Walkey HC, Harlow JA, Barbur JL. Characterising mesopic spectral sensitivity from reaction times. Vision Res. 2006;46(25):4232–4243. doi:10.1016/j.visres.2006.08.002
34. Walkey HC, Harlow JA, Barbur JL. Changes in reaction time and search time with background luminance in the mesopic range. Ophthalmic Physiol Opt. 2006;26(3):288–299. doi:10.1111/j.1475-1313.2006.00412.x
35. Zele AJ, Cao D. Vision under mesopic and scotopic illumination. Front Psychol. 2014;5:1594. doi:10.3389/fpsyg.2014.01594
36. Zele AJ, Maynard ML, Feigl B. Rod and cone pathway signaling and interaction under mesopic illumination. J Vis. 2013;13(1):1. doi:10.1167/13.1.21
37. Zele AJ, Maynard ML, Joyce DS, Cao D. Effect of rod-cone interactions on mesopic visual performance mediated by chromatic and luminance pathways. J Opt Soc Am A Opt Image Sci Vis. 2014;31(4):A7–A14. doi:10.1364/JOSAA.31.0000A7
38. Mangione CM, Lee PP, Gutierrez PR, Spritzer K, Berry S, Hays RD. Development of the 25-item national eye institute Visual Function Questionnaire (VFQ-25). Arch Ophthalmol. 2001;119(7):1050–1058. doi:10.1001/archopht.119.7.1050
39. Dougherty BE, Bullimore MA. Comparison of scoring approaches for the NEI VFQ-25 in low vision. Optom Vis Sci. 2010;87(8):543–548. doi:10.1097/OPX.0b013e3181e61bd8
40. Massof RW. An interval-scaled scoring algorithm for visual function questionnaires. Optom Vis Sci. 2007;84(8):E690–705. doi:10.1097/OPX.0b013e31812f5f35
41. Massof RW. The measurement of vision disability. Optom Vis Sci. 2002;79(8):516–552. doi:10.1097/00006324-200208000-00015
42. Massof RW, Ahmadian L. What do different visual function questionnaires measure? Ophthalmic Epidemiol. 2007;14(4):198–204. doi:10.1080/09286580701487883
43. Massof RW, Hsu CT, Baker FH, et al. Visual disability variables. II: the difficulty of tasks for a sample of low-vision patients. Arch Phys Med Rehabil. 2005;86(5):954–967. doi:10.1016/j.apmr.2004.09.017
44. Massof RW, Hsu CT, Baker FH, et al. Visual disability variables. I: the importance and difficulty of activity goals for a sample of low-vision patients. Arch Phys Med Rehabil. 2005;86(5):946–953. doi:10.1016/j.apmr.2004.09.016
45. Massof RW, Rubin GS. Visual function assessment questionnaires. Surv Ophthalmol. 2001;45(6):531–548. doi:10.1016/S0039-6257(01)00194-1
46. Jeter PE, Rozanski C, Massof R, Adeyemo O, Dagnelie G. The PSG. Development of the Ultra-Low Vision Visual Functioning Questionnaire (ULV-VFQ). Transl Vis Sci Technol. 2017;6(3):11. doi:10.1167/tvst.6.3.11
47. Adeyemo O, Jeter PE, Rozanski C, et al. Living with ultra-low vision: an inventory of self-reported visually guided activities by individuals with profound visual impairment. Transl Vis Sci Technol. 2017;6(3):10. doi:10.1167/tvst.6.3.10
 © 2021 The Author(s). This work is published and licensed by Dove Medical Press Limited. The
full terms of this license are available at https://www.dovepress.com/terms
and incorporate the Creative Commons Attribution
- Non Commercial (unported, 3.0) License.
By accessing the work you hereby accept the Terms. Non-commercial uses of the work are permitted
without any further permission from Dove Medical Press Limited, provided the work is properly
attributed. For permission for commercial use of this work, please see paragraphs 4.2 and 5 of our Terms.
© 2021 The Author(s). This work is published and licensed by Dove Medical Press Limited. The
full terms of this license are available at https://www.dovepress.com/terms
and incorporate the Creative Commons Attribution
- Non Commercial (unported, 3.0) License.
By accessing the work you hereby accept the Terms. Non-commercial uses of the work are permitted
without any further permission from Dove Medical Press Limited, provided the work is properly
attributed. For permission for commercial use of this work, please see paragraphs 4.2 and 5 of our Terms.