Back to Journals » Drug Design, Development and Therapy » Volume 15
A Validated HPLC-MS/MS Method for Quantification of Methotrexate and Application for Therapeutic Drug Monitoring in Children and Adults with Non-Hodgkin Lymphoma
Authors Feng Z ![]() , Gao J
, Gao J ![]() , Gao X
, Gao X ![]() , Hua L, Nie X
, Hua L, Nie X ![]() , Sun Y, Wang M
, Sun Y, Wang M
Received 23 August 2021
Accepted for publication 19 October 2021
Published 5 November 2021 Volume 2021:15 Pages 4575—4583
DOI https://doi.org/10.2147/DDDT.S335122
Checked for plagiarism Yes
Review by Single anonymous peer review
Peer reviewer comments 3
Editor who approved publication: Professor Anastasios Lymperopoulos
Zhangying Feng, Jinglin Gao, Xiaonan Gao, Li Hua, Xuyang Nie, Yaqi Sun, Mingxia Wang
Department of Clinical Pharmacology, The Fourth Hospital of Hebei Medical University, Shijiazhuang, People’s Republic of China
Correspondence: Mingxia Wang
Department of Clinical Pharmacology, The Fourth Hospital of Hebei Medical University, 12 Jiankang Road, Shijiazhuang, 050011, People’s Republic of China
Tel +86311-66696233
Email [email protected]
Purpose: A simple, rapid and reliable method to quantify methotrexate (MTX) in human plasma by high-performance liquid chromatography–tandem mass spectrometry (HPLC-MS/MS) was established and validated in two laboratories.
Patients and Methods: Sample separation was achieved on a Synergi Hydro-RP column (50 mm× 2.0 mm, 2.5 μm) with a gradient elution program in 3.5 min after a simple protein precipitation with methanol (MeOH) and acetonitrile (ACN) (1:1). About 5 mM ammonium formate aqueous solution with 0.2% formic acid and ACN were used as mobile phase with a flow rate of 0.5 mL/min at 40 °C. Mass spectrometry detection using AB Sciex Triple Quad 4500 mass spectrometer (4500 QQQ) and Qtrap 5500 mass spectrometer (5500 Q-trap) were both characterized by electrospray ionization (ESI) for positive ions in multiple reaction-monitoring (MRM) mode. Quantitative ion pairs were m/z 455.1→m/z 308.0 for MTX and m/z 248.1→m/z 121.0 for tinidazole (TNZ) used as internal standard (IS).
Results: Linear calibration curves were generated over the range of 5– 1000 ng/mL (r2> 0.99) on both the 4500 QQQ and 5500 Q-trap, both of the intra- and inter-batch precision were less than 7.67% and accuracy ranged from 96.33% to 108.94%. The recovery and matrix effect were 82.20– 93.98% and 102.69– 105.28%, respectively.
Conclusion: An analytical method transfer was achieved by re-verification in two laboratories to ensure stability and reproducibility and this method has been applied for therapeutic drug monitoring (TDM) successfully in children and adults with NHL, and during routine TDM, two delayed elimination of MTX cases were observed and analyzed.
Keywords: methotrexate, therapeutic drug monitoring, non-Hodgkin lymphoma, children, adult
Introduction
Methotrexate (MTX-(N-[4-{[(2,4-diamino-6-pteridinyl) methyl] methylamino} benzoyl]-L-glutamic acid)) is a folate analog, generally prescribed at high dose (ie >1 g/m2 intravenously) applied in treatment of various types of cancers, such as acute lymphoblastic leukemia (ALL), non-Hodgkin lymphoma (NHL), osteosarcomas and choriocarcinoma.1–3
MTX competitively inhibits dihydrofolate reductase to block reduction of dihydrofolate to tetrahydrofolate, thereby hindering biosynthesis of purine and pyrimidine nucleotides, and ultimately DNA biosynthesis of the tumor cell is inhibited.4,5 However, MTX is a cell S-phase inhibitory drug with poor specificity. It has a certain cytotoxic effect on normal cells while being anti-tumor.6 Similar to other anti-tumor drugs, MTX also has a problem of a narrow therapeutic window, especially in the renal or liver impaired patients.7 Occurrence of side effects, including nephrotoxicity, blood toxicity, myelosuppression, and so on, has been observed among patients receiving high-dose MTX (HDMTX).8,9 In addition, delayed elimination should be focused on for patients with MTX-associated acute kidney injury. Long-term exposure to high concentration of MTX can significantly enhance toxic effects, and may even endanger safety of patients.1,10
In the clinic, leucovorin, which can supply folic acid normally needed in the human body, is often used for rescue to avoid or reduce side effects after HDMTX administration.11 However, efficacy will be affected when the dosage of leucovorin is insufficient or excessive. Therefore, therapeutic HDMTX monitoring should be used to rationally perform leucovorin rescue to ensure clinical efficacy of MTX and prevent serious adverse reactions.
At our center, concentrations of MTX apt to produce high risk for toxic effects have been monitored generally at 24, 48, or 72 h after the start of the infusion.12 Sampling frequency can be increased appropriately based on plasma MTX concentration and monitoring once a day must be guaranteed. Standard leucovorin dosing (15 mg intravenous every 6 h) is delivered at 24 h after the start of the HDMTX infusion and is continued until MTX levels are not greater than 0.1–0.25 μmol/L at 72 h.13,14 At present, MTX plasma concentrations can be determined by high-performance liquid chromatography with ultraviolet (HPLC-UV) or mass spectrometric detection (LC-MS/MS). Considering sensitivity and simplicity, a simple, rapid and reliable method for quantifying MTX levels in biological matrix is necessary for routine drug monitoring.
Here, a simple, rapid and selective UPLC-MS/MS method has been developed and validated to determine plasma MTX concentration. This method was transferred from one laboratory to another one and partial validation of this method was carried out as well. Both of the methods have been successfully applied for the routine TDM of MTX in NHL patients.
Materials and Methods
Chemicals and Reagents
Reference standards of methotrexate (Lot No. 201606) and tinidazole (internal standard, IS, Lot No. 100336-200703) were both purchased from the National Institutes for Food and Drug Control (Beijing, China). HPLC-grade methanol and acetonitrile were purchased from Fisher Scientific (Fair Lawn, NJ, USA). Formic acid and ammonium acetate were obtained from Mreda Technology Inc. (Dallas, TX, USA). Ultrapure water was provided by A.S. Watson & Company (Guangzhou, China).
Instrumentation and Conditions
The Shimadzu Nexera X2 Series UPLC system included a binary pump (LC-30AD), column oven (CTO-30A), and autosampler (SIL-30AC). The chromatographic analysis was performed on a Synergi Hydro-RP column (50 mm×2.0 mm, 2.5 μm; Phenomenex, USA) with column temperature at 40 °C. The mobile phase consisted of solvent A (0.2% formic acid and 5mM ammonium formate in water) and solvent B (acetonitrile) and was delivered at 0.5 mL/min. The gradient elution was run as follows: 0.01–1 min, 95%A; 1–2 min, 95–40%A; 2–2.5 min 40–95%A; 2.5–3.5 min 95%A. The total run time was only 3.5 min for each sample. The autosampler of 4 °C and an injection volume of 5 μL were set.
Detection was performed using an AB Sciex Triple Quad™ 4500 mass spectrometer (4500 QQQ) (Applied Biosystems Inc., USA) with an ESI source operating in a positive ion mode. Instrument control and data collection were performed on Analyst software 1.6. Multiple reaction monitoring was selected in quantification of MTX and IS with the ion transitions monitored (m/z): 455.1→308.0 for MTX and 248.1→121.0 for IS. The ion source temperature and ion spray voltage were set as 500 °C and 5000 V. The gas 1 and gas 2 were set as 50 and 50 psi. The declustering potential values were both set as 90 V for MTX and IS. The collision energy was 28 and 22 V for MTX and IS, respectively. The secondary mass spectrograms of MTX and IS are shown in Figure 1.
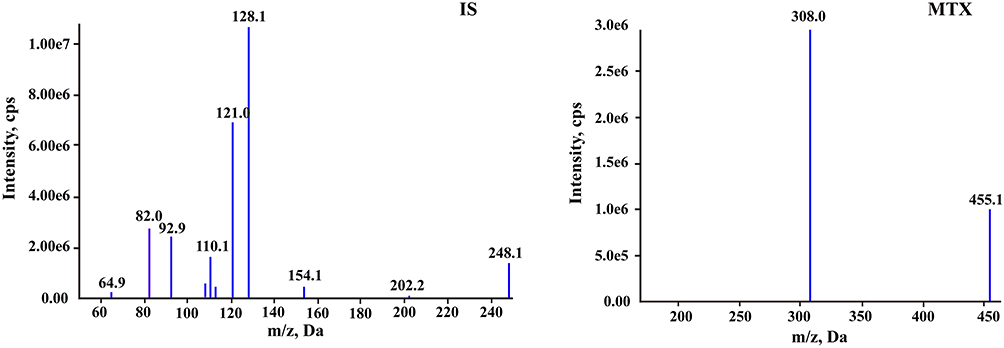 |
Figure 1 The product ion plots of methotrexate and tinidazole (IS). |
Preparation of Calibration Standards and Quality Control (QC) Samples
Two independent stock solutions for MTX to a concentration of 1 mg/mL in methanol, were used for preparation of calibration curve and QC samples, respectively. Stock solution of IS was also made in methanol at a concentration of 1.0 mg/mL. Then the above solutions were placed in the refrigerator at −80 °C before use. The work solutions of MTX were freshly prepared by further diluting the stock solutions with methanol–water (1:1, v/v). The stock solution of IS was diluted with methanol–acetonitrile (1:1, v/v) to obtain a final concentration of 100 ng/mL as precipitant solvent.
Calibration standards were prepared by spiking 10 μL of the corresponding work solutions into 90 μL blank human plasma to obtain the final concentrations of 5, 10, 20, 50, 100, 200, 500 and 1000 ng/mL for MTX. QC solutions: low quality control (LQC; 8 ng/mL), middle quality control (MQC; 80 ng/mL) and high quality control (HQC; 800 ng/mL) were prepared in the same way.
Sample Preparation
Protein precipitation method (PPT) was applied to extract the analytes in plasma. To a 100 μL aliquot of plasma sample, 500 μL precipitant solvent with 100 ng/mL IS in methanol–acetonitrile (1:1, v/v) was added. The mixture was vortex-mixed for 3 min and centrifuged at 13,000×g for 5 min at room temperature. Then 50 μL of the supernatant was transferred into 200 μL water following by vortex-mixing for 1 min and centrifugation at 13,000×g for 3 min. Finally, 5 μL of the supernatant was injected in HPLC-MS/MS system for analysis.
Method Validation
The assay was validated according to the United States Food and Drug Administration (FDA) guidelines for bioanalytical method validation and Chinese Pharmacopoeia.15
Specificity and Selectivity
The specificity was assessed separately by comparing blank plasma samples from six different lots, without and with MTX and IS spiked to investigate possible endogenous interference. The above samples were pretreated under sample preparation procedure as section “Sample preparation”. The corresponding responses should be less than 20% of the analytes at LLOQ level and 5% of IS.
Carryover
Carryover was evaluated by analyzing a blank sample after the highest calibration standard sample injected. The peak area of the analyte in the blank sample should be no more than 20% of LLOQ and 5% of IS.
Linearity, Lower Limit of Quantitation, Limit of Quantitation and Limit of Detection
Calibration curve was assessed by plotting the peak area ratios (MTX/IS) vs the corresponding nominal concentration of MTX (5, 10, 20, 50, 100, 200, 500, 1000 ng/mL) with a linearly weighted (1/x2) least squares regression. The regression coefficient (r2) calculated by the software should be greater than 0.99 to ensure linearity. Lower limit of quantitation (LLOQ) was defined as the lowest concentration of calibration curve with S/N≥10, with an accuracy (relative error, RE, %) within ±20%. The limit of quantitation (LOQ) and limit of detection (LOD) were defined as S/N ratios of 10 and 3, respectively.
Precision and Accuracy
Intra-batch precision and accuracy were evaluated by analyzing three concentration level QC samples with five replicates each. Three batches as above were analyzed in at least two days to assess the inter-batch precision and accuracy. Accuracy was calculated by the percentage of measured concentration to theoretical concentration. Precision was expressed as relative standard deviation (RSD, %). For acceptance, accuracy for QC samples at LQC, MQC and HQC levels should be within 85–115%. Precision for QC samples should not exceed 15% of RSD.
Matrix Effect and Recovery
Matrix effect and recovery of MTX were both determined at LQC, MQC and HQC concentration levels with five replicates each. The matrix effect was evaluated by comparing the peak areas of the post-extracted blank matrix spiked with MTX with standard solutions of MTX prepared in methanol–acetonitrile (1:1) without IS. Meanwhile, recovery was assessed by the peak area ratios of extracted QC samples to post-extracted blank matrix spiked with MTX. The procedures for matrix effect and recovery of IS (100 ng/mL) were the same as that of MTX.
Stability
The stability of MTX was evaluated on LQC, MQC and HQC samples with five replicates each under various storage conditions: three freeze–thaw cycles, 6 h at room temperature, 24 h at 4 °C, 1 month at −80 °C for untreated plasma samples and 24 h in an autosampler for treated plasma samples.
Dilution Study
A dilution study should be investigated when the actual MTX concentration in plasma is greater than the upper limit of quantification to prove that the accuracy and precision of this method are not affected by plasma samples diluted by blank matrix. In this study, 100-fold and 200-fold dilutions with five replicates each were performed. Precision for QC samples should not exceed 15% of RSD and accuracy should within 85–115%.
Analytical Analysis Transfer
To meet the need of clinical analysis, this validated method established on a Shimadzu LC system-4500 QQQ detector was transferred to another laboratory equipped with a Shimadzu LC system-API 5500 triple quadrupole mass spectrometer (5500 Q-trap) detector and was partially re-validated as well. Almost nothing has been changed in this experiment, such as the calibration curve, injection volume, sample preparation and separation, storage condition, except for the detector and its respective parameters. Intra- and Inter-batch precision and accuracy as well as matrix effect, carryover and recovery were assessed as above.
Clinical Application of the LC-MS/MS Method for MTX Monitoring
These two established assays were both successfully applied to MTX drug monitoring in children and adult patients with non-Hodgkin lymphoma (NHL) receiving a 3 g/m2 MTX dosage regime over a 24-h or 5-h infusion, respectively. Blood samples were collected into heparinized tubes at least 24 h, 44 h, 72 h and every another 24 h or so after the start of infusion until the concentration of MTX was below 0.1–0.25 μmol/L. The obtained samples were centrifuged at 2000×g for 10 min and plasma supernatant was analyzed. This study was conducted in accordance with the guidelines of Declaration of Helsinki. The experiment protocol was reviewed and approved by the Ethics Committee of Fourth Hospital of Hebei Medical University (Hebei, China) (No. 2020KY331) and was conducted at the Fourth Hospital of Hebei Medical University. Written informed consents were obtained from themselves for adult patients or a legal guardian for patients under 18 years of age prior to their participation in the study.
Results
Method Validation
Specificity and Selectivity
Figure 2 shows the MRM chromatograms of blank sample, plasma spiked with MTX at 5.00 ng/mL and IS at 100 ng/mL, and real sample. The retention times of MTX and IS were 1.98 min and 2.02 min, respectively. No significant interferences were observed at the retention times of MTX and IS, implying that this method was sufficiently specific.
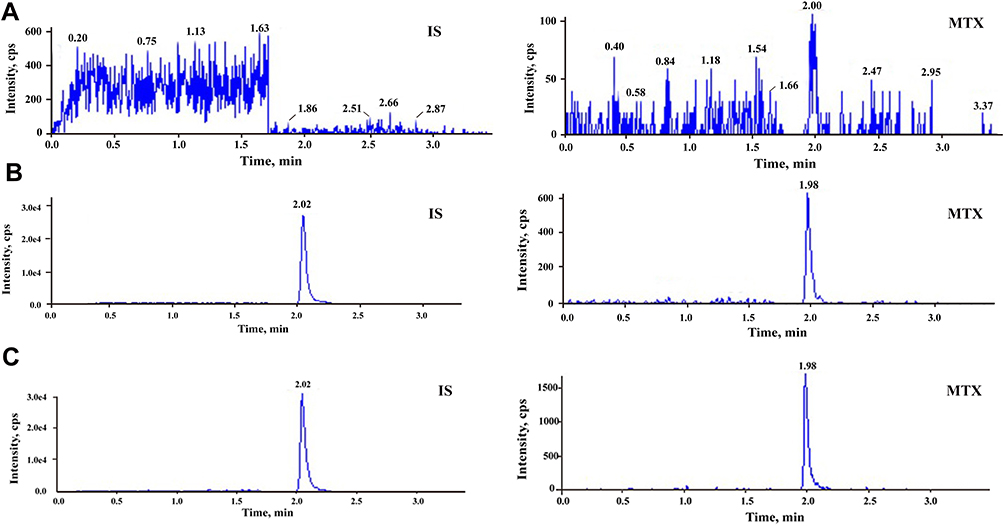 |
Figure 2 Typical MRM chromatograms of methotrexate and IS: (A) blank plasma sample; (B) blank plasma sample spiked with methotrexate at 5 ng/mL and IS at 100 ng/mL; and (C) real sample at 72 h after the start of MTX infusion. |
Carryover
The peak area of the analyte in the blank sample was 7.7% of LLOQ and 0.38% of IS to meet the requirement. Precision and accuracy of this method cannot be affected for clinical sample analysis in further.
Linearity, Lower Limit of Quantitation, Limit of Quantitation and Limit of Detection
The linear relationship of MTX was excellent in the range of 5–1000 ng/mL (0.01–2.20 μmol/L) with a correlation coefficient r2>0.99. And LLOQ was found to be 5 ng/mL with the accuracy within 80–120% and the RSD values representing precision were less than 20%. The LOQ and LOD were 5 and 1 ng/mL, respectively. This method can fully satisfy the quantitative determination of MTX in clinical plasma samples.
Precision and Accuracy
The intra- and inter-batch precision and accuracy data for MTX at three QC levels in plasma are listed in Table 1. The intra-batch precision was in the range of 4.13–7.67% and the inter-batch precision was in the range of 4.88–6.99%. All obtained results met the specified criteria of ±15%. The accuracy was in the range of 97.00–102.15%. The results indicated that this method for quantitative analysis of MTX in plasma was reliable and accurate.
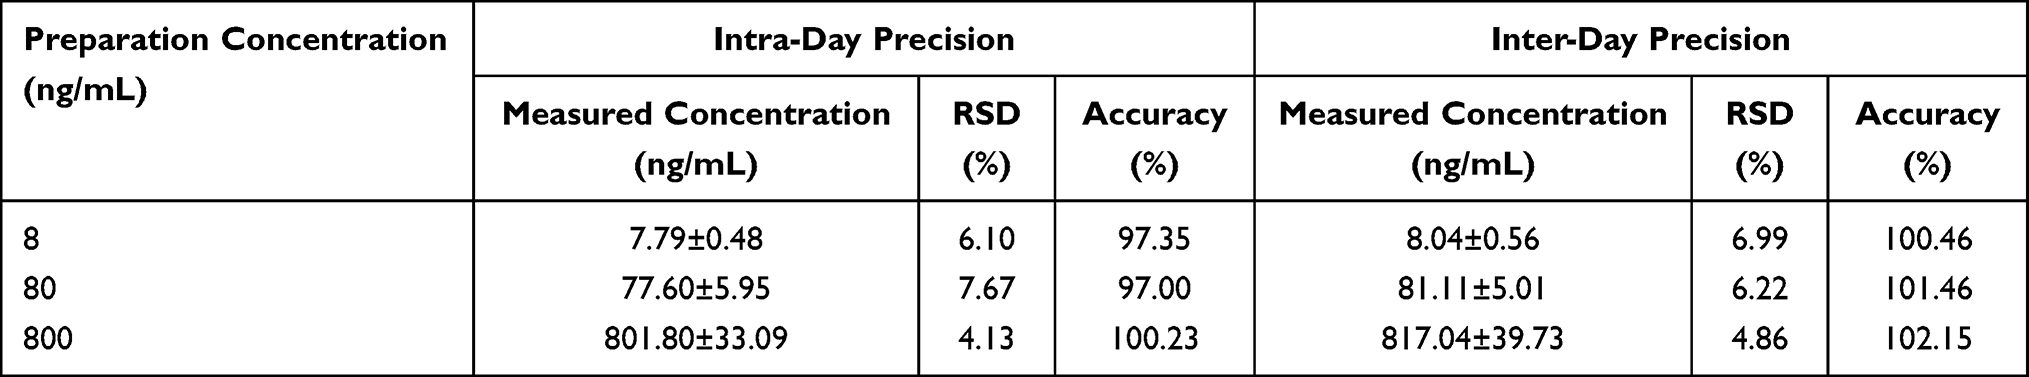 |
Table 1 Evaluation of the Inter- and Intra-Batch Precision by the Proposed HPLC-MS/MS Method for Determination of MTX in Human Plasma (Mean±SD, n=5) |
Matrix Effect and Recovery
Average extraction recoveries of MTX at three QC levels were 93.98%, 82.20% and 90.19%, respectively (Table 2). The extraction recovery of IS was measured to be 102.99%. All values were within ±20%, which showed that there is no obvious loss of the analyte and IS during the sample preparation process. Mean matrix effect values of MTX at three QC levels and IS were within 102.69–105.28% and 100.17%, which were acceptable.
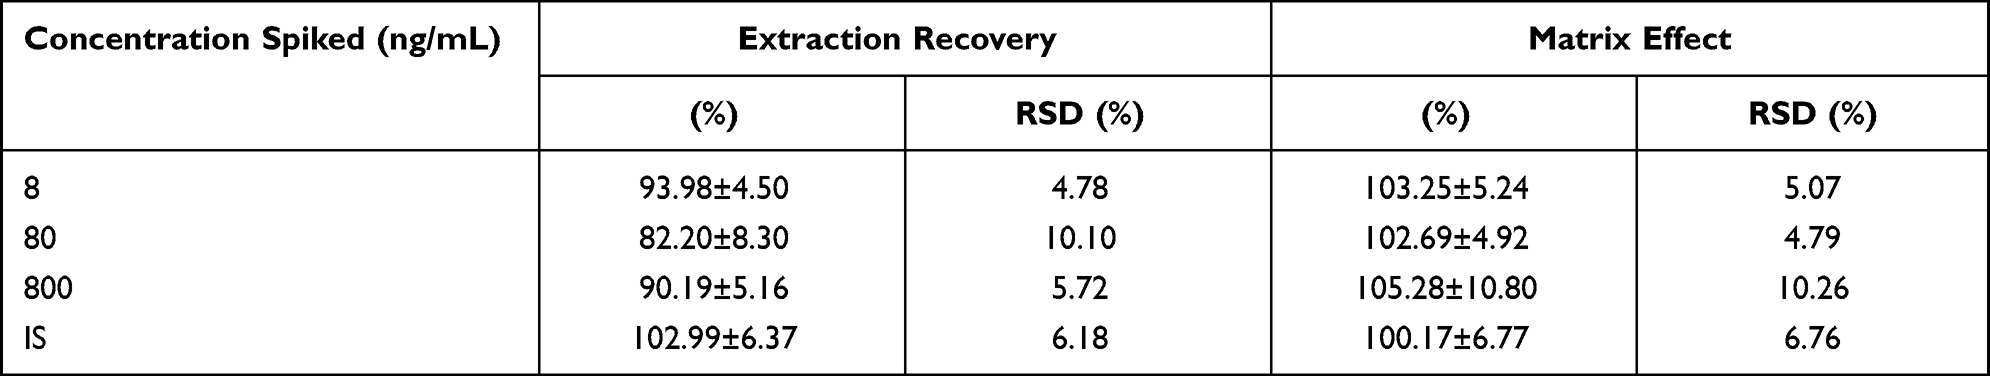 |
Table 2 Extraction Recovery and Matrix Effect for Determination of MTX in Human Plasma Using the Proposed UPLC-MS/MS Method (Mean±SD, n=5) |
Stability
The stability data of MTX under various storage conditions obtained are listed in Table 3. MTX was stable for untreated plasma samples through three freeze–thaw cycles, 6 h at room temperature, 24 h at 4 °C, 1 month at −80 °C and for treated plasma samples through 24 h in autosampler based on the accuracy and RSD% within ±15%.
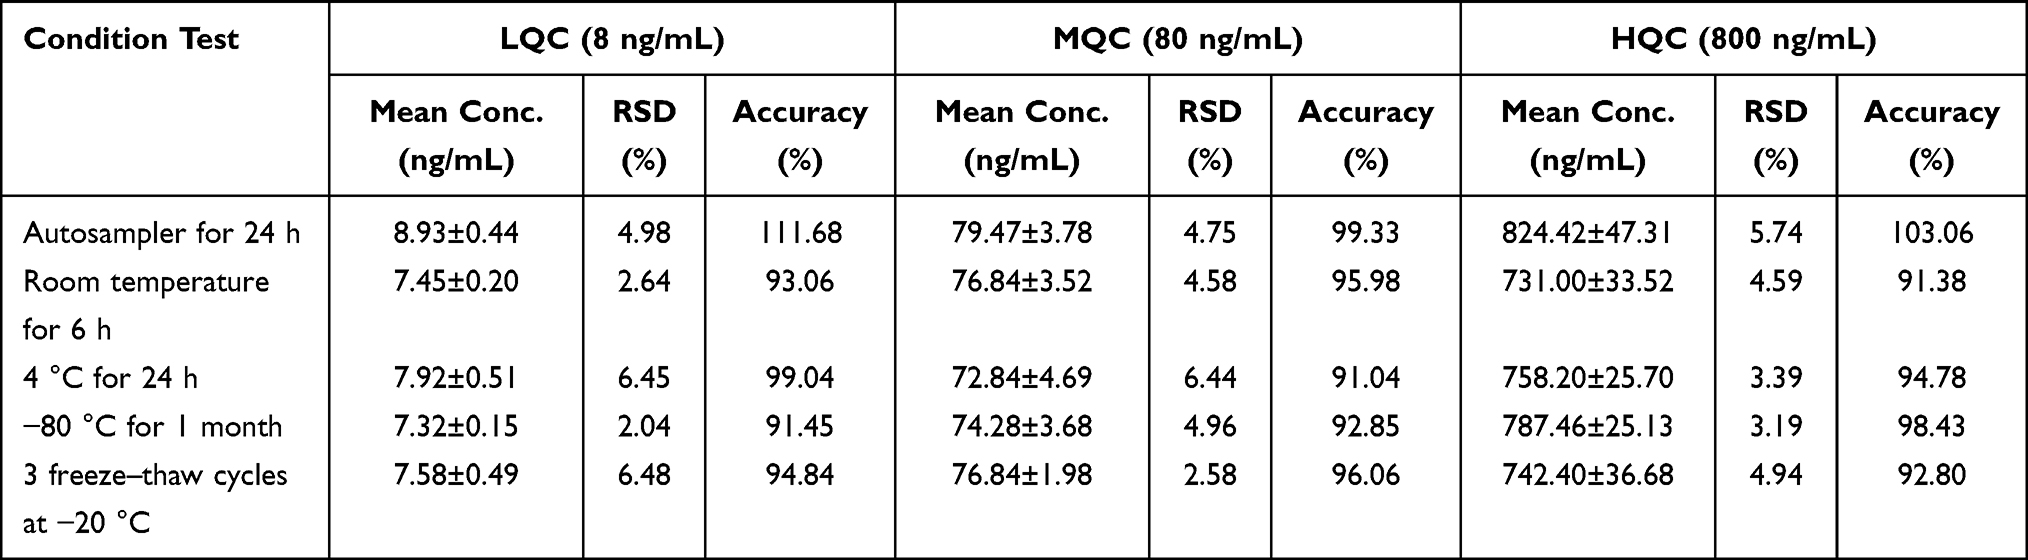 |
Table 3 Summary of Stability of MTX in Human Plasma (Mean±SD, n=5) |
Dilution Study
Average accuracy values were 91.88% and 98.94% for 100-fold and 200-fold dilutions, respectively. For precision, the RSD% values obtained were less than 5.70%. These results were within the acceptance range, which demonstrated that clinical samples can be diluted by blank matrix without the accuracy and precision of this method affected.
Analytical Analysis Transfer
Intra- and inter-batch precision and accuracy values for MTX at three QC levels in plasma are listed in Table 4. The intra-batch precision expressed as %RSD was 4.03–10.52%, and inter-batch precision was 4.41–12.45%. All obtained results met the specified criteria of ±15%. The accuracy was between 96.33 and 114.7%. In addition, the peak area ratio (%) of the carryover was approximately 6.0%, matrix effect was between 98.66 and 111.70%, and recovery was between 96.64 and 116.77%, respectively. The retention time was consistent with that of the validated method by HPLC coupled with the 4500 QQQ.
 |
Table 4 The Inter- and Intra-Batch Precision of Analytical Analysis Transfer (Mean±SD, n=5) |
MTX Therapeutic Drug Monitoring
This study included 20 children (male 13; female 7) and 6 adults (male 2; female 4). The average age was 7.75±3.80 and 55.41±15.23 (mean±SD) years, respectively. Totally, 56 samples from children and 17 samples from adults were obtained and quantitatively analyzed by these developed and validated LC-MS/MS methods. The mean concentrations at 24 h, 44 h and 72 h were 39.39, 0.29 and 0.05 µmol/L for children and 2.99, 0.20 and 0.05 µmol/L for adults, respectively. The mean plasma concentration distribution profile of MTX in adults and children patients after MTX infusion, with the number on the histogram representing sample size at the corresponding blood sampling time point, is shown in Figure 3. Severely delayed MTX elimination (MTX concentration ≥10 µmol/L at 42 h after the start of HD-MTX infusion16) was observed in two of these patients: a 14-year-old boy and a 67-year-old male. Their data of this course were excluded from the overall data and are shown separately in Figure 4.
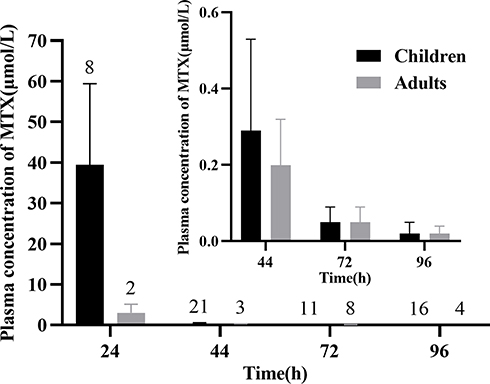 |
Figure 3 Mean plasma concentration distribution profile of MTX in adults and children patients after MTX infusion; the number on the histogram represents sample size at the corresponding blood sampling time point. Inset: 44–96 h plasma concentrations presentation. |
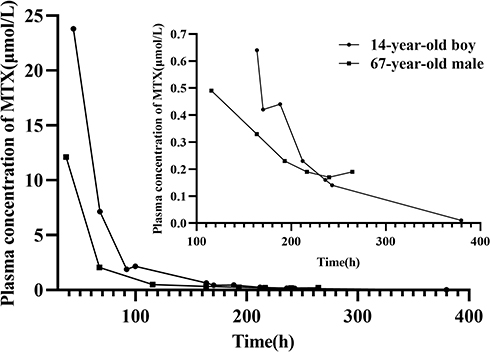 |
Figure 4 Plasma concentration–time profiles of MTX in two patients with delayed MTX elimination after MTX infusion. Inset: plasma concentrations below 1 μmol/L presentation. |
Discussion
Method Development
LC-MS/MS Condition Optimization
Chromatography separation and mass spectrometry detection are two major parts to be optimized for the LC-MS/MS analytical method. Finding better mobile phase composition is the first task of liquid chromatography optimization. To get the best separation effect of test compounds, different types of columns with different mobile phase compositions were evaluated. The results showed that the peaks of MTX and IS with the usage of a Synergy Hydro-RP column (50×2.0 mm, 2.5 μm) reached a good separation with desirable peak shape and retention time. The acceptable retention time of MTX and IS was 1.98 min and 2.02 min. Meanwhile, a total analytical run cycle time was only 3.5 min, which can timely provide clinicians with monitoring results. For organic phase investigation, acetonitrile functioned better for both peak response and peak shape than methanol. Formic acid and ammonium formate added in the water phase can adjust the pH of the mobile phase and further enhance ionization efficiency in positive ion mode. In this study, 0.1%, 0.2% formic acid and 5 mM, 10 mM, 20 mM ammonium formate were separately tested. Finally, 0.2% formic acid and 5 mM ammonium formate in water and acetonitrile were proved to be the optimal mobile phase composition for MTX and IS separation.
Carryover is one of the most important issues that must be investigated and resolved in LC-MS/MS method establishment. A higher carryover can be the basis to fail an analytical run without the accuracy of results guaranteed. Thus, chromatographic conditions, such as elution ratio, flow rate and needle washing solution were evaluated to make it meet the requirement. According to our observations, increasing the proportion of acetonitrile in the flow gradient (from 40% to 60%) and adjusting flow rates from 0.3 mL/min to 0.5 mL/min had no obvious improvement for carryover results. It can be speculated that MTX was mainly residual on injection needle. Then rinse type and needle washing solution composition were optimized. The results showed that peak area in the blank reached 4.8–7.4% of the peak area of LLOQ (5 ng/mL) and 0.03% of IS when external and internal rinse type was used with 50% aqueous methanol as needle external cleaning solution (R0) and 5% aqueous methanol as internal cleaning solution (R1). The R0 was set after R1. Compared with external only rinse type, the optimized programmed rinse type had significant reduction in carryover. In addition, this rinse type can be carried out during sample analysis, which can greatly shorten the sample running time.
Sample Processing Optimization
Different sample pretreatment methods can affect the matrix effect greatly leading to the failure of an analytical assay. In this study, protein precipitation (PPT) and solid phase extraction (SPE) were both tested for extraction and purification of the analyte and IS in plasma. Extraction recovery and matrix effect of SPE can meet the requirement. However, considering the large batches of plasma samples during routine drug monitoring, a simple and efficient PPT was finally employed with acetonitrile, methanol and mixtures of both. Results showed that extraction recovery of MTX and IS reached 97.8–101% with methanol–acetonitrile (1:1, v/v) as precipitant. To further reduce the matrix effect and improve the detection sensitivity, the supernatant was diluted by different solvents. Water, 50% aqueous methanol, 50% aqueous acetonitrile and 0.1% formic acid were all evaluated and water as the dilution solvent showed an optimal result for matrix effect and peak shape. The highest sensitivity could be got after a five times dilution to the supernatant and the sensitivity was enhanced to 5 ng/mL for the analyte.
Analytical Analysis Transfer
Obtained results demonstrated that this LC-MS/MS method for MTX analysis in plasma was proven to own excellent reproducibility and stability. Analytical method transfer can be achieved by re-verification in two laboratories. This study can provide a reliable analysis platform for determination of MTX in clinical patients.
MTX Therapeutic Drug Monitoring
Standards of target MTX level in human, which indicate that leucovorin rescue could be discontinued, are not unified in different countries or institutions. Plasma MTX concentration of patients treated with HD-MTX less than 0.2 μmol/L at 72 h has been recommended by the MTX injection label.13 Barreto et al considered that standard leucovorin rescue should be continued until the MTX level is less than 0.1 μmol/L.14 In China, 0.25 μmol/L is the threshold value for lymphoid malignancies in children and adolescents based on the guideline of the Chinese Society of Clinical Oncology. In this study, LLOQ reached 5 ng/mL (0.01 μmol/L) showing that this method can fully meet MTX monitoring in clinical practice regardless of the standards.
At the end of MTX infusion, the concentration range of children in our study was 11–64 μmol/L and was basically consistent with that reported by Lian et al.17 However, in this study the dosage of MTX was reported as 1–5 g/m2 and lacked exact concentrations for each dosage. For adult patients, the mean concentration of MTX at 24 h is 2.99 μmol/L after a 5-h infusion. At 44 h after the start of MTX infusion, the concentration of MTX both in children and adults reduced to about 0.2 μmol/L, which indicated MTX could be eliminated normally in these patients and that leucovorin could continue to be administered in a conventional dose. As expected, the levels then dropped into a clinical safety range at 72 h in general (Figure 3).
As for the two cases of delayed MTX elimination, their plasma concentrations of MTX at about 44 h were extremely high (23.80 and 12.11 μmol/L) and did not decrease into safe range until 200 h or so post the start of MTX infusion. Serum creatinine (SCr) values of them (Figure 5) were both increased to abnormal level at the second day of chemotherapy until the concentration of MTX reduced into safe range. Moreover, no concomitant medications resulting in obvious drug–drug interaction were found during MTX treatment.
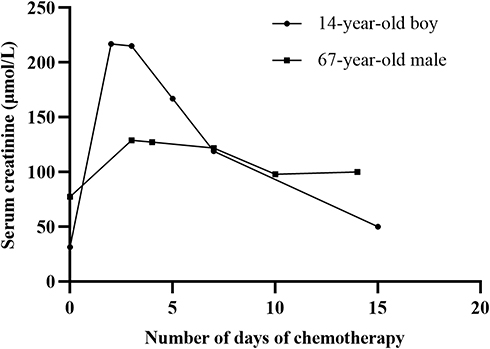 |
Figure 5 Serum creatinine–time profiles of MTX in two patients with delayed MTX elimination after MTX infusion. |
It is reported that MTX levels above 10 µmol/L at 42 h after the start of MTX infusion imply a high risk for toxicity.16 Thanks to the TDM of MTX, clinicians could adjust the rescue regime of leucovorin, hydration and alkalization in time and take corresponding interventions to reduce the toxic side effects, and ultimately restore SCr to normal.
Conclusion
A simple, rapid, and accurate LC-MS/MS method for quantitative analysis of MTX in plasma has been developed and validated in this study. Further, this analytical method transfer was achieved by re-verification in two laboratories to ensure stability and reproducibility. It fulfilled the guidelines for bioanalytical method validation and has successfully applied on clinical samples from patients diagnosed with NHL. Therapeutic monitoring of MTX in time and regularly is a requisite complementary to clinical treatment to minimize its side effects.
Acknowledgments
This work was supported by National Science and Technology Major Project for Major New Drugs Innovation and Development 2020 in China (No. 2020ZX09201006) and Hebei Medical Science Research Project (No. 20211747).
Disclosure
The authors report no conflicts of interest in this work.
References
1. Levêque D, Becker G. The role of therapeutic drug monitoring in the management of safety of anticancer agents: a focus on 3 cytotoxics. Expert Opin Drug Saf. 2019;18(11):1009–1015. doi:10.1080/14740338.2019.1662395
2. Levêque D, Becker G, Toussaint E, et al. Clinical pharmacokinetics of methotrexate in oncology. Int J Pharmacokinet. 2017;2(2):137–147. doi:10.4155/ipk-2016-0022
3. Nakano T, Kobayashi R, Matsushima S, et al. Risk factors for delayed elimination of high-dose methotrexate in childhood acute lymphoblastic leukemia and lymphoma. Int J Hematol. 2021;113(5):744–750. doi:10.1007/s12185-020-03071-w
4. Mulder MB, Huisman R, Engels FK, van der Sluis IM, Koch BCP. Therapeutic drug monitoring of methotrexate in plasma using ultra high-performance liquid chromatography-electrospray ionization-tandem mass spectrometry: necessary after administration of glucarpidase in methotrexate intoxications. Ther Drug Monit. 2018;40(4):383–385. doi:10.1097/FTD.0000000000000515
5. De Abreu CC, Rosa PC, Alves Bda C, et al. Development and validation of HPLC method to determination of methotrexate in children oncologic patients. Eur Rev Med Pharmacol Sci. 2015;19(8):1373–1380.
6. Ren X, Wang Z, Yun Y, et al. Simultaneous quantification of methotrexate and its metabolite 7-hydroxy-methotrexate in human plasma for therapeutic drug monitoring. Int J Anal Chem. 2019;2019:1536532. doi:10.1155/2019/1536532
7. Zhao SS, Bichelberger MA, Colin DY, Robitaille R, Pelletier JN, Masson JF. Monitoring methotrexate in clinical samples from cancer patients during chemotherapy with a LSPR-based competitive sensor. Analyst. 2012;137(20):4742–4750. doi:10.1039/c2an35839e
8. Reshetnik A, Scheurig-Muenkler C, van der Giet M, Tölle M. High-flux hemodialysis after administering high-dose methotrexate in a patient with posttransplant lymphoproliferative disease and impaired renal function. Clin Case Rep. 2015;3(11):932–936. doi:10.1002/ccr3.302
9. Ferreri AJ, Reni M, Foppoli M, et al. High-dose cytarabine plus high-dose methotrexate versus high-dose methotrexate alone in patients with primary CNS lymphoma: a randomised Phase 2 trial. Lancet. 2009;374(9700):1512–1520. doi:10.1016/S0140-6736(09)61416-1
10. Gallais F, Oberic L, Faguer S, et al. Body surface area dosing of high-dose methotrexate should be reconsidered, particularly in overweight, adult patients. Ther Drug Monit. 2021;43(3):408–415.
11. Cerminara Z, Duffy A, Nishioka J, Trovato J, Gilmore S. A single center retrospective analysis of a protocol for high-dose methotrexate and leucovorin rescue administration. J Oncol Pharm Pract. 2019;25(1):76–84. doi:10.1177/1078155217729744
12. Howard SC, McCormick J, Pui CH, Buddington RK, Harvey RD. Preventing and managing toxicities of high-dose methotrexate. Oncologist. 2016;21(12):1471–1482. doi:10.1634/theoncologist.2015-0164
13. FDA. Methotrexate Injection, USP drugs[EB/OL]; November 04, 2011 [June 10, 2015]. Available from: http://www.accessdata.fda.gov/drugsatfda_docs/label/2011/011719s117lbl.pdf.
14. Barreto JN, Peterson KT, Barreto EF, et al. Early, empiric high-dose leucovorin rescue in lymphoma patients treated with sequential doses of high-dose methotrexate. Support Care Cancer. 2021;29(9):5293–5301. doi:10.1007/s00520-021-06106-y
15. FDA [Internet]. Guidance for industry: bioanalytical method validation; [cited May 24, 2018]. Available from: https://www.fda.gov/downloads/drugs/guidances/ucm070107.Pdf.
16. Schmidt D, Kristensen K, Schroeder H, et al. Plasma creatinine as predictor of delayed elimination of high-dose methotrexate in childhood acute lymphoblastic leukemia: A Danish population-based study. Pediatr Blood Cancer. 2019;66:e27637. doi:10.1002/pbc.27637
17. Lian LJ, Lin B, Cui X, et al. Development and validation of UHPLC-MS/MSa. Drug Des Devel Ther. 2020;14:4835–4843. doi:10.2147/DDDT.S271568
 © 2021 The Author(s). This work is published and licensed by Dove Medical Press Limited. The
full terms of this license are available at https://www.dovepress.com/terms
and incorporate the Creative Commons Attribution
- Non Commercial (unported, 3.0) License.
By accessing the work you hereby accept the Terms. Non-commercial uses of the work are permitted
without any further permission from Dove Medical Press Limited, provided the work is properly
attributed. For permission for commercial use of this work, please see paragraphs 4.2 and 5 of our Terms.
© 2021 The Author(s). This work is published and licensed by Dove Medical Press Limited. The
full terms of this license are available at https://www.dovepress.com/terms
and incorporate the Creative Commons Attribution
- Non Commercial (unported, 3.0) License.
By accessing the work you hereby accept the Terms. Non-commercial uses of the work are permitted
without any further permission from Dove Medical Press Limited, provided the work is properly
attributed. For permission for commercial use of this work, please see paragraphs 4.2 and 5 of our Terms.