Back to Journals » Journal of Inflammation Research » Volume 15
A Survival Prediction for Acute Heart Failure Patients via Web-Based Dynamic Nomogram with Internal Validation: A Prospective Cohort Study
Authors Yin T ![]() , Shi S
, Shi S ![]() , Zhu X
, Zhu X ![]() , Cheang I
, Cheang I ![]() , Lu X, Gao R, Zhang H, Yao W, Zhou Y, Li X
, Lu X, Gao R, Zhang H, Yao W, Zhou Y, Li X ![]()
Received 6 November 2021
Accepted for publication 9 March 2022
Published 20 March 2022 Volume 2022:15 Pages 1953—1967
DOI https://doi.org/10.2147/JIR.S348139
Checked for plagiarism Yes
Review by Single anonymous peer review
Peer reviewer comments 3
Editor who approved publication: Professor Ning Quan
Ting Yin,1 Shi Shi,1 Xu Zhu,1 Iokfai Cheang,1 Xinyi Lu,1 Rongrong Gao,1 Haifeng Zhang,1,2 Wenming Yao,1 Yanli Zhou,1 Xinli Li1
1Department of Cardiology, The First Affiliated Hospital of Nanjing Medical University, Jiangsu Province Hospital, Nanjing, 210029, People’s Republic of China; 2Department of Cardiology, The Affiliated Suzhou Hospital of Nanjing Medical University, Suzhou Municipal Hospital, Gusu School, Nanjing Medical University, Suzhou, 215002, People’s Republic of China
Correspondence: Xinli Li; Yanli Zhou, Tel +86 136 1157 3111 ; +86 137 7787 9077, Email [email protected]; [email protected]
Purpose: The current study aimed to develop a convenient and accurate prognostic dynamic nomogram model for the risk of all-cause death in acute heart failure (AHF) patients that incorporates clinical characteristics including N-terminal pro-brain natriuretic peptide (NT-pro BNP) and growth stimulation expresses gene 2 protein (ST2).
Patients and Methods: We prospectively studied 537 consecutive AHF patients and derived a clinical prediction model. The least absolute shrinkage and selection operator regression model combined with clinical characteristics were used for dimensional reduction and feature selection. Multivariate Cox proportional hazard analysis and “Dynnom” package were used to build the dynamic nomogram for prediction of 1-,2-,and 5-year overall survival for AHF. With bootstrap validation, the time-dependent concordance index (C-index) and calibration curves were used to assess predictive discrimination and accuracy. The contributions of NT-pro BNP and ST2 to the nomogram were evaluated using integrated discrimination improvement (IDI) and net reclassification improvement (NRI), while decision curve analysis (DCA) was used to assess clinical value.
Results: Patients were randomly divided into derivation (74.9%, n=402) and validation (25.1%, n=135) cohorts. Optimal independent prognostic factors for 1-,2-, and 5-year all-cause mortality were BS-ACMR (B: NT-pro BNP; S: ST2; A: age; C: complete right bundle branch block; M: mean arterial pressure; and R: red cell distribution width > 14.5%); these were incorporated into the dynamic nomogram (https://bs-acmr-nom.shinyapps.io/dynnomapp/) with bootstrap validation. The C-indexes in the derivation (0.793) and validation (0.782) cohorts were consistent with comparable performance parameters. The calibration curve showed good agreement between the nomogram-predicted and actual survival. Adding NT-pro BNP and ST2 provided a significant net benefit and improved performance over other less adequate schemes in terms of DCA of survival probability compared to those neglecting either of these two factors.
Conclusion: The study constructed a dynamic BS-ACMR nomogram, which is a convenient, practical and effective clinical decision-making tool for providing accurate prognosis in AHF patients.
Keywords: acute heart failure, all-cause mortality, dynamic nomogram, prediction model, internal validation
Introduction
Acute heart failure (AHF) results from any structural and/or functional cardiovascular disorder that causes hypoperfusion and the failure of systemic circulation. AHF is a worldwide primary increasingly frequent cause of disability and death.1 Despite recent advances in treatment, the social and economic burden of AHF is expected to remain tremendously increased through 2030.2,3 The increasing recognition of clinical predictive models can contribute to exploration of patient-specific characteristics related to different outcome risks for a given disease.4 For better understand of individualized management, clinical practice guidelines and experts have committed to applying clinical prognostic models of AHF to support decision making.5
Regarding heart failure, there are established risk models of Seattle Heart Failure Model (SHFM) and the Meta-Analysis Global Group in Chronic Heart Failure (MAGGIC) (database of 39,372 HF patients) having a relatively large cohort.6–8 However, these databases were mainly focused on Occidental and/or Caucasian generalized HF subjects, as well as with limited data on circulating biomarkers and medical history. Applying predictive models to heterogeneous subjects (such as Asian populations due to the different demographic characteristics) might reduce their accuracy.9–11
Furthermore, there are studies using a variety of inclusion criteria and/or outcome measure12,13 to estimate the risk of death in Chinese HF patients, including specific population characteristics14 and etiologies,15,16 which result in heterogeneity of the models and limit the translation of the results to clinical applications. Furthermore, AHF as a heterogeneous syndrome with complicated pathogenesis and pathophysiological features17 distinct from chronic heart failure.18,19 Clinician should characterize acute and chronic settings of HF which can contribute to more precise management of the AHF population. Hence, a practical prognostic web-based nomogram of Asian demographics AHF would enable a more accurate risk assessment and optimal management for AHF patients.
Biomarkers are crucial for differentiating diagnosis and assessing prognosis in AHF. More recently, ACC/AHA guidelines recommend updated diagnostic criteria in the assessment of AHF, which includes the level of N-terminal pro-brain natriuretic peptide (NT-pro BNP) and growth stimulation expressed gene 2 protein (ST2).20 Studies have shown that NT-pro BNP and ST2 levels in AHF patients at admission and follow-up provide better predictive value for all-cause mortality and rehospitalization.21 However, the etiology and population characteristics might affect the truncation values leading to inconsistency in clinical practice while using single marker. To further construct a nomogram of long-term prognostic model for AHF patients, our study incorporates these biomarkers into the prognostic nomogram with follow-up in AHF patients.22 Accordingly, to address the uncertainties mentioned above, our prospective study aimed to investigate and validate clinical variables that coexist with NT-pro BNP and ST2 to explore the all‐cause mortality among Chinese patients with new-onset AHF and acute exacerbation of chronic HF.
Materials and Methods
Study Population
This single-center prospective cohort study was approved by the Ethics Committee of the First Affiliated Hospital of Nanjing Medical University and registered at http://www.chictr.org/cn (Registration Number: ChiCTR-ONC- 12001944). The study methods have been previously published.23–25 Diagnosis of AHF was based on ESC acute heart failure guidelines at the time of presentation, and all patients received standard clinical evaluation and treatment.26 Inclusion criteria: (1) age ≥ 18 years old, gender was not limited; (2) new-onset AHF or worsening preexisting heart failure, usually with symptoms of pulmonary congestion, systemic congestion or cardiac output reduction, NT-pro BNP level > 300 pg/mL, and echocardiography indicating abnormalities in cardiac structure or function; (3) subjects participated in the study voluntarily and signed the informed consent. Exclusion criteria: (1) Patients with malignant tumors, cognitive dysfunction or dementia, severe mental illness, or uncontrolled systemic disease; (2) Patients who were unwilling to sign the informed consent forms or were unable to complete all follow-up.
For risk events with an incidence greater than twenty-five percent of AHF patients, assuming a true hazard ratio of 1.5 with the power of test of 0.8, using a two-sided alpha of 5% calculated sample size was 382 subjects used PASS software. In addition, 10% percentage rate of lost to follow-up or truncated frequency also taken into account and the minimum sample size was 420. The assumed HR of 1.5 is considered as clinically relevant and has taken into account the HF outcomes in the ADHERE trial.27,28 All participants have given written informed consent and the study was conducted in accordance with the Declaration of Helsinki. From March 2012 to June 2019, a total of 612 patients were assessed for eligibility. Among, 537 patients with the longest follow-up time of 80 months were enrolled for the further analysis (Figure S1).
Data Collection
Clinical characteristic, laboratory results, electrocardiography (ECG), transthoracic echocardiogram (TTE), Holter, medication (including the current medication and medication usage after admission), medical history, device therapy (including CRRT and ICD/CRT surgery) were collected.
Mean arterial pressure (MAP) was calculated by dividing the subtracting the (average) diastolic from the (average) systolic blood pressure value by 3 and adding this value to the diastolic blood pressure. Body mass index (BMI) calculated weight (kg) divided by height squared (meter). All venous blood for complete blood count, biochemistry, and biomarkers (NT-pro BNP and ST2) at baseline were analyzed in the central laboratory of the First Affiliated Hospital of Nanjing Medical University. TTE was obtained with Vivid E9 ultrasound system (GE Medical System, USA). The Simpson method was used to evaluate left ventricular function. Estimated glomerular filtration rate (GFR) was calculated by the chronic kidney disease epidemiology collaboration (CKD-EPI) equation.29
Primary Endpoint and Follow-Up
The primary endpoint was defined as the all-cause mortality from the time of enrollment. According to the study protocol, outpatient and/or telephone follow-up every 3 months were performed during follow-up. All enrolled AHF patients received standard treatment and management. The endpoint events were confirmed by the patient’s family members, hospital medical records and/or medical personnel. A detailed description of the study protocol, participants and data collection has been previously published.23–25
Statistical Analysis
Continuous variables were expressed as mean ± standard deviation, and categorical variables were expressed as n (%). Baseline characteristics were compared using the unpaired t-test (normal distribution) or Mann–Whitney U-test (non-normal distribution) for continuous variables, and the Pearson’s chi-squared test for categorical variables. For missing values, multiple imputation based on five replications and a chained equation approach in the R Mice procedure were used.30
All subjects (n=537) were assigned random numbers and randomly divided into derivation (74.9%, n=402) and validation (25.1%, n=135) cohorts on the basis of 3:1 ratio for development of a nomogram and internal validation. The Kaplan–Meier (KM) survival curve was used to describe death in patients with heart failure in the two cohorts. Given the number of events available, baseline variables that were considered clinically relevant or that showed a univariable relationship were carefully chosen, as were inclusion variables, to ensure parsimony of the final model.31
Depending on the randomization training set, the most prominent advantage of the LASSO regression was utilized for re-selection of the optimal prognostic variables in high dimensional data and for ameliorating the accuracy and interpretability of regression models through regularization.32–34 Variable selection criteria based on clinical knowledge, and other variables reported in previous studies with clinical significance were candidates for LASSO regression analysis to identify the independent risk factors for all-cause mortality. All 57 variable filters used in the LASSO regression analysis (Table S1). Vertical lines were drawn at the optimal values given by the minimum criteria and 1-SE criteria to identify the optimal prognostic variables.32 Multivariate models with substantiated 10-fold cross-validation and bootstrapping (500 re-sampling) were constructed to prevent over-fitting and increase model robustness.31 For all categorical variables, the proportionality of risk required by the Cox model was assessed using Schoenfeld residuals. Quantitative variables were fitted as a single continuous measurement unless there was nonlinearity. Linearity of risk was evaluated by restricted cubic spline (RCS) fitting for all continuous variables, which tested whether the nonlinear component was statistically significant (R rms package).35 If nonlinearity was detected, we used segmented regression (R Segmented package) to fit a piecewise-linear relationship between continuous variables and AHF risk and to calculate the threshold inflection point using a recursive algorithm.36 For variables involved in Cox regression, appropriate transformations were applied, modeling them on a continuous scale.36 A nomogram was constructed based on statistically significant factors identified by multivariate survival analyses performed using Cox proportional hazard regression to predict 1-, 2-, and 5-year all-cause mortality; the R Regplot package was used to display the results. Discrimination and calibration analysis was used to verify the effectiveness of both the derivation and validation cohort models by time-dependent C-index analysis (R pec package). The C-index ranged from 0.5 to 1, with larger values indicating increased prediction accuracy.37 Calibration of the nomogram was assessed by comparing the nomogram-predicted 1-, 2-, and 5-year all-cause mortality rates to the observed probability. In an ideal calibrated curve, the predictions should fall on a diagonal 45° line in the calibration plot.
Moreover, net reclassification improvement (NRI) and integrated discrimination improvement (IDI) were calculated in R survIDINRI to determine the overall improvement in the predictive accuracy of the nomogram provided by the addition of NT-pro BNP and ST2 at 60 months. NRI refers to the difference in proportions of patients with events correctly assigned a higher probability and patients without events correctly assigned a low probability by an updated model compared with the initial model.38 IDI represents improvement in the average sensitivity (ie, true positive rate) without reducing the average specificity (ie, true negative rate) of a new model compared with that of a baseline model.39 The clinical usefulness of the model was assessed by decision curve analysis (DCA).40 Finally, “Dynnom” package (cran.r-project. Org/web/packages/rms) to generate dynamic nomogram model with an interactive interface for clinical application.41 All tests were two-sided, and a P value < 0.05 was considered statistically significant. Statistical analyses were performed in R Studio (Version 3.3.4).
Results
Baseline Characteristics in the Derivation and Validation Cohorts
A total of 537 hospitalized patients with AHF were included in the present analysis. The baseline characteristics are shown in Table 1. The mean follow-up time was 34.21±21.28 months (median 34 months), the longest follow-up period was 84 months. There were 174 (32.4%) patient deaths during follow-up. Males constituted 66.41% of the cohort, and left ventricle eject fraction (LVEF) was 42.10±14.52% for all subjects.
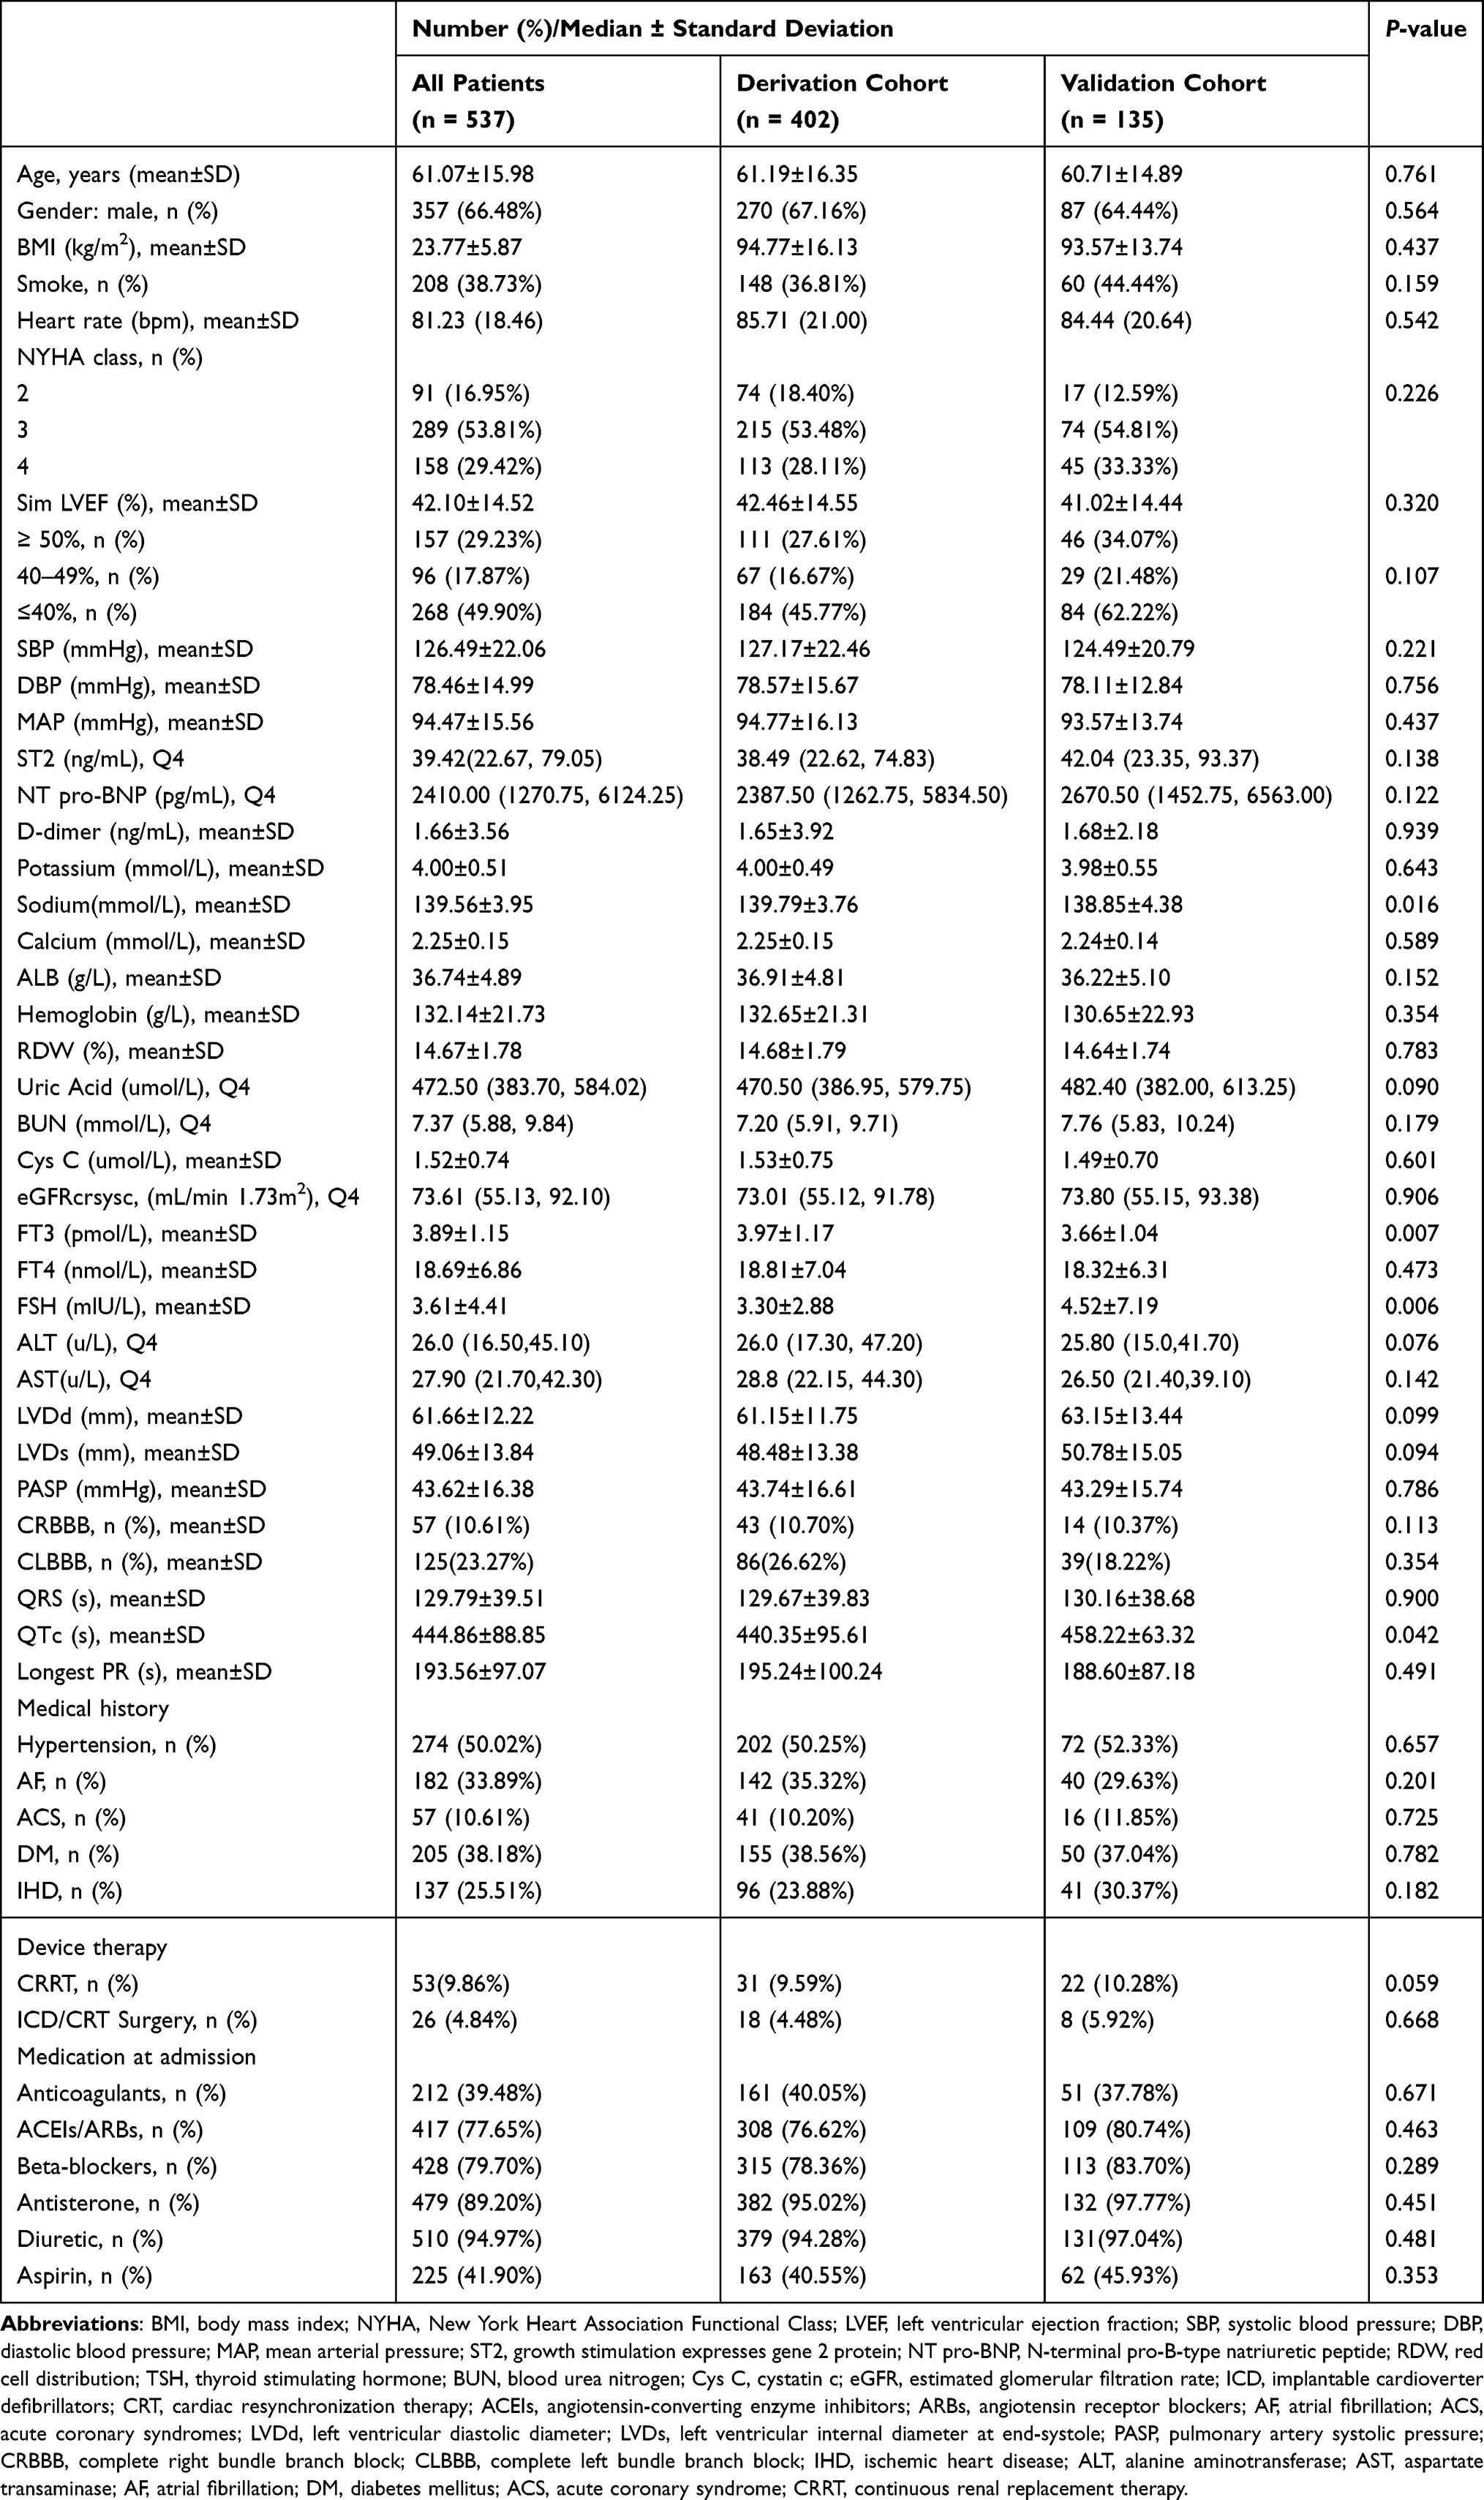 |
Table 1 Demographic Characteristics of the Enrolled Patients with AHF |
The derivation and validation cohorts constituted 74.9% (n=402) and 24.1% (n=135) of the patient population, respectively. The mean follow-up time for the derivation and validation cohorts were 34.56±20.85 and 33.40±22.28 months, respectively. There were no significant differences in the majority of baseline characteristics between two groups (P>0.05), suggesting an equilibrium distribution for derivation and validation (Table 1).
After randomization grouping, KM survival curves showed no significant difference in all-cause mortality between the derivation and validation cohorts (P= 0.14) (Figure 1), indicating the even distribution between two cohorts and suitable for internal verification.
 |
Figure 1 Kaplan–Meier survival curve of enrolled AHF patients, derivation cohort and validation cohort. |
LASSO Method to Reselect Optimal Prognostic Variables
When lambda equaled 0.038 and log (λ) = −2.417, the residual sum of squares was shown to be 1−SE for all-cause mortality. Six optimal prognostic variables were identified, including NT-pro BNP, ST2, age, complete right bundle branch block (CRBBB), mean arterial pressure (MAP), and red blood cell distribution width (RDW) (Figure 2).
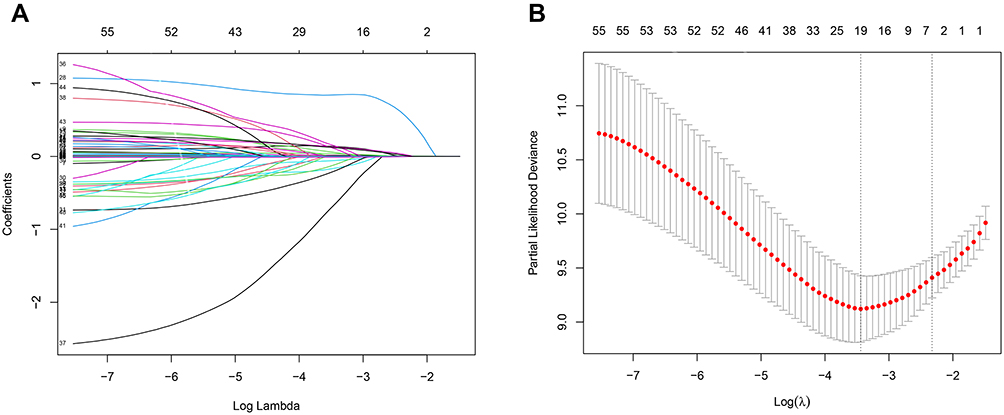 |
Figure 2 Selection of variables for all-cause mortality was performed using the LASSO regression plot with COX regression model. (A) LASSO model coefficient trendlines of the 57 variables (shown in Table S1) for all-cause mortality. (B) Tuning parameter (Lambda, λ) selection cross-validation error curve. Vertical lines were drawn at the optimal values given by the minimum criteria and 1-SE criteria. The right line was identified by 1-SE criteria (λ = 0.038). The parameter λ = 0.038 was selected under the 1-SE criteria. The vertical line was drawn at the value selected by 10-fold cross-validation, including optimized six non-zero coefficients proceed with further COX regression analysis. Abbreviations: LASSO, least absolute shrinkage and selection operator; SE, standard error. |
RCS Analysis of Nonlinear Associations Determined the Cutoff Values of Optimal Variables
The shape of the relationship between optimal prognostic variables and all-cause mortality of AHF was explored using the restricted cubic spline regression model and ANOVA to test for nonlinearity. Age (P nonlinearity = 0.823), MAP (P nonlinearity = 0.421), and RDW (P nonlinearity = 0.132) were linearly associated with all-cause mortality for AHF, whereas NT-pro BNP (P nonlinearity = 0.010) and ST2 (P nonlinearity < 0.001) exhibited a nonlinear association (Figure S2). Regarding the strong U-shaped relationship between predicted NT-pro BNP and ST2 and all-cause mortality, the plot showed a substantial reduction in risk within the lower range of the predicted NT-pro BNP and ST2, which indicated a clearly increased risk around 5582 pg/mL and 86 ng/mL, respectively.
Multivariable Cox Hazard Regression for All-Cause Mortality
Multi-variable Cox analysis was carried out to further verify the hazard ratio and coefficient for each variable reselected by the LASSO method. As a result, NT-pro BNP (>5582 pg/mL vs <5582 pg/mL; HR: 1.616; 95% CI: 1.092–2.393; P=0.016), ST2 (>86 ng/mL vs <86 ng/mL; HR: 4.040; 95% CI: 2.734–5.968; P<0.001), age (per 10 year increase; HR: 1.338; 95% CI: 1.179–1.520; P<0.001), CRBBB (HR: 3.227; 95% C: 2.077–5.014; P<0.001), MAP (per 10 mm Hg increase; HR: 0.765; 95% CI: 0.667–0.877; P<0.001), and RDW (per 5 unit increase; HR: 2.366; 95% CI: 1.522–3.677; P<0.001) remained independent risk factors for 1-, 2-, and 5-year all-cause mortality (Figure 3).
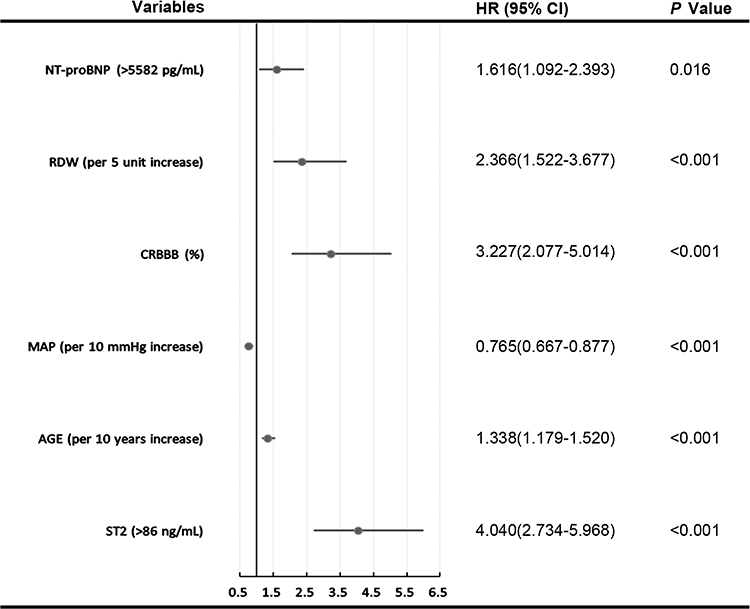 |
Figure 3 Forest plot with hazard ratio (HR) for the optimal prognostic variables of the final multivariable model in the derivation cohort. HRs above one indicates that a variable is positively associated with the event probability and thus negatively with survival time. A horizontal line parallel to the X-axis has a logarithmic scale represents a more precise confidence interval (95% CI). |
Construction of the Nomogram for 1-, 2-, and 5-Year All-Cause Mortality
Based on multivariate analysis, six variables were included in a nomogram for predicting 1-, 2-, and 5-year overall survival (Figure 4). Positions in the nomogram are in order of importance as defined by standard deviation, top to bottom. Each clinicopathological factor corresponds to a specific point by drawing a line straight up to the Points axis. The sum of the points located on the total points axis represents the probability of 1-, 2-, and 5-year survival by drawing a line straight down to the survival axis. The calculated ratio is used to determine the relative predictive value of these variables. The projection to the total points scale at the bottom of the nomogram indicates the estimated probability of all-cause mortality and estimate the risk of death.
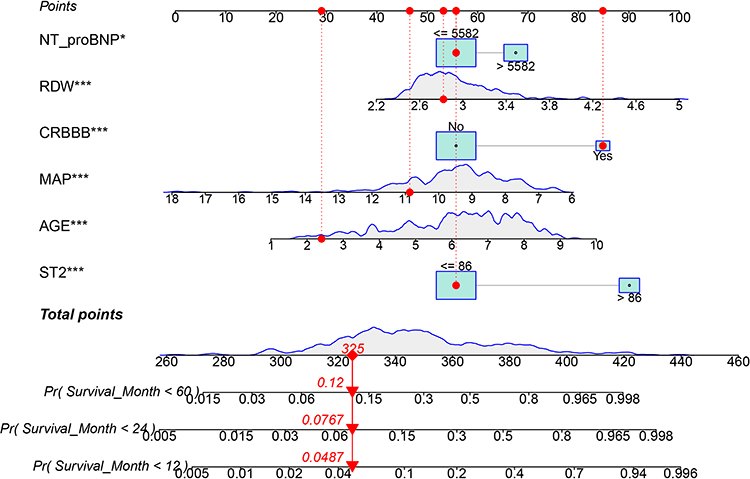 |
Figure 4 The BS-ACMR heart prognostic nomogram obtained from the optimal Cox model to predict 1-, 2- and 5- year overall survival for acute heart failure in derivation cohort. Each clinicopathological factor corresponds to a specific point by drawing a vertical line from that variable to the points axis. After sum of the scores for each variable located on the Total Points axis. Finally, the sum represents the probability of 1-, 2- and 5- year survival by drawing straight down to the survival axis. For example, a 24-year-old AHF patient with NT-pro BNP ≤ 5582 pg/mL, ST2 ≤ 86 ng/mL, MAP ≤ 109 mm Hg, RDW ≤ 2.82% and CRBBB, the total score will be given by 29+56+56+46+53+85 = 325, corresponding to 1-, 2-, and 5-year risks of dying of 0.049, 0.077, and 0.12, respectively. The AHF patient will accordingly have approximately 96.1%, 92.3%, and 88% survival probabilities at 1, 2, and 5 years, respectively. *P< 0.05; ***P<0.001. |
Internal Validation of the Nomogram and Risk Reclassification
Time-dependent discrimination analysis was used to evaluate the predictive performance of our model for AHF patient outcomes. In the derivation cohort, the time-independent C-indices of the nomogram for all-cause mortality were 0.838 (95% CI: 0.804–0.871) and 0.793 (95% CI: 0.752–0.833) in all models and the nomogram model, respectively (Figure 5A). Meanwhile, the time-independent C-indices in the validation cohort were 0.716 (95% CI: 0.651–0.781) and 0.782 (95% CI: 0.720–0.844) in all models and the nomogram model, respectively (Figure 5B). These results indicate that the predictive power of the nomogram model was relatively stable over time, meaning that it could be used to predict death over all time periods.
 |
Figure 5 Discrimination analyses between derivation cohort (A) and the validation cohort (B). |
The results of the NRI and IDI calculations are given in both the derivation and validation models, use of multiple variables to construct a comprehensive nomogram significantly improved risk reclassification for prediction of 5-year overall mortality by adding NT-pro BNP and ST2 to the model (Table 2). The calibration plots showed consistency between the observed AHF mortality risks and those predicted by the nomogram at 1-, 2-, and 5- years (Figure 6).
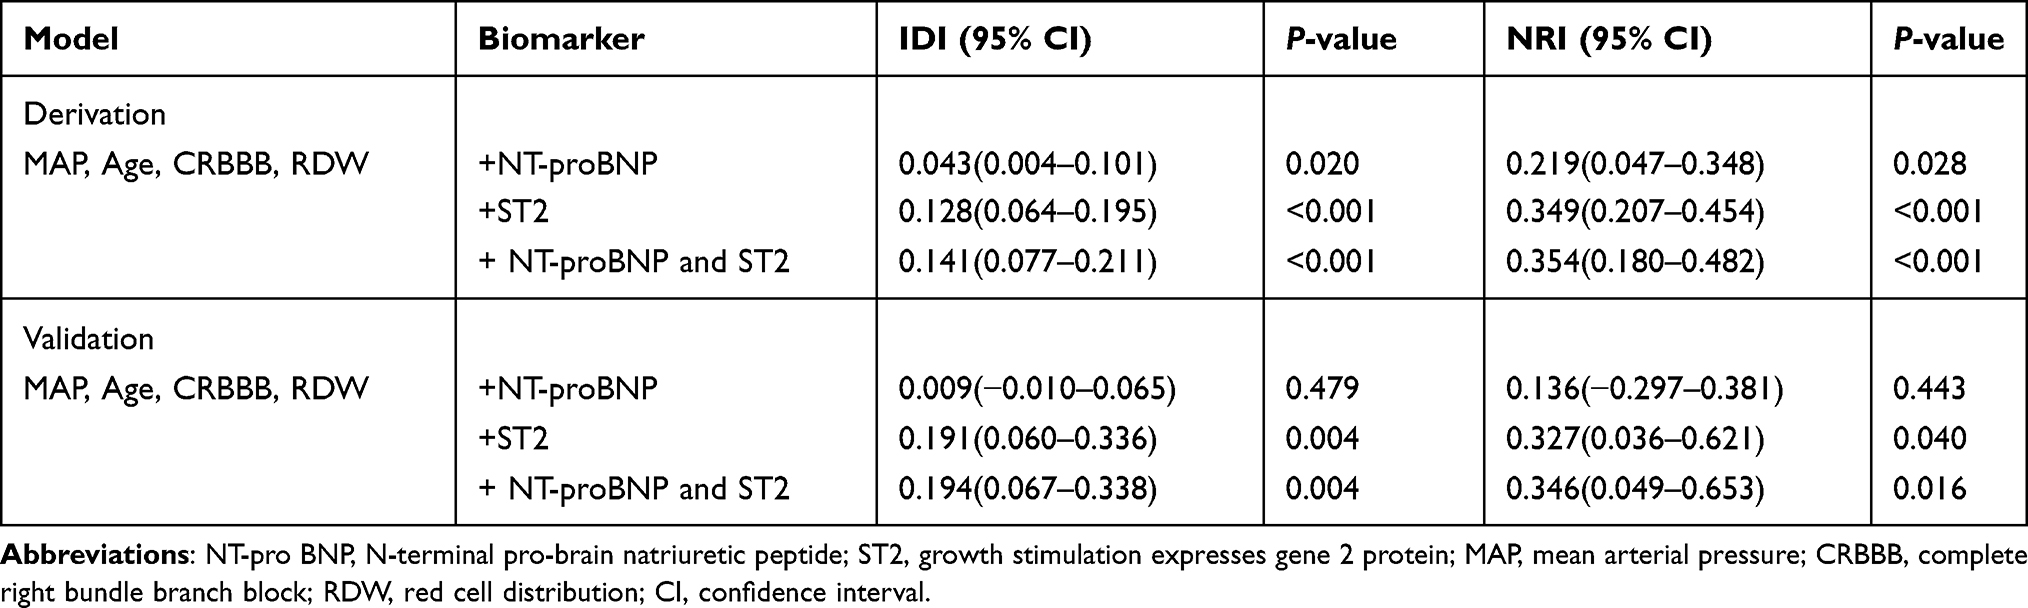 |
Table 2 Integrated Discrimination Improvement and Net Reclassification Improvement for All-Cause Mortality at 60 Months by Adding NT-Pro BNP and ST2 to Model |
 |
Figure 6 Calibration plot of nomogram predicted probability of 1- (A), 2- (B) and 5- (C) year all-cause mortality. Shown that the prediction model was no statistical departure with observed values. |
Decision Curve Analysis of the Nomogram
Decision curve analysis (DCA) was performed to assess the net benefit of the clinical prediction model. Based on the nomogram constructed in this study, the decision curve showed that the threshold probability of AHF patients was 23–67%, 25–85%, and 35–80% at 1, 2, and 5 years, respectively. These results demonstrate that use of this nomogram to predict all-cause mortality could increase accuracy compared with either neglecting these factors or using an inadequate scheme (Figure 7).
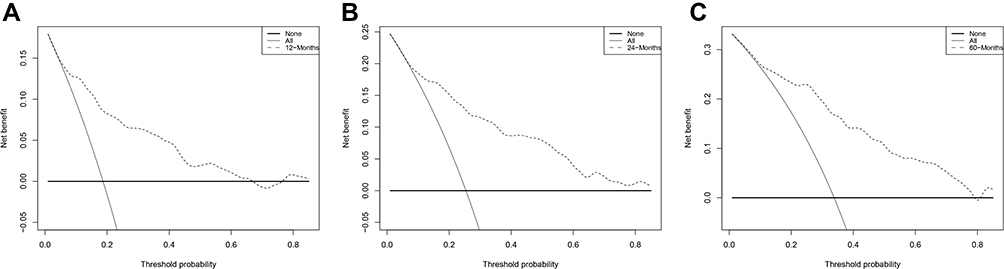 |
Figure 7 Decision curve of the nomogram. The black dotted line represents the nomogram. The grey solid line represents net benefit without intervention. The decision curve indicates that when the threshold probability of AHF patients of this nomogram strategies would add significant net benefit of the all-cause mortality of 1- (A), 2- (B) and 5- (C) year. |
Web-Based Dynamic Nomogram
A web-based calculator was built (https://bs-acmr-nom.shinyapps.io/dynnomapp/) to facilitate the use of the nomogram for clinicians (Figure S3). The dynamic BS-ACMR nomogram can be easily obtained predicted probability of all-cause mortality of AHF patients after inputting the six independent variables and survival time (months) and reading output results generated by the website.
Discussion
In the present study, a predictive tool incorporating selected biomarkers and clinical indicators was constructed. This BS-ACMR (B: NT-pro BNP; S: ST2; A: Age; C: CRBBB; M: MAP; and R: RDW >14.5%) nomogram score system is a prognostic model of all-cause mortality that provided accurate predictions of survival in AHF patients. For a median follow-up of 34 months and maximum follow-up of 80 months, cross-validation was helpful for effective use of our limited data. The accuracy (C-index) of the nomogram tool in predicting all-cause mortality risk for AHF patients at 1-, 2-, and 5-years was 0.793 in the derivation cohort and 0.782 in the validation cohort. By exact truncation of variables and comprehensive model evaluation, the nomogram tool constructed here combined NT-pro BNP, ST2, and routine clinical features (age, MAP, RDW, CRBBB) to establish an effective and accurate clinical prognostic model, and to enhance its clinical applications. The range of values also suggested that further exploration of specific thresholds of these prognostic significance variables could provide incremental value for assessing the prognosis of AHF patients.
Myocardial remodeling represents the key pathway of development from cardiac dysfunction to advanced heart failure. Biomarkers reflects these pathological changes of hemodynamic overload, progressive myocardial fibrosis and increased cardiomyocyte stiffness in AHF have been shown to have important applications to the management of patients. ST2 reflects tissue fibrosis and may promote cardiac hypertrophy, fibrosis, and ventricular dysfunction.42 Also indicate cardiac remodeling and therefore represent valuable additive risk stratification of patients with acute and chronic HF.43 Although ST2 predicts mortality in HFpEF individuals with acute dyspnea,21 the threshold of ST2 for poor prognosis of HF are inconsistent. For instance, a value ≥ 35 ng/mL (median, 42.7 ng/mL) in HF patients,44 67.4 ng/mL in non-survivors, and 35.8 ng/mL in survivors of acute decompensated heart failure at 1 year,45 and a median of 148 ng/mL (interquartile range of 88 to 226 ng/mL) in more advanced HF patients.46 In the current study, ST2 was one of the most significant predictive indicator shown nonlinear relationship for ST2 > 86 ng/mL, and all-cause mortality risk increased 4.04-fold over the range. While the ST2 threshold of our result could not generalize as the preliminary precaution signal of myocardial fibrosis, the increase level of ST2 provides healthcare providers to recognize higher-risk AHF patients.
Concentrations of NT-pro BNP are related to left ventricle (LV) filling pressures and wall stress,44,48 especially in the context of ventricular fibrosis. Accordingly, the utility of ST2 is additive with that of NT-pro BNP as a predictor of mortality.47 The increased NT-pro BNP levels during left ventricular dysfunction and acute myocardial infarction, and serve to counteract mechanisms of heart failure through diuresis, natriuresis, and antihypertensive effects.50,52 Threshold levels of NT-pro BNP associated with diagnosis of heart failure ranged variate from 30 to 400 pg/mL in different studies, with a large range of sensitivities (6–97%) and specificities (35–100%).49,50 Whereas, paucity of un-uniformity clinical prognosis thresholds makes it difficult to translate the results to clinical application.51,52 Our NT-pro BNP level of >5582 pg/mL was strongly associated with increased all-cause mortality of AHF, which accounts certain efficiency to identify critically ill patients and guide clinical decisions. To our knowledge, our study is the first clinical nomogram model which incorporates NT-pro BNP, ST2, and clinicopathology to assess the long-term risk of all-cause mortality in AHF patients. Additionally, BS-ACMR nomogram incorporating clinical features provides greater clinical utility than solely ST2 or NT-pro BNP evaluation.
Beside the two biomarkers in the model, age was a proven independent prognostic indicator all-cause mortality,36,43,44,49,50 which weighted second in our model superior to MAP, CRBBB, RDW, and NT-pro BNP. Secondly, our study also found that CRBBB increases the risk for all‐cause mortality about 3.227-fold (95% CI: 2.077–5.014). Previous epidemiological studies, CRBBB was found related to myocardial ischemia, an independent predictor of decreased right ventricular ejection fraction.55 One possible pathophysiological mechanism that may contribute to cardiovascular mortality, may be right ventricular dyssynchrony.53,54 CRBBB could consider a sign of other underlying cardiovascular conditions, including but not limited to ischemic, inflammatory, infiltrative heart disease, and pulmonary embolism, which associated to complete heart block, ventricular arrhythmias, HF, and death.53 Although inconsistent results regarding the association between CRBBB and clinical outcomes such as all-cause and cardiovascular mortality have been reported,55 there were large prospective cohort - Copenhagen City Heart Study with 18,441 participants56 and a recent Mayo Clinic study with 31,979 subjects53 both reported that CRBBB was predictive of all‐cause (Copenhagen and Mayo) and cardiovascular‐related (Mayo) mortality, even in patients without CVD. Our findings are consistent with those studies. Despite our study only enrolled limited patients with CRBBB, our result and these previous studies support by incorporating CRBBB into the model can provide certain guidance for prognostic assessment.
Additionally, every 5-unit increase of RDW was associated with a 2.366-fold (95% CI: 1.522–3.677) increase in adverse outcomes of AHF. As a measure of variability in the size of circulating red blood cells, RDW was used as an independent predictor of adverse outcomes in chronic57 and acute decompensated HF.58 Previous studies have demonstrated that elevated RDW was associated with high left ventricular end-diastolic pressure,59 which is a strong predictor of poor prognosis and sudden death regardless of LVEF.60 Both RDW and NT-pro BNP are included in our BS-ACMR nomogram, which is supported by their well-established correlation with LV filling pressure and hemodynamics. Similarly, MAP is a valuable factor as it reflects cardiac capacity, myocardial function, and peripheral artery resistance. Prognosis of AHF patients needs to consider preservation of organ perfusion and capacity management. Atypical factors reflecting hemodynamic states included in the BS-ACMP nomogram are sensitive prognostic factors of pathological manifestations of heart failure, which provide clues to cardiac insufficiency.
Reviewing the previous prognostic AHF models, study showed model based on three easy parameters (age, serum creatinine and lactate) was associated with regarding 28-day mortality in the acute decompensated HF complicated by cardiogenic shock.61 Another study enrolled 1033 AHF patients in emergency setting exhibited elevated troponin and renal function were significant predictors of adverse events.62 In addition, results via the AHEAD scoring system (A: atrial fibrillation; H: hemoglobin; E: elderly; A: abnormal renal parameters; D: diabetes mellitus) also could be factor in assessing prognosis.63 Furthermore, our study showed a similar result to the Massachusetts study64 which explored 1-year mortality for acute decompensated HF based on ejection fraction with higher proportion of reduced EF (49.9% VS 35%) and lower proportion of preserved EF (29.23% VS 52%). Compare with model in the study, different predictors risk factors included chronic obstructive pulmonary disease history, SBP <150 mm Hg on admission, and hyponatremia. Distinct to the previous study, our findings that integrate the clinical features and significant biomarkers (NT-pro BNP and ST2) emphasized the changes in clinicopathological status, and the long-term follow-up may provide a reference risk evaluation of AHF over different time periods.
Strengths and Limitations
In the present study, distinct to the previous nomogram that roughly calculate an approximation, our research by conducting a dynamic network calculator and a visual BS-ACMR nomogram could provide a convenient method with each significant explanatory variable. Also, result from our prospective study could provide additive clinical values for recognizing the high risk AHF patients, which could guide an optimal medical management in selected condition. Moreover, incorporating NT-pro BNP and ST2 which reflect hemodynamic states in to the models, redefined truncation value of these markers helps early identification these particular patients closely related to all-cause death.
Our study has certain limitations. Only 537 AHF patients from a single center was prospectively collected. However, the prognostic analysis with systematic data collection and long-term follow-up could minimize potential bias. Second, although the models have not been externally validated, we developed a 10-fold cross-validation and bootstrap re-sampling technique to maximize power and calibration of the predicted probabilities against mortality rates, which indicated a good outcome given the limitations of the study. Third, unlike previous studies,12–14 medication and ICD/CRT device therapy was not incorporated with our nomogram which are potentially affected mortality rate of AHF. Expanding the study population and kinetic measurement of indicators should be considered to improved popularization meanings of the model in the future. Despite these limitations, our study provided a robustness and accurate prediction model to assess the all-cause mortality risk of AHF. Additionally, the main advantages of our study were that all the included prognosticators were feasible and accessible in routine clinical practice.
In the future, on the premise of sufficient sample size, further stratification analysis considering of various comorbidities of AHF patients (like obesity, T2DM, hypertension and anemia etc.) will help to increase model precision. Investigators are invited to share their data implement external validation regarding AHF clinical settings in order to further improve the absolute risk estimates of the current model.
Conclusions
We developed and validated a web-based BS-ACMR nomogram risk calculator, which can address the relative long-term time-dependent death risk of AHF patients via clinical data includes redefined truncation value of biomarkers (NT-pro BNP and ST2) that help to identification patients closely related to all-cause death. The multivariable dynamic practical nomogram demonstrated good calibration, discrimination, and clinical utility. These findings could help clinicians in stratifying the risk of AHF patients, clinical decision-making, and early prevention.
Data Sharing Statement
The data that support the findings of this study are available from the corresponding author ([email protected]) upon reasonable request. The request will be reviewed by the Twelve-Fifth National Key Technology R&D Program for approval.
Ethical Standards
The study was approved by the ethics committee of the First Affiliated Hospital of Nanjing Medical University, and all patients provided written informed consent. All procedures conformed to the standards of the Declaration of Helsinki.
Acknowledgments
The authors thank all the stuff who participated in the Twelve-Fifth National Key Technology R&D Program. The authors thank professor Xinli Li for programming support.
Author Contributions
Xinli Li and Yanli Zhou contributed as co-corresponding authors. All authors made a significant contribution to the work reported, whether that is in the conception, study design, execution, acquisition of data, analysis and interpretation, or in all these areas; took part in drafting, revising or critically reviewing the article; gave final approval of the version to be published; have agreed on the journal to which the article has been submitted; and agree to be accountable for all aspects of the work.
Disclosure
The authors report no conflicts of interest in this work.
References
1. Savarese G, Lund LH. Global public health burden of heart failure. Card Fail Rev. 2017;3(1):7–11. doi:10.15420/cfr.2016:25:2
2. Yancy CW, Jessup M, Bozkurt B, et al. 2017 ACC/AHA/HFSA focused update of the 2013 ACCF/AHA guideline for the management of heart failure: a report of the American College of Cardiology/American Heart Association Task Force on Clinical Practice Guidelines and the Heart Failure Society of America. J Card Fail Aug. 2017;23(8):628–651.
3. Khera R, Dharmarajan K, Krumholz HM. Rising mortality in patients with heart failure in the United States: facts versus fiction. JACC Heart Fail. 2018;6:610–612. doi:10.1016/j.jchf.2018.02.011
4. Wessler BS, Ruthazer R, Udelson JE, et al. Regional validation and recalibration of clinical predictive models for patients with acute heart failure. J Am Heart Assoc. 2017;6:e006121. doi:10.1161/JAHA.117.006121
5. Rahimi K, Bennett D, Conrad N, et al. Risk prediction in patients with heart failure: a systematic review and analysis. JACC Heart Fail. 2014;2:440–446. doi:10.1016/j.jchf.2014.04.008
6. Levy WC, Mozaffarian D, Linker DT, et al. The Seattle Heart Failure Model: prediction of survival in heart failure. Circulation. 2006;113:1424–1433. doi:10.1161/CIRCULATIONAHA.105.584102
7. Pocock SJ, Ariti CA, McMurray JJ, et al. Predicting survival in heart failure: a risk score based on 39372 patients from 30 studies. Eur Heart J. 2013;34:1404–1413. doi:10.1093/eurheartj/ehs337
8. Sartipy U, Dahlstrom U, Edner M, et al. Predicting survival in heart failure: validation of the MAGGIC heart failure risk score in 51,043 patients from the Swedish heart failure registry. Eur J Heart Fail. 2014;16:173–179. doi:10.1111/ejhf.32
9. Sato N, Kajimoto K, Keida T, et al. Clinical features and outcome in hospitalized heart failure in Japan (from the ATTEND registry). Circ J. 2013;77:944–951. doi:10.1253/circj.CJ-13-0187
10. Shiraishi Y, Kohsaka S, Nagai T, et al. Validation and recalibration of Seattle Heart Failure Model in Japanese acute heart failure patients. J Card Fail Jul. 2019;25(7):561–567. doi:10.1016/j.cardfail.2018.07.463
11. Voors AA, Ouwerkerk W, Zannad F, et al. Development and validation of multivariable models to predict mortality and hospitalization in patients with heart failure. Eur J Heart Fail. 2017;19:627–634. doi:10.1002/ejhf.785
12. Yang M, Tao L, An H, et al. A novel nomogram to predict all-cause readmission or death risk in Chinese elderly patients with heart failure. ESC Heart Failure. 2020;7:1015–1024. doi:10.1002/ehf2.12703
13. Gao S, Yin G, Xia Q, et al. Development and validation of a nomogram to predict the 180-day readmission risk for chronic heart failure: a multicenter prospective study. Front Cardiovasc Med. 2021;8:731730. doi:10.3389/fcvm.2021.731730
14. Zhao E, Xie H, Zhang Y. A nomogram based on apelin-12 for the prediction of major adverse cardiovascular events after percutaneous coronary intervention among patients with ST-segment elevation myocardial infarction. Cardiovasc Ther. 2020;2020:9416803. doi:10.1155/2020/9416803
15. Wessler BS, Lundquist CM, Koethe B, et al. Clinical prediction models for valvular heart disease. J Am Heart Assoc. 2019;8:e011972. doi:10.1161/JAHA.119.011972
16. Pascual-Figal DA, Ordoñez-Llanos J, Tornel PL, et al. Soluble ST2 for predicting sudden cardiac death in patients with chronic heart failure and left ventricular systolic dysfunction. J Am Coll Cardiol. 2009;54(23):2174–2179. doi:10.1016/j.jacc.2009.07.041
17. Ponikowski P, Voors AA, Anker SD, et al. ESC Guidelines for the diagnosis and treatment of acute and chronic heart failure: the Task Force for the diagnosis and treatment of acute and chronic heart failure of the European Society of Cardiology (ESC). Developed with the special contribution of the Heart Failure Association (HFA) of the ESC. Eur J Heart Fail Aug. 2016;18(8):891–975.
18. Lee DS, Lee JS, Schull MJ, et al. Prospective validation of the emergency heart failure mortality risk grade for acute heart failure: the acute congestive heart failure urgent care evaluation (ACUTE) study. Am Heart J. 2016;181:60–65. doi:10.1016/j.ahj.2016.07.016
19. Chen YJ, Sung SH, Cheng HM, et al. Performance of AHEAD score in an Asian Cohort of Acute Heart Failure with either preserved or reduced left ventricular systolic function. J Am Heart Assoc. 2017;6. doi:10.1161/JAHA.116.004297
20. Aimo A, Vergaro G, Ripoli A, et al. Meta-analysis of soluble suppression of tumorigenicity-2 and prognosis in acute heart failure. JACC Heart Fail. 2017;5(4):287–296. doi:10.1016/j.jchf.2016.12.016
21. Dutka M, Bobiński R, Ulman-Włodarz I, et al. Various aspects of inflammation in heart failure. Heart Fail Rev. 2020;25:537–548. doi:10.1007/s10741-019-09875-1
22. Wang K, Ni G, Wu Q, et al. Prognostic value of N-terminal pro-B-type natriuretic peptide and glomerular filtration rate in patients with acute heart failure. Front Cardiovasc Med. 2020;7:123. doi:10.3389/fcvm.2020.00123
23. Cheang I, Liao S, Yao W, et al. Cystatin C-based CKD-EPI estimated glomerular filtration rate equations as a better strategy for mortality stratification in acute heart failure. Medicine. 2020;99(44):e22996. doi:10.1097/MD.0000000000022996
24. Adams KF, Fonarow GC, Emerman CL, et al. Characteristics and outcomes of patients hospitalized for heart failure in the United States: rationale, design, and preliminary observations from the first 100,000 cases in the Acute Decompensated Heart Failure National Registry (ADHERE). Am Heart J. 2005;149(2):209–216. doi:10.1016/j.ahj.2004.08.005
25. Fonarow GC, Thomas Heywood J, Heidenreich PA, et al. Temporal trends in clinical characteristics, treatments, and outcomes for heart failure hospitalizations, 2002 to 2004: findings from Acute Decompensated Heart Failure National Registry (ADHERE). Am Heart J. 2007;153(6):1021–1028. doi:10.1016/j.ahj.2007.03.012
26. Xiao J, Gao R, Bei Y, et al. Circulating miR-30d predicts survival in patients with acute heart failure. Cell Physiol Biochem. 2017;41(3):865–874. doi:10.1159/000459899
27. Wu X, Chen M, Wang K, et al. Gender differences in prognostic markers of all-cause death in patients with acute heart failure: a prospective 18-month follow-up study. J Cardiovasc Transl Res. 2020;13(1):97–109. doi:10.1007/s12265-019-09893-2
28. Gheorghiade M, Follath F, Ponikowski P, et al. Assessing and grading congestion in acute heart failure: a scientific statement from the acute heart failure committee of the heart failure association of the European society of cardiology and endorsed by the European society of intensive care medicine. Eur J Heart Fail. 2010;12:423–433. doi:10.1093/eurjhf/hfq045
29. Matsushita K, Mahmoodi BK, Woodward M; Chronic Kidney Disease Prognosis Consortium. Comparison of risk prediction using the CKD-EPI equation and the MDRD study equation for estimated glomerular filtration rate. JAMA. 2012;307(18):1941–1951. doi:10.1001/jama.2012.3954
30. Landerman LR, Land KC, Pieper CF. An empirical evaluation of the predictive mean matching method for imputing missing values. Sociol Methods Res. 1997;26(1):3–33. doi:10.1177/0049124197026001001
31. Das KK, Geng X, Brown JW, et al. Cross validation of the monoclonal antibody das-1 in identification of high-risk mucinous pancreatic cystic lesions. Gastroenterology. 2019;157:720–730. doi:10.1053/j.gastro.2019.05.014
32. Zhang Y, Chen P, Zhou Q, et al. A novel immune-related prognostic signature in head and neck squamous cell carcinoma. Front Genet. 2021;12:570336. doi:10.3389/fgene.2021.570336
33. Lin Y, Wang M, Jia J, et al. Development and validation of a prognostic nomogram to predict recurrence in high-risk gastrointestinal stromal tumour: a retrospective analysis of two independent cohorts. EBioMedicine. 2020;60:103016. doi:10.1016/j.ebiom.2020.103016
34. Su. Y-S, Gelman A, Hill J. Multiple imputation with diagnostics (mi) in R: opening windows into the Black Box. J Stat Softw. 2011;45:1–31. doi:10.18637/jss.v045.i02
35. Harrell FE. Regression Modeling Strategies with Applications to Linear Models, Logistic Regression, and Survival Analysis. New York, USA: Springer-Verlag New York, Inc.; 2001.
36. Dauriz M, Targher G, Temporelli PL, et al. Prognostic Impact of diabetes and prediabetes on survival outcomes in patients with chronic heart failure: a Post‐Hoc analysis of the GISSI‐HF (Gruppo Italiano per lo Studio della Sopravvivenza nella Insufficienza Cardiaca‐Heart Failure) trial. J Am Heart Assoc. 2017;6(7):e005156. doi:10.1161/JAHA.116.005156
37. Yang J, Tian G, Pan Z, et al. Nomograms for predicting the survival rate for cervical cancer patients who undergo radiation therapy: a SEER analysis. Future Oncol. 2019;15(26):3033–3045. doi:10.2217/fon-2019-0029
38. Thomas LE, O’Brien EC, Piccini JP, et al. Application of net reclassification index to non-nested and point-based risk prediction models: a review. Eur Heart J. 2019;40(23):1880–1887. doi:10.1093/eurheartj/ehy345
39. Pencina MJ, D’Agostino RB, D’Agostino RB. Evaluating the added predictive ability of a new marker: from area under the ROC curve to reclassification and beyond. Stat Med. 2008;27:207–212. doi:10.1002/sim.3106
40. Van Calster B, Wynants L, Verbeek JFM, et al. Reporting and interpreting decision curve analysis: a guide for investigators. Eur Urol. 2018;74(6):796–804. doi:10.1016/j.eururo.2018.08.038
41. Jalali A, Alvarez-Iglesias A, Roshan D, et al. Visualising statistical models using dynamic nomograms. PLoS One. 2019;14(11):e0225253. doi:10.1371/journal.pone.0225253
42. Shah KB, Kop WJ, Christenson RH, et al. Prognostic utility of ST2 in patients with acute dyspnea and preserved left ventricular ejection fraction. Clin Chem. 2011;57(6):874–882. doi:10.1373/clinchem.2010.159277
43. Ponikowski P, Voors AA, Anker SD, et al. 2016 ESC Guidelines for the diagnosis and treatment of acute and chronic heart failure: the Task Force for the diagnosis and treatment of acute and chronic heart failure of the European Society of Cardiology (ESC) Developed with the special contribution of the Heart Failure Association (HFA) of the ESC. Eur Heart J. 2016;37:2129–2200. doi:10.1093/eurheartj/ehw128
44. Januzzi JL, Mebazaa A, Di Somma S. ST2 and prognosis in acutely decompensated heart failure: the International ST2 Consensus Panel. Am J Cardiol. 2015;115(7 Suppl):26B–31B. doi:10.1016/j.amjcard.2015.01.037
45. Shah RV, Chen-Tournoux AA, Picard MH, et al. Serum levels of the interleukin-1 receptor family member ST2, cardiac structure and function, and long-term mortality in patients with acute dyspnea. Circ Heart Fail. 2009;2(4):311–319. doi:10.1161/CIRCHEARTFAILURE.108.833707
46. Zilinski JL, Shah RV, Gaggin HK, et al. Measurement of multiple biomarkers in advanced stage heart failure patients treated with pulmonary artery catheter guided therapy. Crit Care. 2012;16(4):R135. doi:10.1186/cc11440
47. Lassus J, Gayat E, Mueller C, et al. Incremental value of biomarkers to clinical variables for mortality prediction in acutely decompensated heart failure: the Multinational Observational Cohort on Acute Heart Failure (MOCA) study. Int J Cardiol. 2013;168(3):2186–2194. doi:10.1016/j.ijcard.2013.01.228
48. Januzzi JL, Peacock WF, Maisel AS, et al. Measurement of the interleukin family member ST2 in patients with acute dyspnea: results from the PRIDE (Pro-Brain Natriuretic Peptide Investigation of Dyspnea in the Emergency Department) study. J Am Coll Cardiol. 2007;50(7):607–613. doi:10.1016/j.jacc.2007.05.014
49. National Institute for Health and Care Excellence. Chronic heart failure in adults: diagnosis and management: NICE guideline [NG106] [Internet]. London: NICE; [cited September 19, 2018] 2018. Available from: https://www.nice.org.uk/guidance/ng106.
50. Booth RA, Hill SA, Don-Wauchope A, et al. Performance of BNP and NT-proBNP for diagnosis of heart failure in primary care patients: a systematic review. Heart Fail Rev. 2014;19(4):439–451. doi:10.1007/s10741-014-9445-8
51. Li X, Chen C, Gan F, et al. Plasma NT pro-BNP, hs-CRP and big-ET levels at admission as prognostic markers of survival in hospitalized patients with dilated cardiomyopathy: a single-center cohort study. BMC Cardiovasc Disord. 2014;14:67. doi:10.1186/1471-2261-14-67
52. Januzzi JL, van Kimmenade R, Lainchbury J, et al. NT-proBNP testing for diagnosis and short-term prognosis in acute destabilized heart failure: an international pooled analysis of 1256 patients: the International Collaborative of NT-proBNP Study. Eur Heart J. 2006;27(3):330–337. doi:10.1093/eurheartj/ehi631
53. Alventosa-Zaidin M, Guix Font L, Benitez Camps M, et al. Right bundle branch block: prevalence, incidence, and cardiovascular morbidity and mortality in the general population. Eur J Gen Pract. 2019;25(3):109–115. doi:10.1080/13814788.2019.1639667
54. Sabe MA, Sabe SA, Kusunose K, et al. Predictors and prognostic significance of right ventricular ejection fraction in patients with ischemic cardiomyopathy. Circulation. 2016;134:656–665. doi:10.1161/CIRCULATIONAHA.116.022339
55. Eriksson P, Wilhelmsen L, Rosengren A. Bundle-branch block in middle-aged men: risk of complications and death over 28 years. Eur Heart J. 2005;26(21):2300–2306. doi:10.1093/eurheartj/ehi580
56. Bussink BE, Holst AG, Jespersen L, et al. Right bundle branch block: prevalence, risk factors, and outcome in the general population: results from the Copenhagen City Heart Study. Eur Heart J. 2013;34(2):138–146. doi:10.1093/eurheartj/ehs291
57. Felker GM, Allen LA, Pocock SJ, et al. Red cell distribution width as a novel prognostic marker in heart failure: data from the CHARM Program and the Duke Databank. J Am Coll Cardiol. 2007;50(1):40–47. doi:10.1016/j.jacc.2007.02.067
58. Pascual-Figal DA, Bonaque JC, Redondo B, et al. Red blood cell distribution width predicts long-term outcome regardless of anaemia status in acute heart failure patients. Eur J Heart Fail. 2009;11(9):840–846. doi:10.1093/eurjhf/hfp109
59. Senthong V, Hudec T, Neale S, et al. Relation of red cell distribution width to left ventricular end-diastolic pressure and mortality in patients with and without heart failure. Am J Cardiol. 2017;119(9):1421–1427. doi:10.1016/j.amjcard.2017.01.036
60. Fonarow GC. The treatment targets in acute decompensated heart failure. Rev Cardiovasc Med. 2001;2(Suppl 2):S7–S12.
61. Morici N, Viola G, Antolini L, et al. Predicting survival in patients with acute decompensated heart failure complicated by cardiogenic shock. Int J Cardiol Heart Vasc. 2021;34:100809. doi:10.1016/j.ijcha.2021.100809
62. Collins SP, Jenkins CA, Harrell FE, et al. Identification of emergency department patients with acute heart failure at low risk for 30-day adverse events: the STRATIFY decision tool. JACC Heart Fail. 2015;3(10):737–747. doi:10.1016/j.jchf.2015.05.007
63. Chen Y, Sung S, Cheng H, et al. Performance of AHEAD score in an Asian cohort of acute heart failure with either preserved or reduced left ventricular systolic function. J Am Heart Assoc. 2017;6(5):e004297.
64. Coles AH, Tisminetzky M, Yarzebski J, et al. Magnitude of and prognostic factors associated with 1‐year mortality after hospital discharge for acute decompensated heart failure based on ejection fraction findings. J Am Heart Assoc. 2015;4(12):e002303. doi:10.1161/JAHA.115.002303
 © 2022 The Author(s). This work is published and licensed by Dove Medical Press Limited. The
full terms of this license are available at https://www.dovepress.com/terms
and incorporate the Creative Commons Attribution
- Non Commercial (unported, 3.0) License.
By accessing the work you hereby accept the Terms. Non-commercial uses of the work are permitted
without any further permission from Dove Medical Press Limited, provided the work is properly
attributed. For permission for commercial use of this work, please see paragraphs 4.2 and 5 of our Terms.
© 2022 The Author(s). This work is published and licensed by Dove Medical Press Limited. The
full terms of this license are available at https://www.dovepress.com/terms
and incorporate the Creative Commons Attribution
- Non Commercial (unported, 3.0) License.
By accessing the work you hereby accept the Terms. Non-commercial uses of the work are permitted
without any further permission from Dove Medical Press Limited, provided the work is properly
attributed. For permission for commercial use of this work, please see paragraphs 4.2 and 5 of our Terms.