
Back to Journals » Diabetes, Metabolic Syndrome and Obesity » Volume 18
A Study on the Correlation Between Visceral Adiposity Index, Fatty Liver Index, and Thyroid Dysfunction in Patients with Type 2 Diabetes Mellitus
Authors Zheng B, Hu T, Yao J, Zhang Z, Xu Y, Shen H, Wang X, Tan Q
Received 4 June 2025
Accepted for publication 19 August 2025
Published 19 September 2025 Volume 2025:18 Pages 3553—3562
DOI https://doi.org/10.2147/DMSO.S544669
Checked for plagiarism Yes
Review by Single anonymous peer review
Peer reviewer comments 2
Editor who approved publication: Dr Rebecca Baqiyyah Conway
Bojing Zheng,* Tianxiao Hu,* Jiaqi Yao, Zhenying Zhang, Yao Xu, Huiling Shen, Xiujing Wang, Qingying Tan
Department of Endocrinology, 903rd Hospital of the Joint Logistic Support Force of the Chinese People’s Liberation Army, Hangzhou, Zhejiang Province, 310013, People’s Republic of China
*These authors contributed equally to this work
Correspondence: Xiujing Wang; Qingying Tan, Department of Endocrinology, 903rd Hospital of the Joint Logistic Support Force of the Chinese People’s Liberation Army, Hangzhou, Zhejiang Province, 310013, People’s Republic of China, Email [email protected]; [email protected]
Objective: This study explores the correlations between visceral adiposity index, fatty liver indices and thyroid dysfunction in type 2 diabetes mellitus patients.
Methods: This cross-sectional investigation was carried out between January 2021 and December 2022, encompassing 131 adult out-patients. Patients with other endocrine diseases, severe hepatic or renal insufficiency, or recent use of thyroid-affecting medications were excluded. Clinical and laboratory data, including body mass index, waist circumference, lipid profiles, liver function markers, and thyroid function tests, were collected.
Results: Blood tests showed hepatic injury markers, alanine aminotransferase, aspartate aminotransferase, and adverse lipid profiles, elevated triglycerides, reduced high-density lipoprotein, significantly increased across fatty liver indices quartiles (P < 0.05), reflecting hepatocellular injury. Waist circumference and body mass index also increased significantly with higher fatty liver indices quartiles. Similarly, visceral adiposity index showed strong correlations with metabolic parameters, including elevated alanine aminotransferase, aspartate aminotransferase, and triglycerides levels (P < 0.05). Regarding thyroid function, TSH levels increased to some extent (P = 0.068), suggesting a potential link between fatty liver and hypothyroidism.
Conclusion: This study highlights the significant role of visceral fat accumulation and liver fat deposition in contributing to insulin resistance and metabolic imbalances among individuals with type 2 diabetes. Clinicians and public health departments should promote early identification and intervention of visceral fat accumulation and fatty liver as tools to prevent metabolic syndrome and related diseases.
Keywords: type 2 diabetes mellitus, visceral adiposity index, fatty liver index, thyroid dysfunction, metabolic disorders
Introduction
Globally, type 2 diabetes mellitus (T2DM) has increased dramatically over the past several decades.1,2 The condition not only severely diminishes the quality of life but is also intricately linked to a range of chronic complications, such as cardiovascular disease,3,4 nephropathy,5,6 and retinopathy.7–9 These complications not only increase the incidence and severity of illness and death but also place a substantial financial strain on affected individuals, their families, and the broader community.10–12
In recent times, with the advancement of research on metabolic syndrome, the visceral adiposity index (VAI)13–15 and fatty liver index (FLI)16–18 have surfaced as innovative markers of metabolic health. The VAI evaluates the extent of visceral fat accumulation, whereas the FLI serves as a predictor for the likelihood of fatty liver.19,20 Research findings have consistently shown a strong association between visceral fat accumulation and fatty liver with insulin resistance21,22 and chronic inflammatory responses,23,24 both of which are integral components of metabolic syndrome.25,26 Moreover, thyroid dysfunction, encompassing both hyperthyroidism and hypothyroidism, is frequently observed in patients with T2DM. The connection between thyroid dysfunction and metabolic disturbances has increasingly attracted attention in recent years.27–29 Thyroid hormones play a crucial regulatory role in carbohydrate metabolism, lipid metabolism, and energy expenditure, and thyroid dysfunction may further exacerbate metabolic disorders.30,31 Although the roles of VAI and FLI in metabolic disorders have been extensively studied, research on the relationship between VAI or FLI and thyroid dysfunction remains relatively limited, particularly among T2DM patients.32 Clarifying the correlation between VAI/FLI and thyroid dysfunction is of great significance for a deeper understanding of the metabolic characteristics of T2DM patients and for optimizing their metabolic management.33 Furthermore, these correlation studies could offer significant guidance for the early identification and management of thyroid dysfunction in clinical settings.34
The main aim of this research is to examine the relationship between VAI and FLI with thyroid dysfunction among patients with T2DM. Additionally, the study seeks to evaluate the potential clinical relevance of these associations. The study showed that elevated VAI and FLI are independent predictors of thyroid dysfunction in patients with T2DM, thereby enhancing the metabolic management strategies for individuals with T2DM. VAI/FLI thresholds (>69.10 and >11.01, respectively) will outperform conventional anthropometrics in predicting incident thyroid dysfunction. This approach may ultimately contribute to developed more targeted interventions for metabolic disorders in this patient population from a metabolic syndrome-thyroid crosstalk.
Materials and Methods
Study Design
This cross-sectional study primarily aimed to investigate the potential associations between VAI, FLI, and thyroid dysfunction among patients with T2DM. Conducted from January 2021 to December 2022, the research took place at the Endocrinology Outpatient Department of 903rd Hospital of the Joint Logistic Support Force of the Chinese People’s Liberation Army. The study design and protocol underwent thorough review and approval by the hospital’s ethics committee, ensuring adherence to ethical standards. All participants were thoroughly briefed on the study procedures and potential risks, and provided written informed consent prior to enrollment. This strict observance of ethical protocols highlights the study’s dedication to participant welfare and scientific rigor.
Study Population
The study population consisted of individuals aged 18 years or older who had a confirmed diagnosis of T2DM. Patients with other endocrine disorders were excluded, as were those with severe liver or kidney dysfunction. Specifically, individuals with alanine aminotransferase (ALT) or aspartate aminotransferase (AST) levels more than threefold the upper normal limit, or with creatinine clearance below 30 mL/min, were not included. Additionally, patients who had recently used medications known to affect thyroid function were excluded, as were pregnant or breastfeeding women. Following the application of the inclusion and exclusion criteria, a final cohort of 131 patients was recruited into the study. The process of participant recruitment and selection is depicted in Figure 1.
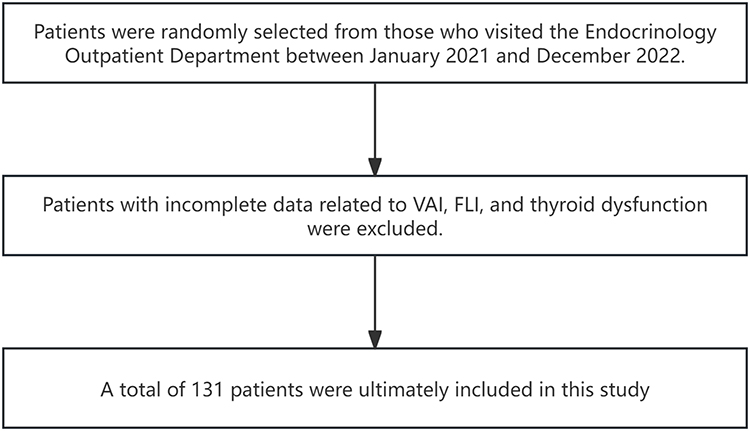 |
Figure 1 Study flow. |
Data Collection
A comprehensive dataset was collected, covering both clinical and laboratory aspects. Clinical data collection involved demographic and anthropometric parameters, including age, sex, height (HT), body weight (WT), body mass index (BMI), waist circumference (WC), hip circumference (HC), and systolic blood pressure (SBP) measurements. Laboratory analyses were extensive, targeting markers of metabolic status and organ function. Key assessments included fasting blood glucose (FBG) and glycated hemoglobin (HbA1c) to assess glucose regulation, as well as lipid profile metrics, including total cholesterol (TC), triglycerides (TG), high-density lipoprotein (HDL), and low-density lipoprotein (LDL). Additionally, markers of hepatic function and thyroid function were measured to assess overall metabolic health and potential organ-specific dysfunction, including AST, ALT, triiodothyronine (T3), thyroxine (T4), free triiodothyronine (FT3), free thyroxine (FT4), uric acid (UA), thyroid autoantibody levels thyroglobulin autoantibody (TGAb) and thyroid peroxidase (TPO). These detailed assessments provided a holistic view of the participants’ health status.
Calculation of VAI and FLI
1) VAI Calculation:
For men: VAI = WC ÷ (39.68 + 1.88 × BMI) × TG ÷ 1.03×1.31 ÷ HDL;
For women: VAI = WC ÷ (36.58 + 1.89 × BMI) × TG ÷ 0.81×1.52 ÷ HDL;
WC = waist circumference in cm; TG = triglycerides in mmol/L; HDL = HDL cholesterol in mmol/L.
2) FLI Calculation:
FLI = 0.74 × (WC × WC) − 7 × age − 14.2.
Definitions and Criteria
Thyroid dysfunction was diagnosed based on American Thyroid Association (ATA) guidelines. In this study, thyroid dysfunction was categorized based on thyroid-stimulating hormone (TSH) levels. Specifically, hyperthyroidism was defined as TSH levels lower than 0.4 mIU/L, reflecting an overactive thyroid gland. Conversely, hypothyroidism was diagnosed when TSH levels exceeded 4.0 mIU/L, indicating an underactive thyroid. Additionally, VAI was used to assess visceral fat accumulation. An abnormal VAI was defined as ≥ 2.87 for men and ≥ 2.72 for women. These thresholds were established to identify individuals with significant visceral fat accumulation, which is a key marker of metabolic risk. An FLI ≥ 60 indicated a high risk of fatty liver. Quartiles were derived from the sample distribution; Q1 = 0.85–3.16, Q2 = 3.53–5.89, Q3 = 5.90–10.93, Q4 = 11.01–57.63 for FLI; Q1 = 32.55–48.50, Q2 = 49.68–57.64, Q3 = 57.85–68.89, Q4 = 69.10–183.51 for VAI.
Statistical Analysis
In this study, data were systematically processed and analyzed using the statistical software SPSS, version 26.0. Categorical variables were summarized using frequencies and percentages to provide a clear overview of the distribution of categorical data within the study population. This approach ensured that the data were appropriately characterized and that subsequent statistical analyses were based on accurate descriptive statistics. Correlation analysis was performed using Spearman or Pearson methods based on data distribution. Logistic or linear regression analyses were conducted to control for confounders. A threshold of P < 0.05 was employed to determine statistical significance.
Results
Association Between FLI and Metabolic and Anthropometric Indicators
This investigation explored the correlation between fatty liver and various metabolic and anthropometric parameters, utilizing FLI quartiles as the basis for analysis. The results indicated a substantial increase in ALT and AST levels with rising FLI values. Specifically, ALT levels escalated from 17.00 U/L (14.00–25.00) in the first quartile (Q1) to 45.00 U/L (28.00–64.00) in the fourth quartile (Q4), while AST levels rose from 15.00 U/L (14.00–18.00) in Q1 to 26.00 U/L (18.00–37.00) in Q4. These findings underscore a robust association between the severity of fatty liver and liver cell injury (Table 1).
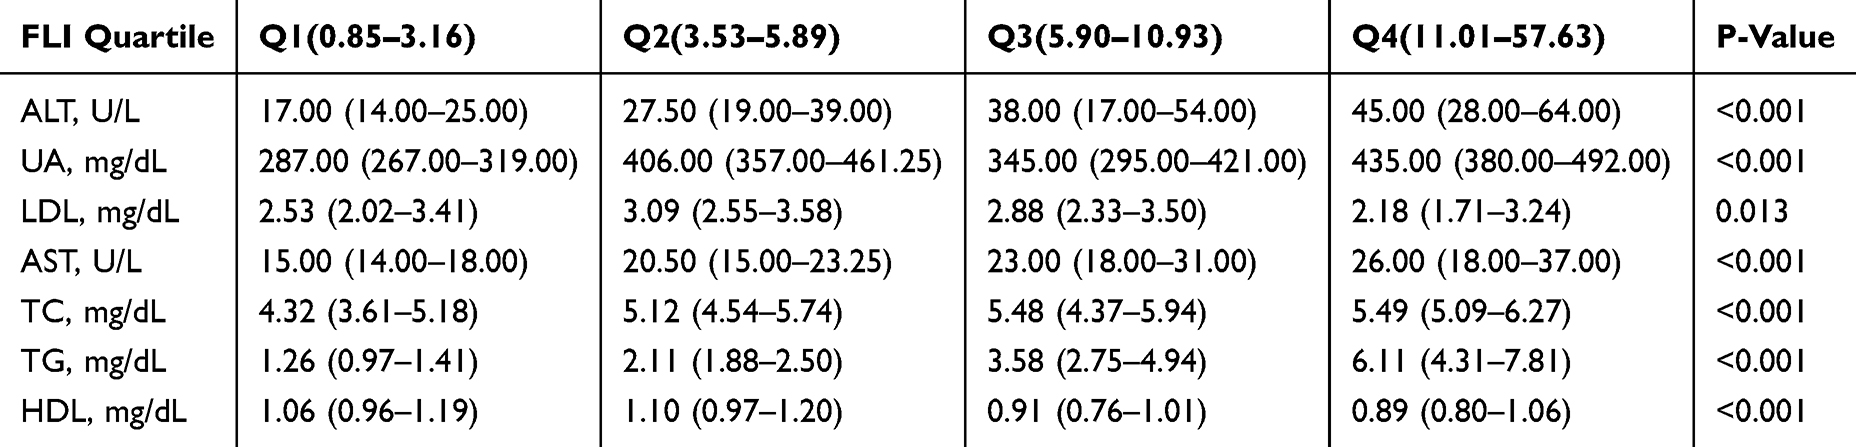 |
Table 1 Characteristics of the Participants Categorized by FLI |
Moreover, TG levels exhibited a marked increase from 1.26 mmol/L (0.97–1.41) in Q1 to 6.11 mmol/L (4.31–7.81) in Q4, whereas HDL levels decreased from 1.06 mmol/L (0.96–1.19) in Q1 to 0.89 mmol/L (0.80–1.06) in Q4. These changes highlight a profound connection between fatty liver and lipid metabolism disorders. Additionally, both WC and HC showed significant increases with rising FLI, from 82.00 cm (77.00–87.00) and 90.00 cm (88.00–94.00) in Q1 to 100.00 cm (94.00–108.00) and 101.00 cm (97.00–109.00) in Q4, respectively (Supplementary Table 1). These results emphasize central obesity as a pivotal risk factor for fatty liver. Concurrently, BMI also increased from 23.01 kg/m² (21.16–25.43) in Q1 to 29.90 kg/m² (27.63–32.50) in Q4, further solidifying the link between obesity and fatty liver (Table 1).
The existing literature confirms that fatty liver is closely linked to obesity, metabolic disorders, and cardiovascular disease risk. Visceral fat accumulation, a key driver of fatty liver disease, secretes adipokines and cytokines that stimulate hepatic fat synthesis. This process contributes to insulin resistance, a condition where cells respond poorly to insulin, further promoting hepatic fat accumulation. This vicious cycle accelerates fatty liver progression. Targeted interventions to reduce visceral fat are essential for mitigating metabolic complications. Early identification and management of obesity and metabolic abnormalities are critical for preventing and treating fatty liver.
Association Between Visceral Fat Accumulation and Metabolic and Anthropometric Indicators
This research sought to examine the complex interplay between visceral fat distribution and various metabolic and anthropometric indicators. To achieve a detailed and stratified analysis, the VAI was utilized, with participants categorized into quartiles based on their VAI scores. This approach allowed for a more nuanced examination of how variations in visceral fat distribution correlate with specific metabolic markers and anthropometric measurements. The findings of this stratified analysis, detailed in Table 2, offer significant perspectives on the intricate relationship between visceral fat accumulation and comprehensive metabolic health (Table 2). The findings revealed a significant increase in ALT levels, from 18.00 U/L (13.00–31.00) in Q1 to 38.50 U/L (24.00–55.00) in Q3, and AST levels, which rose from 16.00 U/L (13.00–19.00) in Q1 to 23.50 U/L (19.00–34.50) in Q3. These results suggest a strong link between visceral fat accumulation and liver cell injury.
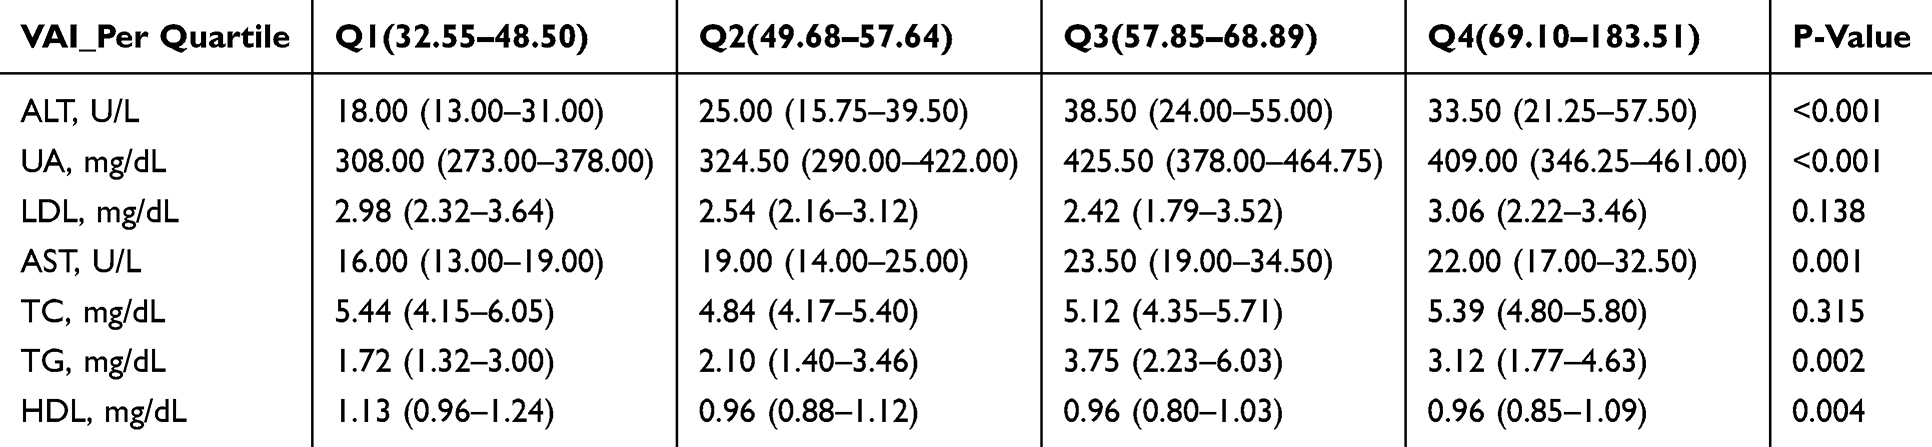 |
Table 2 Characteristics of the Participants Categorized by VAI |
Furthermore, UA levels increased from 308.00 mg/dL (273.00–378.00) in Q1 to 425.50 mg/dL (378.00–464.75) in Q3, while TG levels rose from 1.72 mmol/L (1.32–3.00) in Q1 to 3.75 mmol/L (2.23–6.03) in Q3. HDL levels, on the other hand, decreased from 1.13 mmol/L (0.96–1.24) in Q1 to 0.96 mmol/L (0.85–1.09) in Q4, indicating a significant correlation between visceral fat accumulation and metabolic disorders (Table 2).
Anthropometric indicators also exhibited notable changes. WC increased from 80.00 cm (76.00–81.00) in Q1 to 106.00 cm (101.00–116.00) in Q4, HC rose from 88.00 cm (85.00–90.00) in Q1 to 107.50 cm (102.00–113.00) in Q4, BMI increased from 21.53 kg/m² (20.78–23.44) in Q1 to 31.39 kg/m² (28.91–36.26) in Q4, WT rose from 59.60 kg (56.20–62.60) in Q1 to 92.65 kg (88.08–101.07) in Q4, and SBP increased from 120.00 mmHg (107.00–128.00) in Q1 to 135.00 mmHg (120.50–145.25) in Q4 (Supplementary Table 2).
In summary, the research highlights the significant impact of visceral fat on metabolic disturbances and the risk of cardiovascular diseases. It underscores the necessity for early detection and management of visceral fat accumulation as a preventive measure against diseases associated with metabolic syndrome.
Relationship Between FLI and Metabolic and Thyroid Parameters
The current study sought to explore the associations between the FLI and several key metabolic parameters, including glucose metabolism, thyroid function, and thyroid autoantibodies (Table 3). The findings revealed a notable rise in fasting insulin levels as quartiles progressed, rising from 6.30 μU/mL (interquartile range: 4.57–9.63) in the lowest quartile (Q1) to 11.80 μU/mL (interquartile range: 7.80–17.30) in the highest quartile (Q4). This trend was statistically significant (P = 0.001), implying that higher FLI values are associated with worsening insulin resistance. These results highlight the significance of the FLI as a potential indicator of insulin resistance and highlight the need for further investigation into the interplay between fatty liver and metabolic dysfunction. Fasting C-peptide levels also rose significantly from 2.17 ng/mL (1.35–2.65) in Q1 to 3.65 ng/mL (2.90–4.47) in Q4 (P < 0.001), suggesting a strong link between fatty liver severity and enhanced insulin secretion. While postprandial 2-hour insulin and C-peptide levels exhibited an increasing trend, the observed changes failed to achieve statistical significance, with P-values of 0.223 and 0.001, respectively. FPG, postprandial 2-hour glucose, and HbA1c levels exhibited fluctuations but no significant differences (P > 0.05), indicating that the relationship between fatty liver and glucose metabolism requires further investigation.
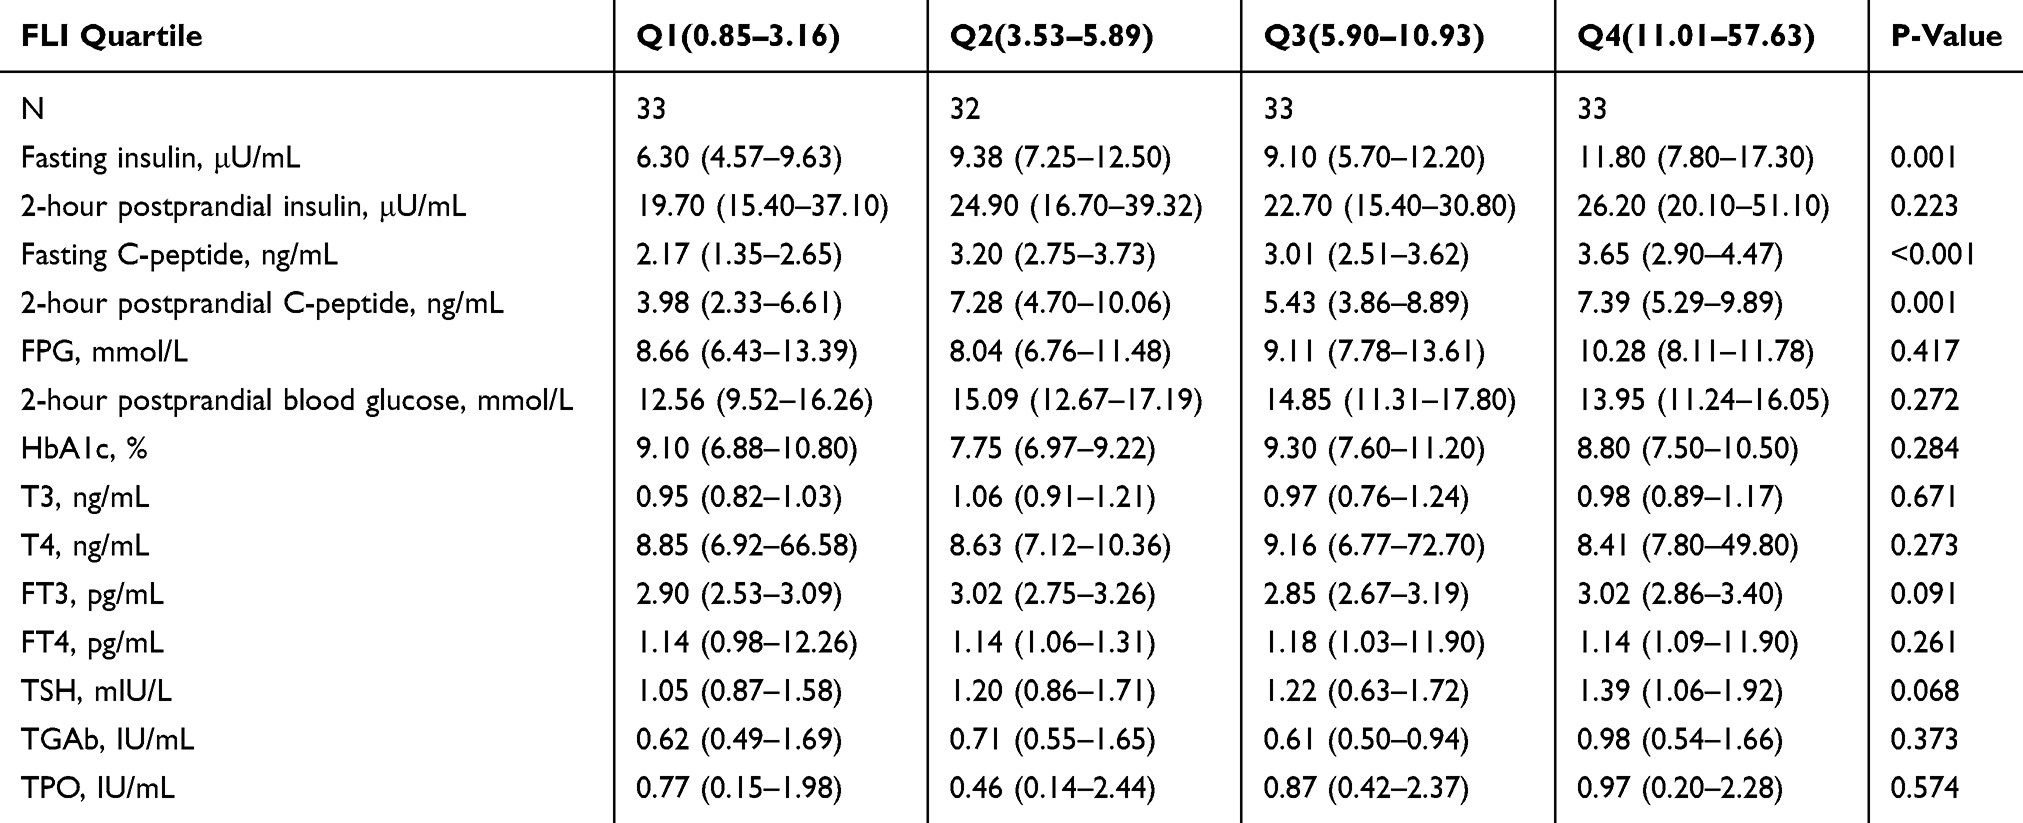 |
Table 3 The Relationship Between the Quartile Levels of FLI and Indicators Related to Diabetes and Thyroid Function |
Regarding thyroid function, T3, T4, FT3, and FT4 levels did not reach statistical significance (P > 0.05). However, TSH levels increased from 1.05 mIU/L (0.87–1.58) in Q1 to 1.39 mIU/L (1.06–1.92) in Q4 (P = 0.068), approaching significance and suggesting a potential link between fatty liver and hypothyroidism. Thyroid autoantibody levels (TGAb and TPO) did not change significantly (P > 0.05), indicating that fatty liver may not be directly related to thyroid autoimmune diseases. The strong association observed suggests that fatty liver is not merely a consequence but also a contributing factor to impaired insulin sensitivity. Given this interrelationship, the timely detection and intervention of insulin resistance emerge as crucial strategies. Early management of insulin resistance through lifestyle modifications, pharmacological interventions, or other targeted approaches could potentially reduce the incidence and severity of fatty liver.
Association Between VAI and Glucose Metabolism, Thyroid Function, and Autoimmunity
This study explored the relationship between VAI and glucose metabolism, thyroid function, and thyroid autoantibodies, using VAI quartiles for analysis (Table 4). The study results demonstrated a significant increase in fasting insulin levels across quartiles, with values rising from 6.50 μU/mL (interquartile range: 5.57–12.00) in the lowest Q1 to 12.15 μU/mL (interquartile range: 7.82–16.98) in the highest Q4. This increase was statistically significant (P = 0.002). The observed trend indicates that as visceral fat accumulation increases, insulin resistance worsens progressively. This finding underscores the importance of monitoring visceral fat levels as a potential biomarker for insulin resistance. Similarly, fasting C-peptide levels rose significantly from 1.95 ng/mL (1.35–2.75) in Q1 to 3.63 ng/mL (2.89–4.50) in Q4 (P < 0.001), underscoring the link between visceral fat and enhanced insulin secretion. Although postprandial 2-hour insulin and C-peptide levels demonstrated an upward trend, they did not attain complete statistical significance, with P-values of 0.016 and less than 0.001, respectively, possibly due to sample size limitations or individual variability.
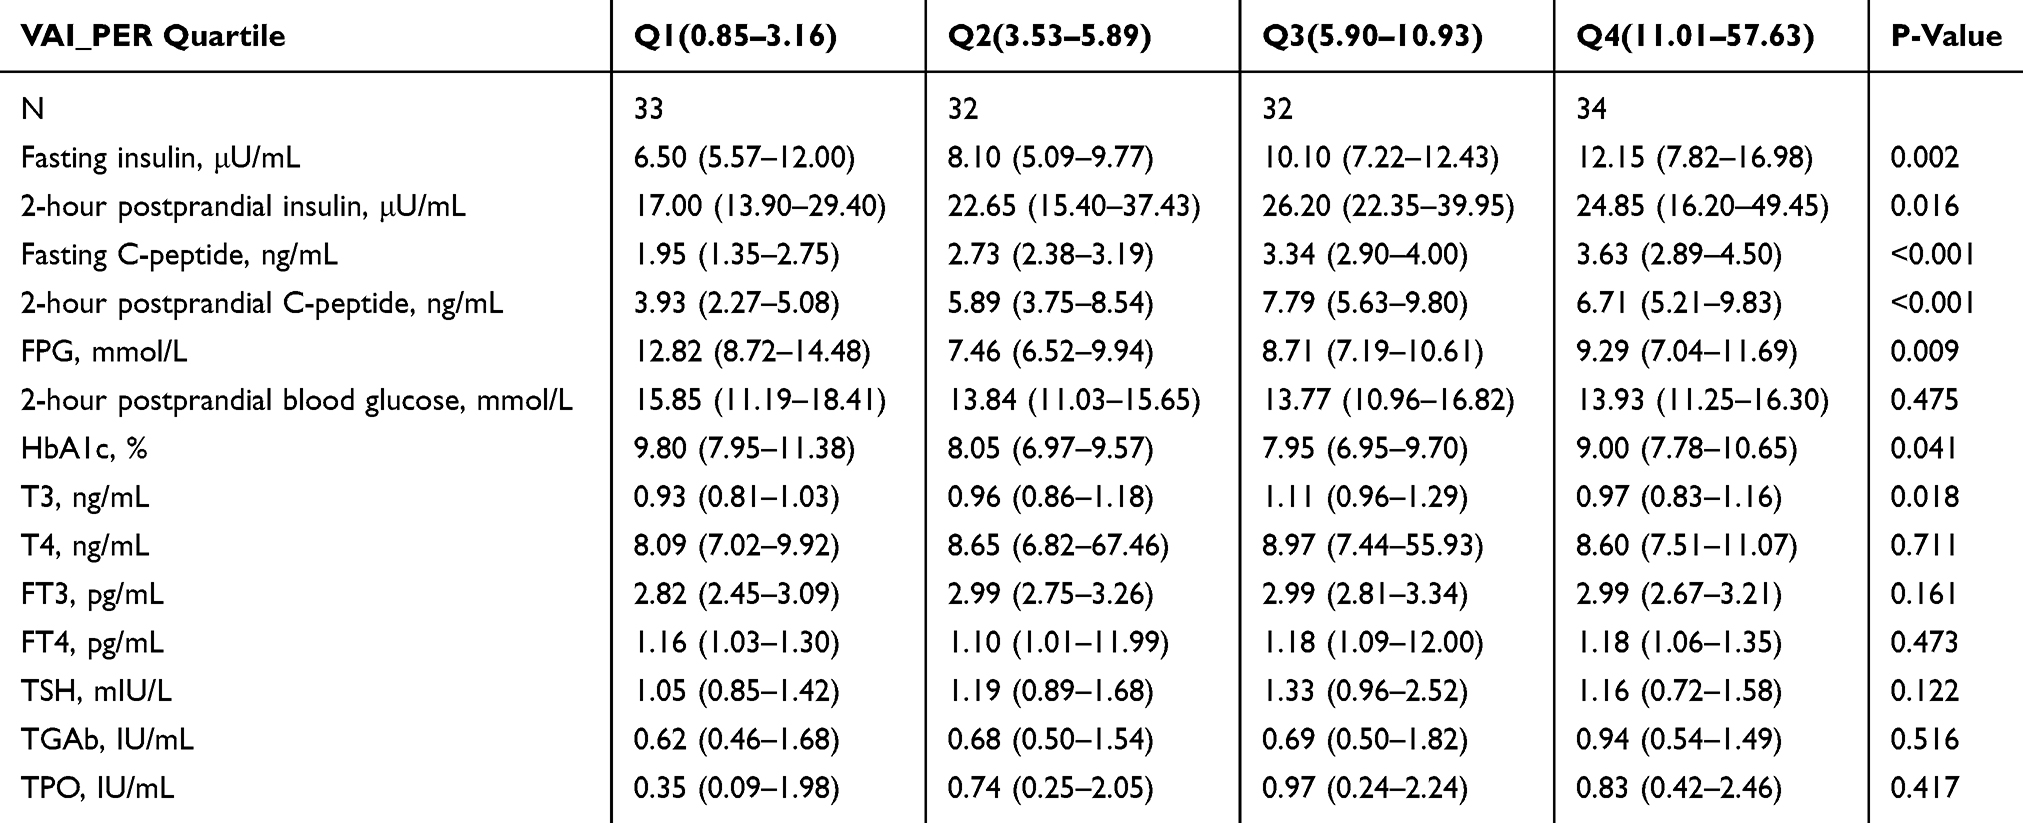 |
Table 4 The Relationship Between the Quartile Levels of VAI and Indicators Related to Diabetes and Thyroid Function |
Regarding glucose metabolism, FPG and HbA1c levels exhibited fluctuations but no significant trends (P > 0.05), suggesting a potential association between visceral fat and glucose metabolism that warrants further investigation. In terms of thyroid function, T3 levels increased from 0.93 ng/mL (0.81–1.03) in Q1 to 1.11 ng/mL (0.96–1.29) in Q3 before slightly decreasing in Q4 (P = 0.018), indicating a possible impact of visceral fat on thyroid function. However, changes in T4, FT3, and FT4 levels were not significant (P > 0.05). TSH levels rose from 1.05 mIU/L (0.85–1.42) in Q1 to 1.33 mIU/L (0.96–2.52) in Q3 before slightly decreasing in Q4 (P = 0.122), approaching significance and suggesting a potential link between visceral fat and hypothyroidism. Thyroid autoantibody levels (TGAb and TPO) did not change significantly (P > 0.05), evidencing that visceral fat accumulation may not be directly related to thyroid autoimmune diseases.
In synthesizing the findings of this study, it is evident that visceral fat accumulation plays a pivotal role in the development and progression of insulin resistance and metabolic disorders. The strong associations identified suggest that visceral fat is not merely a marker but also a significant contributor to these metabolic derangements. Early detection of visceral fat accumulation, therefore, emerges as a crucial preventive strategy.
Discussion
This study aimed to explore the associations among the VAI, FLI, and thyroid dysfunction in individuals with T2DM.35,36 Considering the rising incidence of metabolic disorders in this demographic, understanding these associations is crucial for developing targeted interventions. The VAI and FLI are well-established markers of adiposity and hepatic steatosis, respectively, while thyroid dysfunction is known to influence metabolic homeostasis. Our findings reveal significant interactions between these indices and thyroid function, suggesting that adiposity and hepatic fat accumulation may modulate thyroid dysfunction in T2DM patients. These findings underscore the necessity for a holistic strategy in addressing metabolic health within this population, encompassing both adiposity and thyroid function.
Our results demonstrate that both VAI and FLI are strongly associated with key metabolic and anthropometric indicators, highlighting their potential as markers of metabolic dysfunction. The significant correlations observed between FLI and liver enzymes, such as ALT and AST, as well as lipid profiles, underscore the central role of fatty liver in metabolic syndrome. Similarly, VAI showed robust associations with metabolic parameters, including elevated liver enzymes, uric acid, and insulin resistance markers. In clinical applications, thresholds for VAI (> 32.55) and FLI (> 0.85) may be used to predict early diabetes screening. The results align with prior research identifying visceral adiposity and fatty liver as primary contributors to insulin resistance and metabolic disturbances.
The associations identified between the VAI and the FLI with multiple metabolic markers emphasize the importance of early detection and treatment of visceral fat accumulation and fatty liver. Such results indicate that addressing these conditions promptly could reduce the likelihood of metabolic complications in patients with T2DM.37,38 Central obesity, characterized by increased WC and BMI, was identified as a significant predictor of both VAI and FLI. This finding further emphasizes the need for targeted interventions aimed at addressing obesity in this patient population. Considering the significant link between central obesity and metabolic dysfunction, approaches including exercise, high-fiber dietary nutrition, and glucagon-like peptide 1 receptor (GLP-1RA) pharmacotherapy should be prioritized in the management of T2DM to diminish hospitalizations and reduce the economic burden of obesity-related complications.39–41 Prioritizing physical activity reduces immediate postprandial glucose and enhances metabolic flexibility through mitochondrial energy metabolism and insulin sensitization. Second, dietary interventions emphasizing high-quality fermentable fiber modulate the gut microbiota composition, thereby amplifying endogenous GLP-1 secretion via the intestinal L-cell–GLP-1 axis. Third, the low-cost, convenient route of administration and effective GLP-1RA (dulaglutide, semaglutide, extended-release exenatide and albiglutide) pharmaceutical offer multi-targeted regulation: suppressing feeding behavior through central appetite circuits, restoring glucose-dependent insulin secretion, inhibiting glucagon secretion, promoting weight loss via lipolysis activation, and conferring cardiorenal protection through anti-inflammatory and anti-atherogenic effects. Collectively, this combined strategy of interventions toward preventive economics shows that early investment in multimodal metabolic health preservation yields more than late-stage complication treatment.
The study also explored the potential links between VAI or FLI and thyroid function. While no significant associations were observed between VAI or FLI and thyroid hormone levels, such as T3, T4, FT3, and FT4, a trend towards elevated TSH levels with increasing FLI and VAI quartiles suggests a potential relationship between visceral adiposity, fatty liver, and subclinical hypothyroidism. This finding is particularly noteworthy given the regulatory role of thyroid hormones in metabolism and the known impact of thyroid dysfunction on insulin resistance and lipid profiles. Furthermore, during starvation or systemic inflammation, T3/T4 levels were suppressed with non-elevated or decreased TSH, reflecting abnormal negative feedback regulation of the hypothalamic-pituitary-thyroid (HPT) axis.42 Intriguingly, FT4/FT3 ratios revealed a positive correlation with diabetic kidney disease (DKD) and microalbuminuria progression, whereas TSH levels did not show a correlation in both analyses in T2DM patients and normal TH levels (P > 0.05).43 These discrepancies may originate from methodological heterogeneity, which includes population selection biases and incomplete adjustment for confounders. Secondly, metformin treatment induced TSH suppression via AMPK-dependent inhibition of hypothalamic TRH expression, potentially obscuring the relationships of VAI or FLI and thyroid hormone levels.44 Studies have shown that even in thyroid patients, there was no significant correlation between VAI and thyroid function tests and autoantibodies and thyroid volume, which is consistent with the findings of this study.45 Future prospective studies with serial thyroid function assessments and further expansion of the sample size may be needed to ensure study rigor.
The lack of significant changes in thyroid autoantibody levels, such as TGAb and TPO, indicates that the observed trends in thyroid function are unlikely to be driven by autoimmune thyroid disease. Instead, the potential link between VAI or FLI and thyroid function may reflect the broader metabolic derangements associated with visceral adiposity and fatty liver.
In conclusion, this research offers fresh perspectives on the interconnections between VAI, FLI, and thyroid function among patients with T2DM. The results underscore the significance of promptly detecting and addressing visceral fat accumulation and fatty liver to reduce metabolic hazards and suggest the broader involvement of thyroid function in metabolic syndrome.
Conclusion
In conclusion, this research highlights the significant impact of visceral adiposity and fatty liver on the metabolic disturbances seen in individuals with T2DM. The results emphasize the necessity for early identification and management of visceral fat accumulation and fatty liver to reduce metabolic risks and enhance clinical outcomes in this patient group.
Abbreviations
ALT, alanine aminotransferase; AST, aspartate aminotransferase; ATA, American Thyroid Association; BMI, body mass index; DKD, diabetic kidney disease; FBG, fasting blood glucose; FLI, fatty liver index; FT3, free triiodothyronine; FT4, free thyroxine; GLP-1RA, glucagon-like peptide 1 receptor; HbA1c, glycated hemoglobin; HC, hip circumference; HDL, high-density lipoprotein; HPT, hypothalamic-pituitary-thyroid; LDL, low-density lipoprotein; Q1, the first quartile; Q2, the second quartile; Q3, the third quartile; Q4, the fourth quartile; SBP, systolic blood pressure; T2DM, Type 2 Diabetes Mellitus; T3, triiodothyronine; T4, thyroxine; TG, triglycerides; TGAb, thyroglobulin autoantibody; TPO, thyroid peroxidase; TSH, thyroid-stimulating hormone; UA, uric acid; VAI, visceral adiposity index; WC, waist circumference; WHO, World Health Organization; WT, weight.
Data Sharing Statement
The experimental data used to support the findings of this study are available from the corresponding authors upon request.
Ethics Approval and Consent to Participate
This study was approved by the Ethics Committee of 903rd Hospital of the Joint Logistic Support Force of the Chinese People’s Liberation Army. Informed consent was obtained from all the participants. All methods were carried out in accordance with Declaration of Helsinki. All the authors confirming that written informed consent was obtained from all subjects and/or their legal guardian(s).
Consent to Publish Declaration
All the authors have confirmed that the subjects’ consent for publication has been obtained.
Author Contributions
Bojing Zheng and Tianxiao Hu Thy are the co-first authors, contributed equally to this work. All authors made a significant contribution to the work reported, whether that is in the conception, study design, execution, acquisition of data, analysis and interpretation, or in all these areas; took part in drafting, revising or critically reviewing the article; gave final approval of the version to be published; have agreed on the journal to which the article has been submitted; and agree to be accountable for all aspects of the work.
Funding
The present study was supported by grant from Key Project of Hangzhou Medical and Health Technology Plan (grant number ZD20220057) and The Natural Science Foundation of China (grant number 81701481).
Disclosure
The authors declared that they have no conflicts of interest regarding this work.
References
1. Sun M, Chen WM, Wu SY, Zhang J. Metformin in elderly type 2 diabetes mellitus: dose-dependent dementia risk reduction. Brain. 2024;147(4):1474–1482. doi:10.1093/brain/awad366
2. Baduini IR, Vildosola JEC, Kavehmoghaddam S, et al. Type 2 diabetes mellitus and neurodegenerative disorders: the mitochondrial connection. Pharmacol Res. 2024;209:107439. doi:10.1016/j.phrs.2024.107439
3. Ruan W, Zhou X, Li J, et al. Type 2 diabetes mellitus and cardiovascular health: evidence of causal relationships in a European ancestry population. ESC Heart Fail. 2024;11(5):3105–3119. doi:10.1002/ehf2.14877
4. Sattar N, Presslie C, Rutter MK, McGuire DK. Cardiovascular and Kidney Risks in Individuals With Type 2 Diabetes: contemporary Understanding With Greater Emphasis on Excess Adiposity. Diabetes Care. 2024;47(4):531–543. doi:10.2337/dci23-0041
5. Paik JM, Tesfaye H, Curhan GC, Zakoul H, Wexler DJ, Patorno E. Sodium-Glucose Cotransporter 2 Inhibitors and Nephrolithiasis Risk in Patients With Type 2 Diabetes. JAMA Intern Med. 2024;184(3):265–274. doi:10.1001/jamainternmed.2023.7660
6. Gregg EW, Chen H, Bancks MP, et al. Impact of remission from type 2 diabetes on long-term health outcomes: findings from the Look AHEAD study. Diabetologia. 2024;67(3):459–469. doi:10.1007/s00125-023-06048-6
7. Liang Y, Zhang X, Mei W, et al. Predicting vision-threatening diabetic retinopathy in patients with type 2 diabetes mellitus: systematic review, meta-analysis, and prospective validation study. J Glob Health. 2024;14:04192. doi:10.7189/jogh.14.04192
8. Eleftheriadou A, Riley D, Zhao SS, et al. Risk of diabetic retinopathy and diabetic macular oedema with sodium-glucose cotransporter 2 inhibitors and glucagon-like peptide 1 receptor agonists in type 2 diabetes: a real-world data study from a global federated database. Diabetologia. 2024;67(7):1271–1282. doi:10.1007/s00125-024-06132-5
9. Pedersen FN, Stokholm L, Andersen N, et al. Risk of Diabetic Retinopathy According to Subtype of Type 2 Diabetes. Diabetes. 2024;73(6):977–982. doi:10.2337/db24-0016
10. Younossi ZM, Golabi P, Price JK, et al. The Global Epidemiology of Nonalcoholic Fatty Liver Disease and Nonalcoholic Steatohepatitis Among Patients With Type 2 Diabetes. Clin Gastroenterol Hepatol. 2024;22(10):1999–2010.e8. doi:10.1016/j.cgh.2024.03.006
11. Ma XM, Geng K, Wang P, Jiang Z, Law BY, Xu Y. MCT4-dependent lactate transport: a novel mechanism for cardiac energy metabolism injury and inflammation in type 2 diabetes mellitus. Cardiovasc Diabetol. 2024;23(1):96. doi:10.1186/s12933-024-02178-2
12. Vaduganathan M, Filippatos G, Claggett BL, et al. Finerenone in heart failure and chronic kidney disease with type 2 diabetes: FINE-HEART pooled analysis of cardiovascular, kidney and mortality outcomes. Nat Med. 2024;30(12):3758–3764. doi:10.1038/s41591-024-03264-4
13. Zhou T, Chen S, Mao J, Zhu P, Yu X, Lin R. Association between obstructive sleep apnea and visceral adiposity index and lipid accumulation product: NHANES 2015–2018. Lipids Health Dis. 2024;23(1):100. doi:10.1186/s12944-024-02081-5
14. Kuang M, Yu Y, He S. Association between the age-adjusted visceral adiposity index (AVAI) and female infertility status: a cross-sectional analysis of the NHANES 2013–2018. Lipids Health Dis. 2024;23(1):314. doi:10.1186/s12944-024-02295-7
15. Yang Y, Li S, Ren Q, et al. The interaction between triglyceride-glucose index and visceral adiposity in cardiovascular disease risk: findings from a nationwide Chinese cohort. Cardiovasc Diabetol. 2024;23(1):427. doi:10.1186/s12933-024-02518-2
16. Chen Q, Hu P, Hou X, et al. Association between triglyceride-glucose related indices and mortality among individuals with non-alcoholic fatty liver disease or metabolic dysfunction-associated steatotic liver disease. Cardiovasc Diabetol. 2024;23(1):232. doi:10.1186/s12933-024-02343-7
17. Crudele L, De Matteis C, Novielli F, et al. Fatty Liver Index (FLI) is the best score to predict MASLD with 50% lower cut-off value in women than in men. Biol Sex Differ. 2024;15(1):43. doi:10.1186/s13293-024-00617-z
18. Jeong JH, Kim YG, Han KD, et al. Association of fatty liver index with sudden cardiac arrest in young adults. Metabolism. 2024;158:155981. doi:10.1016/j.metabol.2024.155981
19. Zhang F, Han Y, Wu Y, et al. Association between triglyceride glucose-body mass index and the staging of non-alcoholic steatohepatitis and fibrosis in patients with non-alcoholic fatty liver disease. Ann Med. 2024;56(1):2409342. doi:10.1080/07853890.2024.2409342
20. Zhuang J, Wang Y, Wang S, Hu R, Wu Y. Association between visceral adiposity index and infertility in reproductive-aged women in the United States. Sci Rep. 2024;14(1):14230. doi:10.1038/s41598-024-64849-0
21. Freitas R, Vasques ACJ, da Rocha Fernandes G, et al. Gut bacterial markers involved in association of dietary inflammatory index with visceral adiposity. Nutrition. 2024;122:112371. doi:10.1016/j.nut.2024.112371
22. Mashayekhi M, Sheng Q, Bailin SS, et al. The subcutaneous adipose transcriptome identifies a molecular signature of insulin resistance shared with visceral adipose. Obesity. 2024;32(8):1526–1540. doi:10.1002/oby.24064
23. Gaber M, Wilson AS, Millen AE, et al. Visceral adiposity in postmenopausal women is associated with a pro-inflammatory gut microbiome and immunogenic metabolic endotoxemia. Microbiome. 2024;12(1):192. doi:10.1186/s40168-024-01901-1
24. Torres-Arreola AK, García OP, Estrella-Ibarra P, et al. Zinc Transporter ZnT1 mRNA Expression Is Negatively Associated with Leptin Serum Concentrations but Is not Associated with Insulin Resistance or Inflammatory Markers in Visceral Adipose Tissue. Biol Trace Elem Res. 2024;202(12):5319–5327. doi:10.1007/s12011-024-04089-5
25. Rocha ALL, Baêta T, Nazareth IR, et al. The role of the visceral adiposity index in the assessment of metabolic syndrome of polycystic ovary syndrome patients: a new anthropometric index. Arch Gynecol Obstet. 2024;309(4):1643–1649. doi:10.1007/s00404-023-07328-7
26. Bolat MS, Bolat IA, Dündar C, Asci R. Which is better to predict erectile dysfunction and male sexual function in the context of metabolic syndrome: triglyceride-glucose index or visceral adiposity index?: a retrospective cross-sectional study. Int Urol Nephrol. 2024;56(9):2869–2876. doi:10.1007/s11255-024-04057-x
27. Ma XM, Li KX, Chen ZQ, Wu CM, Liao WZ, Guo XG. Impact of age, sex, and thyroid autoimmunity on the association between selenium intake and type 2 diabetes mellitus. BMC Public Health. 2024;24(1):743. doi:10.1186/s12889-024-18225-2
28. Lu W, Li S, Li Y, et al. Associations of sex-related and thyroid-related hormones with risk of metabolic dysfunction-associated fatty liver disease in T2DM patients. BMC Endocr Disord. 2024;24(1):84. doi:10.1186/s12902-024-01618-0
29. Hadgu R, Worede A, Ambachew S. Prevalence of thyroid dysfunction and associated factors among adult type 2 diabetes mellitus patients, 2000–2022: a systematic review and meta-analysis. Syst Rev. 2024;13(1):119. doi:10.1186/s13643-024-02527-y
30. Pavan Kumar J, A UM. Comparison of Thyroid Function Tests Among Type 2 Diabetes Patients With and Without Diabetic Nephropathy and Controls. Cureus. 2024;16(9):e70462. doi:10.7759/cureus.70462
31. Bi T. Relationship between thyroid hormone levels and metabolic dysfunction associated steatotic liver disease in patients with type 2 diabetes: a clinical study. Medicine. 2024;103(26):e38643. doi:10.1097/MD.0000000000038643
32. Zhao P, Li Q, Du T, Zhou Q. Association of different obesity indexes with diabetic kidney disease in patients with type 2 diabetes mellitus: a cross-sectional study. Sci Rep. 2024;14(1):21571. doi:10.1038/s41598-024-73106-3
33. Xue S, Ling J, Tian M, et al. Combined serum CTRP7 and CTRP15 levels as a novel biomarker for insulin resistance and type 2 diabetes mellitus. Heliyon. 2024;10(9):e30029. doi:10.1016/j.heliyon.2024.e30029
34. Niyazi A, Yasrebi SMA, Yazdanian M, Rahimi GRM. High-Intensity Interval Versus Moderate-Intensity Continuous Exercise Training on Glycemic Control, Beta Cell Function, and Aerobic Fitness in Women with Type 2 Diabetes. Biol Res Nurs. 2024;26(3):449–459. doi:10.1177/10998004241239330
35. Tang X, Shi R, Jiang L, et al. Additive effect of metabolic dysfunction-associated fatty liver disease on left ventricular function and global strain in type 2 diabetes mellitus patients: a 3.0 T cardiac magnetic resonance feature tracking study. Cardiovasc Diabetol. 2024;23(1):317. doi:10.1186/s12933-024-02410-z
36. Castera L, Garteiser P, Laouenan C, et al. Prospective head-to-head comparison of non-invasive scores for diagnosis of fibrotic MASH in patients with type 2 diabetes. J Hepatol. 2024;81(2):195–206. doi:10.1016/j.jhep.2024.03.023
37. Kakegawa T, Sugimoto K, Saito K, et al. Favorable liver and skeletal muscle changes in patients with MASLD and T2DM receiving glucagon-like peptide-1 receptor agonist: a prospective cohort study. Medicine. 2024;103(23):e38444. doi:10.1097/MD.0000000000038444
38. Mukherjee S, Mukherjee S, Kwok CS, Phillips A. Correlation between non-alcoholic fatty liver disease and metabolic parameters in persons with newly diagnosed type 2 diabetes mellitus. World J Hepatol. 2024;16(8):1120–1130. doi:10.4254/wjh.v16.i8.1120
39. Martiniakova M, Biro R, Penzes N, et al. Links among Obesity, Type 2 Diabetes Mellitus, and Osteoporosis: bone as a Target. Int J Mol Sci. 2024;25(9):4827. doi:10.3390/ijms25094827
40. Ansari S, Khoo B, Tan T. Targeting the incretin system in obesity and type 2 diabetes mellitus. Nat Rev Endocrinol. 2024;20(8):447–459. doi:10.1038/s41574-024-00979-9
41. Oh KK, Yoon SJ, Song SH, et al. The synchronized feature of Saururus chinensis and gut microbiota against T2DM, NAFLD, obesity and hypertension via integrated pharmacology. Artif Cells Nanomed Biotechnol. 2024;52(1):278–290. doi:10.1080/21691401.2024.2350475
42. Duntas LH, Orgiazzi J, Brabant G. The interface between thyroid and diabetes mellitus. Clin Endocrinol (Oxf). 2011;75(1):1–9. doi:10.1111/j.1365-2265.2011.04029.x
43. Zhao X, Sun J, Xin S, Zhang X. Predictive Effects of FT3/FT4 on Diabetic Kidney Disease: an Exploratory Study on Hospitalized Euthyroid Patients with T2DM in China. Biomedicines. 2023;11(8):2211. doi:10.3390/biomedicines11082211
44. Zhao H, Ma X, Shi S, et al. Association between FT4/FT3 ratio and microalbuminuria in euthyroid patients with type 2 diabetes mellitus. Sci Rep. 2025;15(1):7324. doi:10.1038/s41598-025-92046-0
45. Durcan E, Sahin S, Dedeoglu SE, Ozkaya HM, Gonen MS. Can “VAI” Better Indicate Metabolic Syndrome Compared with Other Metabolic Syndrome-Related Parameters in Patients with Thyroid Nodules? A Study from Turkey. Metab Syndr Relat Disord. 2021;19(6):358–366. doi:10.1089/met.2020.0147
 © 2025 The Author(s). This work is published and licensed by Dove Medical Press Limited. The
full terms of this license are available at https://www.dovepress.com/terms
and incorporate the Creative Commons Attribution
- Non Commercial (unported, 4.0) License.
By accessing the work you hereby accept the Terms. Non-commercial uses of the work are permitted
without any further permission from Dove Medical Press Limited, provided the work is properly
attributed. For permission for commercial use of this work, please see paragraphs 4.2 and 5 of our Terms.
© 2025 The Author(s). This work is published and licensed by Dove Medical Press Limited. The
full terms of this license are available at https://www.dovepress.com/terms
and incorporate the Creative Commons Attribution
- Non Commercial (unported, 4.0) License.
By accessing the work you hereby accept the Terms. Non-commercial uses of the work are permitted
without any further permission from Dove Medical Press Limited, provided the work is properly
attributed. For permission for commercial use of this work, please see paragraphs 4.2 and 5 of our Terms.
Recommended articles
Comparative Association of Basal and Basal-Prandial Insulin Regimens on Remnant Cholesterol and Lipid Profiles in Patients with Type 2 Diabetes Mellitus
Natsir RM, Halimah E, Diantini A, Levita J, Umar H
Diabetes, Metabolic Syndrome and Obesity 2026, 19:588522
Published Date: 12 March 2026