Back to Journals » Journal of Pain Research » Volume 13
A Step Towards a Better Understanding of Pain Phenotypes: Latent Class Analysis in Chronic Pain Patients Receiving Multimodal Inpatient Treatment
Authors Obbarius A ![]() , Fischer F
, Fischer F ![]() , Liegl G
, Liegl G ![]() , Obbarius N
, Obbarius N ![]() , van Bebber J
, van Bebber J ![]() , Hofmann T
, Hofmann T ![]() , Rose M
, Rose M
Received 13 July 2019
Accepted for publication 13 March 2020
Published 14 May 2020 Volume 2020:13 Pages 1023—1038
DOI https://doi.org/10.2147/JPR.S223092
Checked for plagiarism Yes
Review by Single anonymous peer review
Peer reviewer comments 2
Editor who approved publication: Dr Michael Schatman
Alexander Obbarius,1 Felix Fischer,1 Gregor Liegl,1 Nina Obbarius,1 Jan van Bebber,1 Tobias Hofmann,1 Matthias Rose1,2
1Department of Psychosomatic Medicine, Center for Internal Medicine and Dermatology, Charité – Universitätsmedizin Berlin, Berlin, Germany; 2Quantitative Health Sciences, Outcomes Measurement Science, University of Massachusetts Medical School, Worcester, MA, USA
Correspondence: Alexander Obbarius
Department of Psychosomatic Medicine, Center for Internal Medicine and Dermatology, Charité – Universitätsmedizin Berlin, Charitéplatz 1, 10117 Berlin, Germany
Tel +4930450653890
Email [email protected]
Purpose: The number of non-responders to treatment among patients with chronic pain (CP) is high, although intensive multimodal treatment is broadly accessible. One reason is the large variability in manifestations of CP. To facilitate the development of tailored treatment approaches, phenotypes of CP must be identified. In this study, we aim to identify subgroups in patients with CP based on several aspects of self-reported health.
Patients and Methods: A latent class analysis (LCA) was carried out in retrospective data from 411 patients with CP of different origins. All patients experienced severe physical and psychosocial consequences and were therefore undergoing multimodal inpatient pain treatment. Self-reported measures of pain (visual analogue scales for pain intensity, frequency, and impairment; Pain Perception Scale), emotional distress (Patient Health Questionnaire, PHQ-9; Generalized Anxiety Disorder Scale, GAD-7) and physical health (Short Form Health Survey; SF-8) were collected immediately after admission and before discharge. Instruments assessed at admission were used as input to the LCA. Resulting classes were compared in terms of patient characteristics and treatment outcome.
Results: A model with four latent classes demonstrated the best model fit and interpretability. Classes 1 to 4 included patients with high (54.7%), extreme (17.0%), moderate (15.6%), and low (12.7%) pain burden, respectively. Patients in class 4 showed high levels of emotional distress, whereas emotional distress in the other classes corresponded to the levels of pain burden. While pain as well as physical and mental health improved in class 1, only the levels of depression and anxiety improved in patients in the other groups during multimodal treatment.
Conclusion: The specific needs of these subgroups should be taken into account when developing individualized treatment programs. However, the retrospective design limits the significance of the results and replication in prospective studies is desirable.
Keywords: chronic pain, phenotyping, patient-reported outcomes, latent class analysis, multimodal treatment
Introduction
Chronic pain (CP) has growing medical, social, and economic impact worldwide.1–3 Approximately 20% of the European adult population is suffering from chronic pain of moderate to extreme intensity, seriously affecting patients’ quality of life4 and leading to severe consequences such as disability and opioid abuse.5,6 In addition, many patients show comorbidities such as depression, anxiety, or enduring personality changes due to CP which may complicate treatment.7–9 The processes underlying the development, prognosis, and treatment of CP are of a complex nature. In many cases, it is not possible to distinguish between biological and psychosocial mechanisms underlying the development and persistence of chronic pain.10 Therefore, the biopsychosocial model for understanding and treating CP is very common, as it focuses equally on the physical and psychosocial aspects of pain.11 Based on this model, patients are frequently treated within a “multimodal” setting where experts from different specialties work together to treat physical as well as psychological and social aspects of CP.12 Several studies have shown that patients suffering from chronic pain respond very differently to multimodal treatments.12 However, relatively little is known about specific subgroups of chronic pain patients and why they respond differently to treatments.13 If one could identify and characterize subgroups among CP patients that do or do not benefit from multimodal treatment, or even deteriorate, this knowledge could be used to design tailored multimodal treatments for specific groups of CP patients.
Patients with similar pain syndromes respond very differently to treatment. Clinical trials in different pain syndromes such as post-herpetic neuralgia, fibromyalgia, and osteoarthritis found that there is more variability in treatment responses between individuals than between pain syndromes.14–16 Different pain mechanisms may be active to varying degrees in patients, and these mechanisms may partly depend on patient characteristics, leading to interpatient variation in treatment effects.13 These findings suggest that there may be different subgroups (“phenotypes”) among patients with pain syndromes, and, that these phenotypes may be similar across different pain syndromes.13
A growing body of literature supports the assumption that specific subgroups exist in patients with pain syndromes. Previous studies have found two to nine subgroups in chronic pain patients.17–29 Among the existing literature, a series of studies based on the Swedish Quality Registry for Pain Rehabilitation (SQRP) is of particular importance due to the representativeness and scale of samples used.17–19 These studies were based on a wide range of patient-reported outcome (PRO) measures from patients who were about to participate in 4–8-week outpatient interdisciplinary multimodal pain rehabilitation programs. Baseline PROs were used as input variables to a principal component analysis which was followed by a hierarchical cluster analysis. One study in more than 35,000 CP patients found two subgroups, one group with higher average ratings of pain variables and psychosocial variables and one group with lower average ratings of these variables.18 Another study in almost 15,000 CP patients undergoing interdisciplinary multimodal pain rehabilitation programs identified three subgroups with patients in best, intermediate and worst clinical situations based on pain and psychosocial measures at baseline. Whereas patients in the worst situation deteriorated throughout treatment, patients in best and intermediate situations demonstrated improvements in outcomes.17
The existing literature on pain phenotyping shows some shortcomings that should be addressed. First, most studies have focused on specific pain conditions such as fibromyalgia,26,27 low back pain,21,28 osteoarthritis,29 neuropathic pain,16 or pelvic pain;23 however, only a minority of the studies aimed to identify subgroups in a broader population of chronic pain,17–19,22,24,25 although theoretical considerations (i.e., biopsychosocial model) and the resulting treatment recommendations (i.e., multimodal treatment) implicitly expect chronic pain to be similar across many syndromes and patients.11,30 Furthermore, studies carried out in the same CP patient population are not easily comparable due to the use of different subgrouping methods and choice of input variables. In earlier studies, cluster analysis was most often used to identify subgroups. Although latent class analysis (LCA) offers some advantages in subgroup identification, this method is not yet widely used. For example, latent class analysis permits the modelling of an underlying “latent” structure. This allows a detailed comparison of different models based on goodness-of-fit statistics.31–33 Third, in studies of the same pain syndromes, different types of variables were used to establish subgroups.13 The most frequently used variables for statistical subgrouping were PRO measures, findings from physical examination (i.e., pain locations),34 and diagnostic or experimental results (e.g., pain sensitivity ratings).13,15 These types of variables reflect very different aspects of individuals’ pain experience, which further complicates the comparability of findings. Fourth, the Initiative on Methods, Measurement, and Pain Assessment in Clinical Trials (IMMPACT) recently recommended measures to be included in any pain phenotyping study. In addition to the inclusion of other pain instruments, the need to include mental health measures was emphasized.13 The close relation between chronic pain and mental conditions such as depression or anxiety is also in accordance with available empirical evidence and widely recognized in the field.11,35 However, until now, many studies that aimed to identify subgroups of pain patients did not include measures for depression and anxiety as input variables.
Taken together, existing studies that aimed to identify subgroups in heterogeneous CP samples did either not use PROs as input measures,22 included only very specific domains24 or did not use latent class analysis.17–19,22,24,25 Therefore, we try to address some of these aspects by using latent class analysis to identify subgroups in a sample of CP patients that is different from the samples used in previous subgrouping studies. The sample includes patients with CP of different origin and manifestation who received multimodal inpatient treatment due to severe physical and psychosocial consequences. We chose a range of baseline PRO measures as input to the subgrouping analysis that reflects physical and psychological aspects of pain including depression and anxiety. Our specific aims are 1) to identify latent classes based on baseline PRO measures of CP patients undergoing multimodal inpatient treatment, 2) to compare latent classes in terms of demographic and clinical background characteristics, and, 3) to evaluate differences in changes during treatment between latent classes.
Methods
Setting, Sample, and Data Assessment
A retrospective analysis in clinical routine data was carried out in patients with chronic pain undergoing multimodal inpatient treatment at the Department for Psychosomatic Medicine at Charité – Universitätsmedizin Berlin, Germany. The data were assessed electronically on the day after admission and on the day before discharge between January 2011 and December 2014. In rare cases, for example, if technical issues occurred, the assessments were deferred to the following day. All datasets from patients with age ≥18 who underwent multimodal treatment for their chronic pain were included. To receive multimodal treatment for their pain, in line with the guidelines by the German public insurance,36 patients had to suffer from persistent pain (duration > 6 months) with severe physical, psychological and/or social consequences (with or without an underlying persistent somatic condition). Furthermore, they had to fulfill at least three of the following five criteria: 1) the pain affects the quality of life and/or the ability to work; 2) a previous unimodal treatment (e.g., medication) or surgery was not successful; 3) dependency on pain medication; 4) mental comorbidity; 5) severe somatic comorbidity.36
During multimodal inpatient treatment, all patients received regular medical visits, consultations with pain specialists, psychological treatment (individual and group setting), art therapy, music therapy, progressive muscle relaxation, and exercise including physiotherapy and aqua gym.30 Cases were excluded, if data were missing on entire scales (e.g., due to the change of assessment battery for organizational reasons) that had been chosen for the statistical subgrouping.
The study was approved by the Charité’s Ethics Committee. Due to the secondary analysis in routine data, patient consent to review and obtain data from their medical records was not required. The data were handled in accordance with the General Data Protection Regulation (GDPR) of the European Union. The study was carried out in compliance with the Declaration of Helsinki.
Indicators for Statistical Subgrouping
Selection of Instruments
As PRO measures reflect patients’ individual pain perception and may, therefore, enlighten mechanisms determining inter-individual differences in response to pain treatment,13 PRO measures were used as the basis for phenotyping instead of blood values, imaging results, or medication intake.13 However, due to the retrospective design of the current study, the number of options was limited and we have tried to find the best possible compromise between current recommendations13 and existing data. We combined different aspects of pain perception (intensity, frequency, impairment, sensory and affective pain perception) with indicators of emotional functioning (depression, anxiety) and physical health as input measures for the LCA.
Input Instruments
- Pain intensity, frequency, and impairment (visual analogue scales, VAS): The patients were asked to place a cursor on a scale between “0” (= “no pain”/“no impairment”/“never”), and “10” (= “intolerable pain”/“great impairment”/“permanent pain”) according to their currently perceived pain. The intensity VAS has been shown to be a reliable and valid measures in many studies.37 Although there are no validation studies for frequency and impairment scales, VAS has been adapted for many other patient-reported symptoms and those have generally demonstrated satisfactory validity (for example38).
- Pain Perception Scale (PPS): This instrument assesses pain perception with 24 items. The content of each item is rated from `Not true` (1) to `Entirely true` (4). Two main scales allow the differentiation between affective characterization (14 items, score range 14 to 56; example item: “I feel my pain is unbearable.”) and modes of sensory characterization (10 items, score range 10 to 40; example item: “I feel my pain as cutting.”) of pain. Higher scale scores correspond to higher degrees of affective and/or sensory characterization, respectively. Psychometric properties including reliabilities for the affective characterization (Cronbach’s α = 0.93) and sensory characterization (α = 0.85) subscales as well as the test-retest-reliability (rr = 0.95) were satisfactory.39
- Patient Health Questionnaire 9-item (PHQ-9): This 9-item instrument is used in many settings to screen for the presence and severity of depressive symptoms. Because each of the 9 items is scored from `Not at all` (0) to `Nearly every day` (3), scale scores range from 0 to 27. Higher scores indicate higher severity of depression. A PHQ-9 score ≥10 has a sensitivity of 88% and a specificity of 88% for major depression. The instrument has shown sufficient reliability (α = 0.89 to 0.86 depending on the study) and test-retest-reliability (rr = 0.84).40
- Generalized Anxiety Disorder 7-item (GAD-7): This 7-item instrument is broadly used to screen for the presence and severity of anxiety. Because each of the 7 items is scored from 0 “not at all” to 3 “nearly every day”, the GAD-7 scale score ranges from 0 to 21. Higher scores indicate higher severity of anxiety. A GAD-7 score of ≥10 has a sensitivity of 89% and a specificity of 82% for a generalized anxiety disorder. The instrument has shown sufficient reliability (α = 0.92) and test-retest-reliability (rr = 0.83).41
- Short Form Health Survey 8-item (SF-8): This instrument is the brief version of the SF-36, designed to assess general health related quality of life. For the LCA, the physical component score (PCS) is used as an indicator reflecting physical health. The PCS includes 4 items (general health, bodily pain, role-physical, and physical functioning). T-scores with a general population mean of 50 and standard deviation of 10 are reported. Higher values indicate better health. Psychometric properties including reliabilities for the full instrument (α = 0.70 to 0.88 depending on the study) and the PCS (α = 0.88) as well as the test-retest-reliabilities for the full instrument (rr = 0.59 to 0.70 depending on the study) and the PCS (rr = 0.73) were satisfactory.42
Additional Instruments and Characteristics for Description of Latent Classes
Perceived Available Support (PAS): This is one of the subscales from the Berlin Social Support Scales (BSSS) which allows the assessment of emotional (example item: “When I’m sad, there are people who cheer me up.”) and instrumental social support (example item: “There are people who offer their help when I need it.”). Each item is scored from 1 “not true” to 4 “totally true”. The scores for each 4-item subscale range between 4 (low social support) and 16 (high social support). The reliability was sufficient (α = 0.83).43
Patient characteristics: Patients’ partnership status, level of education, work status, prior psychological treatment, prior psychosomatic inpatient treatment, frequency of intake of pain medication, and number of consultations during the last 6 months were assessed at baseline.
Comorbidity and multimorbidity: Comorbid diagnoses and multimorbidity (i.e., number of diagnoses including pain disorder) were obtained from discharge letters (“clinician-reported”). Note that the number of clinician-reported diagnoses is a common measure of multimorbidity.44
Analysis Strategy
Data Preparation
All patient-reported data were obtained from the department’s data repository. Overall, N=638 patients with CP were identified. Due to missing data on entire instruments at admission, 227 cases were excluded. The final dataset included N=411 patients. To evaluate whether the exclusion of cases would bias the LCA results, a sensitivity analysis was carried out. We conducted T-Tests and Wilcoxon–Mann–Whitney tests (for non-parametric data) to compare included and excluded records in terms of demographic and clinical background characteristics and baseline pain scores (all 638 patients completed pain intensity, frequency and impairment scales).
Statistical Subgrouping
To identify underlying latent classes in the sample of patients with CP, a LCA was conducted.45 The number of latent classes to be retained was determined based on established criteria including statistical performance measures and pragmatic evaluation.45–47 As there is no single standard statistic to evaluate goodness of fit of a latent class model, several fit indices were considered: For absolute model fit the likelihood-ratio statistic (G2) was calculated. With higher values the probability that the null hypothesis (= no subgroups exist) can be rejected increases. For comparison models that postulate the existence of different number of latent classes, the following indices expressing relative model fit were used: The Akaike information criterion (AIC), the consistent Akaike information criterion (cAIC), and the Bayesian information criterion (BIC). The lower the value of the information criterion, the better the model fits. These indices take parsimony into account which is a principal stating that, if models are compared, all else being equal, simpler models (with fewer parameters) are preferred to more complex models.45 The BIC tends to select simpler models than the AIC, and in a Monte Carlo simulation, it has been shown to be the most reliable criterion when deciding on the optimal latent class model47 which is why we primarily used the BIC (supported by the other criteria) to determine the number of latent classes. In addition, the maximum log likelihood and conditional bootstrap likelihood ratio test (BLRT) were used to determine if the model fit could be improved, if classes were added.48 Pragmatic evaluation included the minimum average posterior probability of cluster membership (>0.7), interpretability (classes are clearly distinguishable), and parsimony (each class has a sufficient sample size for further analysis; n≥50).31
Profiles for Each Class
After determining the optimal number of latent classes, in order to profile the emergent latent classes, CP patients were assigned to the latent class for which they had the highest likelihood of belonging. Post hoc descriptive statistics were calculated to create profiles including demographic, medical and psychosocial aspects for each class. To compare characteristics between classes, one-way analysis of variance (ANOVA) was used for interval and ratio scales and Kruskal–Wallis test was used for nominal and ordinal scales. Eta2 (η2) was used to illustrate effect sizes for significant results. η2≥0.01, ≥0.06, ≥0.14 were regarded as small, medium, and large effects, respectively. To adjust for multiple comparisons in post hoc analyses, Tukey–Kramer adjustment was used for interval and ratio scales. To calculate post hoc differences for ordinal scales, multiple Wilcoxon–Mann–Whitney tests were conducted. In addition, to evaluate whether trajectories of change throughout treatment are different between classes, changes were compared for each input instrument. Due to missing data at discharge, a repeated measures analysis of variance (RM-ANOVA) in a linear mixed model framework was used which allows to account for missing data by maximum likelihood (ML) estimation. In addition, changes of input instrument scores within classes during treatment were captured by subtracting Least-square (LS) means (as resulting from RM-ANOVA) from admission and discharge scores. Paired T-Tests were then performed to evaluate significant differences. Tukey–Kramer adjustment was used to account for multiple comparisons.
Statistical analyses were conducted with SAS® 9.4 (Cary, NC, USA) and R 3.4.2,49 R-packages poLCA50 and ggplot251 were used for LCA and figures, respectively.
Results
Sample Description and Sensitivity Analyses
A sample of N=411 patients with CP was analyzed. The mean age was 49.5 years, and 66.7% were female. Twenty-four percent did have a university entrance diploma and 7% did not have any educational qualification. Approximately 50% were currently working, 20% were seeking employment, and 24% were unable to work. Patients showed high comorbidity, mean number of diagnoses was 6.8. More than 50% had prior psychological treatment and over 60% took pain medication at least four times a week. Detailed sample characteristics are provided in (Table 1). The comparison of excluded (n=227) and included (n=411) cases for the LCA revealed that excluded patients were approximately 4 years older (Mexcluded=54, SDexcluded=14 years; Mincluded=50, SDincluded=13 years; p<0.01), had longer inpatient stays (Mexcluded=21, SDexcluded=13 days; Mincluded=17, SDincluded=9 days; p<0.01), and showed slightly lower pain impairment at baseline (Mexcluded=5.4, SDexcluded=3.4; Mincluded=5.8, SDincluded=3.1; p<0.05). There were no significant differences on other sociodemographic or clinical variables.
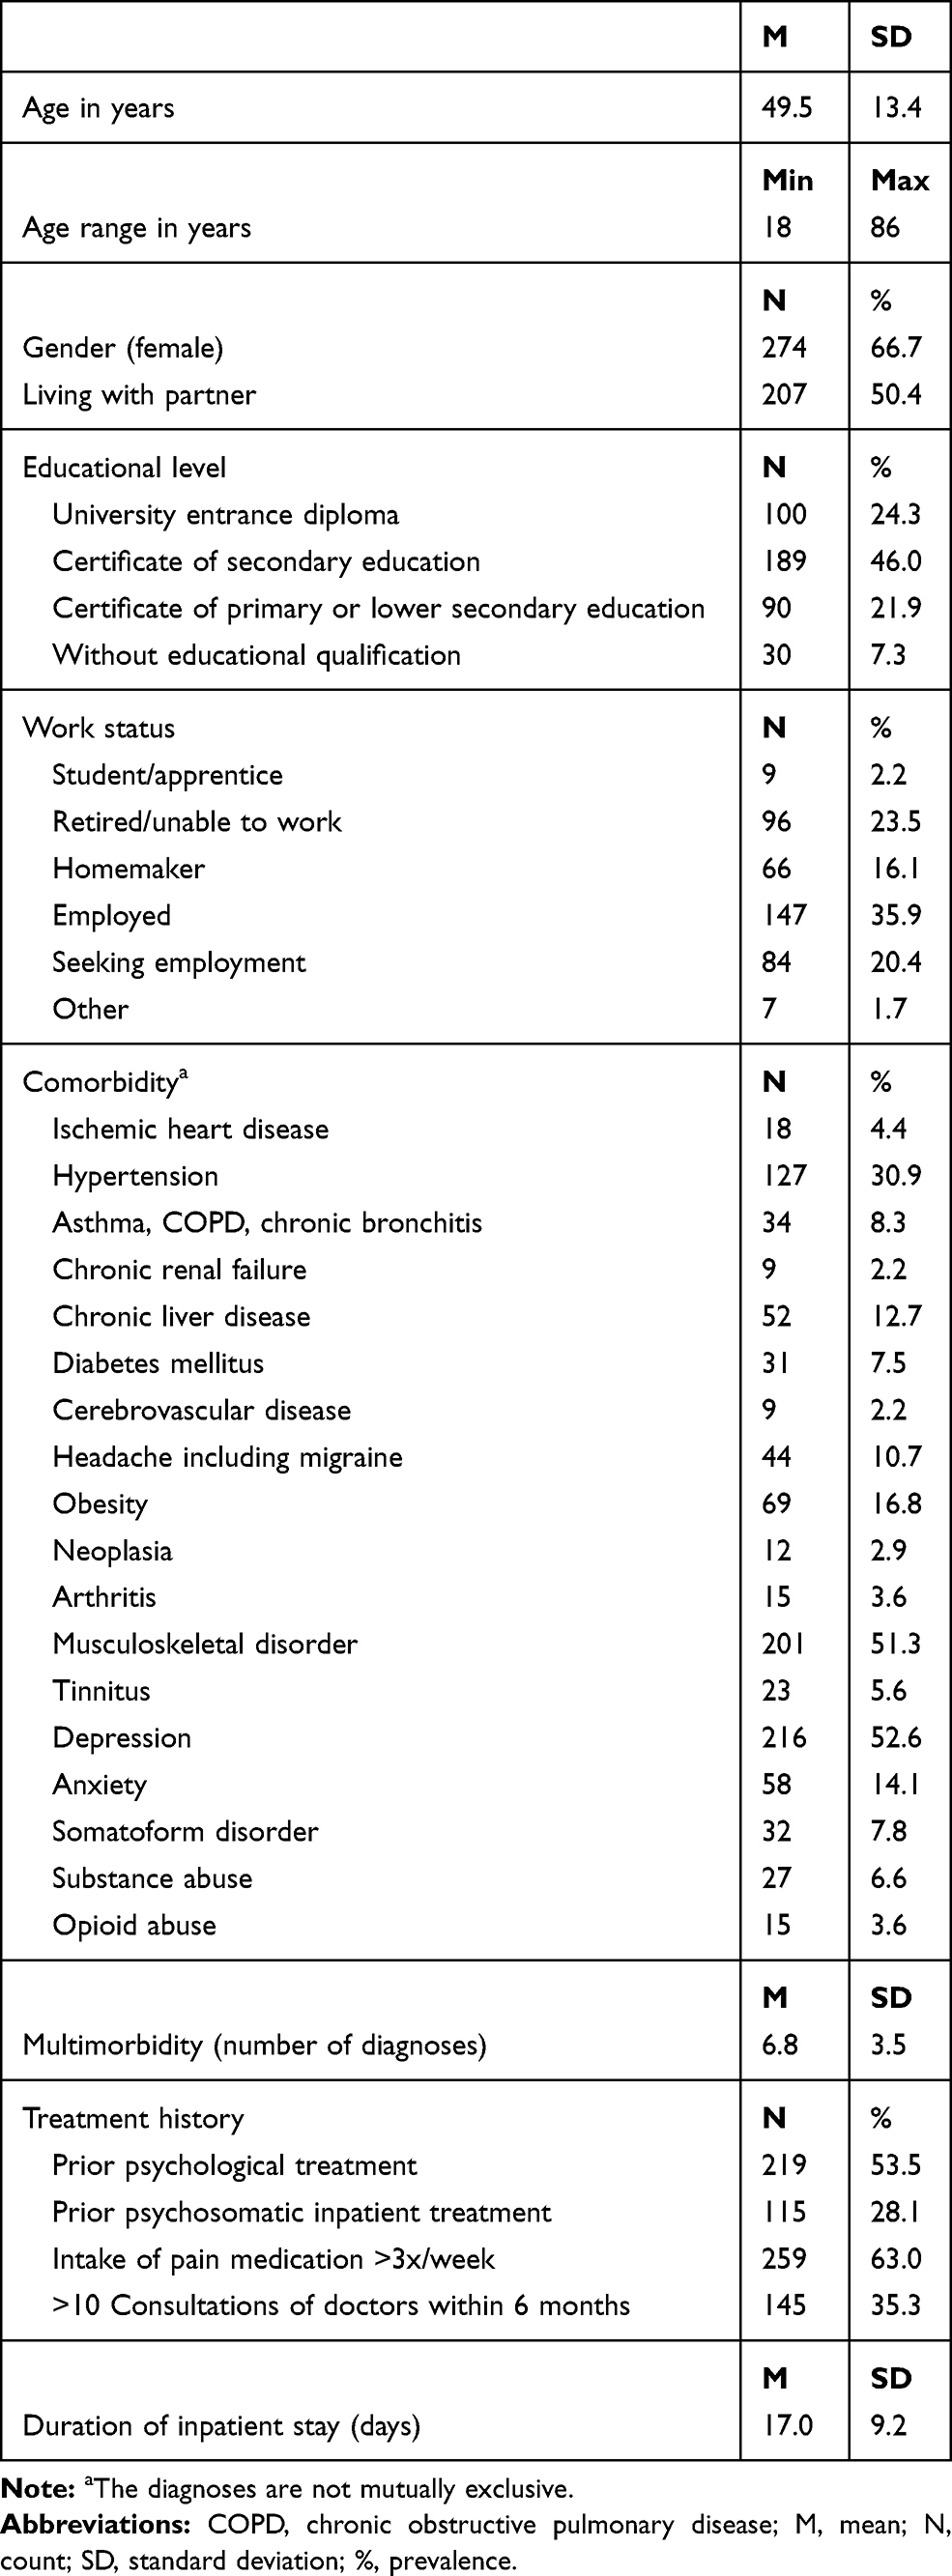 |
Table 1 Demographic and Clinical Background of Chronic Pain Patients (N=411) |
Determining the Number of Latent Classes
The fit statistics for the two to ten class models are provided in (Table 2). Absolute model goodness-of-fit statistic G2 showed high values and the null-hypothesis of exact fit was hence rejected for all tested models. The BIC and cAIC suggested best model-fit for a model with four classes. The BLRT indicated that models with up to 9 classes were tenable as each model with k classes showed significant improvement in model fit compared to the less complex model with k-1 classes. Pragmatic evaluation of the four-class model demonstrated satisfactory values for the average posterior probabilities of cluster membership (C1: MC1=0.96, SDC1=0.09; MC2=0.92, SDC2=0.14; MC3=0.92 SDC3=0.13; MC4=0.99, SDC4=0.04). In addition, sample sizes of groups were sufficient as the smallest class still contained 52 patients. Furthermore, in subsequent analyses, the four latent classes showed clear differences in terms of input measures and other variables used for profiling (see below).
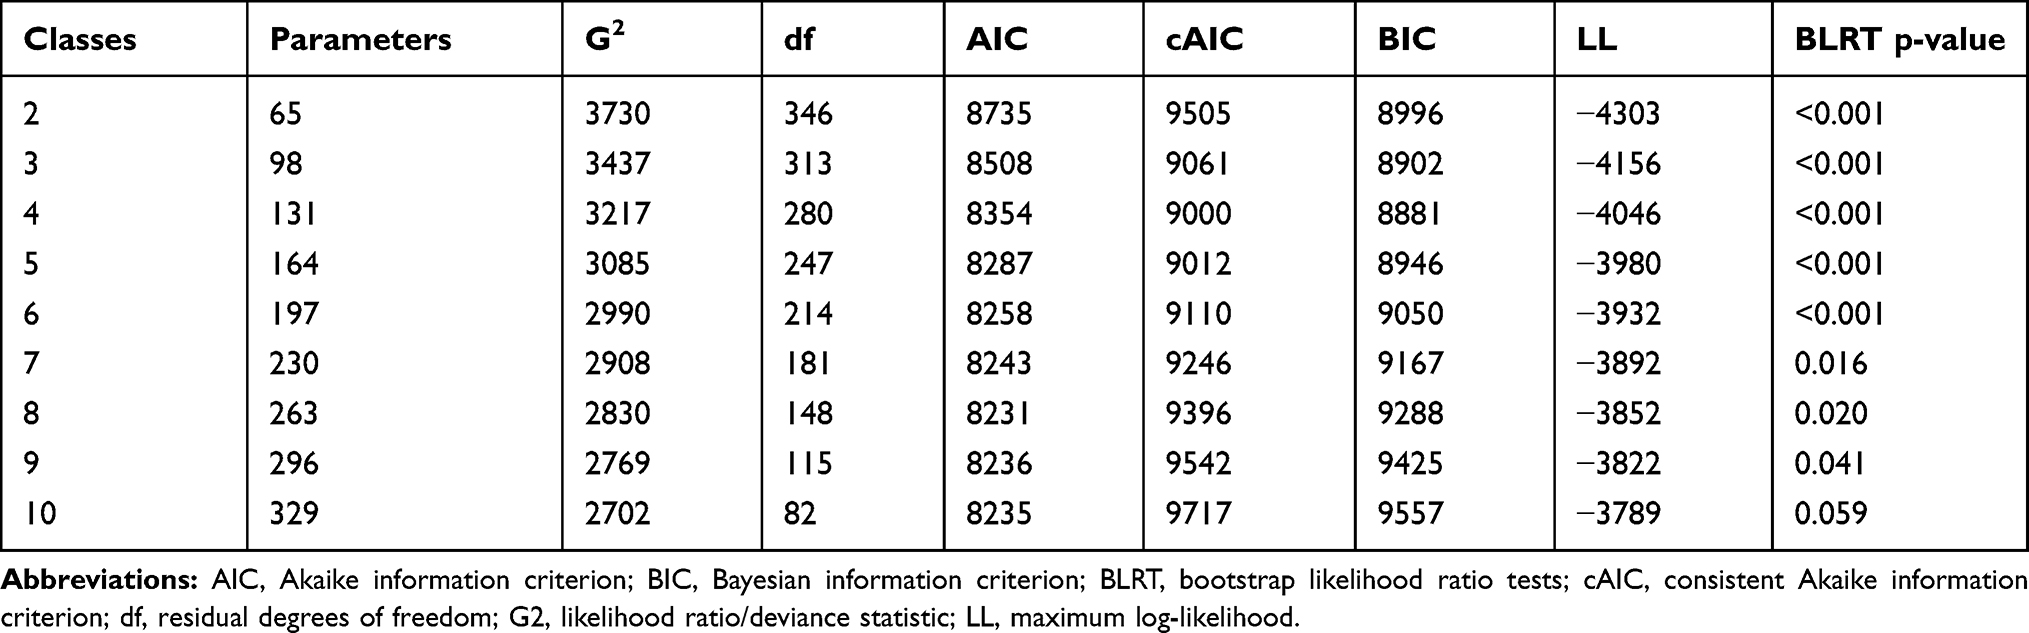 |
Table 2 Fit Statistics and Information Criteria for the 2 to 10-Class Model |
Differences in Pain Characteristics, and in Emotional and Physical Health Across Latent Classes
In (Figure 1), we graphically depict the average scale scores of input measures across the four latent classes. Scales were standardized to facilitate interpretation. A summary of probabilities, labels and descriptions of latent classes is given in (Table 3). Instrument scores and patient characteristics across classes are presented in (Table 4).
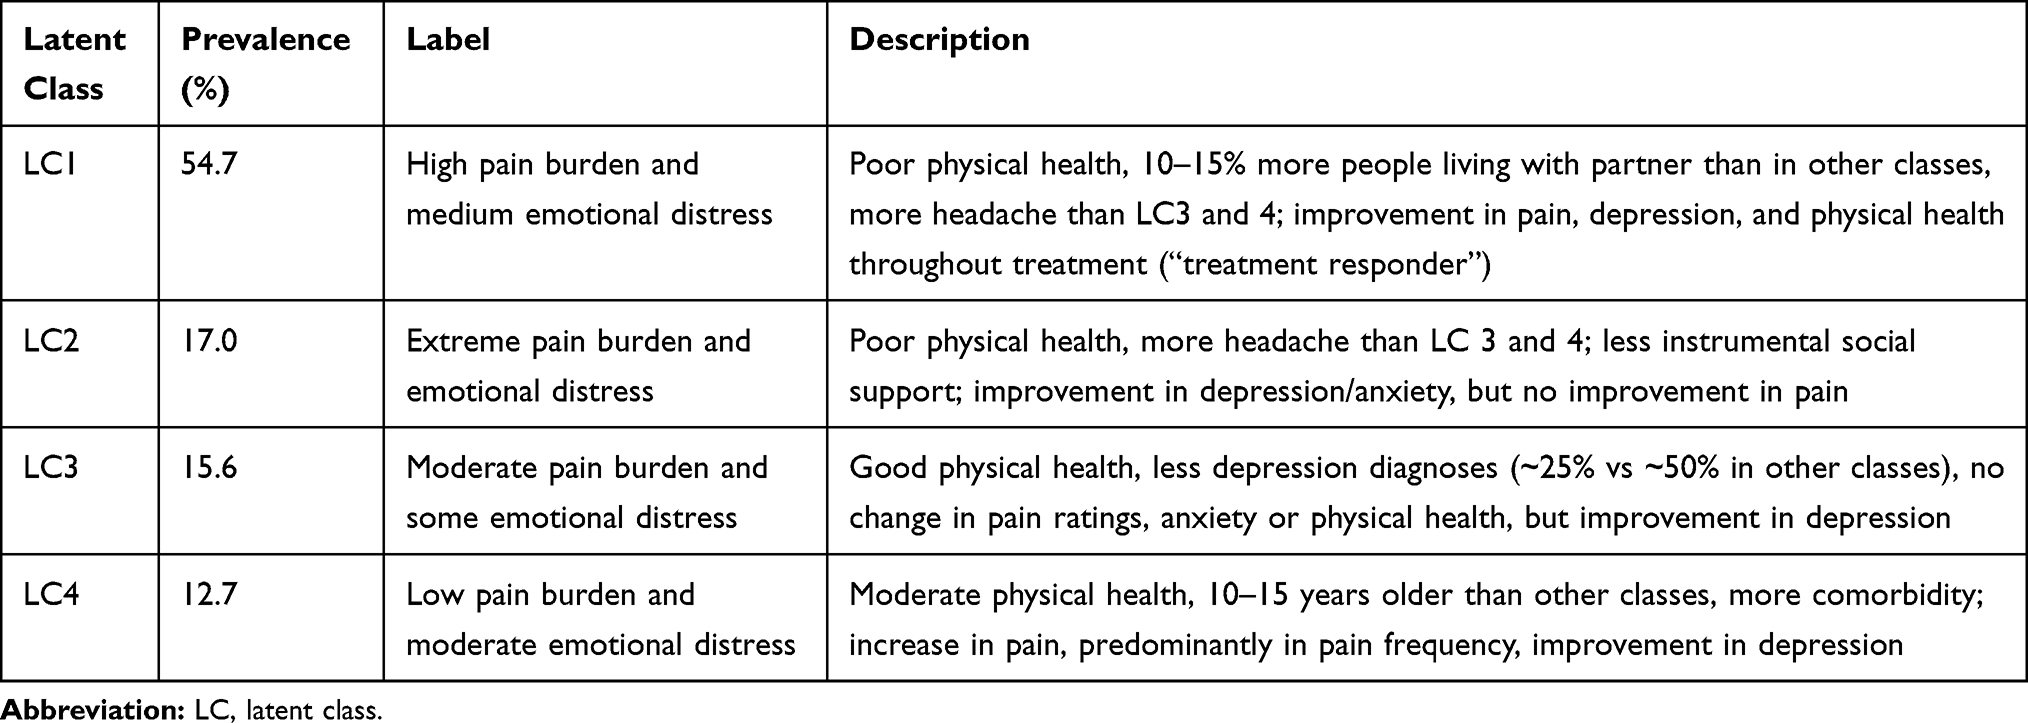 |
Table 3 Prevalence and Summary of the Classes in Chronic Pain Patients |
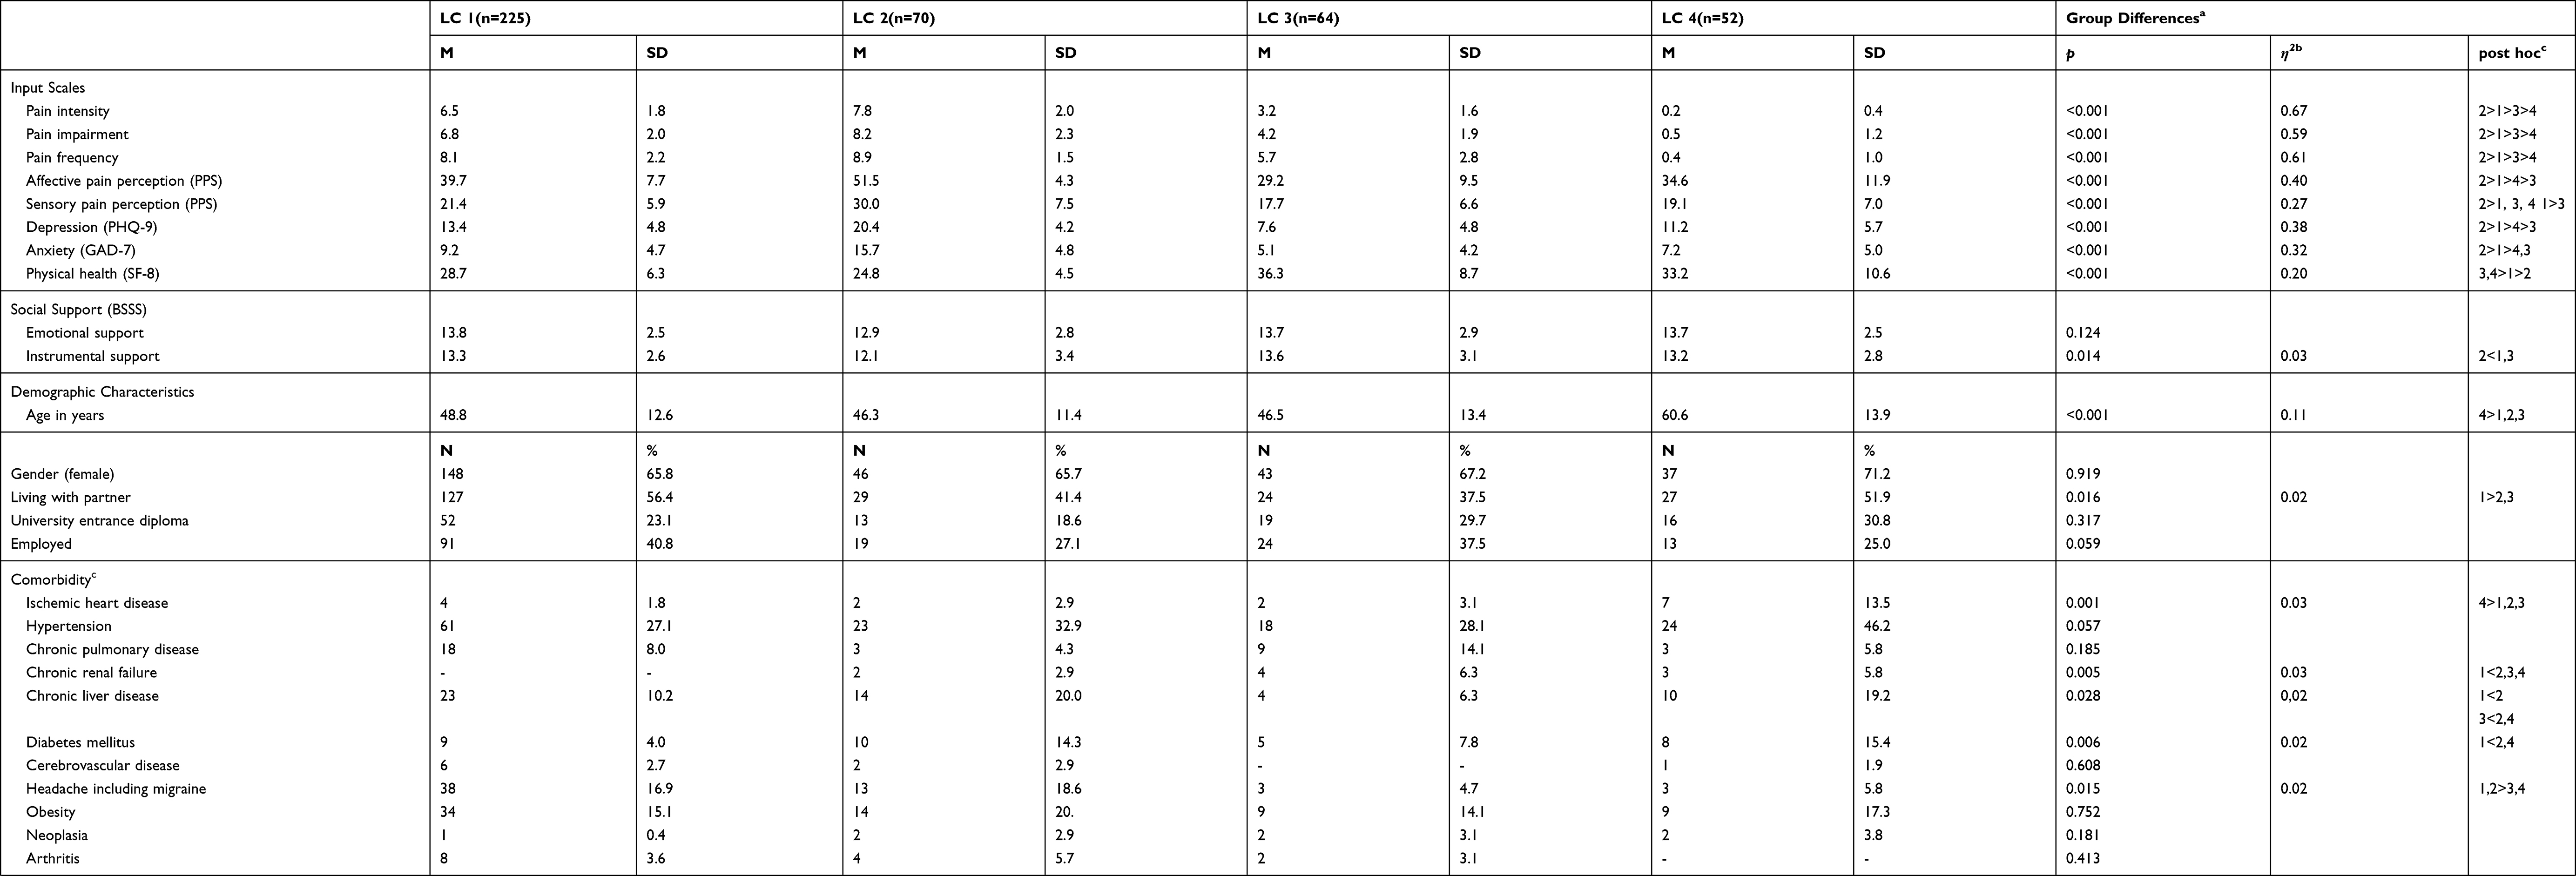 |
Table 4 Group Sizes and Differences in Four Latent Classes of Chronic Pain Patients |
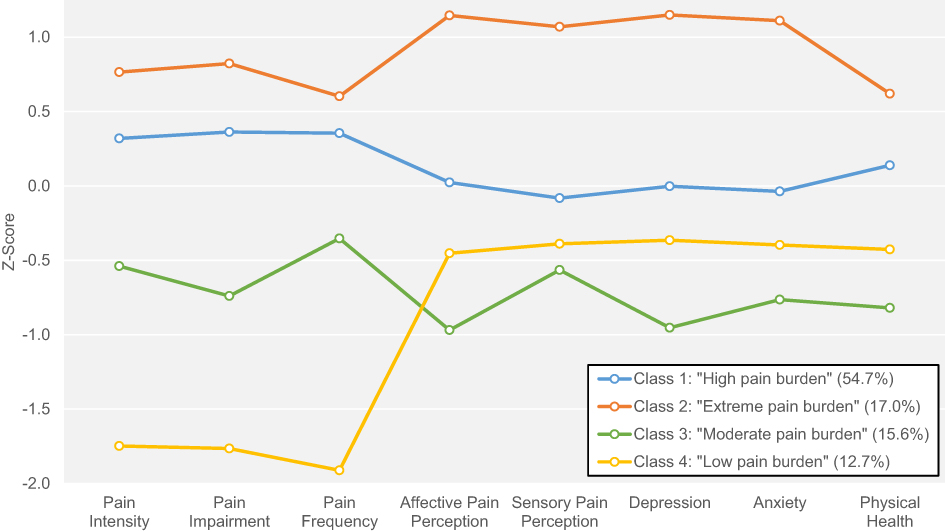 |
Figure 1 Latent class-specific profiles of pain characteristics and emotional and physical functioning. The means of standardized indicator variables (Z-scores, mean = 0, standard deviation = 1) in each latent class are depicted. Higher z-scores correspond to less favorable values (i.e., high pain, high depression, low physical health), whereas lower z-scores correspond to more favorable values. Sizes of latent classes are provided in parentheses in the legend. |
Class 1 was the largest group (54.7%) patients in this group had high to very high levels of pain intensity (M=6.5, SD=1.8), impairment (M=6.8, SD=2.0), and frequency (M=8.1, SD=2.2), medium affective pain perception (M=39.7, SD=7.7) and medium to low sensory pain perception (M=21.4, SD=5.9). Levels of depression (M=13.4, SD=4.8) and anxiety (M=9.2, SD=4.7) were moderate, and these patients reported poor physical health (M=28.7, SD=6.3). Thus, this class was labeled “High pain burden and medium emotional distress”.
Patients in class 2 (17.0%) had the highest pain intensity (M=7.8, SD=2.0), impairment (M=8.2, SD=2.3), and frequency (M=8.9, SD=1.5). In addition, the patients in class 2 demonstrated high levels of affective pain perception (M=51.5, SD=4.3), sensory pain perception (M=30.0, SD=7.5), levels of depression (M=20.4, SD=4.2) and they had the lowest physical health status (M=24.8, SD=4.5). Therefore, class 2 was labelled “Extreme pain burden and emotional distress”.
Pain levels in class 3 (15.6%) were lower than in classes 1 and 2. While pain intensity (M=3.2, SD=1.6) and impairment (M=4.2, SD=1.9) were relatively low, pain frequency (M=5.7, SD=2.8) was notably larger. Thus, those patients seemed to experience pain of lower levels relatively frequent. Affective pain perception (M=29.2, SD=9.5) and sensory pain perception (M=17.7, SD=6.6), and levels of depression (M=7.6, SD=4.8) and anxiety (M=5.1, SD=4.2) were the lowest compared to the other classes. Physical health (M=36.3, SD=8.7) was better than in classes 1 and 2, and not different from class 4. Class 3 was labelled “Moderate pain burden and some emotional distress”.
Patients in class 4 (12.7%) did report very low levels of pain intensity (M=0.2, SD=0.4), impairment (M=0.5, SD=1.2), and frequency (M=0.4, SD=1.0). While the standardized scale scores of all input instruments in the other classes were similar within each class, pain scores in class 4 were markedly lower than the other instrument scores (Figure 1). In addition, the levels of pain perception, depression, anxiety and physical health exceeded those in the class with the next highest pain levels (class 3). Patients in class 4 demonstrated high affective pain perception (M=34.4, SD=11.9) and medium to low sensory pain perception (M=19.1, SD=7.0). In addition, levels of depression (M=11.2, SD=5.7) and anxiety (M=7.2, SD=5.0) were moderate. Compared to class 1 and 2, physical health was higher (M=33.2, SD=10.6). Class 4 was labelled “Low pain burden and moderate emotional distress”. (Figure 1, Tables 3 and 4)
Differences in Social Support, Sociodemographic Background, Comorbidities, and Clinical Characteristics Across Latent Classes
Detailed differences are shown in Table 4 and findings are summarized below:
Social Support
We did not find differences in emotional social support between classes, but mean levels of instrumental social support were significantly (p=0.014) different across latent classes. In particular, patients in class 2 reported significantly lower levels of instrumental social support than patients in classes 1 and 3.
Sociodemographic Variables
Patients in class 4 were on average 10 to 15 years older than patients in the other classes (p<0.001). Class 1 had the highest proportion of patients living with a partner (56.4%), which was significantly higher than in classes 2 and 3 (41.4% and 37.5%, respectively, p=0.016).
Comorbidity and Multimorbidity
The proportion of patients with a clinician-reported diagnosis of depression was between 50% and 63% in classes 1.2, and 4, which was significantly higher than in class 3 (26%, p<0.001). A diagnosis of headache was more prevalent in classes 1 and 2 (17% and 19%, respectively) than in classes 3 and 4 (5% and 6%, respectively; p=0.015). Prevalences of comorbidities that are usually associated with higher age, such as ischemic heart disease, chronic liver disease, or diabetes mellitus52 were higher in class 4 (class with highest age).
Treatment History
Regarding patients’ treatment history, latent classes differed most in terms of pain medication intake. Much more patients in class 2 (81%; p=0.009) took pain medication more than three times a week than in class 3 (44%) and class 4 (52%). Furthermore, the proportion of patients who had received prior psychological treatment was significantly (p=0.029) higher in class 1 (57%) and class 2 (60%) than in class 3 (39%). Accordingly, significantly more patients in class 2 (51%, p=0.013) were frequently (>10 times) consulted by medical doctors within the 6 months prior to admission than patients in the other three latent classes (17–31%). Mean duration of inpatient stay ranged from 15 days (class 3) to 19 days (class 4), but these differences did not reach statistical significance.
Changes in Pain Burden and in Emotional and Physical Health During Treatment and Differences in Change Scores Between Latent Classes
Data for 25% to 51% of the patients (relative to the data at admission in each class) were available at discharge depending on the class and outcome instrument. While, for example, pain intensity ratings in class 3 were only available in n=16 (25%) patients, PHQ-9 ratings in class 2 were available in n=36 (51%) patients. The total sample showed significant improvements on all outcome variables apart from pain frequency during treatment (p≤0.025). While mean changes in pain intensity (Δ=−0.54, p=0.025), impairment (Δ=−0.74, p=0.002) and frequency (Δ=−0.11, p=0.665) were very small, changes in physical health (Δ+2.25, p<0.001), depression (Δ=−4.26, p<0.001), and anxiety (Δ=−2.66, p<0.001) were more substantial.
The RM-ANOVA which tested for differences in mean change scores between latent classes for each outcome, showed statistically significant results for pain intensity (F3,130=11.12, p<0.001), pain impairment (F3,130=4.83, p=0.003), and pain frequency (F3,130=15.23, p<0.001). The results of the post hoc tests that tested the significance of treatment effects for each latent class separately can be found in (Table 5). Pain intensity levels significantly improved in class one (Δ=−1.07, p=0.001) during treatment, while patients in class 4 reported significantly higher levels of pain intensity after treatment than at baseline (Δ=+1.75, p=0.008). Accordingly, levels of pain impairment in class 1 were also lower following treatment than at baseline (Δ=−4.41, p=0.008), and patients in class 4 reported pain significantly more often following treatment than at baseline (Δ=−4.41, p=0.008).
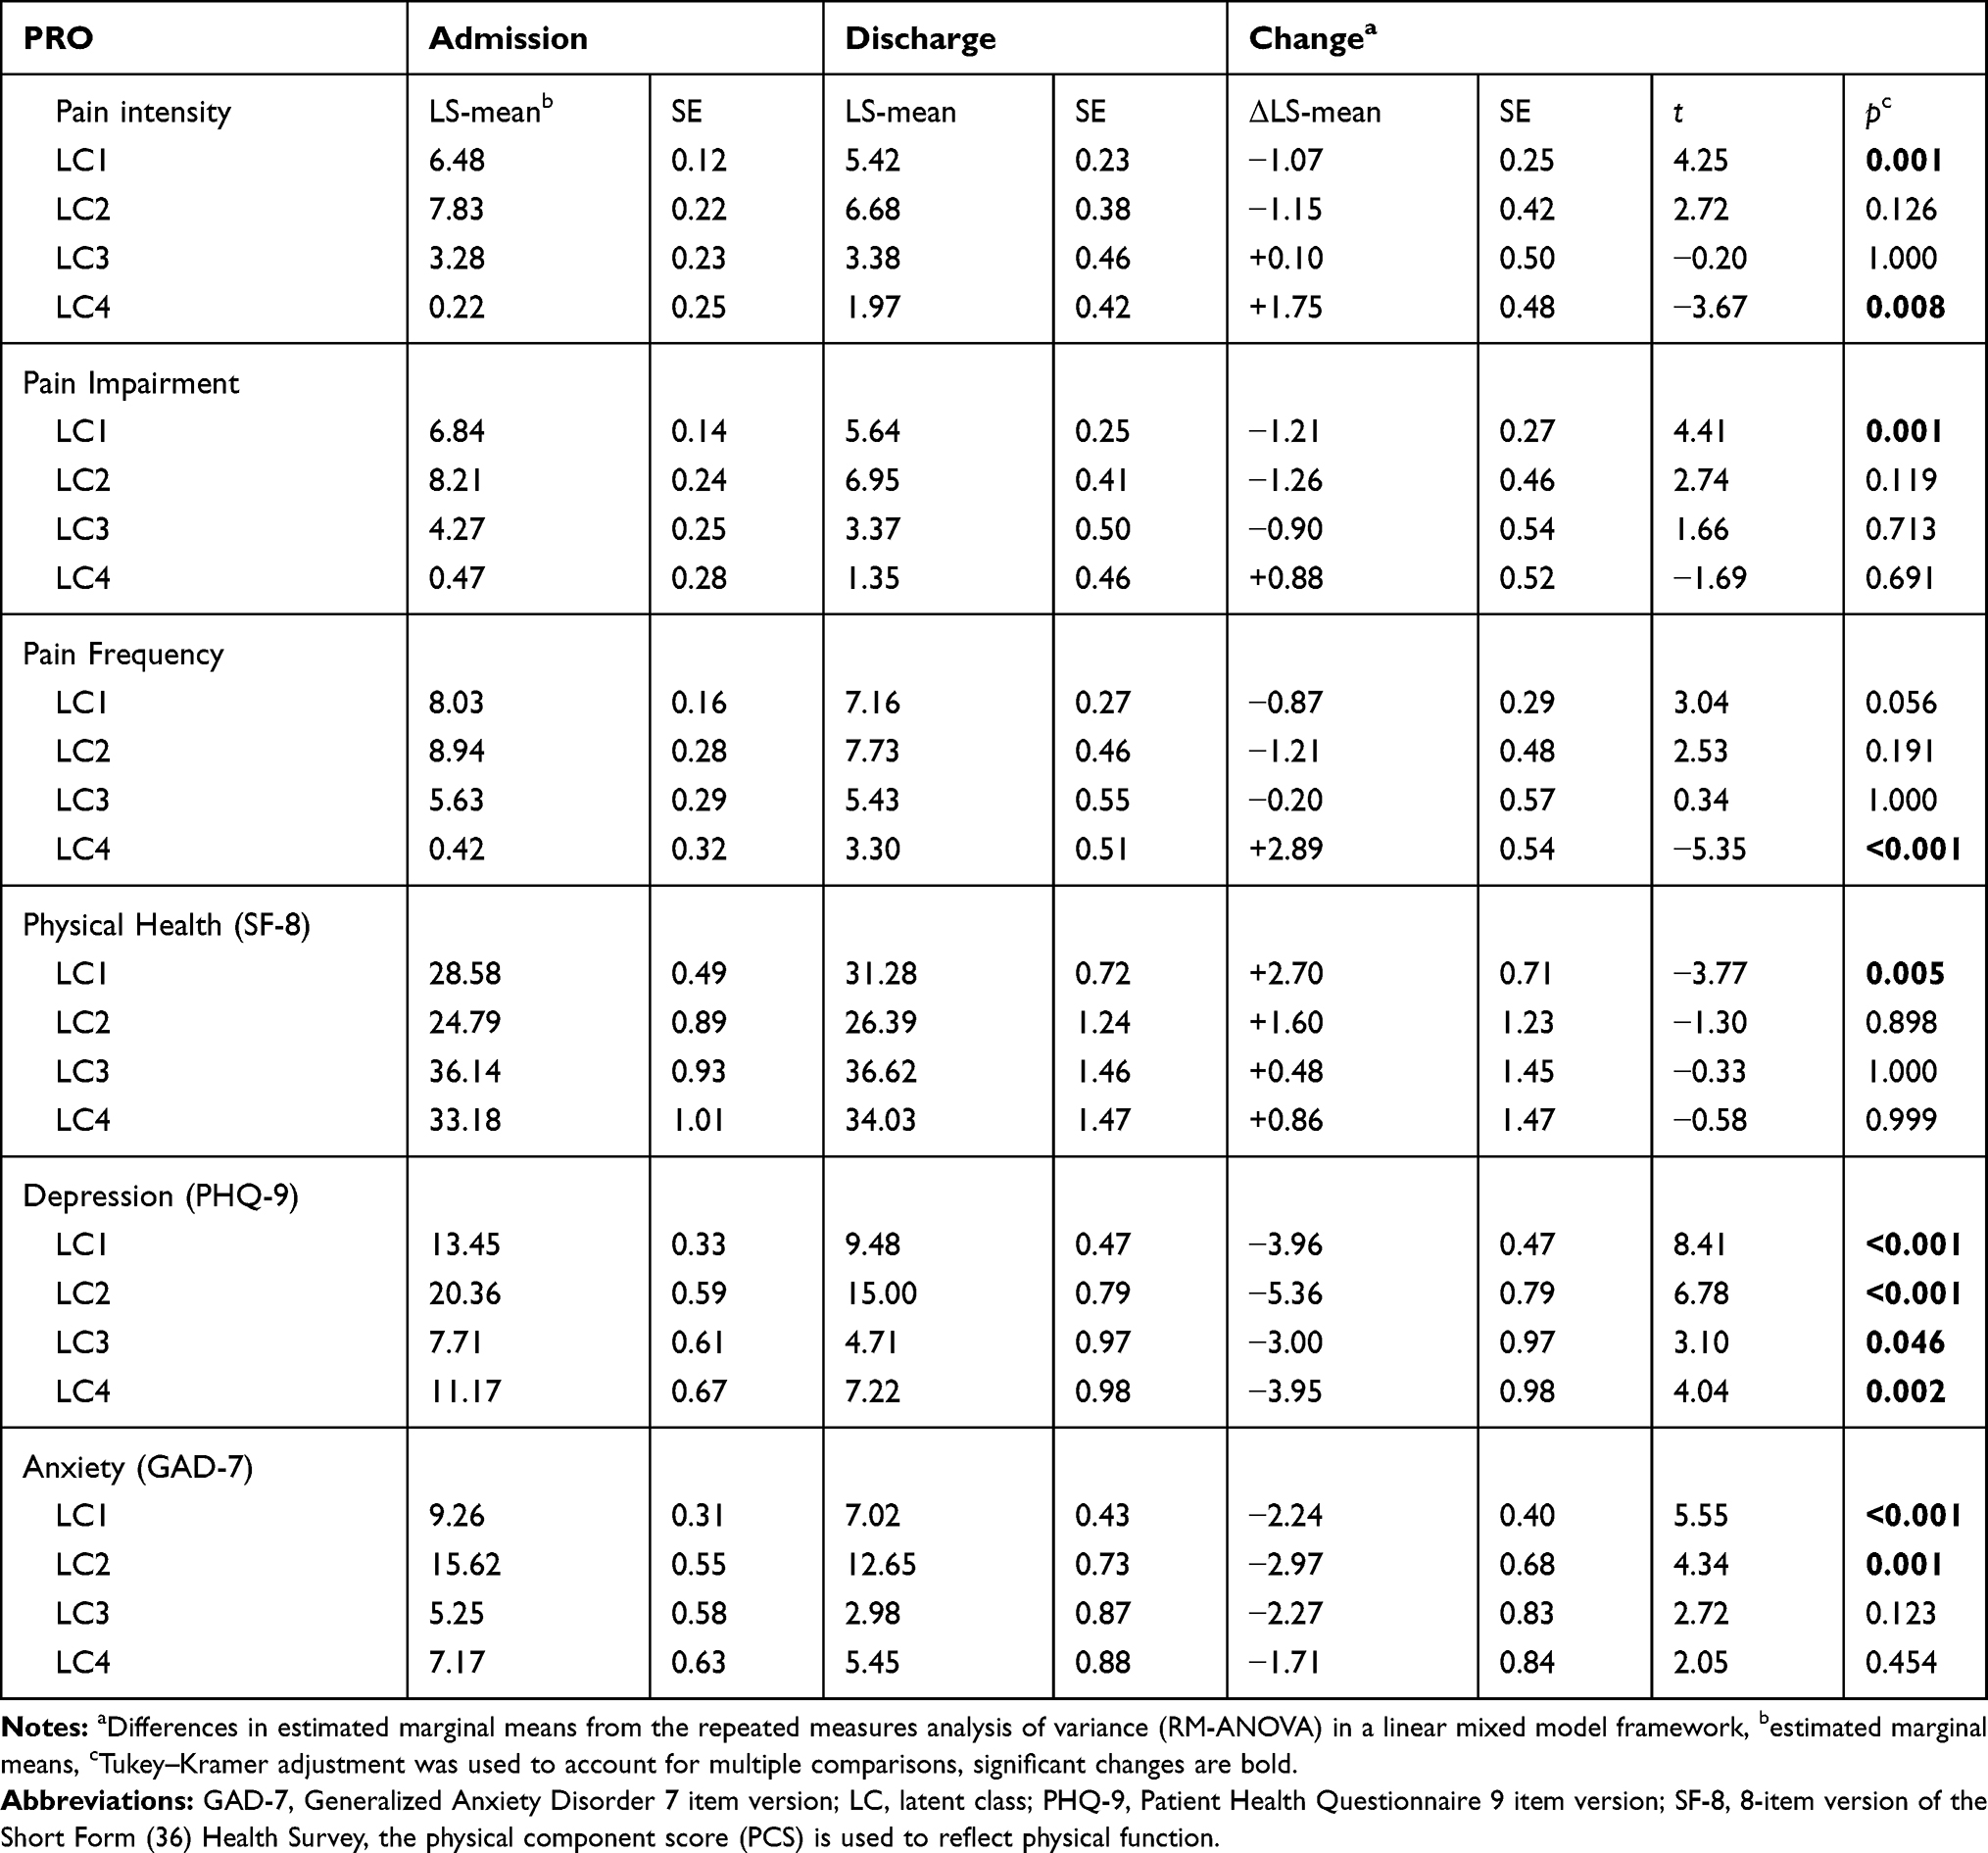 |
Table 5 Patient-Reported Outcomes (PRO) During Treatment Across Latent Classes |
Change scores for physical health (F3,167=0.95, p=0.416), depression (F3,173=1.33, p=0.267), or anxiety (F3,172=0.51, p=0.673) were not significantly different across classes. Patients in all four classes had significantly lower levels of depression (Δ =−3.00 to −5.36, p≤0.05) following treatment, but only patients in classes 1 and 2 had also significantly lower (Δ =−2.24 to −2.97, p≤0.05) levels of anxiety following treatment. Regarding physical health, only patients in class one significantly improved (Δ =+2.70, p=0.005) during treatment (Table 5).
Discussion
In this exploratory, retrospective study, we identified four phenotypes in baseline data from patients suffering from chronic pain who were about to receive multimodal inpatient treatment. We observed several differences in PROs, demographic characteristics, treatment variables and comorbidities. In those patients, it appeared that latent classes were able to predict change in pain intensity, pain impairment, and anxiety throughout treatment. While depression improved in all classes during multimodal treatment, substantial improvements on the other outcomes were only found in class 1. Pain intensity and impairment even deteriorated during treatment in class 4. However, due to the lack of data at discharge in more than half of the patients, conclusions from the different courses of the classes must be drawn with caution.
The largest group (class 1) presented high scores of pain and depression as well as poor physical health at admission and showed improvements in pain as well as emotional and physical health during treatment. Therefore, patients in this group – as compared to other groups – can be characterized as treatment responders, although the mean pain intensity level at discharge was still above 5/10 on the VAS and clinicians usually aim to achieve a pain level of 3/10 or below in CP patients.53 The other groups were notably smaller (approximately 15%) and initial levels of pain and depression varied significantly across groups. All these groups (classes 2–4) showed an improvement in emotional functioning (depression and/or anxiety) while levels of pain remained unchanged or increased. Class 2 was the group with extreme symptom burden including highest pain and depression as well as lowest physical health. In addition, the patients in this group took the most painkillers and had the most contacts with doctors within the last 6 months. Instrumental social support was lower compared to other groups. These patients benefited from the multimodal treatment in terms of their depression, but not in terms of their pain level. One would expect that both, the extent of pain and depression would decrease during treatment. However, duration of inpatient treatment was usually limited to 3–4 weeks due to regulations of the reimbursement system in Germany. Treatment might have been too short for patients in class 2 to show improvement in pain scores. In addition, as follow-up data were not available for later points in time, it remains unclear whether the treatment effect in terms of pain might be delayed. Therefore, follow-up data collected a few months after discharge or after extended inpatient treatment programs would be of interest and should be assessed in future studies. These heavily burdened class 2 patients could probably also benefit from more extensive support in building a better social network, as this group has the lowest level of social support. There is growing evidence that social exclusion and pain are closely linked,54 and consideration of social aspects in treatment may, therefore, have an positive impact on pain levels. Analogous to class 2, the patients in class 3 showed only improvements in their depression, but not in their pain. However, baseline levels of pain, emotional functioning, and physical health in class 3 were – although clearly below the mean values in the general population (M=50) – still better than in the other groups. Surprisingly, patients in class 4 reported low levels of pain at admission but showed an increase during treatment. Moreover, this finding is somewhat contradictory to the higher values of pain perception. Although levels of depression improved during treatment in these patients, they reported increased levels of pain at discharge. It is also remarkable that this group included on average significantly older patients (by 10–15 years).
There are various explanations for the low pain ratings at admission and for the deterioration during inpatient treatment. Low pain experience could be explained by psychological phenomena, such as reduced pain due to a positive treatment expectation55 or due to the removal of stressors from everyday life (i.e., conflicts at work or in the family, etc.). Another explanation is that these patients dissimulated their pain, i.e. their actual pain levels were higher than reported. Although malingering is more common in CP patients, dissimulation has also been reported.56 However, if patients were indeed dissimulating, this could have implications for their treatment. For example, these patients may have been undertreated with pain medication which could lead to more limitations due to pain.
Therapeutic effects in the group (e.g., equalization of pain levels), therapeutic effects on self-perception (patients perceive their pain more realistically during treatment), or statistical effects (regression to the mean) could, individually or in combination, be responsible for the worsening of the pain during treatment.12,57 A practical implication for these patients could be that practitioners should be careful when interpreting very low pain levels in CP patients at admission. Pain levels should, for example, be assessed repeatedly.
Our findings are partly in line with other studies that aimed to identify subgroups in a sample of patients with CP of different origins.17–19,24,25 Based on large samples from the Swedish Quality Registry for Pain Rehabilitation (SQRP) a series of three studies that used slightly different input instruments identified two,18 three,17 and four19 subgroups of CP patients. Like our study, the different groups in the studies are characterized by different levels of pain burden. Two studies17,18 included follow-up data after a multimodal/multidisciplinary rehabilitation program which showed – similar to our study – different trajectories of outcomes. For example, patients in cluster 3 from Ringqvist et al17 had low baseline scores and deteriorated during treatment. One of the three Swedish studies can best be compared with our study, as four subgroups were also found there: Bäckryd et al19 found four subgroups with different levels of pain, which related to similar levels of psychological distress. Remarkably, in contrast to our study, social distress was found to be highest in a group that did not show the highest pain burden but included more females and reported the longest duration of pain.19 In addition to those large studies in heterogeneous pain samples, there are a few subgrouping studies in patients with back pain available.21,28 Due to the wide range of manifestations in back pain patients, those studies seem to be at least partly comparable with our study.58 For example, one study investigated subgroups in patients with low back pain.21 The best LCA solution showed seven patient subgroups with a range of differences. Consistent with our results, the degree of pain severity, physical limitation and emotional suffering were similar within the different subgroups. However, comparison of existing studies remains challenging as different methods and input instruments have been used so far. Future studies should therefore always include those input variables listed in the IMMPACT recommendations.13
Strengths and Limitations
The study was carried out in a heterogeneous clinical chronic pain sample with a state-of-the-art statistical approach and resulted in four clinically meaningful phenotypes which may require different treatment approaches. As with all retrospective studies, some limitations must be considered. First, the relatively large proportion of missing data might have biased the results. The large variation in treatment responses was due to 1) organizational reasons (i.e., some patients did not complete the questionnaires and as pain scales were at the end of the questionnaire, less data were available for these variables than for variables that were assessed at the start of the questionnaire), and due to 2) variation between classes (i.e., there was fewer VAS data available from patients in class 3 compared to the other classes). However, ML estimation was used to account for missing data at discharge.
Second, the use of routine clinical data is the reason why not all recommendations issued by IMMPACT13 could have been followed. In future studies, for example, additional instruments recommended should be used to assess further variables such as pain quality and sleep.
Another limitation was the fact that information regarding the location of pain and the duration of pain episodes could not be included.
Furthermore, differential treatment effects across latent classes cannot be generalized, because – in contrast to a (randomized) clinical trial – this variable as such has not been manipulated.
In addition, it should be emphasized that multimodal treatment in other settings may have been different from what was given at Charité.
Finally, like other recent studies,17–19 the sample included patients with different pain manifestations such as back pain, neck pain, fibromyalgia, etc., and those patients might have been treated separately in other settings. As described above, our approach is based on the idea that pain phenotypes are similar across different pain conditions.13 However, this assumption must be supported by further evidence in future studies.
Future Research
Future phenotyping studies in patients with chronic pain should favor a prospective design. In addition, the application of a two-step LCA (i.e., using categorical variables resulting from a first LCA as input to a second LCA) as suggested by another study21 as well as the inclusion of confounders45 (i.e., demographic variables) in the LCA would be promising extensions. In addition, the identification of subgroups in heterogeneous CP samples may help to provide further scientific evidence for the new ICD-11 classification for chronic pain,59 wherein CP of different origins, different pathophysiological emergences, and with different clinical manifestations have been classified in one chapter. Furthermore, the inclusion of ecological momentary assessment data (real-time assessments, several times daily) would allow to base the subgrouping analyses on a broader range of pain experiences that do even closer reflect patients’ reality.60
Conclusion
Four subgroups with differences in pain perception and emotional distress were found in a sample of CP patients with severe physical or psychosocial consequences. These results could be a first step towards the development of more individualized treatments for patients suffering from chronic pain.
Acknowledgement
We acknowledge support from the German Research Foundation (DFG) and the Open Access Publication Funds of Charité – Universitätsmedizin Berlin.
Author Contributions
All authors contributed to data analysis, drafting and revising the article, gave final approval of the version to be published, and agree to be accountable for all aspects of the work.
Disclosure
None of the authors report a conflict of interest in this work.
References
1. Elliott AM, Smith BH, Penny KI, Smith WC, Chambers WA. The epidemiology of chronic pain in the community. Lancet. 1999;354(9186):1248–1252. doi:10.1016/S0140-6736(99)03057-3
2. Vos T, Flaxman AD, Naghavi M, et al. Years lived with disability (YLDs) for 1160 sequelae of 289 diseases and injuries 1990–2010: a systematic analysis for the global burden of disease study 2010. Lancet. 2012;380(9859):2163–2196. doi:10.1016/S0140-6736(12)61729-2
3. Grabe HJ, Meyer C, Hapke U, et al. Somatoform pain disorder in the general population. Psychother Psychosom. 2003;72(2):88–94. doi:10.1159/000068681
4. Breivik H, Collett B, Ventafridda V, Cohen R, Gallacher D. Survey of chronic pain in Europe: prevalence, impact on daily life, and treatment. Eur J Pain. 2006;10(4):287–333. doi:10.1016/j.ejpain.2005.06.009
5. Hoy D, March L, Brooks P, et al. The global burden of low back pain: estimates from the global burden of disease 2010 study. Ann Rheum Dis. 2014;73(6):968–974. doi:10.1136/annrheumdis-2013-204428
6. Volkow ND, McLellan AT. Opioid abuse in chronic pain–misconceptions and mitigation strategies. N Engl J Med. 2016;374(13):1253–1263. doi:10.1056/NEJMra1507771
7. Kato K, Sullivan PF, Evengard B, Pedersen NL. Chronic widespread pain and its comorbidities: a population-based study. Arch Intern Med. 2006;166(15):1649–1654. doi:10.1001/archinte.166.15.1649
8. Conrad R, Schilling G, Bausch C, et al. Temperament and character personality profiles and personality disorders in chronic pain patients. Pain. 2007;133(1–3):197–209. doi:10.1016/j.pain.2007.07.024
9. Fishbain DA, Cutler R, Rosomoff HL, Rosomoff RS. Chronic pain-associated depression: antecedent or consequence of chronic pain? A review. Clin J Pain. 1997;13(2):116–137. doi:10.1097/00002508-199706000-00006
10. Turk DC, Gatchel RJ. Psychological Approaches to Pain Management: A Practitioner’s Handbook.
11. Gatchel RJ, Peng YB, Peters ML, Fuchs PN, Turk DC. The biopsychosocial approach to chronic pain: scientific advances and future directions. Psychol Bull. 2007;133(4):581–624. doi:10.1037/0033-2909.133.4.581
12. Dale R, Stacey B. Multimodal treatment of chronic pain. Med Clin North Am. 2016;100(1):55–64. doi:10.1016/j.mcna.2015.08.012
13. Edwards RR, Dworkin RH, Turk DC, et al. Patient phenotyping in clinical trials of chronic pain treatments: IMMPACT recommendations. Pain. 2016;157(9):1851–1871. doi:10.1097/j.pain.0000000000000602
14. Attal N, Fermanian C, Fermanian J, Lanteri-Minet M, Alchaar H, Bouhassira D. Neuropathic pain: are there distinct subtypes depending on the aetiology or anatomical lesion? PAIN. 2008;138(2):343–353. doi:10.1016/j.pain.2008.01.006
15. Baron R, Dickenson AH. Neuropathic pain: precise sensory profiling improves treatment and calls for back-translation. PAIN. 2014;155(11):2215–2217. doi:10.1016/j.pain.2014.08.021
16. Baron R, Forster M, Binder A. Subgrouping of patients with neuropathic pain according to pain-related sensory abnormalities: a first step to a stratified treatment approach. Lancet Neurol. 2012;11(11):999–1005. doi:10.1016/S1474-4422(12)70189-8
17. Ringqvist Å, Dragioti E, Björk M, Larsson B, Gerdle B. Moderate and stable pain reductions as a result of interdisciplinary pain rehabilitation—a cohort study from the swedish quality registry for pain rehabilitation (SQRP). J Clin Med. 2019;8(6):905. doi:10.3390/jcm8060905
18. Gerdle B, Åkerblom S, Brodda Jansen G, et al. Who benefits from multimodal rehabilitation - an exploration of pain, psychological distress, and life impacts in over 35,000 chronic pain patients identified in the Swedish quality registry for pain rehabilitation. J Pain Res. 2019;12:891–908. doi:10.2147/JPR.S190003
19. Bäckryd E, Persson EB, Larsson AI, Fischer MR, Gerdle B. Chronic pain patients can be classified into four groups: clustering-based discriminant analysis of psychometric data from 4665 patients referred to a multidisciplinary pain centre (a SQRP study). PLoS One. 2018;13(2):e0192623. doi:10.1371/journal.pone.0192623
20. Burri A, Hilpert P, McNair P, Williams FM. Exploring symptoms of somatization in chronic widespread pain: latent class analysis and the role of personality. J Pain Res. 2017;10:1733–1740. doi:10.2147/JPR.S139700
21. Nielsen AM, Kent P, Hestbaek L, Vach W, Kongsted A. Identifying subgroups of patients using latent class analysis: should we use a single-stage or a two-stage approach? A methodological study using a cohort of patients with low back pain. BMC Musculoskelet Disord. 2017;18(1):57. doi:10.1186/s12891-017-1411-x
22. Vaegter HB, Graven-Nielsen T. Pain modulatory phenotypes differentiate subgroups with different clinical and experimental pain sensitivity. PAIN. 2016;157(7):1480–1488. doi:10.1097/j.pain.0000000000000543
23. Fenton BW, Grey SF, Tossone K, McCarroll M, Von Gruenigen VE. Classifying patients with chronic pelvic pain into levels of biopsychosocial dysfunction using latent class modeling of patient reported outcome measures. Pain Res Treat. 2015;2015:8. doi:10.1155/2015/940675
24. Hobro N, Weinman J, Hankins M. Using the self-regulatory model to cluster chronic pain patients: the first step towards identifying relevant treatments? Pain. 2004;108(3):276–283. doi:10.1016/j.pain.2003.12.027
25. Turk DC, Rudy TE. Toward an empirically derived taxonomy of chronic pain patients: integration of psychological assessment data. J Consult Clin Psychol. 1988;56(2):233–238. doi:10.1037/0022-006X.56.2.233
26. Vincent A, Hoskin TL, Whipple MO, et al. OMERACT-based fibromyalgia symptom subgroups: an exploratory cluster analysis. Arthritis Res Ther. 2014;16(5):463. doi:10.1186/s13075-014-0463-7
27. Häuser W, Schmutzer G, Brähler E, Glaesmer H. A cluster within the continuum of biopsychosocial distress can be labeled “fibromyalgia syndrome”–evidence from a representative German population survey. J Rheumatol. 2009;36(12):2806–2812. doi:10.3899/jrheum.090579
28. Huijnen IPJ, Rusu AC, Scholich S, Meloto CB, Diatchenko L. Subgrouping of low back pain patients for targeting treatments: evidence from genetic, psychological, and activity-related behavioral approaches. Clin J Pain. 2015;31(2):123–132. doi:10.1097/AJP.0000000000000100
29. Dell’Isola A, Allan R, Smith SL, Marreiros SSP, Steultjens M. Identification of clinical phenotypes in knee osteoarthritis: a systematic review of the literature. BMC Musculoskelet Disord. 2016;17(1):425. doi:10.1186/s12891-016-1286-2
30. Gatchel RJ, McGeary DD, McGeary CA, Lippe B. Interdisciplinary chronic pain management: past, present, and future. Am Psychol. 2014;69(2):119–130. doi:10.1037/a0035514
31. de Luca K, Parkinson L, Downie A, Blyth F, Byles J. Three subgroups of pain profiles identified in 227 women with arthritis: a latent class analysis. Clin Rheumatol. 2017;36(3):625–634. doi:10.1007/s10067-016-3343-5
32. Dianat I, Alipour A, Asghari Jafarabadi M. Multigroup latent class model of musculoskeletal pain combinations in children/adolescents: identifying high-risk groups by gender and age. J Headache Pain. 2018;19(1):52. doi:10.1186/s10194-018-0880-0
33. Pan F, Tian J, Cicuttini F, Jones G, Aitken D. Differentiating knee pain phenotypes in older adults: a prospective cohort study. Rheumatology. 2018.
34. Dragioti E, Larsson B, Bernfort L, Levin L-Å, Gerdle B. Prevalence of different pain categories based on pain spreading on the bodies of older adults in Sweden: a descriptive-level and multilevel association with demographics, comorbidities, medications, and certain lifestyle factors (PainS65+). J Pain Res. 2016;9:1131. doi:10.2147/JPR.S119845
35. Turk DC, Okifuji A. Psychological factors in chronic pain: evolution and revolution. J Consult Clin Psychol. 2002;70(3):678–690. doi:10.1037/0022-006X.70.3.678
36. Nilges P, Rief W. [F45.41: chronic pain disorder with somatic and psychological factors: a coding aid]. Schmerz. 2010;24(3):209–212. doi:10.1007/s00482-010-0908-0. German.
37. Ferreira-Valente MA, Pais-Ribeiro JL, Jensen MP. Validity of four pain intensity rating scales. Pain. 2011;152(10):2399–2404. doi:10.1016/j.pain.2011.07.005
38. Cella DF, Perry SW. Reliability and concurrent validity of three visual-analogue mood scales. Psychol Rep. 1986;59(2):827–833. doi:10.2466/pr0.1986.59.2.827
39. Geissner E. The pain perception scale–a differentiated and change-sensitive scale for assessing chronic and acute pain. Rehabilitation. 1995;34(4):XXXV–XLIII.
40. Kroenke K, Spitzer RL, Williams JB. The PHQ-9: validity of a brief depression severity measure. J Gen Intern Med. 2001;16(9):606–613. doi:10.1046/j.1525-1497.2001.016009606.x
41. Spitzer RL, Kroenke K, Williams JB, Lowe B. A brief measure for assessing generalized anxiety disorder: the GAD-7. Arch Intern Med. 2006;166(10):1092–1097. doi:10.1001/archinte.166.10.1092
42. Ware JE, Kosinski M, Dewey JE, Gandek B. How to Score and Interpret Single-Item Health Status Measures: A Manual for Users of the SF-8_ Health Survey. Lincoln, RI: QualityMetric Incorporated; 2001.
43. Schulz U, Schwarzer R. [Social support in coping with illness: the berlin social support scales (BSSS)]. Diagnostica. 2003;49(2):73–82. doi:10.1026//0012-1924.49.2.73. German.
44. Fortin M, Hudon C, Haggerty J, van den Akker M, Almirall J. Prevalence estimates of multimorbidity: a comparative study of two sources. BMC Health Serv Res. 2010;10(1):111. doi:10.1186/1472-6963-10-111
45. Collins LM, Lanza TL. Latent Class and Latent Transition Analysis - with Applications in the Social, Behavioral, and Health Sciences. Hoboken, New Jersey, USA: John Wiley & Sons, Inc; 2010.
46. Schreiber JB. Latent Class Analysis: an example for reporting results. Res Social Adm Pharm. 2017;13(6):1196–1201. doi:10.1016/j.sapharm.2016.11.011
47. Nylund KL, Asparouhov T, Muthén BO. Deciding on the number of classes in latent class analysis and growth mixture modeling: a monte carlo simulation study. Multidis J. 2007;14(4):535–569. doi:10.1080/10705510701575396
48. Langeheine R, Pannekoek J. Van De Pol F. Bootstrapping goodness-of-fit measures in categorical data analysis. Sociol Methods Res. 1996;24(4):492–516. doi:10.1177/0049124196024004004
49. Team RC. R: A Language and Environment for Statistical Computing [Computer Program]. Vienna: R foundation for statistical computing; 2012.
50. Linzer DA, Lewis JB. POLCA: an R package for polytomous variable latent class analysis. J Stat Softw. 2011;42(10). doi:10.18637/jss.v042.i10
51. Wickham H. Ggplot2: Elegant Graphics for Data Analysis. New York: Springer-Verlag; 2009.
52. Hopman WM, Harrison MB, Coo H, Friedberg E, Buchanan M, VanDenKerkhof EG. Associations between chronic disease, age and physical and mental health status. Chronic Dis Can. 2009;29(3):108–116.
53. Farrar JT, Young JP
54. Eisenberger NI. The neural bases of social pain: evidence for shared representations with physical pain. Psychosom Med. 2012;74(2):126–135. doi:10.1097/PSY.0b013e3182464dd1
55. Smeets RJEM, Beelen S, Goossens MEJB, Schouten EGW, Knottnerus JA, Vlaeyen JWS. Treatment expectancy and credibility are associated with the outcome of both physical and cognitive-behavioral treatment in chronic low back pain. Clin J Pain. 2008;24(4):305–315. doi:10.1097/AJP.0b013e318164aa75
56. Fishbain DA, Cutler R, Rosomoff HL, Rosomoff RS. Chronic pain disability exaggeration/malingering and submaximal effort research. Clin J Pain. 1999;15(4):244–274. doi:10.1097/00002508-199912000-00002
57. Stigler SM. Regression towards the mean, historically considered. Stat Methods Med Res. 1997;6(2):103–114. doi:10.1177/096228029700600202
58. Balagué F, Mannion AF, Pellisé F, Cedraschi C. Non-specific low back pain. Lancet. 2012;379(9814):482–491. doi:10.1016/S0140-6736(11)60610-7
59. Treede RD, Rief W, Barke A, et al. A classification of chronic pain for ICD-11. Pain. 2015;156(6):1003–1007. doi:10.1097/j.pain.0000000000000160
60. Stone AA, Broderick JE, Schneider S, Schwartz JE. Expanding options for developing outcome measures from momentary assessment data. Psychosom Med. 2012;74(4):387–397. doi:10.1097/PSY.0b013e3182571faa
 © 2020 The Author(s). This work is published and licensed by Dove Medical Press Limited. The
full terms of this license are available at https://www.dovepress.com/terms
and incorporate the Creative Commons Attribution
- Non Commercial (unported, 3.0) License.
By accessing the work you hereby accept the Terms. Non-commercial uses of the work are permitted
without any further permission from Dove Medical Press Limited, provided the work is properly
attributed. For permission for commercial use of this work, please see paragraphs 4.2 and 5 of our Terms.
© 2020 The Author(s). This work is published and licensed by Dove Medical Press Limited. The
full terms of this license are available at https://www.dovepress.com/terms
and incorporate the Creative Commons Attribution
- Non Commercial (unported, 3.0) License.
By accessing the work you hereby accept the Terms. Non-commercial uses of the work are permitted
without any further permission from Dove Medical Press Limited, provided the work is properly
attributed. For permission for commercial use of this work, please see paragraphs 4.2 and 5 of our Terms.