Back to Archived Journals » Smart Homecare Technology and TeleHealth » Volume 8
A Smart Data Pre-Processing Approach to Effective Management of Big Health Data in IoT Edge
Authors Kaya ŞM ![]() , Erdem A, Güneş A
, Erdem A, Güneş A ![]()
Received 9 April 2021
Accepted for publication 20 July 2021
Published 31 August 2021 Volume 2021:8 Pages 9—21
DOI https://doi.org/10.2147/SHTT.S313666
Checked for plagiarism Yes
Review by Single anonymous peer review
Peer reviewer comments 2
Editor who approved publication: Professor Aryya Gangopadhyay
Şükrü Mustafa Kaya,1 Atakan Erdem,2 Ali Güneş3
1Department of Computer Engineering, Institute of Graduate Studies, Istanbul Aydin University, Istanbul, Turkey; 2Jackson’s Lab, University of Calgary, Calgary, Canada; 3Department of Computer Engineering, Istanbul Aydin University, Istanbul, Turkey
Correspondence: Şükrü Mustafa Kaya
Department of Computer Engineering, Institute of Graduate Studies, Istanbul Aydin University, Istanbul, Turkey
Tel +90 545 205 57 01
Email [email protected]
Background: An IoT Big Data analysis platform should be able to dynamically manage IoT data and it should be appropriate the fundamental components, known as the 5V’s of big data. Therefore, speed and accuracy are two important criteria to consider. In this context, there are no similar studies that prioritize speed and accuracy criteria in big health data. It is thought that this study and the experimental results obtained are a new approach in the field of healthcare, hence it will add novelty to the studies to be carried out. The main objective of this paper is to detect anomalies at the edge of IoT for the effective management of big health data.
Methods: This study focuses on detecting anomalies on the data stream created with IoT sensors between the sensing and network layer. The classification success and data processing speed of the random cut forest, logistic regression, Naive Bayes, and neural network algorithms used for anomaly detection are compared. In order to detect anomalies in a data stream consisting of temperature, age, gender, weight, height, and time data and compare algorithms.
Results: The speed and accuracy performances of ML Algorithms were compared. The performance comparison shows that the LR algorithm will be more successful in IoT systems in terms of speed, although it is very close to the RCF in terms of accuracy.
Conclusion: The experimental results show that using ML algorithms on IoT edges will help make effective and timely decisions in the healthcare domain. Thus, the big data generated by the IoT sensing layer in healthcare will be formed at a more manageable level. Also, thanks to this, service providers, users, and other interested sides will be minimally affected by the negative effects of anomalous data.
Keywords: internet of things, big data management, big data analytics, data filtering
Introduction
As a result of digitalization gaining momentum in the world, the generation, collection, analysis, and storage of data that will facilitate our daily lives and the establishment of decision-making mechanisms based on meaningful data have gained importance. Parallel to the proceedings, IoT technology including cloud computing and database systems, which can detect the sensing networks, devices, or people that can observe the physical world, produce and process data, and perform decision-making processes, has emerged. The devices that make up this technology can communicate with each other over the internet and share information. As a result of this feature, the internet of things technology is being used effectively in smart homes, smart cities, smart energy, smart agriculture, and smart industry systems. However, IoT devices could not filter the data at the same time while producing it, and the data produced in the domain of healthcare is vital.1,2 The data produced through IoT devices must be transmitted to the relevant healthcare provider simultaneously and accurately. IoT edges are the first place where data can be pre-processed before the generated data go to the cloud. It is important to filter data before they go to the cloud because if filtering is not done, the success of cloud services in terms of speed and accuracy decreases3,4, and doubt about synchronicity, and accuracy can cost the lives of patients receiving health care. Therefore, speed and accuracy are two important criteria to consider. In this context, there are no similar studies that prioritize speed and accuracy criteria in big health data in the previous research. It is thought that our study and the experimental results obtained are a new approach in the field of healthcare domain, for this reason, it will add novelty to the studies to be carried out. Studies in different IoT fields are shown as examples in the related works section to mention the importance of the problems we focus on.
In this study, the concepts of the IoT and Big Data are examined and the relationship between the two concepts is explained in detail. Anomaly detection is performed on the IoT data stream. The detection of anomaly is done using the Random Cut Forest, Logistic Regression, Naive Bayes, and Neural Network algorithms. The classification performances and classification times of the algorithms are compared.
Related Works
Eugene et al5 examine the benefits of a wide range of efficient, effective, and innovative applications and services for the IoT and big data analysis. The study aims to examine data analysis applications in different IoT areas, provide a classification of analytical approaches, and propose a layered taxonomy from IoT data to analytics. This taxonomy provides insight into the appropriateness of analytical techniques; and with the obtained information, a meaningful result is obtained that provides the technology and infrastructure for IoT analytics. As a result, developments that will shape future research on the IoT are being investigated. In their article, Manogaran et al propose a new architecture for the implementation of the IoT to store and process scalable sensor data (big data) for healthcare applications. The proposed architecture consists of two main sub-architectures: the Meta Fog-Routing (MF-R) and Grouping and Selection (GC) architectures. The MF-R architecture uses big data technologies such as Apache Pig and Apache HBase to collect and store the sensor data (big data) produced from different sensor devices. The proposed GC architecture is used to enable the integration of fog computing with cloud computing. Also, a MapReduce-based prediction model is used to predict heart diseases using the architecture.5,6 Yasmin et al propose an adaptive method to reduce data. The proposed method is an estimation-based data reduction utilizing LMS adaptive filters. Specifically, the recommended method for both the source and base station nodes is based on a convex combination of two LMS window filters separated using different sizes to predict the next measured values since the sensor nodes must immediately transmit the detected values only when there is a significant deviation from the predicted values.7 This article proposes a new model for the effective management of big data generated by different sources, such as sensor data that do not require human intervention, by optimizing virtual machine selection. The proposed model aims to optimize the storage of patients’ big data to provide a real-time data retrieval mechanism and thus to improve the performance of health systems.8 In another study, studies on the IoT and big data are investigated and how big data are created on the IoT is investigated. Many existing IoT systems, future applications, and various IoT technologies, whether wired or wireless, are examined and the problems to be encountered and solutions to be produced through IoT architectures are discussed.9 Nilamadhab et al examine the architectures for combining IoT and big data management and propose a new IoT layer based on the idea that the efficiency of big data management will increase with the integration of IoT and big data in the future using technologies such as computational intelligence, machine type communication, big data, and sensor technology.10 Another study investigates big IoT data analysis and explains the relationship between big data analysis and the IoT. Big IoT data analysis, methods, and technologies for big data mining are discussed and IoT systems in different areas are explained with sample presentations. In addition, a new architecture is proposed for large IoT data analytics.11 In this study, the state-of-the-art big data analysis technologies, algorithms, and techniques that can lead to the development of smart IIoT systems are investigated. Applications and case studies of various businesses that benefit from big data analysis are included.12 In a different study, a platform is provided that enables innovative analysis of the data captured with IoT devices in smart homes. It is recommended that fog nodes and cloud systems be used to allow for data-based services and to take the hassle out of the complexities and resource demands by leveraging online data processing, storage, and classification analysis.13 In this study, a new architecture is proposed for a health system based on the energy harvesting technique, which prolongs device life. The health system is powered by an architecture that uses both real-time and offline data. In order to process such data, another study’s architecture offers a new decision model that processes the big data produced by IoT devices.14
IoT and Big Data
The combination of Big Data with IoT technology is a favored technique in the development of various services for complex systems that are becoming widespread in the fields of industry, agriculture, smart city, health services, security, and so on. Various Big Data technologies are being developed to help process the large volumes of data collected from different sources in smart environments. In this context, the development of Big Data applications has become very important in recent years and the Big Data mechanism has become a data analysis method for the formation of intelligent systems within the IoT infrastructure to achieve the goal of the IoT system. In their study, Rajan et al, assessed IoT systems that produce Big Data using semantics.15,16 Similarly, Li et al, explain in detail the solutions and various obvious challenges for IoT security.17
The Relationship Between IoT and Big Data Analysis
Statistics clearly state that the number of internet users will be about 6 billion by 2025, and therefore it is an inevitable fact that countless data are produced every minute. The IoT generates big data and it transports the data produced by the sensors to the network environment.18,19 IoT applications are the biggest sources of big data.20 Therefore, the need to combine IoT and big data arises. An IoT Big Data analysis platform should be able to dynamically manage IoT data and link to various heterogeneous objects while considering interoperability issues. Cloud storage is the most widely accepted platform for storing large amounts of IoT data in all IoT areas, but this platform is not a platform specific to IoT data.21,22 However, in the IoT, big data processing and analysis can be implemented closer to the data source using edge computing or fog computing.23 In general, it seems like a disadvantage that IoT increases the amount and variety of data. However, this situation allows big data analysis and applications to develop much faster. In addition, the application of big data technologies in the IoT accelerates the research developments and business models of the IoT. Consequently, when the IoT and Big data are integrated, both are thought to develop rapidly.
Big Data Mining in the IoT
Big data analysis aims to quickly extract important information that helps make predictions, identify trends, find confidential information, and ultimately make decisions. Different and very large datasets more contribute to big data management. However, this is not always the case since in some cases more data causes more uncertainty and more problems.24
IoT data are typically heterogeneous, produced at high speeds, and need to be analysed in large volumes and in real-time. Traditional data mining techniques are insufficient for analysing the data produced by the IoT. Data must be pre-processed and properly linked to achieve meaningful results. Large amounts of raw data are constantly collected through the Internet of things. It is therefore essential to develop new techniques that can turn raw data into valuable information. For example, in the health field, important variables such as human eating, drinking, breathing, heart rhythm, blood pressure, and blood sugar can be detected through sensors and can produce meaningful raw data streams. The data flow generated by the data produced by millions of sensors is expected to be very intense. These data streams are used in different ways for different purposes. Therefore, the sources of data and how they are processed should be known and privacy and security should be ensured. Although the big data collected are analysed and interpreted, they may not have any value if they are not understood. Hence, data mining techniques are the main recommended methods for extracting information from the moment raw data are produced.25,26
Data Mining Process in the IoT
An important problem is how to extract useful information from different complex perceived environments at different times and obtain meaningful results.27 Data must be analysed with appropriate data mining techniques to identify useful patterns in IoT data. In addition, data mining techniques in the IoT must be able to adapt to dynamic environments or changing data streams to prevent the redesign of data mining rules whenever a sensor is added or removed. Machine learning is a sub-branch of artificial intelligence and aims to imitate human learning on computers without having to be explicitly programmed. Machine learning techniques are suitable for data mining in the IoT. This is because machine learning techniques have several characteristics that make them favourable for IoT data mining. For example, if a new smart device is added to the network, the machine learning methods can continue to learn new rules. Although many analysis technologies have been developed to make the IoT smarter, one of the most valuable technologies is data mining.25,28
Methodology
The IoT architecture includes four main sections: sensing layer, network layer, service and management layer, and application layer.29 Users communicate with IoT end devices more frequently through interactive interfaces provided by the cloud or edge, rather than interacting directly with IoT end devices, while using smart IoT applications to make their lives easier. IoT end devices are embedded in the physical world. They sense the physical world and act to control the physical world, but they are not suited for heavy work such as computations and analysis. The cloud has almost limitless resources; however, it is often physically distant from end devices. Thus, a cloud centric IoT architecture cannot perform efficiently, especially in IoT systems that require real-time performance. Since the edge is a central component of IoT architectures, it can coordinate the other layer to work together and complements the cloud and IoT end devices to achieve optimal performance.30
Analytical accuracy and speed are vital for smart services in IoT systems. Therefore, Kim et al proposed a data filtering system for the server in the cloud. The proposed data filtering system is placed in front of the server and firstly receives data from objects with the help of the sensing layer. It then uses the Naive Bayes classifier to conduct data filtering and learns to classify malfunctioning data from collected data. After performing the data filtering, the server can obtain accurate analysis results and reduce the computing load.31
In this study, we focus on detecting anomalies on the data stream created with IoT sensors between the sensing and network layer.
Data Set
In this study, six-dimensional, 10,000 data consisting of temperature, age, gender, weight, height and time values are produced by IoT sensors. Approximately 70% of the data produced, which is 6999 records, is used for training, and approximately 30% of the total data, ie, 3000 records, is used for verification and prediction. In addition, the scikit-learn library is used for modelling and normalization.
Case Study
In the study, the classification success and data processing speed of the Random Cut Forest, Logistic Regression, Naive Bayes, and Neural Network algorithms used for anomaly detection are compared. In order to detect anomalies in a data stream consisting of body temperature, age, gender, weight, height, and time data and compare algorithms, the AWS (Amazon Web Service) kinesis data stream, kinesis data analysis, and AWS ML services are used. The architecture in which anomaly detection and performance tests are performed is presented in Figure 1.
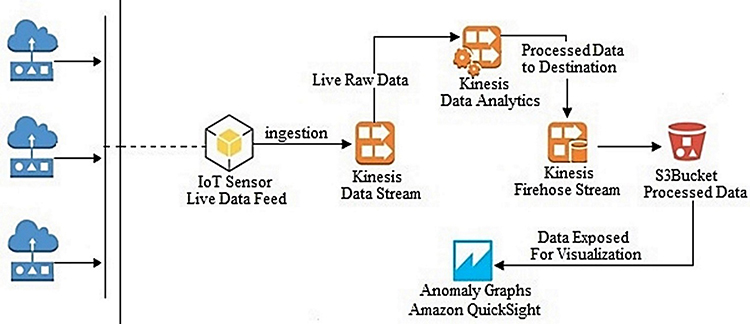 |
Figure 1 Architecture used for anomaly detection and performance testing. |
The raw data collected from IoT devices create the IoT field. The majority of the meaningful IoT services are data collection and analysis. Data collection is carried out through various wireless technologies such as wireless sensor networks (WSNs), low power wide area networks (LPWANs), Wi-Fi, Bluetooth, and cellular networks. The server deals with the data collected from networks. The data produced by IoT devices are transmitted to the server in the cloud. The server undertakes the task of analysing the collected data and obtaining meaningful information. Naturally, smart IoT services are provided meaningful information. In an environment where many data are concentrated on the server, data integrity emerges as an important factor in data analysis on the server. In the process of analysing the data collected from the server’s IoT devices, the data integrity reduces the computing load on the server. Reducing the processing load helps reduce energy consumption while the server processes data. Therefore, a system is required to support data integrity. Figure 1 represents designed architecture for data integrity. Various data are generated in IoT networks and transmitted to the cloud through gateways. In the cloud, the data are transmitted to the management server that manages smart services. The servers analyse the collected data and obtain meaningful information for smart services. Data integrity is required for reliable data analysis. If the data integrity is not guaranteed, the information extracted will not be reliable, and untrusted information will lead to wrong decisions. In order to support data integrity, the proposed system is placed in front of the server. The produced data are examined in real-time and anomalies are detected. Real-time data are sent to the kinesis data stream, which will be considered as the source; and then the raw data are processed in parallel with the kinesis data analysis. The results are then stored in the area designated as the target. The temperature sensor is defined as the IoT device and the data flow is simulated.
- By using AWS Kinesis analysis and segamake services, classification is done using the Random Cut Forest, Logistic Regression, Naive Bayes, and Neural Network algorithms. Using the data stored in AWS Kinesis Streams, anomalies are detected in real-time.
- The data in the ranges determined as normal and anomalous are determined and filtered.
- 10,000 data consisting of the six dimensions of heat, age, gender, weight, height, and time, including 5123 women and 4877 men, are produced by the python program. The produced data are input into the kinesis data stream for processing using the kinesis data analysis and segamake application. Approximately 70% of the data produced, which is 6999 records, is used for training; and approximately 30% of the total data, ie, 3000 records, is used for verification and prediction. The performance parameters of the algorithms are presented in detail in section 5. After detecting the anomalous data, reliable and accurate records are separated from the anomalous ones and sent to the determined target to ensure data integrity.
In Figure 2, a data stream simulation model developed to conduct anomaly detection by using machine learning algorithms on temperature data stream is presented. The simulation performed consists of five components and is described in Platform Components.
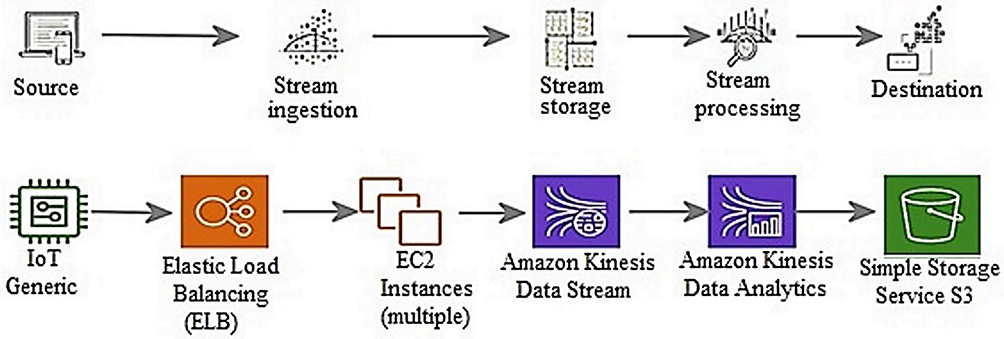 |
Figure 2 Simulation model. |
Platform Components
Kinesis Data Stream
Kinesis data flow, one of the AWS services, is created on the AWS console. The Kinesis data streaming service is used to create a real-time data flow with data from sensors that generate instant data.
Data Stream Load
The data sent to the kinesis data stream is produced locally with the help of the code in Figure 3 executed on python. The code developed on Python acts as a sensor that sends data for real-time streaming. The randomly generated temperature value for the anomaly detection that we created for testing is found to be normal when it is in the range of 30–40 degrees, and it is anomalous when it is in the range of 100–120 degrees.
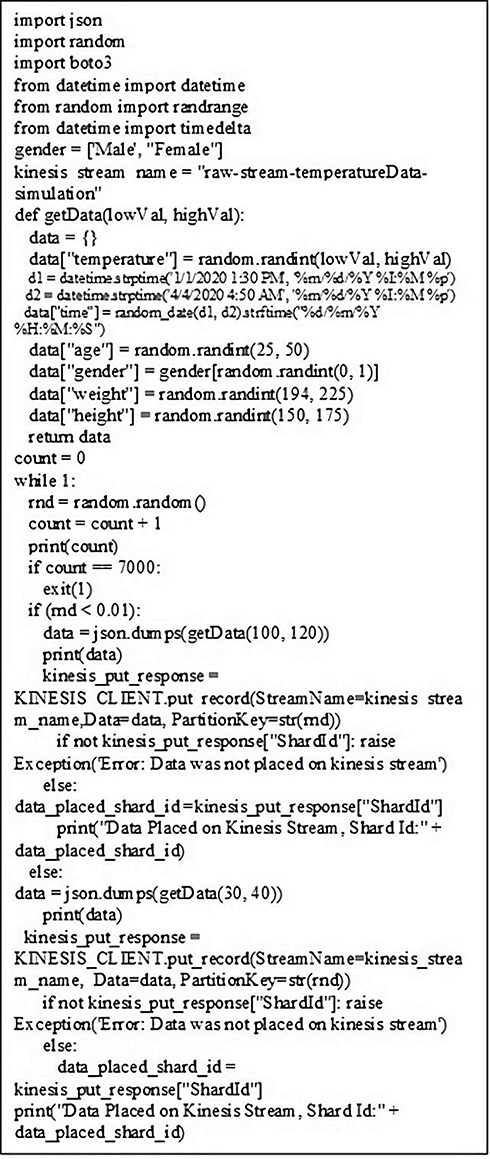 |
Figure 3 Data source. |
Kinesis Data Analysis and Segamake
The AWS Kinesis data analysis and segamake services are used to analyse the kinesis data stream. The Random Cut Forest, Logistic Regression, Naive Bayes, and Neural Network algorithms are used to detect anomalies from moving data. Kinesis data analysis and segamake allow these algorithms to be used. Algorithms evaluate each temperature datum in the stream and determine whether the data are normal or anomalous data.
Kinesis Firehose Stream
In the third step, the S3 bucket is configured as the destination where the processed data will be stored, thereby creating a Kinesis Firehose Stream target. After making the necessary associations between S3 and the kinesis firehose, the files are automatically stored in CSV format by the kinesis firehose stream.
Amazon Quick Sight
Amazon’s Quick Sight is used to visualize the transactions and instantaneous movements performed on the data stream.
Results
The model created for making inferences from the data is tested with the Random Cut Forest, Logistic Regression, Naive Bayes, and Neural Network algorithms; and the results are presented in Tables 2–6. The explanations and formulas related to the classification metrics presented in the tables are as follows.32
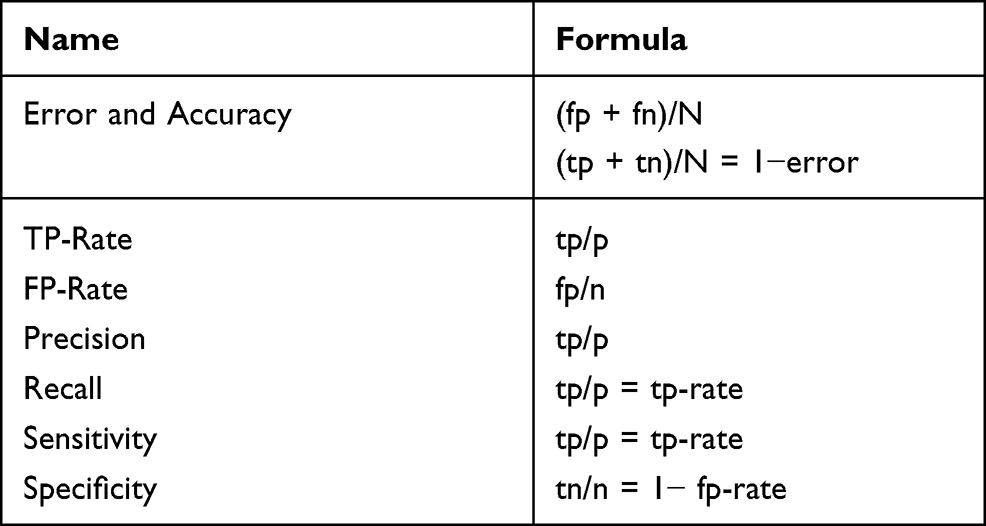 |
Table 1 Classification Performance Measures |
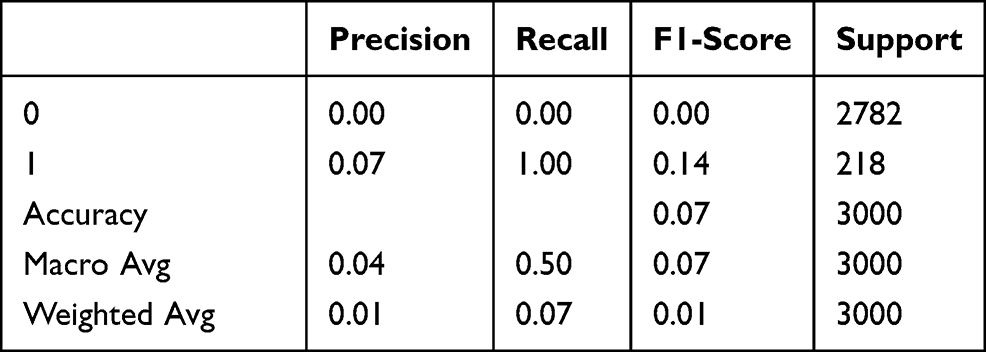 |
Table 2 Random Cut Forest Classification Report |
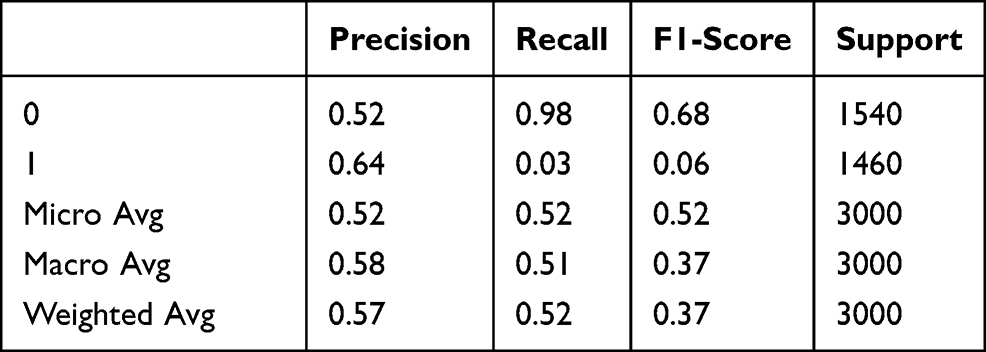 |
Table 3 Logistic Regression Classification Report |
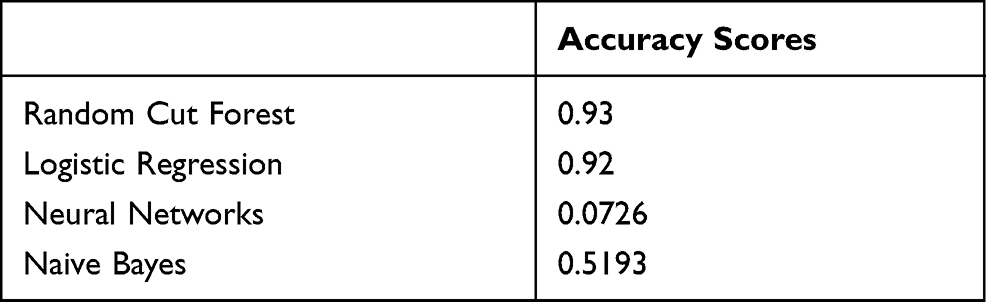 |
Table 4 Neural Networks Classification Report |
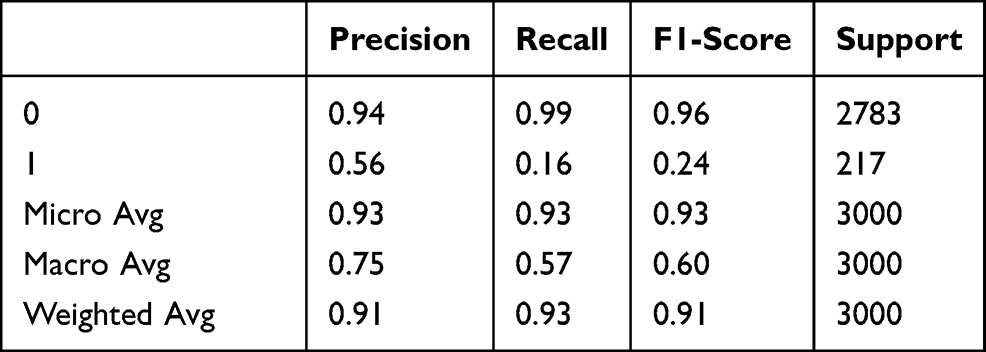 |
Table 5 Naive Bayes Classification Report |
There are several recommended measures for classification problems. These measures are formulated in four different possible situations for a positive example. If the prediction is already true, this is defined as a true positive; and if the prediction is negative but the sample is positive, it is defined as a false negative. For a negative sample, the prediction is defined as a true negative if it is negative; and we have a false positive sample if the estimate is also defined as positive. The formulas for these performance measures are presented in Table 1.
Classification Reports
The outputs of the tests are presented in Tables 2–6. When the tables are analysed, it can be seen how the metrics such as the precision, recall, and f1 score are in the 0 to 1 range.
The metrics presented are described below as items:
- Precision, a classifier does not label a sample that is actually negative as positive. It is defined as the ratio of true positives to the sum of true positives and false positives for each class.
- TP- True Positive Values: When a situation is predicting positive and positive.
FP- False Positives: When a situation is predicting negative but positive.
Precision: Accuracy of positive predictions.

- Recall: Recall is defined as the ability of a classifier to find all positive examples. It is defined as the ratio of true positives to the sum of true positives and false negatives for each class.
FN: False Negatives.
Recall True defined positive fraction.

- F1 Score: It is the harmonic average of the ratio of true positive values in cases where the best score is 1 and the worst is 0. In general, it is used to compare classifiers.

The classification report of the Random Cut Forest algorithm is presented in Table 2. The report shows the effect of data used for verification and prediction on metrics.
Table 3 shows the classification report of the Logistic Regression algorithm. If the report is examined; The effect of the data representing 30% of the data set on the metrics can be seen.
The classification report of the Neural Networks algorithm is as shown in Table 4. In the report; The effect of the data used for verification and prediction representing 30% of the data set on the metrics shown.
The classification report of the Naive Bayes algorithm is presented in Table 5. The effect of the data used for verification and prediction, which represents 30% of the data set, on the metrics is determined by the rates in the report.
Accuracy scores of classification algorithms are given in Table 6. According to the table, the accuracy scores are as follows: Random Cut Forest 0.93, Logistic Regression 0.92, Neural Networks 0.0726, Naive Bayes 0.5193
Data processing speeds of the random cut forest, logistic regression, neural networks, naive Bayes algorithms execution time, and CPU time are shown in Table 7 in milliseconds.
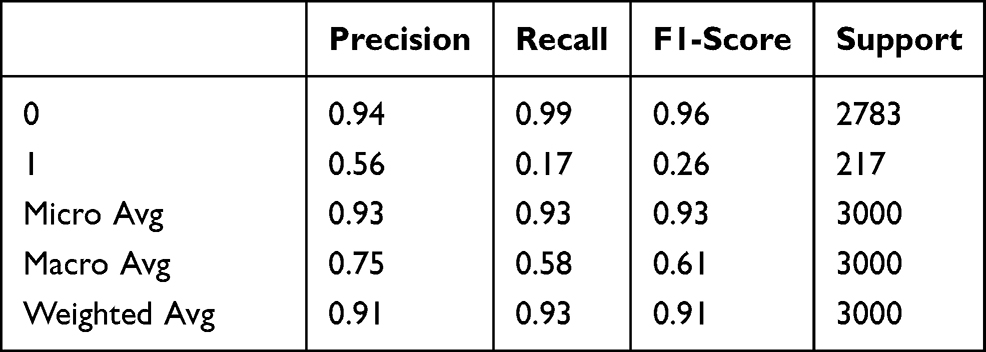 |
Table 6 Accuracy Scores |
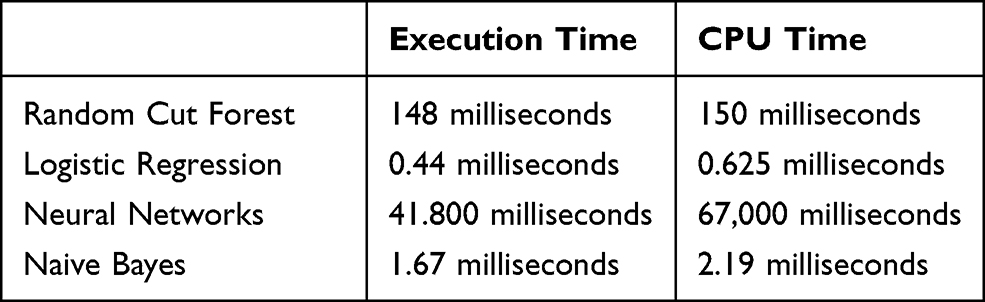 |
Table 7 Comparison of Data Processing Speed |
Performance Curve
The ROC curve is created by plotting the True Positive Rate (TPR) along the Y-axis and the False Positive Rate (FPR) along the X-axis at different threshold levels. Therefore, the ROC curve is the sensitivity as a function of the FPR. When TPR = 1 and FPR = 0, this indicates that the model is perfect. The Area Under the Curve (AUC) is applied to determine which algorithms predict the best results in the classification process.33 Figure 4 show the ROC Curves of Random Cut Forest, Figure 5 show the Auc Score of Random Cut Forest, Figure 6 show the ROC Curves of Logistic Regression, Figure 7 show the Auc Score of Logistic Regression, Figure 8 show the ROC Curves of Neural Network, Figure 9 show the Auc Score of Neural Network, Figure 10 show the ROC Curves of Naive Bayes, and Figure 11 show the Auc Score of Naive Bayes.
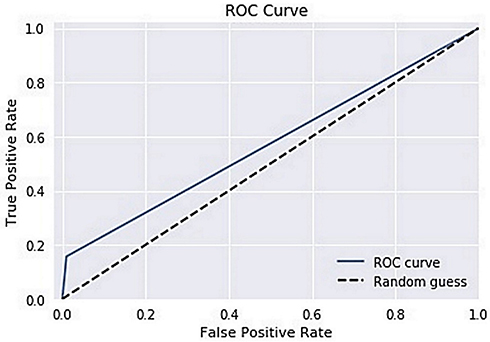 |
Figure 4 Random cut forest roc curve. |
 |
Figure 5 Random cut forest auc score. |
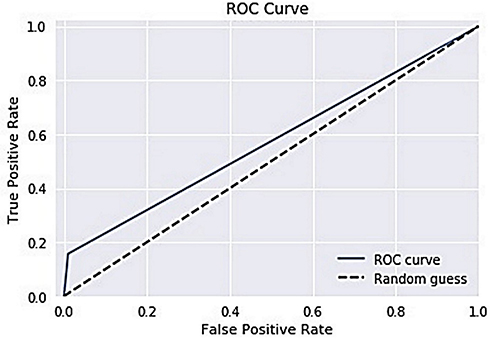 |
Figure 6 Logistic regression roc curve. |
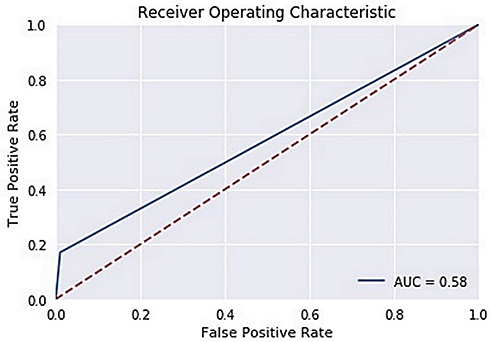 |
Figure 7 Logistic regression auc score. |
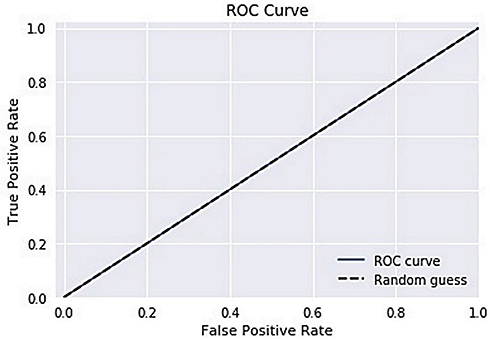 |
Figure 8 Neural network roc curve. |
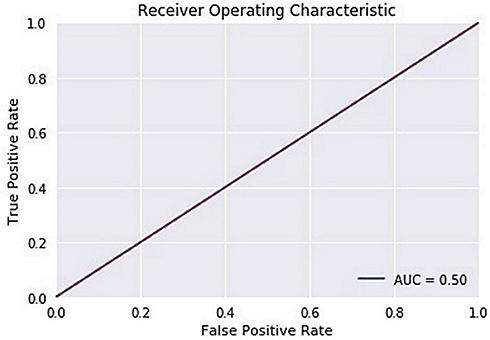 |
Figure 9 Neural network auc score. |
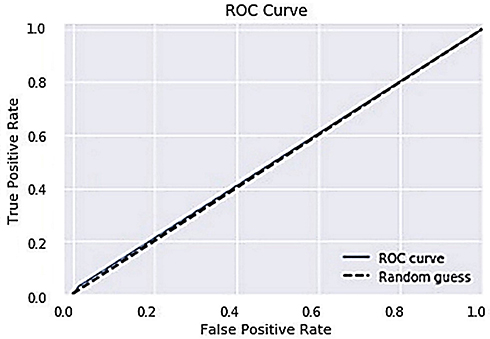 |
Figure 10 Naive Bayes roc curve. |
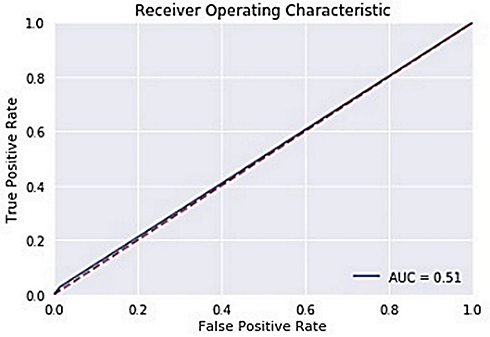 |
Figure 11 Naive Bayes auc score. |
Confusion Matrices
The confusion matrix of the random cut forest algorithm is presented in Figure 12. When the figure is formed, 30% of the data set is used, that is, 3000 data are used for the verification and estimation of the numerical distribution. For 2756 of the 3000 normal data, the algorithm determined that they were true positive data with “no anomaly” and normal data. Meanwhile, for 183 records that were normal data, the algorithm predicted that they were anomalies and false negatives. In the case of 27 anomalous data, the algorithm predicted that they were normal data, resulting in them being classified as false-positives; and 34 data were correctly classified as anomalies, which resulted in each of them being classified as a “true negative”.
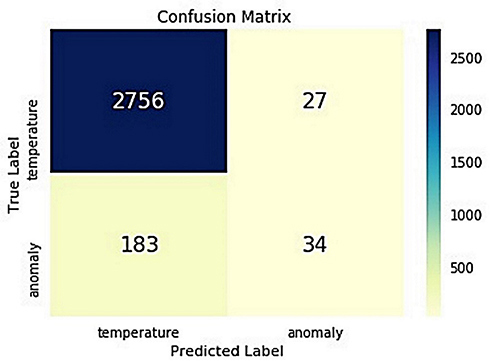 |
Figure 12 Random cut forest confusion matrix. |
 |
Figure 13 Logistic regression confusion matrix. |
Figure 13 contains the confusion matrix values of the Logistic Regression algorithm. This figure shows the distribution of 3000 data obtained from the data set, which were used for verification and prediction, on the confusion matrix. For 2754 of 3000 data used in verification and prediction, the algorithm predicted that they were each a “true positive” and not anomalous but were normal data. Meanwhile, for 180 of the records that were normal data, the algorithm predicted that they were anomalous and false negatives. Also, for 29 data that were anomalies, the algorithm predicted that they were normal data and thus false-positives; and 37 data were correctly predicted as anomalous and thus true negatives.
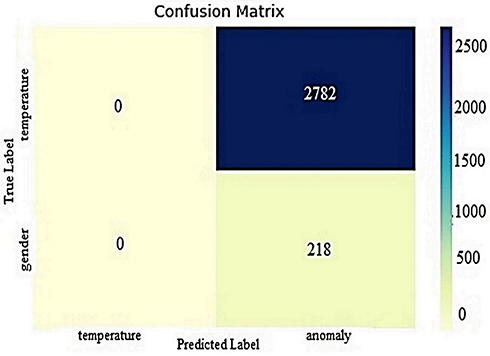 |
Figure 14 Neural network confusion matrix. |
The confusion matrix of the Neural Network algorithm is presented in Figure 14. When the figure is formed, 30% of the data set is used and the gender, temperature, and anomaly distributions of the data used for verification and prediction are seen. None of the 3000 data used in verification and prediction were detected as a true positives or false negatives. Meanwhile, for 2782 data that were anomalous, the algorithm predicted that they were normal and false positives; and the algorithm predicted 218 data that were anomalous as true negatives.
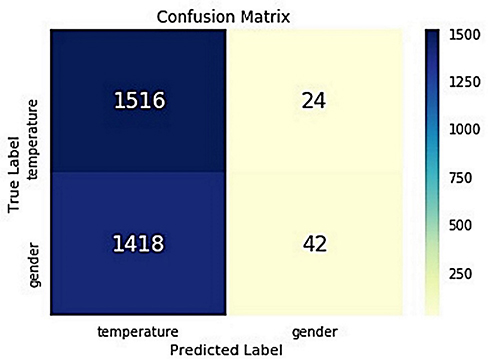 |
Figure 15 Naive Bays confusion matrix. |
The confusion matrix of the Naive Bayes algorithm is presented in Figure 15. The figure shows the distribution of the data representing 3000 gender and temperature data under the true labels and predicted labels. For 1516 of the 3000 data used in the verification and prediction that were normal data, the algorithm predicts them as normal data and true positives, not anomalous. For 1418 records that were normal data, the algorithm predicted that they were anomalous and false negatives. For 24 data that were anomalies, the algorithm predicted them as normal and false positives; and 42 data that were anomalies were correctly predicted by the algorithm and true negatives.
Discussion
In this study, we conducted anomaly detection and compared machine learning algorithms for IoT systems. AWS cloud services are used to simulate the comparison and performance tests of algorithms. In the study, the outputs obtained from the comparison and the simulation made on the AWS platform are presented. The simulation aimed to transfer the data generated by the temperature sensor randomly to the target with the most accurate results. A data stream is created with the produced data. The generated data stream is classified in real-time with the Random Cut Forest, Logistic Regression, Naive Bayes, and Neural Network algorithms. The algorithms allow the incoming data to be classified in real-time before reaching the target. The performance evaluation of the proposed approach is conducted using the precision, recall, and f1 score. This real-time process means that the big data generated by the data from the IoT sensing layer will be separated from the anomalous data. Also, the algorithms are examined in terms of their data processing speed and the results are discussed.
In our test results, the Random Cut Forest algorithm predicted 2756 records as normal temperature values according to gender and temperature. These are true predictions classified as true positives. On the other hand, 7% of its negative accuracy was due to its wrong predictions for temperature values, which were a total of 183 normal values that the algorithm detected as anomalies and thus false-positives. Similarly, the anomalies were successfully detected by the random cut forest as true negatives, including a total of 34 anomalies among the 3000 testing data; however, the accuracy also was affected by 7% due to its prediction of anomalous data records as normal temperature values, which included 27 in total that were False Negatives. Among the four algorithms that were a part of the performance test, the Random Cut Forest and Logistic Regression algorithms are the closest to each other. However, when the execution time and CPU time are examined as measures of the data processing time, the Random Cut Forest is evaluated as the third best. In addition, in terms of data processing speed, the Logistic Regression algorithm is ranked first, achieving better performance than the Random Cut Forest. Since the data processing speed and real-time performance are important criteria in IoT systems, it is a very important result that the Logistic Regression algorithm is more successful than other algorithms in terms of the data processing speed. Although it is very close to the RCF in terms of accuracy, its success in terms of speed is an indication that the LR algorithm will be successful in IoT systems.
The Neural Network algorithm did not perform well in the anomaly detection use case of our temperature dataset with multidimensional values. In the comparison of algorithms on the temperature data set, it performed the worst, meaning it was not good enough for the use case. It was accurate in its performance metrics for 3000 testing records, achieving only 0.0726 accuracy. The Neural Network was incorrect for the true positive class of data since it did not detect any value as being normal in the dataset. A total of 2782 records out of 3000 were detected as anomalies in the data set as False Positives. The performance on the normal temperature values class was very inaccurate, which results in its performance only being 0.0726. As with performance metrics, we concluded that the most unsuccessful algorithm in terms of data processing time is the neural network.
The performance of the Naïve Bayes algorithm was normal, and half of its predictions were correct. Overall, its accuracy was 0.5193. This algorithm performed well only for the class of normal temperature data values. 1516 total temperature records were detected as normal as true positives since it did not detect anomalies in the dataset. However, its performance was affected for the class of true anomalies since it has classified some normal temperature values as anomalies. Therefore, a total 1418 of records were considered to be anomalies in the temperature dataset even though they were normal values, and this makes them false positives. It performed well on the true anomalies in the data set since it successfully detected 24 anomalies correctly as true negatives. Contrary to its success in the performance metrics, the naive Bayes algorithm was second in terms of data processing speed, achieving better success than the Random Cut Forest and Logistic Regression algorithms.
Conclusion
Due to the spread of the internet of things, the increase in data production through sensors and generated data by data collection and processing makes it difficult to manage big data. Basically, structured data are precise and meaningful data. However, unnecessarily dense data resulting from semi-structured and unstructured data and damaged data are some of the reasons that make it difficult for data management to produce meaningful data. This study examines the work done within the scope of the IoT and Big Data. IoT concepts, technologies, and places in daily life are explained. In order to draw meaningful results from the big data created by IoT technology, the precautions to be taken are researched. The study investigates the relationship between the IoT and big data analysis. Big data mining techniques that can be useful in the IoT are identified through a literature review and sample studies. As a result of the evaluations, an approach is simulated for the effective management of the big data produced by IoT sources, and the performances of different algorithms are tested. The simulated approach is foreseen to contribute to important components such as volume, velocity, variety, veracity, and value, which are accepted as the 5 Vs of big data.
In this study, we made anomaly detection and performance analysis by using ML algorithms on IoT edges consisting of temperature, age, gender, weight, height, and time data. Our results show that using machine learning algorithms on IoT edges will help make effective and timely decisions in different IoT areas such as health, industry, agriculture, transportation, the automotive industry, logistics, security, and the defence industry. Data filtering and data analysis processes for data pre-processing at IoT edges make the resulting data stream more accurate and reliable. Thus, the big data generated by the IoT sensing layer in healthcare domains will be formed at a more manageable level. Also, thanks to this, service providers, users, and other interested sides will be minimally affected by the negative effects of anomalous data.
Disclosure
The authors report no conflicts of interest in this work.
References
1. Taneja T, Jatain A, Bajaj SB. Predictive Analytics on IOT.
2. Ahmed M, Choudhury S. Big data analytics for internet of things; 2018. Available from: https://www.researchgate.net/publication/323163119.
3. Acharjya DP, Kauser AP. A survey on big data analytics: challenges, open research issues and tools. Int J Adv Comput Sci Appl. 2016;7:511–518.
4. Gupta P, Gupta R. Data mining framework for IoT applications. Int J Comput Appl. 2017;174(2):4–7. doi:10.5120/ijca2017915316
5. Eugene S, Thannassıs T, Wendy H. Analytics for the internet of things: a survey. ACM Comput Surv. 2018;1(1): 1–36. Article 1. Publication date: January 2018.
6. Manogaran G, Varatharajan R, Lopez D, et al. A new architecture of internet of things and big data ecosystem for secured smart healthcare monitoring and alerting system. Future Gener Comput Syst. 2018;82:375–387. doi:10.1016/j.future.2017.10.045
7. Yasmin F, Payam B, Rahim T. An adaptive method for data reduction in the internet of things.
8. Elhoseny M, Abdelaziz A, Salama AS, Riad AM, Muhammad K, Sangaiah AK. A hybrid model of internet of things and cloud computing to manage big data in health services applications. Future Gener Comput Syst. 2018;86:1383–1394. doi:10.1016/j.future.2018.03.005
9. Heba A, Mohammed E, Shereif B. Big data on internet of things: applications, architecture, technologies, techniques, and future directions. Int J Comput Sci Eng. 2015;4(6):300–3013. ISSN: 2319-7323.
10. Nilamadhab M, Chung-Chih L, Hsien-Tsung C. A cognitive adopted framework for IoT big-data management and knowledge discovery prospective. Int J Distrib Sens Netw. 2015;11(10):718390. doi:10.1155/2015/718390
11. Marjani M, Nasaruddin F, Gani A, et al. Big IoT data analytics: architecture, opportunities, and open research challenges. IEEE Access. 2017;5:5247–5261. doi:10.1109/access.2017.2689040
12. Rehman MH, Yaqoob I, Salah K, et al. The role of big data analytics in the industrial internet of things. Future Gener Comput Syst. 2019;99:247–259. doi:10.1016/j.future.2019.04.020
13. Abdulsalam Y, Shailendra S, Hossain MS, Ghulam M. IoT big data analytics for smart homes with fog and cloud computing. Future Gener Comput Syst. 2019;91:563–573. doi:10.1016/j.future.2018.08.040
14. Sadia D, Anand P. Erratum to “Smart health monitoring and management system: toward autonomous wearable sensing for the internet of things using big data analytics. Future Gener Comput Syst. 2019;91(2019):611–619. doi:10.1016/j.future.2017.12.059
15. Priyadarshini SB, BhusanBagjadab A, Mishra BK. The role of IoT and big data in modern technological arena: a Comprehensive Study. Intell Syst Ref Libr. 2018:13–25. doi:10.1007/978-3-030-04203-5_2
16. Ranjan R, Thakker D, Haller A, Buyya R. A note on exploration of IoT generated big data using semantics. Future Gener Comput Syst. 2017;76:495–498. doi:10.1016/j.future.2017.06.032
17. Li X, Dai HN, Wang Q, Imran M, Li D, Imran MA. Securing internet of medical things with friendly-jamming schemes. Comput Commun. 2020;160(2020):431–442. doi:10.1016/j.comcom.2020.06.026
18. Sai PY, Harika P. Illustration of IoT with big data analytics. Glob J Comput Sci Technol. 2017;17(3). Version I.
19. O’Leary DE. Big data’, the ‘internet of things’ and the ‘internet of signs. Intell Syst Account Finance Manag. 2013;20(1):53–65. doi:10.1002/isaf.1336
20. Ahmed E, Yaqoop I, Hashem IAT, et al. The role of big data analytics in internet of things. Comput Netw. 2017;129(Part 2):459–471. doi:10.1016/j.comnet.2017.06.013
21. Saldatos J. Building blocks for iot analytics internet-of-things analytics. Vol. 10. Published, sold and distributed by River Publishers Alsbjergvej; 2017:9260.
22. Ge M, Bangui H, Buhnova B. Big data for internet of things: a survey. Future Gener Comput Syst. 2018;87:601–614. doi:10.1016/j.future.2018.04.053
23. Ahmed E, Rehmani MH. Mobile edge computing: opportunities, solutions, and challenges. Future Gener Comput Syst. 2017;70:59–63. doi:10.1016/j.future.2016.09.015
24. Tsai C-W, Lai C-F, Chao H-C, Vasilakos AV. Big data analytics: a survey. J Big Data. 2015;2(1):1–32. doi:10.1186/s40537-015-0030-3
25. Wlodarczak P, Ally M, Soar J. Data Mining in Iot, Association for Computing Machinery. ACM; 2017. ISBN 978-1-4503-4951.
26. Aly H, Elmogy M, Barakat S. Big data on internet of things: applications, architecture, technologies, techniques, and future directions. Int J Comput Sci Eng. 2015;4:300–313. ISSN: 2319-7323.
27. Gubbi J, Buyya R, Marusic S, Palaniswami M. Internet of Things (IoT): a vision, architectural elements, and future directions. Future Gener Comput Syst. 2013;29(7):1645–1660. doi:10.1016/j.future.2013.01.010
28. Chen F, Deng P, Wan J, Zhang D, Vasilakos AV, Rong X. Data mining for the internet of things: literature review and challenges. Int J Distrib Sens Netw. 2015;2015:14.
29. Naveen S, Hegde SG. Study of IoT: understanding IoT architecture, applications, issues and challenges. Int J Adv Netw Appl. 2019. ISSN: 0975-0282. Available from: https://www.ijana.in/Special%20Issue/S105.pdf. Accessed Aug 10, 2021.
30. Sha K, Yang TA, Wei W, Davari S. A survey of edge computing-based designs for IoT security. Digit Commun Netw. 2020;6(2):195–202. doi:10.1016/j.dcan.2019.08.006
31. Kim DY, Jeong YS, Kim S. Data-filtering system to avoid total data distortion in IoT networking. Symmetry. 2017;9:16. doi:10.3390/sym9010016
32. Alpaydın E. Introduction to Machine Learning, 2nd Ed.p. Cm. The MIT Press; 2010.
33. Shitole AS, Devare MH. TPR, PPV, and ROC based performance measurement and optimization of human face recognition of IoT enabled physical location monitoring. Int J Recent Technol Eng. 2019;8(2):3582–3590. ISSN: 2277-3878.
 © 2021 The Author(s). This work is published and licensed by Dove Medical Press Limited. The
full terms of this license are available at https://www.dovepress.com/terms
and incorporate the Creative Commons Attribution
- Non Commercial (unported, 3.0) License.
By accessing the work you hereby accept the Terms. Non-commercial uses of the work are permitted
without any further permission from Dove Medical Press Limited, provided the work is properly
attributed. For permission for commercial use of this work, please see paragraphs 4.2 and 5 of our Terms.
© 2021 The Author(s). This work is published and licensed by Dove Medical Press Limited. The
full terms of this license are available at https://www.dovepress.com/terms
and incorporate the Creative Commons Attribution
- Non Commercial (unported, 3.0) License.
By accessing the work you hereby accept the Terms. Non-commercial uses of the work are permitted
without any further permission from Dove Medical Press Limited, provided the work is properly
attributed. For permission for commercial use of this work, please see paragraphs 4.2 and 5 of our Terms.