Back to Journals » Cancer Management and Research » Volume 11
A six-mRNA prognostic model to predict survival in head and neck squamous cell carcinoma
Authors Tian S, Meng G, Zhang W
Received 1 September 2018
Accepted for publication 15 November 2018
Published 20 December 2018 Volume 2019:11 Pages 131—142
DOI https://doi.org/10.2147/CMAR.S185875
Checked for plagiarism Yes
Review by Single anonymous peer review
Peer reviewer comments 4
Editor who approved publication: Dr Ahmet Emre Eşkazan
Saisai Tian,1 Guofeng Meng,2 Weidong Zhang1,2
1Department of Phytochemistry, School of Pharmacy, Second Military Medical University, Shanghai 200433, People’s Republic of China; 2Institute of Interdisciplinary Integrative Medicine Research, Shanghai University of Traditional Chinese Medicine, Shanghai, People’s Republic of China
Background: Transcriptional dysregulation is one of the most important features of cancer genesis and progression. Applying gene expression dysregulation information to predict the development of cancers is useful for cancer diagnosis. However, previous studies mainly focused on the relationship between a single gene and cancer. Prognostic prediction using combined gene models remains limited.
Materials and methods: Gene expression profiles were downloaded from The Cancer Genome Atlas and the data sets were randomly divided into training data sets and test data sets. A six-gene signature associated with head and neck squamous cell carcinoma (HNSCC) and overall survival (OS) was identified according to a training cohort by using weighted gene correlation network analysis and least absolute shrinkage and selection operator Cox regression. The test data set and gene expression omnibus (GEO) data set were used to validate this signature.
Results: We identified six candidate genes, namely, FOXL2NB, PCOLCE2, SPINK6, ULBP2, KCNJ18, and RFPL1, and, using a six-gene model, predicted the risk of death of head and neck squamous cell carcinoma in The Cancer Genome Atlas. At a selected cutoff, patients were clustered into low- and high-risk groups. The OS curves of the two groups of patients had significant differences, and the time-dependent receiver operating characteristics of OS, disease-specific survival (DSS), and progression-free survival (PFS) were as high as 0.766, 0.731, and 0.623, respectively. Then, the test data set and the GEO data set were used to evaluate our model, and we found that the OS time in the high-risk group was significantly shorter than in the low-risk group in both data sets, and the receiver operating characteristics of test data set were 0.669, 0.675, and 0.614, respectively. Furthermore, univariate and multivariate Cox regression analyses showed that the risk score was independent of clinicopathological features.
Conclusion: The six-gene model could predict the OS of HNSCC patients and improve therapeutic decision-making.
Keywords: gene expression dysregulation, TCGA, six-gene model, OS
Introduction
Head and neck cancer originates from the oral cavity, tongue, lip, gum, oropharynx, nasopharynx, and hypopharynx.1 Head and neck squamous cell carcinoma (HNSCC) accounts for more than 90% of head and neck cancers and is the most common cancer in the world, causing 350,000 deaths every year.2,3 Furthermore, the 5-year survival rate of patients with this disease is lower than 50%.4 However, in the past decade, there has been no significant improvement in the prognosis of HNSCC patients.5,6 Recent studies have found that tobacco use and human papillomavirus (HPV) status in patients with HNSCC had significant prognostic correlations.3,7–9
Transcriptional dysregulation is a common feature of cancer genesis and development.10 For instance, it was reported that forkhead box Q1 was closely related to pancreatic cancer, where its high-expression level correlates with a poor prognosis.11 Forkhead box F2 was downregulated in esophageal squamous cell carcinoma, and low-expression levels were associated with poor prognosis.12 Additionally, it was demonstrated that U3 small nucleolar ribonucleoprotein was upregulated in various cancers, and its levels are significantly associated with the survival of HNSCC patients.3,13 However, previous studies mainly focused on the relationship between a single gene and cancer. Due to this limitation in robustness, predicting models can result in false predictions. Prognostic prediction using combined gene models remains limited.
In this study, we applied weighted gene correlation network analysis (WGCNA) and least absolute shrinkage and selection operator (LASSO) Cox regression to identify a six-gene signature associated with HNSCC development and overall survival (OS) according to a training cohort.14 The test data set and gene expression omnibus (GEO) data set were used to validate this signature, and we also demonstrated that this signature was independent from other clinical factors, including sex and age. In the training and validation data sets, patients with high-risk scores have relatively poor prognosis and receiver operating characteristic (time-dependent ROC) of OS is up to 0.766 and 0.669 in the training data set and test data set, respectively. Meanwhile, we found that the six genes had a close relationship with tumor grade, which was supported using linear regression analysis. In summary, we integrated WGCNA and LASSO Cox regression to develop a six-gene model, which could be a new prognostic marker significantly associated with prognosis and tumor grade in HNSCC.
Materials and methods
Data collection and preprocessing
The workflow of this analysis procedure is shown in Figure 1. The raw count data of HNSCC patients were downloaded from The Cancer Genome Atlas (TCGA) project (https://tcga-data.nci.nih.gov/tcga/), including 502 HNSCC patient samples and 44 control samples. The related clinical information for 502 patients was obtained from cBioportal (http://www.cbioportal.org/) and TCGA Clinical Data Resource (https://www.cell.com/cms/10.1016/j.cell.2018.02.052/attachment/f4eb6b31-8957-4817-a41f-e46fd2a1d9c3/mmc1.xlsx). After excluding the samples in which the neoplasm histologic grade could not be assessed (GX) or those without OS information, 478 samples were included in this study. The detailed information about clinical data of the 478 samples is shown in supplementary material S2.
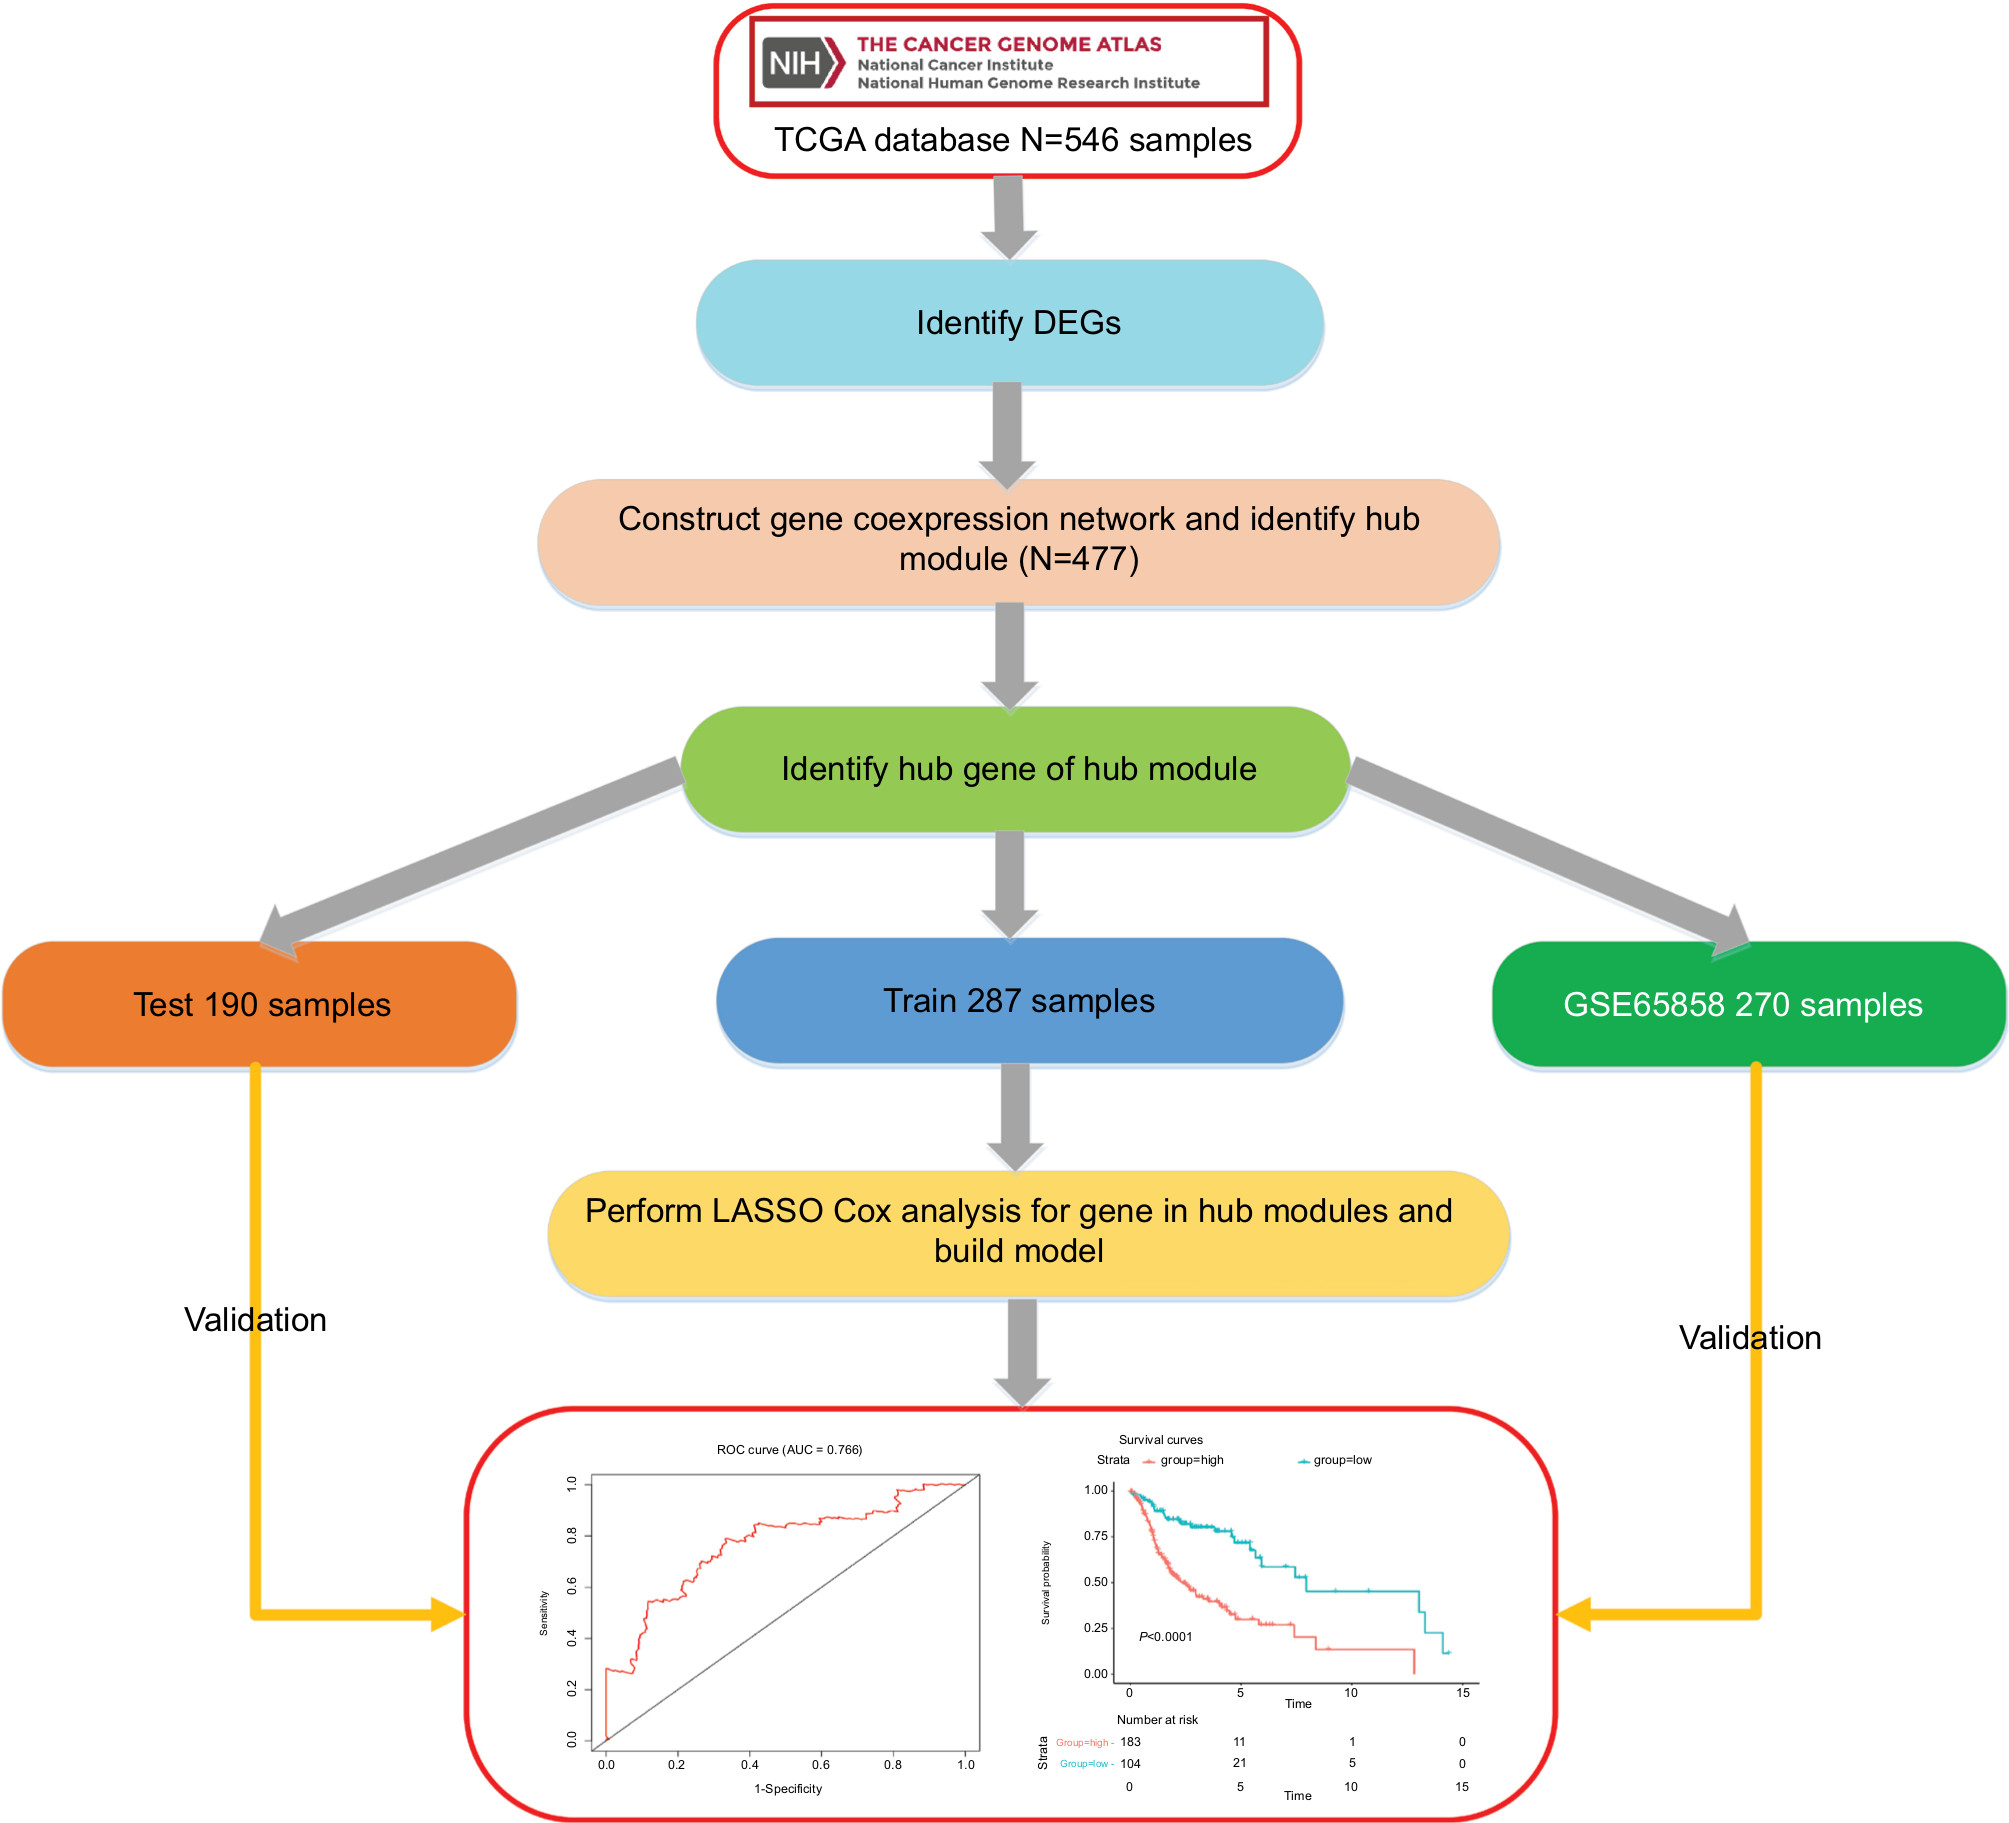 | Figure 1 Flow diagram of the analysis procedure: data collection, preprocessing, analysis, and validation. Abbreviations: DEGs, differentially expressed genes; ROC, receiver operating characteristic; TCGA, The Cancer Genome Atlas. |
Differential expression analysis
The differentially expressed genes (DEGs) of HNSCC were identified using “DESeq2” R package at a cutoff |log2 fold change|>1 and Padj < 0.01 (P-value adjusted for multiple testing using Benjamini–Hochberg method).
Construction of gene coexpression network
First, the counts data were normalized by the variance-stabilizing transformation algorithm implemented in DEseq2 package.15–17 Then, before network analysis, the HNSCC data were evaluated by clustering to check if there were any obvious outliers. After removing the outliers, 477 samples were retained, and the WGCNA package was used to construct the coexpression network.14,18 All other statistical information for the remaining samples are summarized in Table S1. In this study, we calculated Pearson’s correlation matrices and average linkage method for all pairwise genes. Then, a weighted adjacency matrix was constructed using a power function amn = |Cmn|β (Cmn=Pearson’s correlation between gene m and gene n; amn=adjacency between gene m and gene n). Parameter β is used to penalize weak correlations and emphasize strong correlations between genes. After choosing the appropriate β, the adjacency was transformed into a topological overlap matrix, and average linkage hierarchical clustering was performed according to the topological overlap matrix-based dissimilarity measure.19,20 In our study, we chose a minimum module size (gene group) of 30 for the gene dendrogram and a cutline (0.25) for the module dendrogram, and we merged some modules.20
Identification of clinically significant modules
We identified the modules related to clinical traits using two approaches. The module eigengene (ME) of a module, calculated by the first principal component of the module, was used to represent the overall expression level of the module. Correlations between MEs and clinical traits were calculated to identify the cancer-relevant module. Then, gene significance (GS) was defined as the log10 transformation of the P-value (GS=logP) in the linear regression between gene expression and a clinical trait. In addition, the average GS for all the genes in a module was regarded as module significance (MS), and among all the modules, the module with the maximal absolute MS was regarded as the one related to clinical traits.
Construction of a weighted OS predictive score model
We randomly divided the data into training data sets (N=287) and test data sets (N=190). A Cox model was built using the LASSO algorithm with the training data set.21 To find an optimal λ, tenfold cross-validation with minimum criteria was employed, and the λ with the smallest cross-validation error was chosen.22,23 Other parameters were set to default values. Finally, six genes were identified, and a formula for the risk score was constructed by using a linear combination of six genes weighted by the LASSO method in the training data sets. The LASSO Cox regression modeling was performed using the R package “glmnet”.24,25 A hazards model was constructed as follows:
|
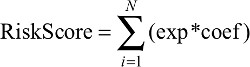
where N is the number of genes, exp was the expression value of gene, and coef was the coefficient of mRNA in the LASSO Cox regression analysis.
Gene set enrichment analysis
In the entire data set, samples of HNSCC were divided into two groups according to the optimal cutoff value. This included 307 high-risk samples and 170 low-risk samples. To identify the potentially altered pathways in the high-risk group, we performed gene set enrichment analysis (GSEA) to search Kyoto encyclopedia of genes and genomes26 (KEGG) pathways using the package “clusterProfiler”27,28 in R. Explicitly, we constructed a preranked gene list of all expressed genes ordered by log2 fold change from the DESeq2 package in two groups. Significant pathways with P-values<0.05 were identified.
Statistical analyses
We calculated a risk score for each patient in the training data set and divided the patients into high-risk and low-risk groups by using the optimal risk score (–1.0) as a cutoff determined by X-tile plots.29,30 Then, survival analysis was performed using the Kaplan–Meier method, and two-sided log rank tests were used to assess the differences in OS between the high-risk and low-risk patient groups. The sensitivity and specificity of the model was evaluated by using ROC curves. K–M survival curves and time-dependent ROC curve analyses were conducted on the survival, survminer, and survival ROC packages.31–33 Finally, we verified the confidence of the model using test data sets and entire data sets. Additionally, we conducted univariate Cox regression and multivariable Cox regression analyses to check whether the risk score was a prognostic factor within the available data. Meanwhile, linear regression analyses for the six genes in the entire data sets found that the six genes were highlighted, with P-values significantly <0.05. In all tests, a statistical significance was defined as a P-value <0.05, and all analyses were performed using the R program (www.r-project.org).34
Results
Weighted coexpression network to identify the modules
We identified the input genes for coexpression network analysis by differential expression analysis. A total of 4,663 DEGs (2,282 upregulated and 2,381 downregulated) were selected at the threshold of |log2 fold change|>1 and Padj < 0.01 (Figure S1). After filtering the samples without suitable clinical information, 478 HNSCC samples were used. Then, we performed the first quality check, and one sample was removed from the TCGA data set for the subsequent analysis (Figure S2). At the same time, five types of clinical data, including histological grade, survival months, survival status, age, and sex of HNSCC patients, were used for clinical analysis.
Applying the WGCNA package, the DEGs were analyzed for coexpression network analysis, and the power of b=4 (scale free R2=0.93) was selected to ensure a scale-free network, and finally, a total of 16 modules were identified (Figure S3A–E). Then, two methods were applied to test the association of each module with HNSCC progression. Modules with a larger MS were considered to have more connection with disease progression. We found that the ME of the yellow module also showed the highest GS (Figure 2A). In addition, the ME in the yellow module showed a higher correlation with disease progression than other modules (Figure 2B). Therefore, the yellow module with tumor progression was identified as the clinically significant module, which was selected for further analysis.
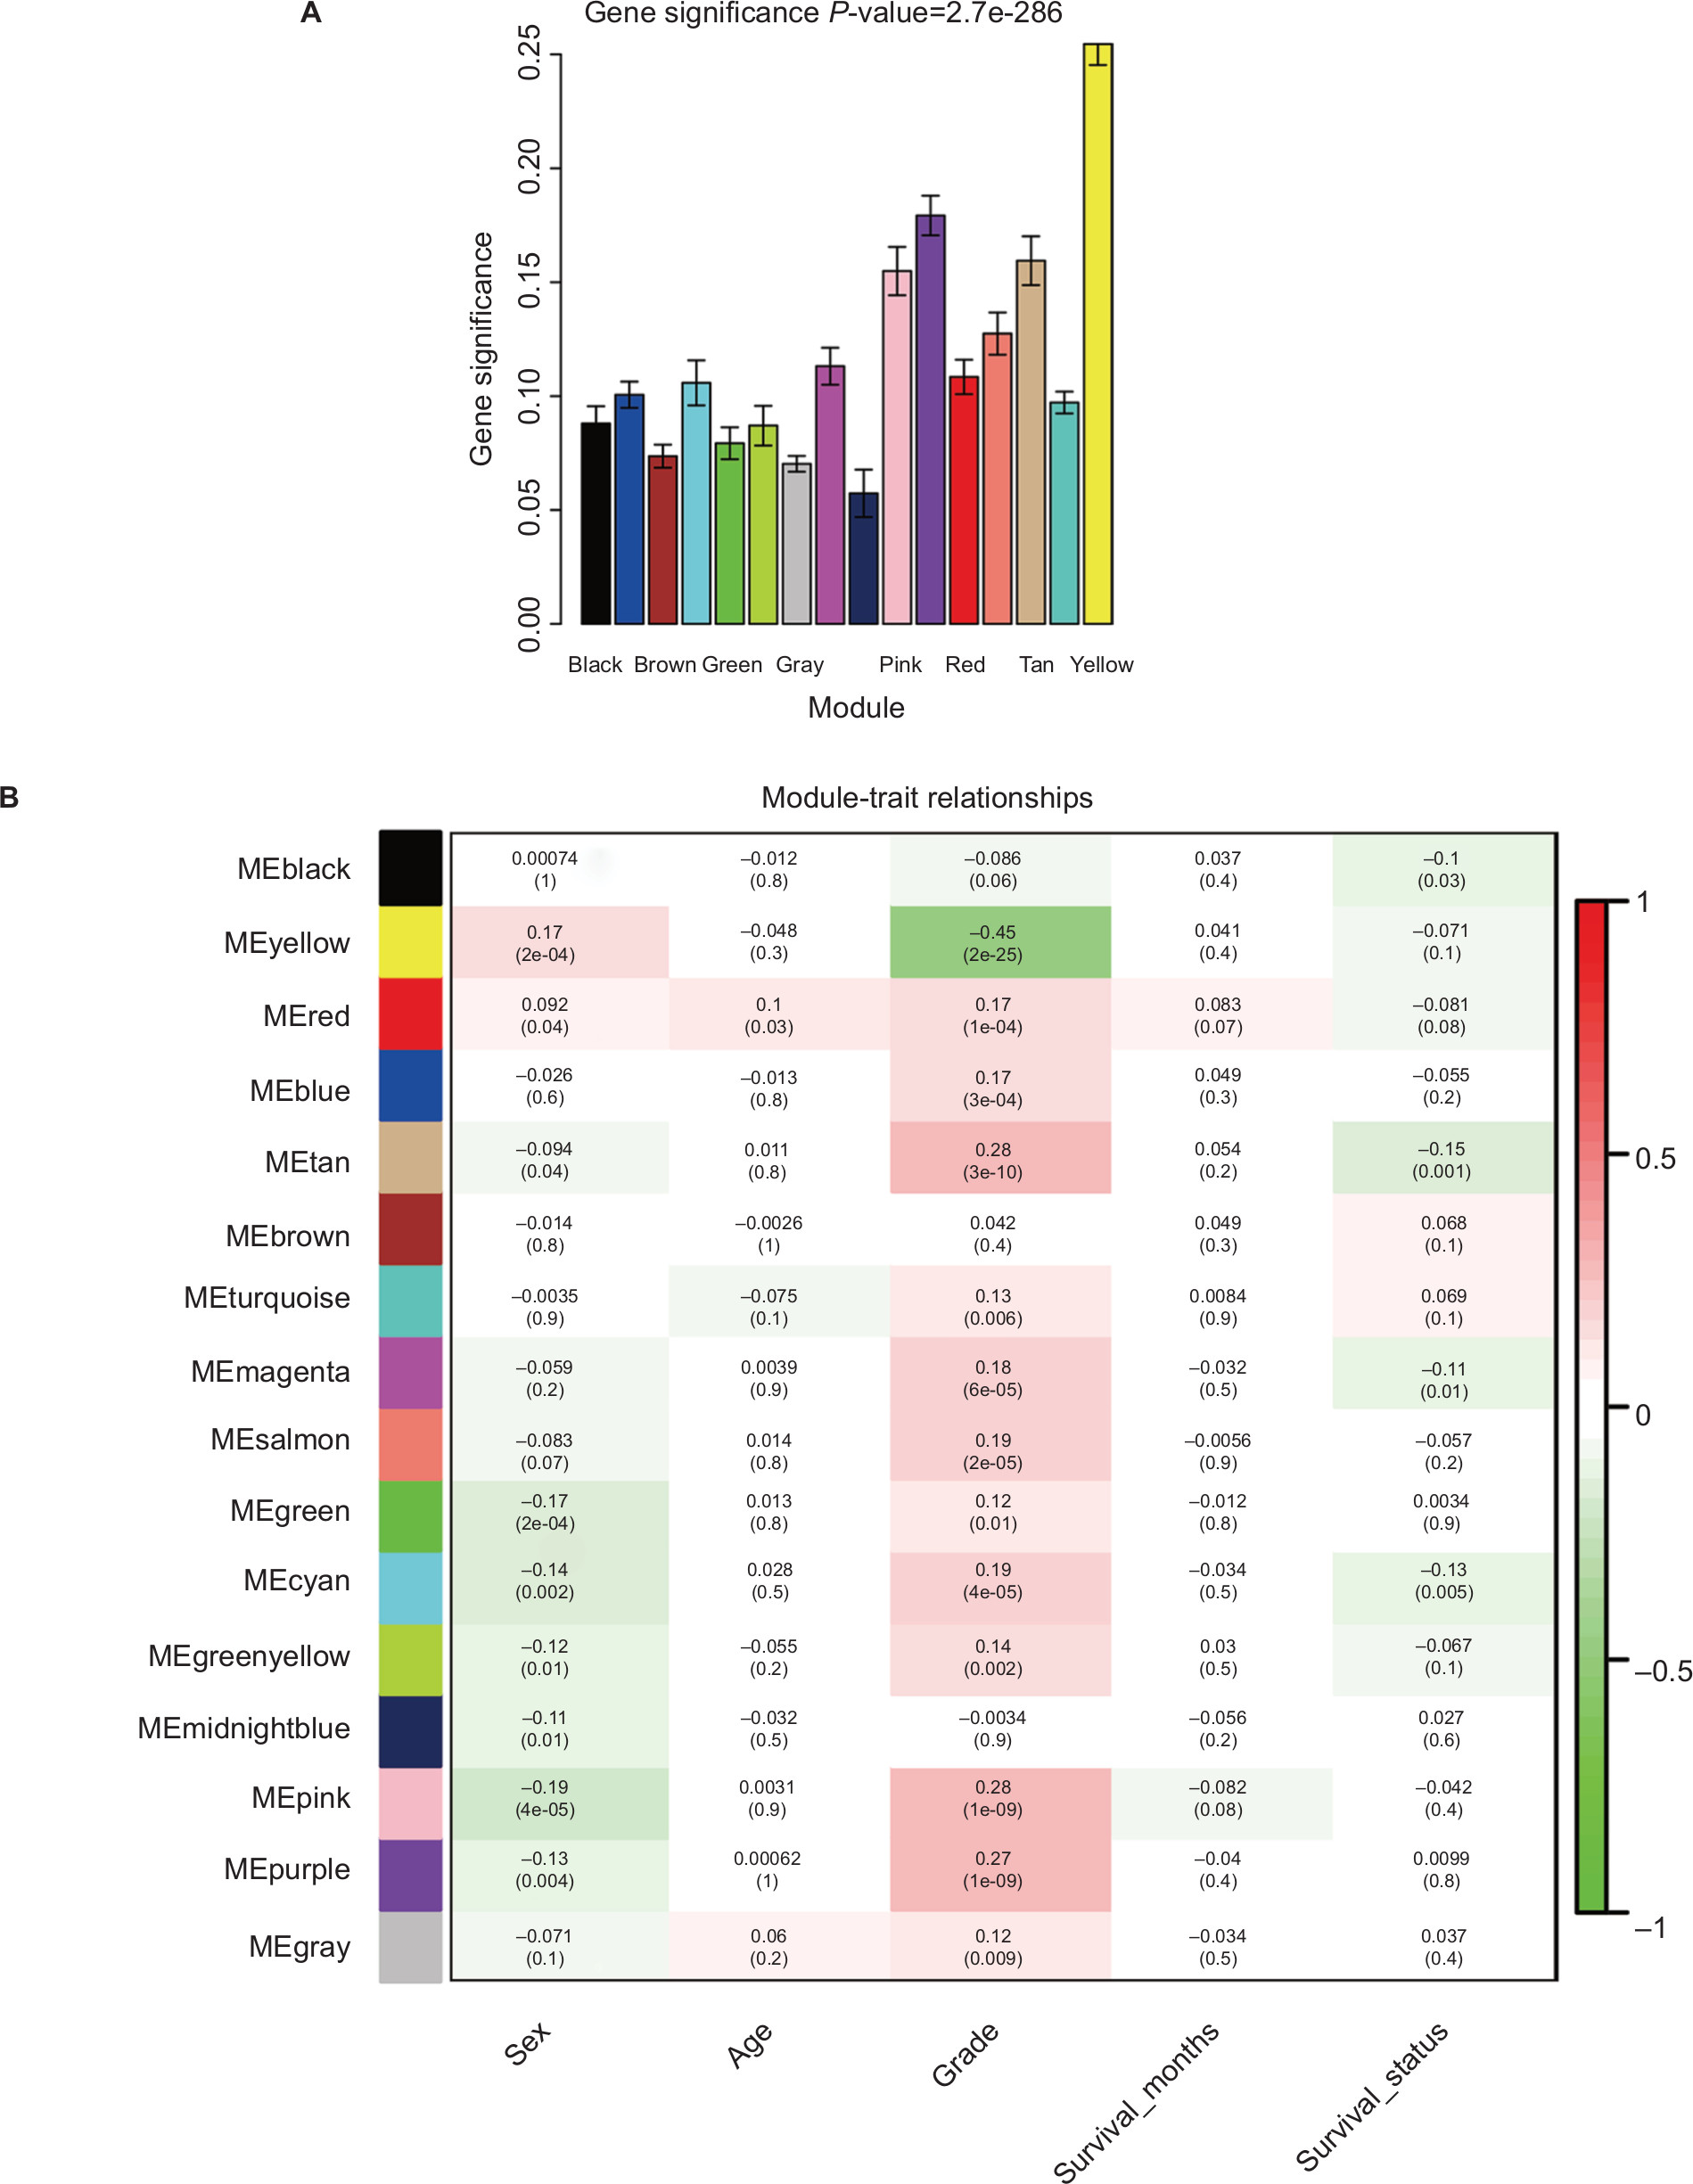 | Figure 2 Identification of modules associated with the clinical traits of HNSCC. Notes: (A) Distribution of average GS and errors in the modules associated with progression of HNSCC. (B) Heatmap of the correlation between MEs and clinical traits of HNSCC. Abbreviations: GS, gene significance; HNSCC, head and neck squamous cell carcinoma; ME, module eigengene. |
Six genes associated with the OS of HNSCC patients
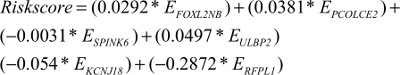
We performed LASSO Cox regression to identify genes associated with HNSCC OS time by using hub module genes in the training data set. At the optimal λ=0.0810 in the LASSO Cox regression model, the ten fold cross-validation error was minimal (Figure S4). LASSO coefficient profiles of the hub module genes are shown in Figure S5. Finally, six genes were identified owing to their nonzero regression coefficients. By linearly combining the six mRNAs weighted by their coefficients, a hazards model was constructed as a formula of six genes:
|
where EFOXL2NB is the expression value of FOXL2NB. The rest are similar. According to the optimal risk score –1.0 as the cutoff determined by X-tile plots version 3.6.1 (Yale University School of Medicine, New Haven, CT, USA; Figure S6), the patients were divided into a low-risk group and a high-risk group, and we found that the OS time of the low-risk group was significantly longer than that of the high-risk group (Figure 3A). Meanwhile, the 5-year survival ROC curve of risk score was as high as 0.766 (Figure 3B). The similar results were observed for DSS and PFS between the low-risk and high-risk groups. The 5-year survival ROC curve of risk score were 0.731 and 0.623, respectively, demonstrating a good performance for survival prediction (Figure 3C–F). The six gene’s expression, detailed risk score, and survival information were displayed (Figure 3G–I). Additionally, since the training data set and the test data set are from the same overall data set, we used the entire data set to obtain more reliable results and achieve a larger sample size. We performed linear regression analyses to verify the relationship between tumor progression and the expression of all the six genes. According to the results, we found that all six genes were highlighted, with P-values significantly <0.05 (Figure S7).
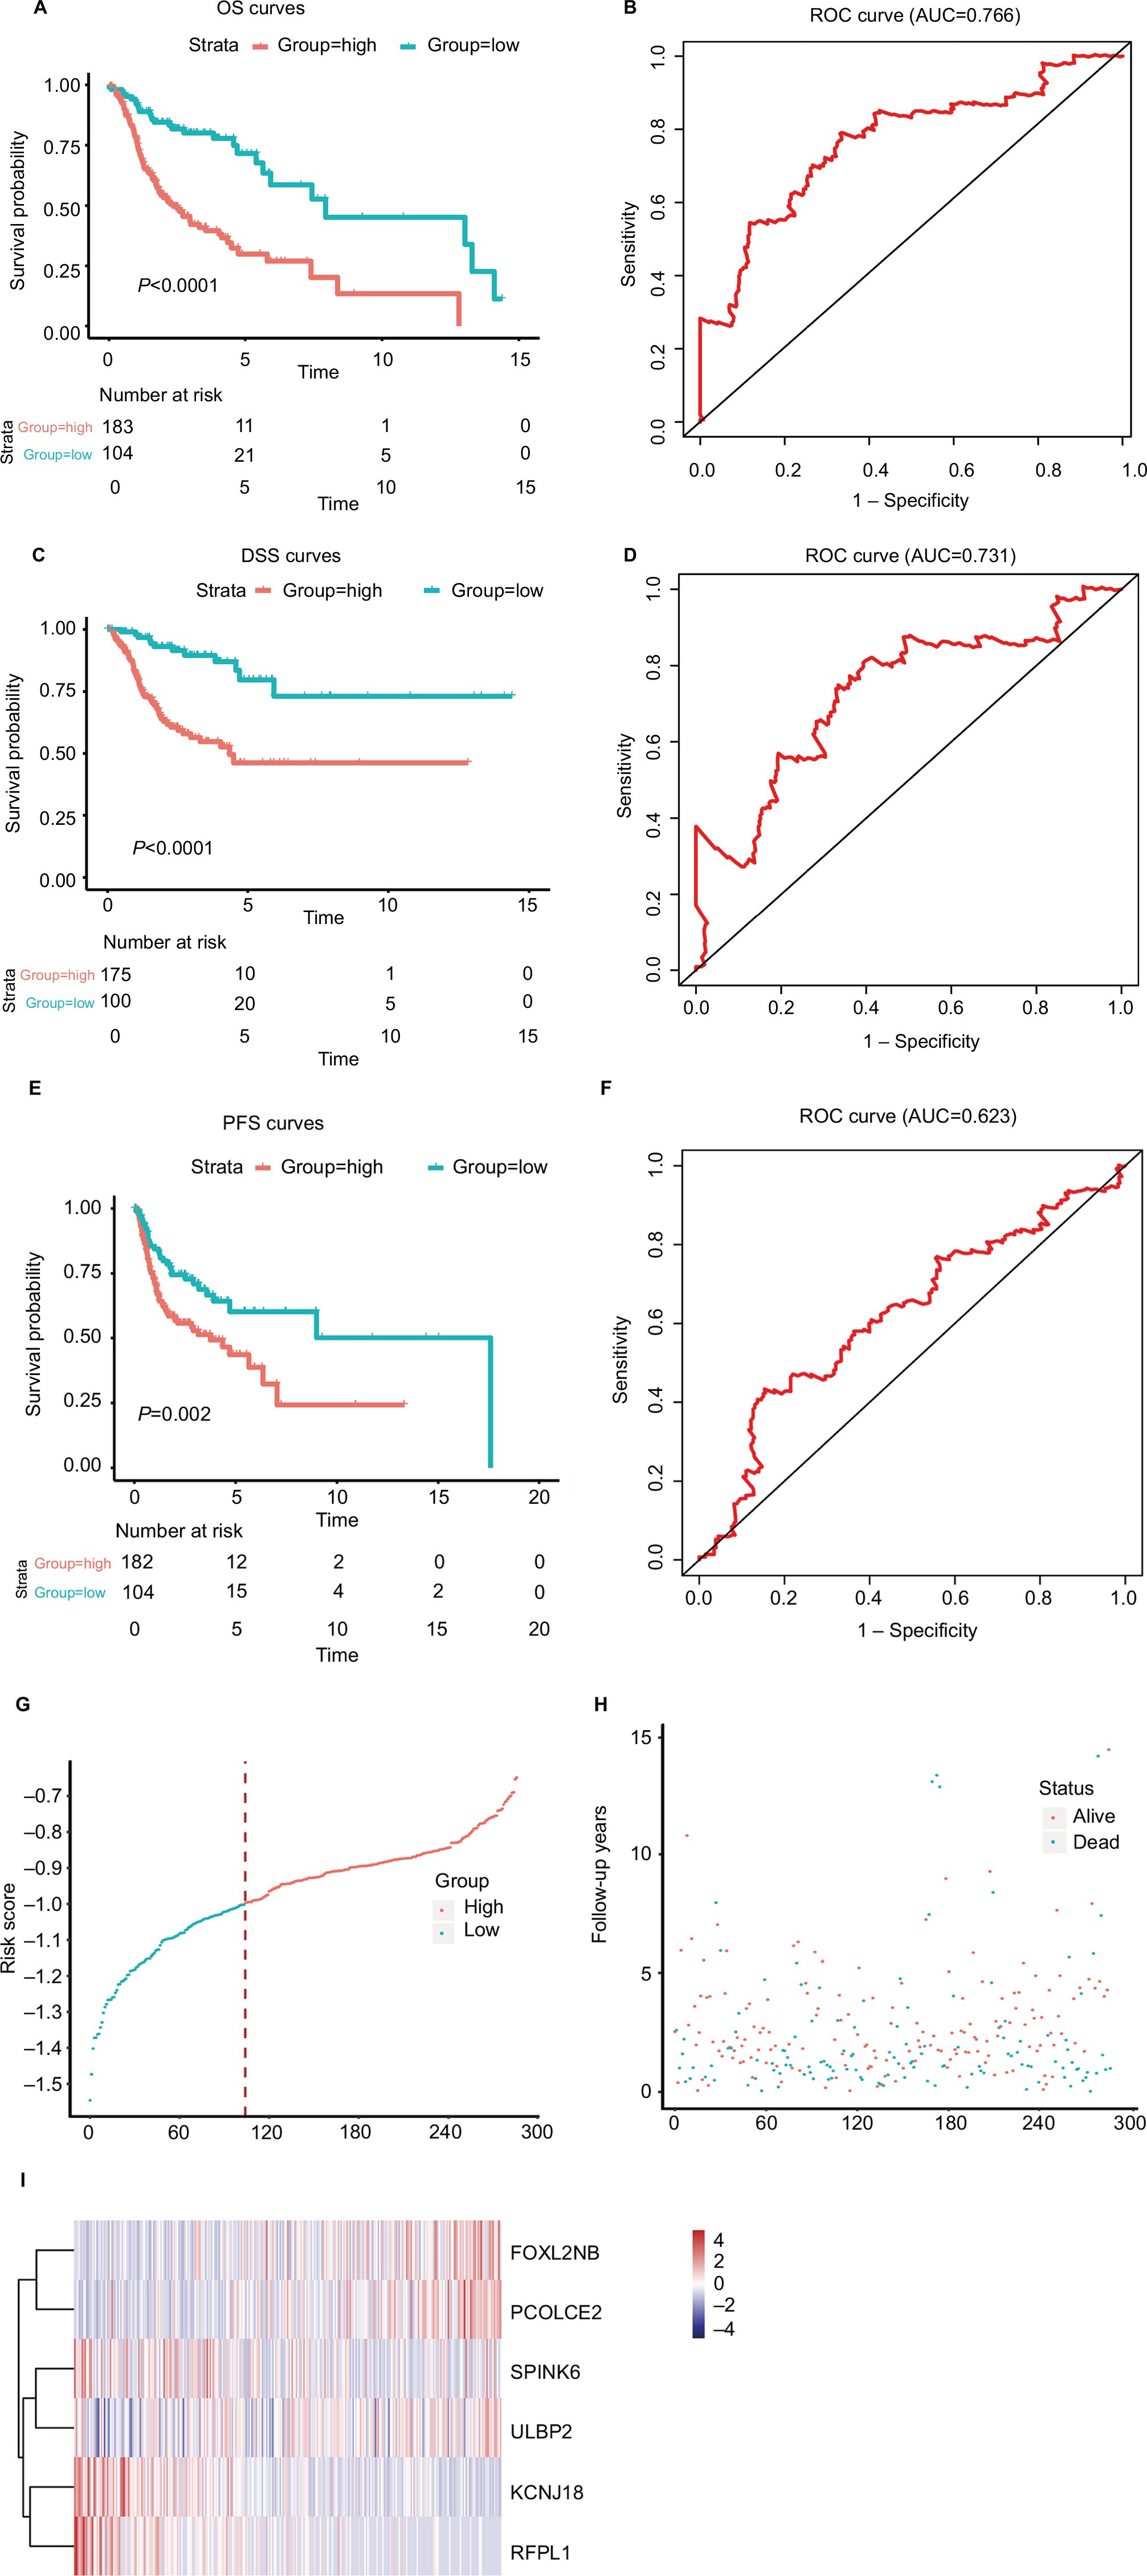 | Figure 3 The risk score performance in the training data sets. Notes: (A-F) The survival plot and the 5-year survival ROC curve of OS, DSS, and PFS. (G–I) The relationship between risk score, survival information, and z-score transformed expression values are shown (top-down, FOXL2NB, PCOLCE2, SPINK6, ULBP2, KCNJ18, and RFPL1). Abbreviations: AUC, area under the curve; DSS, disease-specific survival; OS, overall survival; PFS, progression-free survival; ROC, receiving operating characteristic. |
Validation of the six-mRNA signature model using the test data set and GEO data set
To further verify the robustness of the hazards model, the performance of the hazards model was evaluated in the test data set (N=190). We used the same risk formula to calculate risk scores for HNSCC patients. Using the same cutoff value, patients were divided into low-risk and high-risk groups. Consistent results were observed that the OS, DSS, and PFS of the high-risk group were all significantly shorter than that of the low-risk group in the test group (P<0.05). The area under the curve (AUC) of time-dependent ROC curves for the test group was 0.669, 0.675, and 0.614, at 5 years, respectively (Figure S8A–F). Risk scores, relative expression levels, and survival information of the patients are also shown in this paper (Figure S8G–I). In addition, an independent microarray data sets GSE65858 and corresponding clinical data of 270 HNSCC patients were used to assess the prognostic power of the six-mRNA signature model developed in the TCGA data set.35 The Kaplan–Meier analyses indicated that the OS time in the high-risk group was significantly shorter than that in the low-risk group (P<0.01). Meanwhile, the model could accurately distinguish high-risk patients from low-risk patients (Figure S8J).
Risk score, radiation, different HNSCC sites, HPV status, and other clinicopathological information for prognosis
To obtain a better understanding of the clinical significance of the six-gene signature in HNSCC, in the entire data set (N=477), we correlated the signature with a series of clinicopathological parameters, which include gender, age, alcohol, smoke, pathological tumor-node-metastasis (pTNM) stage, HPV status, radiotherapy, and histologic grade. As show in Table 1, the risk score is significantly associated with alcohol, pTNM stage, grade, and radiotherapy, while independent from age, gender, HPV status, and smoke. Meanwhile, to assess whether the prognostic ability of the six-gene signature was independent of other clinical features, univariate and multivariate Cox regression analyses were performed for the training data set. The result of univariate Cox regression indicated that the risk score was significantly associated with OS (high-risk group vs low-risk group, HR=3.314, 95% CI=2.135–5.145, P<0.01, n=287). Additionally, in multivariable Cox regression, the risk score also has a significant relationship with OS (high-risk group vs low-risk group, HR=3.302, 95% CI=2.080–5.242, P<0.01, n=287). Then, the same analysis was also performed in the test data set and a similar result was observed in this data set (Table 2). These results demonstrated that the prognostic ability of the six-gene was independent of other clinical features.
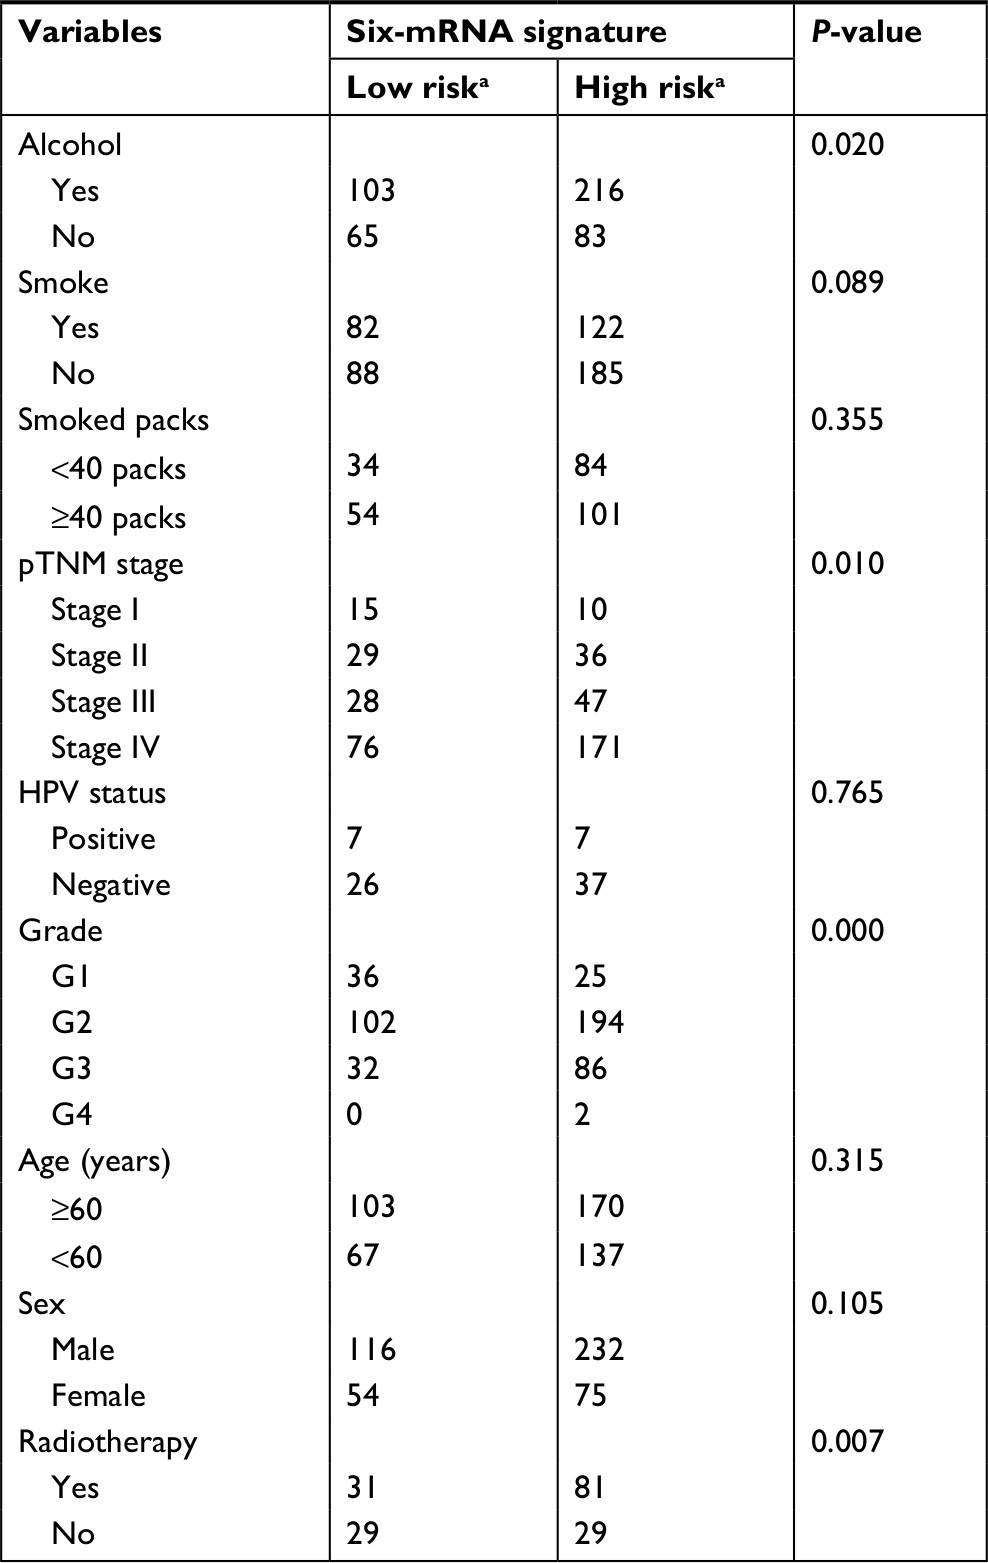 | Table 1 Association of the six-mRNA signature with clinicopathological characteristics in HNSCC patients (n=477) Notes: aLow risk refers to ≤ cutoff value of risk score, high risk refers to > cutoff value of risk score; the chi-squared test; P-value <0.05 was considered significant. Abbreviations: HNSCC, head and neck squamous cell carcinoma; HPV, human papillomavirus; pTNM, pathological tumor-node-metastasis.. |
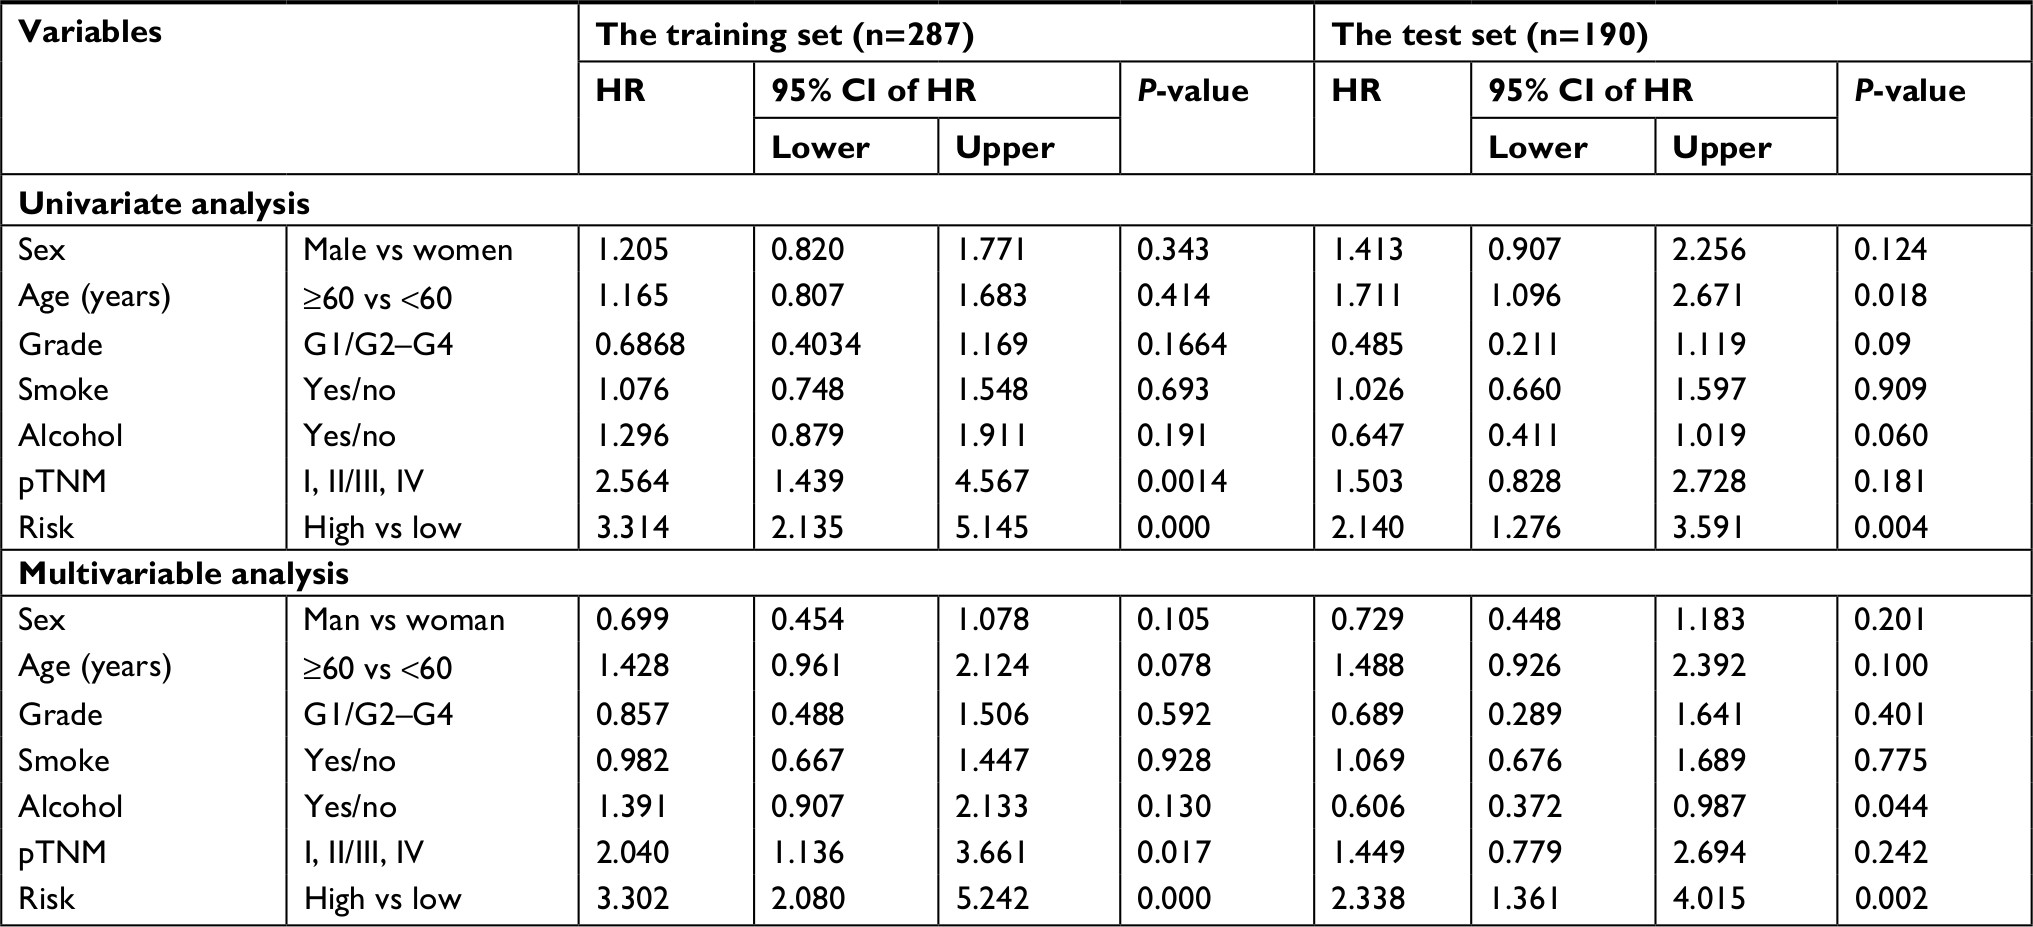 | Table 2 Univariable and multivariable Cox regression analyses of the six-mRNA signature and survival of HNSCC patients in the training, test, and entire group Abbreviations: HNSCC, head and neck squamous cell carcinoma; pTNM, pathological tumor-node-metastasis. |
Since the six-mRNA signature might have different adaptability for various HNSCC sites,36,37 the six-mRNA signature model was assessed in larynx and oral tongue cancers. The Kaplan–Meier and ROC analyses revealed that patients in the high-risk group had significantly shorter OS and DSS compared with patients in the low-risk group in both larynx and oral tongue cancers (P<0.001), which indicated a good predictive performance (AUC was 0.798, 0.757, 0.704, and 0.767, respectively; Figure S9). In addition, HPV-positive patients were more likely than HPV-negative patients to have better survival.38 According to Table 1, we found that there was no association between six-mRNA signature and HPV status. Considering the fact that HPV-positive patients had small sample size (n=14), we performed the Kaplan–Meier and ROC analyses in HPV-negative patients (n=63). The six-mRNA signature could distinguish high-risk patients from low-risk patients with high accuracy in HPV-negative patients (Figure S10). In the clinical practice, radiotherapy is the most common adjuvant of HNSCC treatment. To evaluate whether risk score is also suitable for patients underwent radiotherapy, we performed the Kaplan–Meier analysis. The results showed that the radiotherapy-treated HNSCC patients with high risk score had a significantly shorter survival rate than ones with low risk score (Figure S11). This suggests that the risk score is also feasible for the prognosis of HNSCC patients with radiotherapy.
Altered pathways in high- and low-risk score group
GSEA was performed to identify the potential pathways that differentiate the high-/low-risk groups (Table S2). According to the results, we found that “Calcium signaling pathway”, “cGMP–PKG signaling pathway”, “PI3K–Akt signaling pathway”, “DNA replication”, “Rap1 signaling pathway” and “TNF signaling pathway” were significantly enriched (P-value <0.05; Figure 4), suggesting that the six-mRNA-based risk score may influence these pathways and thus predict the survival of HNSCC patients.
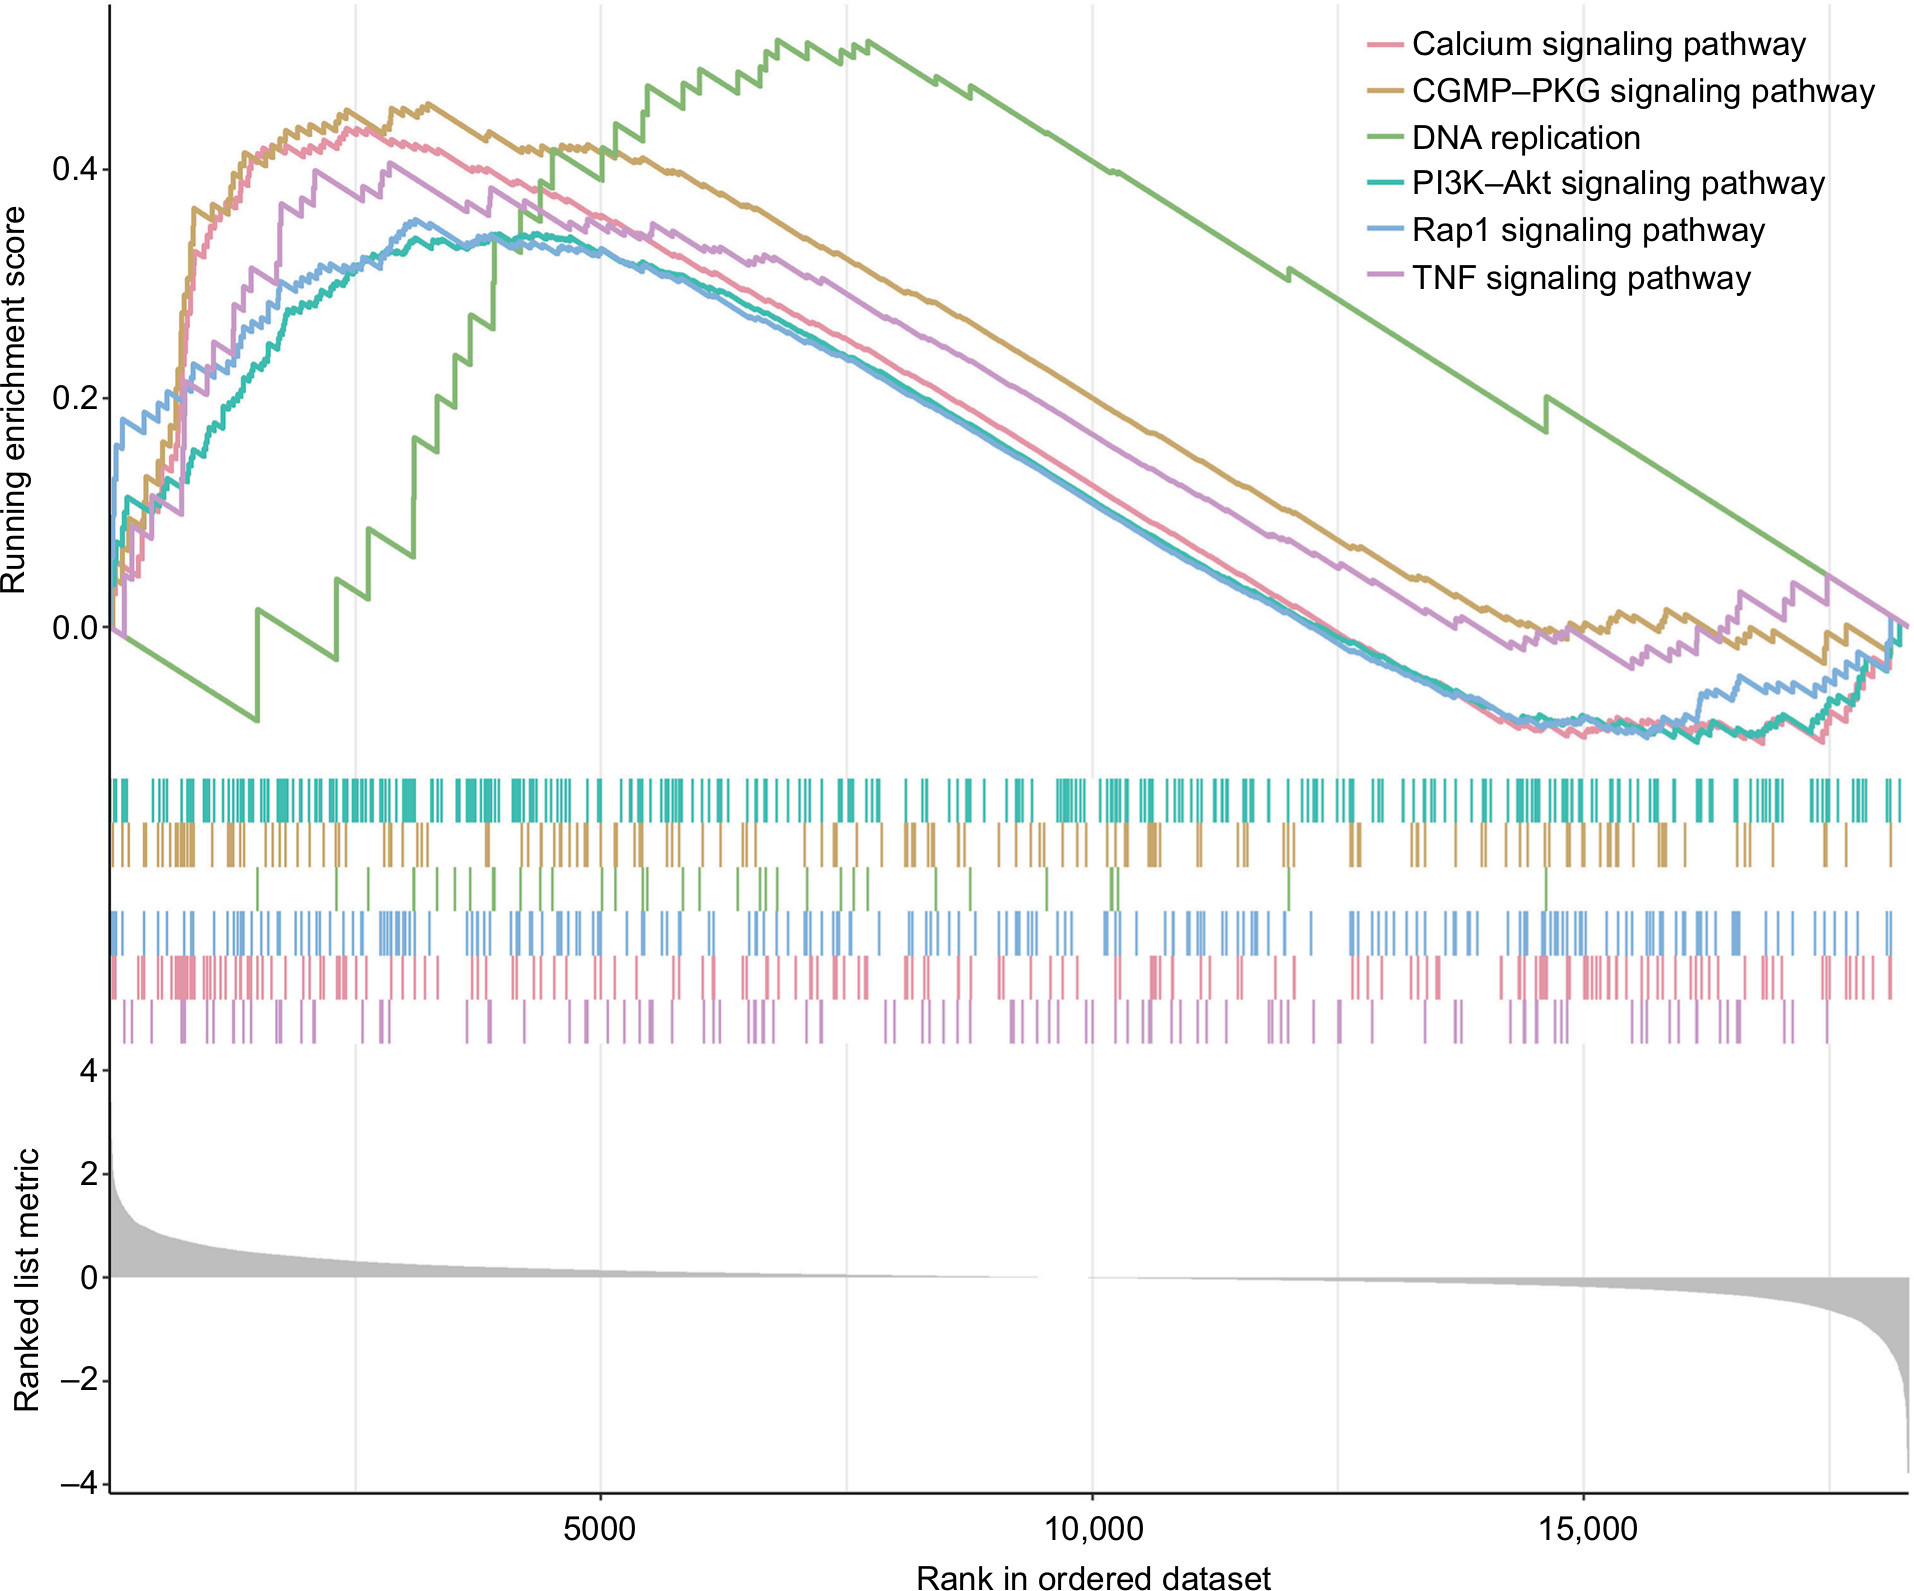 | Figure 4 GSEA performed identify the potential pathways that differentiate the high-/low-risk groups. Note: The graphs depict only the six common functional gene sets enriched in HNSCC samples. Abbreviations: GSEA, gene set enrichment analysis; HNSCC, head and neck squamous cell carcinoma. |
Discussion
In this paper, we applied a weighted coexpression network and found 16 modules base on DEGs from HNSCC. The correlation analyses were performed, and the yellow module showed the best correlation with tumor grade. As tumor grade always affects tumor prognosis, we then performed LASSO Cox regression to identify the key genes from hub module genes.39–41 Finally, a six-gene signature consisting of FOXL2NB, PCOLCE2, SPINK6, ULBP2, KCNJ18, and RFPL1 was identified from hub module genes in the training data set (n=287). The signature could also be used to classify HNSCC patients into low-risk and high-risk groups, which usually have significant differences in OS, DSS and PFS, and ROC is as high as 0.766, 0.731, and 0.623. These results suggested that this signature had a good performance in its survival predictions. Simultaneously, we evaluated the robustness of the model in the test data set and GEO data set. All of them suggested that the model was particularly good in accuracy. We also found significant differences (P<0.05) for each gene in the model across different tumor grades. To assess the independence of the six-mRNA signature in predicting OS, we performed univariate and multivariate Cox regression analyses.42,43 After adjusting the effects of age, grade, smoke, alcohol, and pathological tumor stage in the regression analysis, the risk scores of patients based on the six mRNA signature maintained a good correlation with OS. Overall, these results confirmed the prognostic power of the six-gene model for predicting the OS of HNSCC patients, and it was independent of other clinical features.
As for the characteristics of six mRNAs, the overexpression of FOXL2NB, PCOLCE2, and ULBP2 was associated with shorter OS (coefficient>0), whereas the overexpression of remaining SPINK6, KCNJ18, and RFPL1 was associated with longer OS (coefficient <0). Recently, some studies have revealed important roles in cancer progression of the six genes. For example, the altered expression of FOXL2NB was reported to be associated with cancer.44 In addition, the expression of FOXL2NB was driven by FOXL2, which suppresses proliferation, invasion and promotes apoptosis of cervical cancer cells.45,46 PCOLCE2 promotes the enzymatic cleavage of type I procollagen to yield mature structured fibrils.47–49 Importantly, PCOLCE2 protein was detectable at appreciable levels in the ascites of ovarian cancer patients.48 It was found that PCOLCE2 was involved in regulating adhesion and can predict tumors with high risk of developing metastasis within 43 months, establishing potential prognostic value.50,51 SPINK6 promotes nasopharyngeal carcinoma cellular motility in vitro and metastasis in vivo via autocrine and paracrine mechanisms.52 In addition, SPINK6 may also play an important role in epithelial to mesenchymal transition regulation, which is a crucial process involved in development and differentiation, as well as motility of cancer cells, by binding to EGFR and activating EGFR and downstream AKT signaling pathway.53 Cell surface ULBP2 was the NKG2D ligand most widely and strongly expressed by lung cancer cells, especially with non-small cell lung cancer cells.54 Also, serum surface ULBP2 was detectable in lung cancer patients and it also was a prognosis indicator of ovarian cancer and melanoma.54–56 It also was a novel tumor marker to evaluate the risk of pancreatic cancer patients.57 RFPL1 is a primate-specific target gene of Pax6, which is notably a key transcription factor for pancreas, eye and neocortex development.58 RFPL1 inhibited HeLa cells proliferation through delaying cells entry into mitosis.59 It has been found that RFPL1 was an antiproliferative gene, which downregulated cyclin B1 and Cdc2 expression and controlled G2–M phase transition thereby lengthened G2 phase in HeLa cells.58
However, some limitations should be highlighted in our study. In this study, we just chose DEGs for coexpression analysis. They may be associated with OS in HNSCC. Then, big sample size allows a linear regression analysis to study the relationship between the expression level of six genes and tumor grade in the entire data set. Third, currently, only limited data can be used for performance evaluation and it is necessary to collect more data set for a more comprehensive evaluation. Finally, experimental studies is needed to investigate the functional roles and confirm the presence of gene products of the six genes in HNSCC by immunohistochemistry in future work.
In summary, we integrated coexpression network analysis and LASSO Cox regression to build a prognostic model. This model was validated in the test data set and in the entire data set. Our analysis results indicated its good performance in HNSCC prognosis. Functional annotation suggested that the selected genes may reflect the impact of some HNSCC related pathways, such as “Calcium signaling pathway”, “cGMP–PKG signaling pathway”,60 “PI3K–Akt signaling pathway”,61 “DNA replication”,62,63 “Rap1 signaling pathway”64 and “TNF signaling pathway”.65 Our findings will have important clinical implications for improving risk stratification, therapeutic decision-making and prognosis prediction in patients with HNSCC.
Conclusion
This is the first work to report a novel six-mRNA prognostic model on HNSCC prognosis and demonstrate the possible mechanism of this signature.
Acknowledgment
The work was supported by Professor of Chang Jiang Scholars Program, NSFC (81520108030, 21472238), Shanghai Engineering Research Center for the Preparation of Bioactive Natural Products (16DZ2280200), the Scientific Foundation of Shanghai China (13401900103, 13401900101), and the National Key Research and Development Program of China (2017YFC1700200).
Disclosure
The authors report no conflicts of interest in this work.
References
Forastiere A, Koch W, Trotti A, Sidransky D. Head and neck cancer. N Engl J Med. 2001;345(26):1890–1900. | ||
Torre LA, Bray F, Siegel RL, Ferlay J, Lortet-Tieulent J, Jemal A. Global cancer statistics, 2012. CA Cancer J Clin. 2015;65(2):87–108. | ||
Guo W, Chen X, Zhu L, Wang Q. A six-mRNA signature model for the prognosis of head and neck squamous cell carcinoma. Oncotarget. 2017;8(55):94528. | ||
Gollin SM. Cytogenetic alterations and their molecular genetic correlates in head and neck squamous cell carcinoma: a next generation window to the biology of disease. Genes Chromosomes Cancer. 2014;53(12):972–990. | ||
Pfister DG, Ang KK, Brizel DM, et al. Head and neck cancers. J Natl Compr Canc Netw. 2011;9(6):596–650. | ||
Kamangar F, Dores GM, Anderson WF. Patterns of cancer incidence, mortality, and prevalence across five continents: defining priorities to reduce cancer disparities in different geographic regions of the world. J Clin Oncol. 2006;24(14):2137–2150. | ||
Benson E, Li R, Eisele D, Fakhry C. The clinical impact of HPV tumor status upon head and neck squamous cell carcinomas. Oral Oncol. 2014;50(6):565–574. | ||
Katiyar SK. Emerging phytochemicals for the prevention and treatment of head and neck cancer. Molecules. 2016;21(12):1610. | ||
Ang KK, Harris J, Wheeler R, et al. Human papillomavirus and survival of patients with oropharyngeal cancer. N Engl J Med. 2010;363(1):24–35. | ||
Meng G, Mei H. Transcriptional dysregulation study reveals a core network involving the genesis for Alzheimer’s disease. bioRxiv. 2017;240002. | ||
Zhan HX, Xu JW, Wang L, Wu D, Zhang GY, Hu SY. FoxQ1 is a novel molecular target for pancreatic cancer and is associated with poor prognosis. Curr Mol Med. 2015;15(5):469–477. | ||
Zheng YZ, Wen J, Cao X, et al. Decreased mRNA expression of transcription factor forkhead box F2 is an indicator of poor prognosis in patients with resected esophageal squamous cell carcinoma. Mol Clin Oncol. 2015;3(3):713–719. | ||
Clauditz TS, Wang CJ, Gontarewicz A, et al. Expression of insulin-like growth factor II mRNA-binding protein 3 in squamous cell carcinomas of the head and neck. J Oral Pathol Med. 2013;42(2):125–132. | ||
Langfelder P, Horvath S. WGCNA: an R package for weighted correlation network analysis. BMC Bioinformatics. 2008;9(1):559. | ||
Anders S, Huber W. Differential expression analysis for sequence count data. Genome Biol. 2010;11(10):R106. | ||
Love M, Anders S, Huber W. Differential analysis of count data: the DESeq2 package. Genome Biol. 2014;151186(550):10. | ||
Love M, Anders S, Huber W. Package ‘DESeq2’. 2013. | ||
Zhou Z, Liu S, Zhang M, et al. Overexpression of topoisomerase 2-alpha confers a poor prognosis in pancreatic adenocarcinoma identified by co-expression analysis. Dig Dis Sci. 2017;62(10):2790–2800. | ||
Botía JA, Vandrovcova J, Forabosco P, et al. An additional k-means clustering step improves the biological features of WGCNA gene co-expression networks. BMC Syst Biol. 2017;11(1):47. | ||
Rahmani B, Zimmermann MT, Grill DE, et al. Recursive indirect-paths modularity (RIP-M) for detecting community structure in RNA-Seq co-expression networks. Front Genet. 2016;7:80. | ||
Goeman JJ. L1 penalized estimation in the Cox proportional hazards model. Biom J. 2010;52(1):70–84. | ||
Li Q, Bai H, Chen Y, et al. A fully-automatic multiparametric radiomics model: towards reproducible and prognostic imaging signature for prediction of overall survival in glioblastoma multiforme. Sci Rep. 2017;7(1):14331. | ||
Haddad AQ, Luo JH, Krabbe LM, et al. Prognostic value of tissue-based biomarker signature in clear cell renal cell carcinoma. BJU Int. 2017;119(5):741–747. | ||
Friedman J, Hastie T, Tibshirani R. glmnet: Lasso and elastic-net regularized generalized linear models (R package version). 2009;1(4). | ||
Li H, Liu J, Chen J, et al. A serum microRNA signature predicts trastuzumab benefit in HER2-positive metastatic breast cancer patients. Nat Commun. 2018;9(1):1614. | ||
Kanehisa M, Goto S. KEGG: Kyoto encyclopedia of genes and genomes. Nucleic Acids Res. 2000;28(1):27–30. | ||
Subramanian A, Tamayo P, Mootha VK, et al. Gene set enrichment analysis: a knowledge-based approach for interpreting genome-wide expression profiles. Proc Natl Acad Sci USA. 2005;102(43):15545–15550. | ||
Yu G, Wang LG, Han Y, He QY. clusterProfiler: an R package for comparing biological themes among gene clusters. OMICS. 2012;16(5):284–287. | ||
Camp RL, Dolled-Filhart M, Rimm DL. X-tile: a new bio-informatics tool for biomarker assessment and outcome-based cut-point optimization. Clin Cancer Res. 2004;10(21):7252–7259. | ||
Tang K, Xu H. Prognostic value of meta-signature miRNAs in renal cell carcinoma: an integrated miRNA expression profiling analysis. Sci Rep. 2015;5:10272. | ||
Lumley T, Therneau T. The survival package. R News. 2004;4(1):26–28. | ||
Kassambara A, Kosinski M, Biecek P. survminer: Drawing survival curves using ‘ggplot2’ (R package version 0.3). 2017. Available from: https://cran.r-project.org/web/packages/survminer/survminer.pdf. Accessed December 06, 2018. | ||
Heagerty P, Saha P. 2013. survivalROC: Time-dependent ROC curve estimation from censored survival data (R package version 1.0). | ||
Team RC. R: A Language and Environment for Statistical Computing. 2013. Available from: http://softlibre.unizar.es/manuales/aplicaciones/r/fullrefman.pdf. Accessed December 06, 2018. | ||
Erixon P, Oxelman B. Reticulate or tree-like chloroplast DNA evolution in Sileneae (Caryophyllaceae)? Mol Phylogenet Evol. 2008;48(1):313–325. | ||
Kokko LL, Hurme S, Maula SM, et al. Significance of site-specific prognosis of cancer stem cell marker CD44 in head and neck squamous-cell carcinoma. Oral Oncol. 2011;47(6):510–516. | ||
Lleras RA, Smith RV, Adrien LR, et al. Unique DNA methylation loci distinguish anatomic site and HPV status in head and neck squamous cell carcinoma. Clin Cancer Res. 2013;19(19):5444–5455. | ||
Fakhry C, Westra WH, Wang SJ, et al. The prognostic role of sex, race, and human papillomavirus in oropharyngeal and nonoropharyngeal head and neck squamous cell cancer. Cancer. 2017;123(9):1566–1575. | ||
Zhou Z, Cheng Y, Jiang Y, et al. Ten hub genes associated with progression and prognosis of pancreatic carcinoma identified by co-expression analysis. Int J Biol Sci. 2018;14(2):124–136. | ||
Yuan L, Chen L, Qian K, et al. Co-expression network analysis identified six hub genes in association with progression and prognosis in human clear cell renal cell carcinoma (ccRCC). Genom Data. 2017;14:132–140. | ||
Zhang JX, Song W, Chen ZH, et al. Prognostic and predictive value of a microRNA signature in stage II colon cancer: a microRNA expression analysis. Lancet Oncol. 2013;14(13):1295–1306. | ||
Guo JC, Li CQ, Wang QY, et al. Protein-coding genes combined with long non-coding RNAs predict prognosis in esophageal squamous cell carcinoma patients as a novel clinical multi-dimensional signature. Mol Biosyst. 2016;12(11):3467–3477. | ||
Ge YZ, Xin H, Lu TZ, et al. MicroRNA expression profiles predict clinical phenotypes and prognosis in chromophobe renal cell carcinoma. Sci Rep. 2015;5:10328. | ||
Eyol E, Murtaga A, Zhivkova-Galunska M, et al. Few genes are associated with the capability of pancreatic ductal adenocarcinoma cells to grow in the liver of nude rats. Oncol Rep. 2012;28(6):2177–2187. | ||
Pannetier M, Chassot AA, Chaboissier MC, Pailhoux E. Involvement of FOXL2 and RSPO1 in ovarian determination, development, and maintenance in mammals. Sex Dev. 2016;10(4):167–184. | ||
Liu XL, Meng YH, Wang JL, Yang BB, Zhang F, Tang SJ. FOXL2 suppresses proliferation, invasion and promotes apoptosis of cervical cancer cells. Int J Clin Exp Pathol. 2014;7(4):1534. | ||
Naik M. Expression of Procollagen C Proteinase Enhancer Proteins in Human Trabecular Meshwork Cells and Tissues. Fort Worth: University of North Texas Health Science Center; 2013. | ||
Finkernagel F, Reinartz S, Lieber S, et al. The transcriptional signature of human ovarian carcinoma macrophages is associated with extracellular matrix reorganization. Oncotarget. 2016;7(46):75339. | ||
Bourhis JM, Vadon-Le Goff S, Afrache H, et al. Procollagen C-proteinase enhancer grasps the stalk of the C-propeptide trimer to boost collagen precursor maturation. Proc Natl Acad Sci USA. 2013;110(16):6394–6399. | ||
Król M, Pawlowski KM, Skierski J, et al. Transcriptomic profile of two canine mammary cancer cell lines with different proliferative and anti-apoptotic potential. J Physiol Pharmacol. 2009;60(Suppl 1):95–106. | ||
Lim SB. TAN SJ, Wan-Teck L, LIM CT. An extracellular matrix-related prognostic and predictive indicator for early-stage non-small cell lung cancer. Nat Commun. 8;2017:1734. | ||
Zheng LS, Yang JP, Cao Y, et al. SPINK6 promotes metastasis of nasopharyngeal carcinoma via binding and activation of epithelial growth factor receptor. Cancer Res. 2017;77(2):579–589. | ||
Thiery JP, Acloque H, Huang RY, Nieto MA. Epithelial-mesenchymal transitions in development and disease. Cell. 2009;139(5):871–890. | ||
Yamaguchi K, Chikumi H, Shimizu A, et al. Diagnostic and prognostic impact of serum-soluble UL16-binding protein 2 in lung cancer patients. Cancer Sci. 2012;103(8):1405–1413. | ||
Wennerberg E, Pfefferle A, Ekblad L, et al. Human anaplastic thyroid carcinoma cells are sensitive to NK cell-mediated lysis via ULBP2/5/6 and chemoattract NK cells. Clin Cancer Res. 2014;20(22):5733–5744. | ||
Guerra N, Tan YX, Joncker NT, et al. NKG2D-deficient mice are defective in tumor surveillance in models of spontaneous malignancy. Immunity. 2008;28(4):571–580. | ||
Chen J, Zhu XX, Xu H, Fang HZ, Zhao JQ. Expression and prognostic significance of unique ULBPs in pancreatic cancer. Onco Targets Ther. 2016;9:5271–5279. | ||
Bonnefont J, Laforge T, Plastre O, et al. Primate-specific RFPL1 gene controls cell-cycle progression through cyclin B1/Cdc2 degradation. Cell Death Differ. 2011;18(2):293–303. | ||
Chen W, Lu J, Qin Y, et al. Ret finger protein-like 3 promotes tumor cell growth by activating telomerase reverse transcriptase expression in human lung cancer cells. Oncotarget. 2014;5(23):11909. | ||
Deguchi A, Das KK, Xing SW, Oehlen B, Weinstein IB. Down-Regulation of the cGMP/PKG Pathway in Primary Human Colon Cancers and Cancer Cell Lines. Proc Am Assoc Cancer Res. 2005;46:56–68. | ||
Martini M, De Santis MC, Braccini L, Gulluni F, Hirsch E. PI3K/AKT signaling pathway and cancer: an updated review. Ann Med. 2014;46(6):372–383. | ||
Boyer A-S, Walter D, Sørensen CS. DNA replication and cancer: from dysfunctional replication origin activities to therapeutic opportunities. Paper presented at: Seminars in Cancer Biology. 2016. | ||
Macheret M, Halazonetis TD. DNA replication stress as a hallmark of cancer. Annu Rev Pathol. 2015;10:425–448. | ||
Zhang YL, Wang RC, Cheng K, Ring BZ, Su L. Roles of Rap1 signaling in tumor cell migration and invasion. Cancer Biol Med. 2017;14(1):90. | ||
Siveen KS, Sikka S, Surana R, et al. Targeting the STAT3 signaling pathway in cancer: role of synthetic and natural inhibitors. Biochim Biophys Acta. 2014;1845(2):136–154. |
 © 2018 The Author(s). This work is published and licensed by Dove Medical Press Limited. The
full terms of this license are available at https://www.dovepress.com/terms
and incorporate the Creative Commons Attribution
- Non Commercial (unported, 3.0) License.
By accessing the work you hereby accept the Terms. Non-commercial uses of the work are permitted
without any further permission from Dove Medical Press Limited, provided the work is properly
attributed. For permission for commercial use of this work, please see paragraphs 4.2 and 5 of our Terms.
© 2018 The Author(s). This work is published and licensed by Dove Medical Press Limited. The
full terms of this license are available at https://www.dovepress.com/terms
and incorporate the Creative Commons Attribution
- Non Commercial (unported, 3.0) License.
By accessing the work you hereby accept the Terms. Non-commercial uses of the work are permitted
without any further permission from Dove Medical Press Limited, provided the work is properly
attributed. For permission for commercial use of this work, please see paragraphs 4.2 and 5 of our Terms.