Back to Journals » Neuropsychiatric Disease and Treatment » Volume 15
A single-nucleotide polymorphism influences brain morphology in drug-naïve patients with major depressive disorder
Authors Katsuki A, Kakeda S, Watanabe K, Igata R, Otsuka Y, Kishi T ![]() , Nguyen L, Ueda I
, Nguyen L, Ueda I ![]() , Iwata N
, Iwata N ![]() , Korogi Y, Yoshimura R
, Korogi Y, Yoshimura R ![]()
Received 7 February 2019
Accepted for publication 2 May 2019
Published 23 August 2019 Volume 2019:15 Pages 2425—2432
DOI https://doi.org/10.2147/NDT.S204461
Checked for plagiarism Yes
Review by Single anonymous peer review
Peer reviewer comments 4
Editor who approved publication: Dr Roger Pinder
Asuka Katsuki,1 Shingo Kakeda,2 Keita Watanabe,2 Ryohei Igata,1 Yuka Otsuka,1 Taro Kishi,3 LeHoa Nguyen,1 Issei Ueda,2 Nakao Iwata,3 Yukunori Korogi,2 Reiji Yoshimura1
1Department of Psychiatry, University of Occupational and Environmental Health, Kitakyushu, Fukuoka 8078555, Japan; 2Department of Radiology, University of Occupational and Environmental Health, Kitakyushu, Fukuoka 8078555, Japan; 3Department of Psychiatry, Fujita Health University, Toyoake, Aichi 4701192, Japan
Correspondence: Reiji Yoshimura
Department of Psychiatry, University of Occupational and Environmental Health, 1-1 Iseigaoka, Yahatanishi-ku, Kitakyushu, Fukuoka 8078555, Japan
Tel +81 93 691 7253
Fax +81 93 692 4894
Email [email protected]
Objective: Recently, a genome-wide association study successfully identified genetic variants associated with major depressive disorder (MDD). The study identified 17 independent single-nucleotide polymorphisms (SNPs) significantly associated with diagnosis of MDD. These SNPs were predicted to be enriched in genes that are expressed in the central nervous system and function in transcriptional regulation associated with neurodevelopment. The study aimed to investigate associations between 17 SNPs and brain morphometry using magnetic resonance imaging (MRI) in drug-naïve patients with MDD and healthy controls (HCs).
Methods: Forty-seven patients with MDD and 42 HCs were included. All participants underwent T1-weighted structural MRI and genotyping. The genotype–diagnosis interactions associated with regional cortical thicknesses were evaluated using voxel-based morphometry for the 17 SNPs.
Results: Regarding rs301806, an SNP in the RERE genomic regions, we found a significant difference in a genotype effect in the right-lateral orbitofrontal and postcentral lobes between diagnosis groups. After testing every possible diagnostic comparison, the genotype–diagnosis interaction in these areas revealed that the cortical thickness reductions in the MDD group relative to those in the HC group were significantly larger in T/T individuals than in C-carrier ones. For the other SNPs, no brain area was noted where a genotype effect significantly differed between the two groups.
Conclusions: We found that a RERE gene SNP was associated with cortical thickness reductions in the right-lateral orbitofrontal and postcentral lobes in drug-naïve patients with MDD. The effects of RERE gene polymorphism and gene–environment interactions may exist in brain structures of patients with MDD.
Keywords: single-nucleotide polymorphism, brain morphology, major depressive disorder, genome-wide association
Introduction
Major depressive disorder (MDD) is chronic or recurrent disease accompanied with high morbidity and mortality.1 Heritability of MDD is about 40% by twin study.2 Lots of genetic loci are attribute to MDD. Each genetic locus influences small effect. Despite the evidence of heritability, the identification of the specific genetic variants involved in MDD remains challenging. Genome-wide association studies (GWASs) investigate the differences in allele frequencies between disease and control groups at millions of frequently occurring single-nucleotide polymorphisms (SNPs) throughout the genome. These differences are possibly functionally relevant to the disease or may represent loci that are transmitted in linkage disequilibrium with a causative polymorphism.
Recently, a GWAS successfully identified genetic variants associated with MDD. This study identified 17 SNPs associated with MDD because the study sample exhibited reduced heterogeneity and increased sample size relative to other studies. Hyde et al3 identified 17 independent SNPs significantly associated with MDD diagnosis. These SNPs were predicted to be enriched in genes that are expressed in the central nervous standard and function in transcriptional regulation associated with neurodevelopment.
The critical goal of GWAS is the identification of biological pathways underpinning depression; risk alleles with small effects can also yield enormous insights. Using these significant SNPs facilitates a strategy complementary to intensive phenotyping for identifying common variant associations with phenotypically heterogeneous neuropsychiatric diseases. This strategy may shed light on the massive worldwide impact of such disorders, and any approach that aids in clarifying the pathophysiology is worth considering.
Genetic and epigenetic factors regulating brain development and neurodegeneration may play roles in morphological brain abnormalities in patients with MDD. Regarding MDD, previous magnetic resonance imaging (MRI) studies using voxel-based morphometry (VBM) have reported evidence of a relationship between brain volume and genetic factors, including brain-derived neurotrophic factor, norepinephrine transporter gene (SLC6A2), FK506-binding protein 51, and ethylenetetrahydrofolate reductase/catechol-O-methyltransferase polymorphisms. In our previous report,4 we found the SNP (rs2522833) of piccolo presynaptic cytomatrix protein (PCLO), playing an important role in monoaminergic neurotransmission in the brain is associated with a gray matter volume reduction in the left temporal pole in drug-naive, first-episode patients with MDD carrying the C-allele. SNPs used in any previous studies were not included in the ones used in this study.4–11 To our knowledge, this is the first study that investigates associations between those 17 SNPs and brain morphometry using MRI in patients with MDD and HCs. We identified several new brain regions associated with the recently reported 17 SNPs associated with MDD.
Patients and methods
Ethics statement
The study protocol was approved by the Ethics Committee of the University of Occupational and Environmental Health Japan. Written informed consent was obtained from all subjects who participated in this study. Informed consent was obtained from each patient in accordance with the Declaration of Helsinki.
Participants
The subjects in the present study were partially overlapped with our recent study.12–14 Specifically, 12 MDD patients were additionally enrolled in the present study, and five healthy controls (HCs) were excluded because of the lack of their genome samples.
In the present study, MDD patients were recruited between March 2009 and January 2017. All patients were diagnosed by using a fully Structured Clinical Interview for Diagnostic and Statistical Manual for Mental Disorders, Fourth Edition, Text revision Research Version. Severity of depressive state was evaluated using the 17-item Hamilton Rating Scale for Depression (HAMD-17).
The psychiatrist included patients who met the following criteria: (a) diagnosed patients with MDD, (b) with a total HAMD-17 score of ≥14, and (c) drug-naïve patients. Patients who met the following criteria were excluded: (a) a history of neurological disease and the presence of psychiatric disorders on either Axis I (schizophrenia, other affective disorders, etc.) or Axis II (personality disorders, mental retardation, etc.), (b) presence of co-morbid substance use disorders, and (c) unwillingness to provide informed consent. Lastly, 47 right-handed drug-naïve patients with MDD were included in this study.
We described the inclusion and exclusion criteria of HCs. The inclusion criteria of HCs were (1) never been diagnosed with an axis I or II psychiatric disorder, as confirmed by the Structured Clinical Interview for the DSM-IV (SCID15), (2) no history of psychotropic medication use within the preceding 6months, (3) no history of significant head injury, seizure, or neurologic condition. The subjects who met even one of those criteria were excluded in the present study. Fifty-two subjects were also recruited from nearby communities as HC.
Genotyping
Eighty-nine subjects from the neuroimaging study provided a blood sample, from which DNA was extracted using standard laboratory protocols. DNA was isolated from peripheral blood mononuclear cells using the QIAamp DNA Mini-Kit (QIAGEN, Tokyo, Japan). Genotyping was carried out with a PCR SNP genotyping system using the BigDye Terminator v3.1 Cycle Sequencing Kit (Life Technologies Corporation, Tokyo, Japan). The DNA was read using a BMG Applied Biosystem 3730xI DNA Analyzer (Life Technologies Corporation). The PCR products were purified enzymatically. Sequencing reactions were performed using the Big Dye Terminator v3.1 Cycle Sequencing Kit (Life Technologies Corporation). The sequencing primers used were the same as the PCR primers. The sequences were analyzed with the Applied Biosystems 3730xl DNA Analyzer (Life Technologies Corporation). The sequencing output data were then compared to a reference sequence (NC_000007.13).
MRI acquisition
MRI data were obtained based on the methods we have already reported using 3 T MRI system (Signa EXCITE 3T; GE Healthcare, Waukesha, WI, USA) with an eight-channel brain phased-array coil. Original T1 images were acquired by three-dimensional fast-spoiled gradient recalled acquisition with steady state.
All images were corrected for image distortion due to gradient non-linearity using the “Grad Warp” software program16 and for intensity inhomogeneity with the “N3” function.17 The regional cortical thickness was estimated using the FreeSurfer v. 5.3.0 software program (http://surfer.nmr.mgh.harvard.edu), which has been well documented and is freely available online. The technical details of the cortical thickness analysis have been described elsewhere.18
Image processing
Whole-brain analyses using SBM
The regional cortical thickness was estimated using the FreeSurfer software program (version 6.0, www.freesurfer.net/fswiki/HippocampalSubfields), which has been well documented and which is freely available online. The technical details of the cortical thickness analysis have been described elsewhere.18 The entire cortex of each participant was inspected visually; topological defects were corrected manually. Cortical thickness measurements were obtained by reconstructing representations of the gray matter–white matter boundary18,19 and the pial surface. The distance between these surfaces at each point across the cortical mantle was then calculated. For each participant, the regional thickness value at each vertex was mapped to the surface of an average brain template. This allowed for the visualization of data across the entire cortical surface. The data were re-sampled for all participants onto a common spherical coordinate system.19 The cortical map of each participant was smoothed with a 10-mm kernel in full width at half-maximum (FWHM) for the cortical analyses.
Statistical analysis
Voxel-wise statistical analysis was used by a surface-based analysis and the Freesurfer statistical tool, QDEC, after 10-mm FWHM kernel smoothing. A general linear model was adopted at each vertex. We estimated the main effects, (a) diagnostic effect (MDD vs HC) and (b) genotype effect in total subjects (the T/T versus the C-carriers) and then (c) genotype–diagnosis interaction effect was estimated. Furthermore, the effects of genotypes in each group (controls carrying the T/T versus controls carrying the C-carrier and MDD carrying the T/T versus MDD carrying the C-carrier) were estimated within the ANCOVA design matrix.20 Moreover, age and sex were set as inconsiderable factors to control for confounding variables. Controls and patients with MDD included in this study may show different cortical evolution rates. Therefore, we used different offsets and different slopes.
For the cluster analysis, a Monte Carlo simulation was used for correction regarding multiple comparisons; for the cluster-forming, threshold was set at P<0.05. We tested clusters against an empirical null distribution of maximum cluster size built by synthesized Z-distributed data across 10,000 permutations, which produced clusters-wise P-values fully corrected for multiple comparisons.21,22
We used values of P<0.05 (two-tailed) as a statistically significant difference.
Results
Participants
The genotypes of the 89 subjects were 47 patients with MDD and 42 HCs. All participants including MDD patients and controls were Japanese. The allele frequencies of the 17 SNPs were within the Hardy–Weinberg equilibrium (Table 1). Rs4543289, rs11209948, and rs8025231 could not perform direct sequence reads because of insufficient volume. Thus, we could not obtain the information of genotyping. The distributions of genotypes are shown in Table 1.
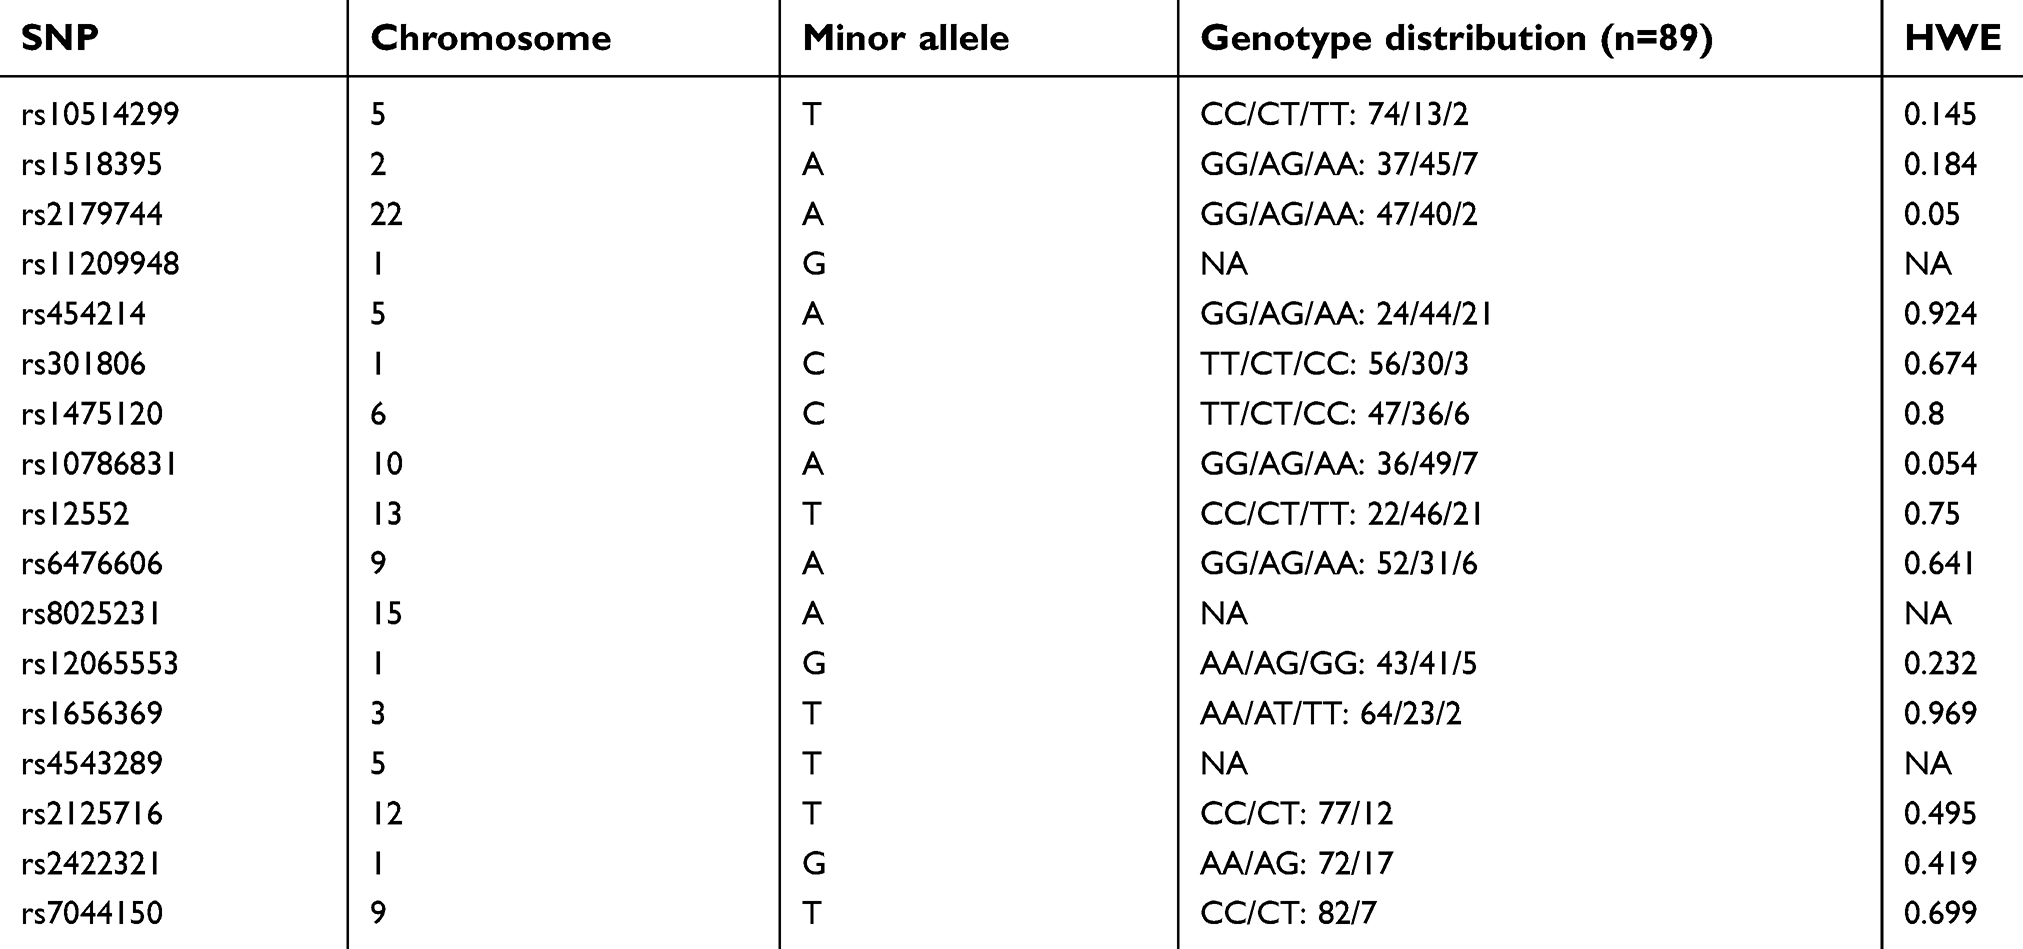 |
Table 1 Summary of polymorphisms identified across analyses |
Effect of diagnosis on cortical thickness
Irrespective of genotype, the cortical thickness showed significant differences between the MDD and HCs. We found that the cortical thicknesses in the left lateral lateral occipital (p=0.005, Monte Carlo simulation corrected), right lateral lateral occipital (p=0.001, Monte Carlo simulation corrected) and right inferior parietal lobes (p=0.010, Monte Carlo simulation corrected) were significantly reduced in the patients with MDD than in the HCs. (Figure 1 and Table 2).
 |
Figure 1 Comparison of the cortical thicknesses of patients with major depressive disorder (MDD) and healthy controls (HCs). Red and orange clusters representing significantly thinner cortical regions (bilateral lateral occipital and right inferior parietal lobes) in patients with MDD (FWE corrected P<0.05). |
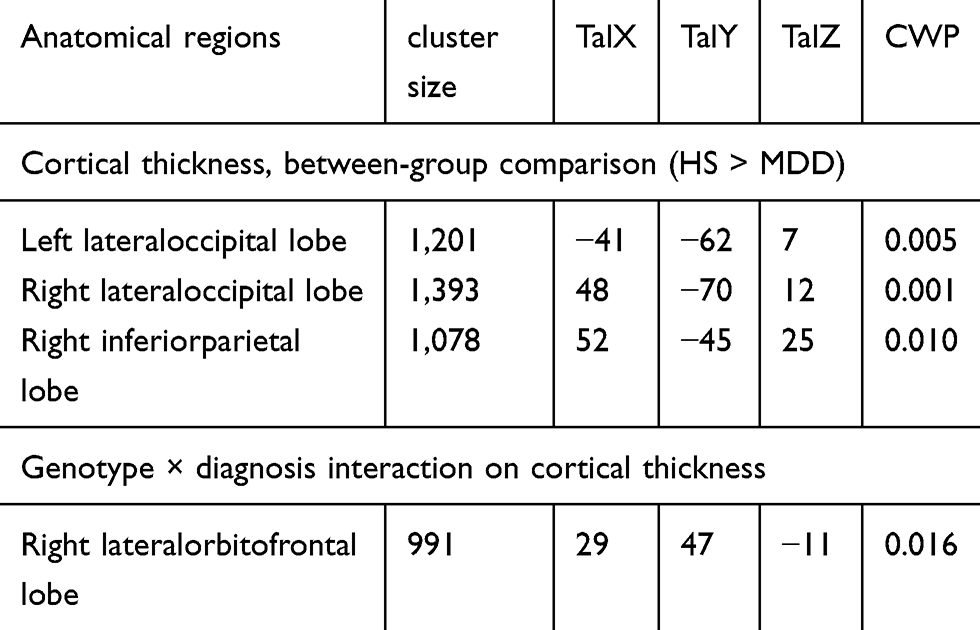 |
Table 2 Results of the image analysis |
Effect of genotype on cortical thickness
We did not find any effects of 14 SNPs on cortical thickness (P>0.05, Monte Carlo simulation corrected).
Genotype × diagnosis interaction on cortical thickness
For only rs301806, an SNP in the arginine–glutamic acid dipeptide (RE) repeats gene (RERE) regions, we found a significant difference in a genotype effect in the right-lateral orbitofrontal lobes between the MDD and HC groups (p=0.016, Monte Carlo simulation corrected). After testing every possible diagnostic comparison, the genotype–diagnosis interaction in these areas showed that the cortical thickness reductions in the MDD group relative to those in the HC group were significantly larger in T/T individuals than in C-carrier individuals (P<0.05, FWE corrected; Figure 2 and Table 2). Table 3 shows the demographic and clinical characteristics of the participants with regard to rs301806.
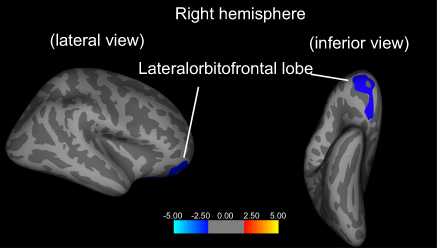 |
Figure 2 Genotype × diagnosis interaction on cortical thickness. The blue cluster represents the genotype × diagnosis interaction effect on the cortical thickness of the right-lateral orbitofrontal lobe) (FWE corrected P<0.05). |
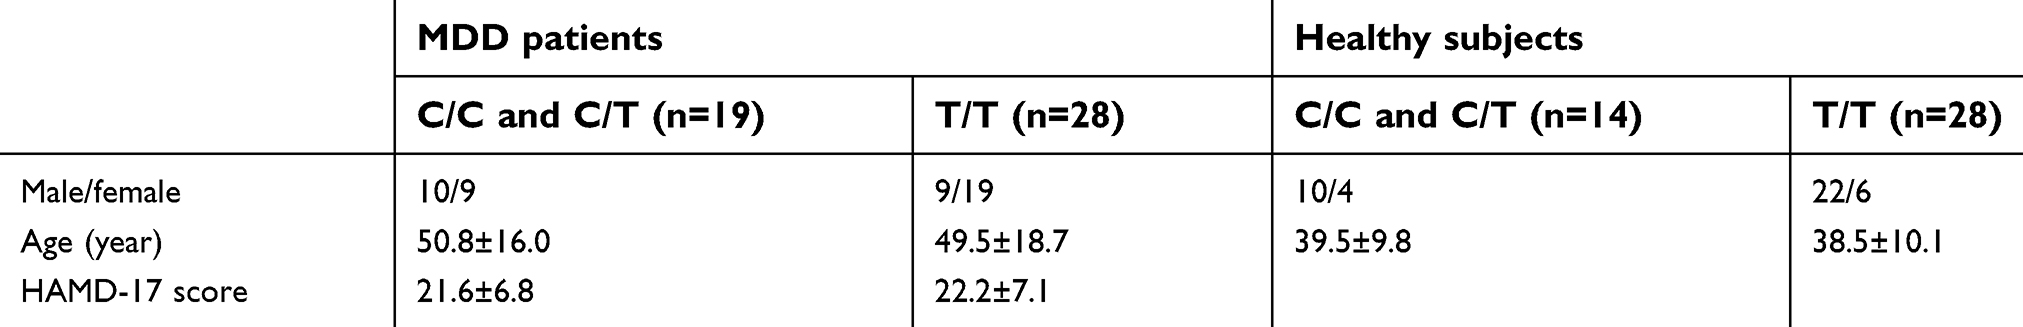 |
Table 3 Demographic and clinical characteristics among 4 groups regarding the rs301806 |
For other SNPs, we identified no brain area in which a genotype effect differed significantly between diagnosis groups (P>0.05, Monte Carlo simulation corrected).
Discussion
The RERE gene contains SNP rs301806. The RERE gene, previously known as atrophin 2 because of similarities between RERE and atrophin 1, is termed after the dipeptide repeats present in the carboxyl terminal of RERE. To the best of our knowledge, the findings of this study provide the first evidence of a relationship between cortical thickness and polymorphisms in the RERE gene in patients with MDD. Specifically, significant RERE genotype–diagnosis interaction effects were noted in the right-lateral orbitofrontal and postcentral lobes, which suggested that the RERE genotype affects the cortical thickness in MDD. We recruited drug-naive patients with MDD, which is a strength of this study since antidepressant medication may increase heterogeneity and limit the interpretability and generalizability of the results, especially in the light of evidence that drugs may have important effects, such as upregulating neurotrophin expression,23 altering neuronal remodeling,24 and protecting against GM loss,25,26 in both animal and human studies.27–29 Differences in drug treatment may contribute to variability among MRI results in MDD. In view of this, we targeted our analysis to only drug-naive patients with MDD for eliminating interference by antidepressant treatment. The reduction of cortical thickness noted in this study may be associated with the acute state of MDD and not with the effects of pharmacotherapy and/or duration of the depressive state. The role of the genetic variation of the RERE gene in brain pathology is yet to be elucidated. Jordan et al provided evidence that implicates RERE in various 1p36 chromosome-deletion phenotypes.30 The major clinical features of 1p36 deletion syndrome demonstrate motor developmental delay, hypotonia, and craniofacial dysmorphisms including a large anterior fontanel, prominent forehead and chin, deep eyes, flat nasal bridge, maxillary hypoplasia, and ear asymmetry. Thus, RERE may play a pivotal role in normal brain development.31,32 In addition, a recent report indicated that RERE and its Drosophila homolog were associated with histone methyltransferases in the regulation of gene expression.33 Gene–environment interactions play an essential role in MDD pathogenesis, which is a polygenic and heterogeneous disease. A recent hypothesis indicates that certain environmental factors hijack the brain’s epigenetic machinery and, in combination with genetic predispositions, produce several of the behavioral manifestations of MDD.34,35 Epigenetic modulation comprises three broad umbrella systems: DNA methylation, histone modification, and noncoding RNA-mediated mechanisms. These are meiotically and mitotically heritable changes that are not directly coded in the DNA sequence.36 Thus, we speculate that RERE plays a pivotal role in the pathophysiology of MDD combined with epigenetic mechanisms associated with histone methyltransferases.
In the present study, the association of the SNP in the RERE gene (rs301806) with alterations in the reduction of the cortical thickness in the right-lateral orbitofrontal and postcentral lobes in MDD is unclear. A previous study also indicated that MDD was characterized by reduced brain volume in the frontal cortex, orbitofrontal cortex (OFC), cingulate cortex, hippocampus, and striatum.37 Anterior cingulate cortex, OFC, and dorsolateral prefrontal cortex are all prefrontal regions involved in the automatic regulation of emotional behavior in MDD.38 The OFC plays a crucial role in neuropsychological functioning including exteroceptive and interoceptive information coding, reward-guided behavior, impulse control, and mood regulation. The OFC may exhibit different involvement in the pathophysiology of MDD39 and gray matter volume reduction of the OFC in MDD.40 Reports also indicate decreases in cortical thickness, neuronal sizes, and neuronal and glial densities in cortical layers of the OFC in patients with MDD.41 However, factors contributing to the alteration of OFC structure in MDD remain unclear. The lateral OFC is granular and considered to have evolved from a paleocortical moiety; it is associated with medial and dorsal parts of the basal nucleus of the amygdala as well as with sensory and premotor areas and the posterior cingulate. It is part of the frontostriatal system, which is an executive control system, and the lateral OFC has been related functionally to the formation of associations between emotions, especially positive ones, and cognitions.
In this study, the significant RERE genotype–diagnosis interaction demonstrated that the reductions in cortical thicknesses in patients with MDD relative to those in the HCs were significantly larger in the T/T homozygous individuals than in the C-carrier individuals. However, the mechanism underlying the alterations of neuronal functions and/or brain development caused by genetic variation of the RERE gene remains to be elucidated. Genetic polymorphisms that increase the risk for MDD are considered to be one of the contributors because these genetic variants are presumed to act on brain function and architecture.
One of the limitations of this study is the small sample size. However, recruiting and retaining drug-naive patients with MDD presented a challenge because many were administered antidepressants before they underwent MRI. Second, the study3 of Hyde et al was detected by Europeans. Since we evaluated the SNPs using Japanese, we should be cautious for interpretation of the results. Third, new additional genes associated with MDD42–49 were not examined. Fourth, the result was a chance finding because, sample number was small. Therefore, we should perform a study considering above points in further study.
In conclusion, our findings suggest that an SNP in the RERE gene was associated with reductions of cortical thicknesses in the right-lateral orbitofrontal and postcentral lobes in drug-naïve patients with MDD. Furthermore, we suggest that the effects of RERE gene polymorphism and gene–environment interactions may exist in the brain structure of patients with MDD.
Author contributions
Dr. Katsuki designed the study, collected the clinical data, performed the statistical analyses, and wrote the first draft managed the literature searches. Professor Yoshimura revised the study protocol wrote the final manuscript. Dr. Korogi checked the final manuscript. Drs. Kakeda and Watanabe helped the statistical analyses. Dr. Igata collected the clinical data. Drs. Nguyen and Otsuka collected the clinical data. All authors contributed to data analysis, drafting and revising the article, gave final approval of the version to be published, and agree to be accountable for all aspects of the work.
Disclosure
Dr. Katsuki has received speaker’s honoraria from Dainippon Sumitomo. Dr. Kishi has received speaker’s honoraria from Abbott, Astellas, Daiichi Sankyo, Dainippon Sumitomo, Eli Lilly, GlaxoSmithKline, Yoshitomi, Otsuka, Meiji, Shionogi, Tanabe-Mitsubishi, Novartis and Pfizer. Professor Iwata has received speaker’s honoraria from Astellas, Dainippon Sumitomo, Eli Lilly, GlaxoSmithKline, Janssen, Yoshitomi, Otsuka, Meiji, Shionogi, Novartis, and Pfizer and has had research grants from GlaxoSmithKline, Meiji, and Otsuka. Professor Yoshimura has received speaker’s honoraria from Eli Lilly, Janssen, Dainippon Sumitomo, Otsuka, Meiji, Pfizer and Shionogi. The authors report no other conflicts of interest in this work.
References
1. Wittchen HU, Jacobi F, Rehm J, et al. The size and burden of mental disorders and other disorders of the brain in Europe 2010. Eur Neuropsychopharmacol. 2011;21(9):655–679. doi:10.1016/j.euroneuro.2011.07.018
2. Sullivan PF, Geschwind DH. Defining the genetic, genomic, cellular, and diagnostic architectures of psychiatric disorders. Cell. 2019;177(1):162–183. doi:10.1016/j.cell.2019.01.015
3. Hyde CL, Nagle MW, Tian C, et al. Identification of 15 genetic loci associated with risk of major depression in individuals of European descent. Nat Genet. 2016;48(9):1031–1036. doi:10.1038/ng.3623
4. Igata R, Katsuki A, Kakeda S, et al. PCLO rs2522833-mediated gray matter volume reduction in patients with drug-naive, first-episode major depressive disorder. Transl Psychiatry. 2017;7(5):e1140. doi:10.1038/tp.2017.160
5. Ueda I, Kakeda S, Watanabe K, et al. Relationship between G1287A of the NET gene polymorphisms and brain volume in major depressive disorder: a voxel-based MRI study. PLoS One. 2016;11(3):e0150712. doi:10.1371/journal.pone.0150712
6. Pan CC, McQuoid DR, Taylor WD, Payne ME, Ashley-Koch A, Steffens DC. Association analysis of the COMT/MTHFR genes and geriatric depression: an MRI study of the putamen. Int J Geriatr Psychiatry. 2009;24(8):847–855. doi:10.1002/gps.2206
7. Molendijk ML, van Tol MJ, Penninx BW, et al. BDNF val66met affects hippocampal volume and emotion-related hippocampal memory activity. Transl Psychiatry. 2012;2:e74. doi:10.1038/tp.2011.72
8. Ide S, Kakeda S, Watanabe K, et al. Relationship between a BDNF gene polymorphism and the brain volume in treatment-naive patients with major depressive disorder: a VBM analysis of brain MRI. Psychiatry Res. 2015;233(2):120–124. doi:10.1016/j.pscychresns.2015.05.016
9. Watanabe K, Kakeda S, Yoshimura R, et al. Relationship between the catechol-O-methyl transferase Val108/158Met genotype and brain volume in treatment-naive major depressive disorder: voxel-based morphometry analysis. Psychiatry Res. 2015;233(3):481–487. doi:10.1016/j.pscychresns.2015.07.024
10. Hirakawa H, Akiyoshi J, Muronaga M, et al. FKBP5 is associated with amygdala volume in the human brain and mood state: a voxel-based morphometry (VBM) study. Int J Psychiatry Clin Pract. 2016;20(2):106–115. doi:10.3109/13651501.2016.1144772
11. Cardoner N, Soria V, Gratacos M, et al. Val66Met BDNF genotypes in melancholic depression: effects on brain structure and treatment outcome. Depress Anxiety. 2013;30(3):225–233. doi:10.1002/da.22025
12. Liu X, Kakeda S, Watanabe K, et al. Relationship between the cortical thickness and serum cortisol levels in drug-naive, first-episode patients with major depressive disorder: a surface-based morphometric study. Depress Anxiety. 2015;32(9):702–708. doi:10.1002/da.22401
13. Liu X, Watanabe K, Kakeda S, et al. Relationship between white matter integrity and serum cortisol levels in drug-naive patients with major depressive disorder: diffusion tensor imaging study using tract-based spatial statistics. Br J Psychol. 2016;208(6):585–590. doi:10.1192/bjp.bp.114.155689
14. Kakeda S, Watanabe K, Katsuki A, et al. Genetic effects on white matter integrity in drug-naive patients with major depressive disorder: a diffusion tensor imaging study of 17 genetic loci associated with depressive symptoms. Neuropsychiatr Dis Treat. 2019;15:375–383. doi:10.2147/NDT.S190268
15. Farmer RF, Chapman AL. Evaluation of DSM-IV personality disorder criteria as assessed by the structured clinical interview for DSM-IV personality disorders. Compr Psychiatry. 2002;43(4):285–300.
16. Jovicich J, Czanner S, Greve D, et al. Reliability in multi-site structural MRI studies: effects of gradient non-linearity correction on phantom and human data. NeuroImage. 2006;30(2):436–443. doi:10.1016/j.neuroimage.2005.09.046
17. Sled JG, Zijdenbos AP, Evans AC. A nonparametric method for automatic correction of intensity nonuniformity in MRI data. IEEE Trans Med Imaging. 1998;17(1):87–97. doi:10.1109/42.668698
18. Dale AM, Fischl B, Sereno MI. Cortical surface-based analysis. I. Segmentation and surface reconstruction. NeuroImage. 1999;9(2):179–194. doi:10.1006/nimg.1998.0395
19. Fischl B, Dale AM. Measuring the thickness of the human cerebral cortex from magnetic resonance images. Proc Natl Acad Sci U S A. 2000;97(20):11050–11055. doi:10.1073/pnas.200033797
20. Ohnishi T, Hashimoto R, Mori T, et al. The association between the Val158Met polymorphism of the catechol-O-methyl transferase gene and morphological abnormalities of the brain in chronic schizophrenia. Brain. 2006;129(Pt 2):399–410. doi:10.1093/brain/awh702
21. Hayasaka S, Nichols TE. Validating cluster size inference: random field and permutation methods. NeuroImage. 2003;20(4):2343–2356.
22. Hagler DJ
23. Duman RS, Monteggia LM. A neurotrophic model for stress-related mood disorders. Biol Psychiatry. 2006;59(12):1116–1127. doi:10.1016/j.biopsych.2006.02.013
24. Bessa JM, Ferreira D, Melo I, et al. The mood-improving actions of antidepressants do not depend on neurogenesis but are associated with neuronal remodeling. Mol Psychiatry. 2009;14(8):764–773,739. doi:10.1038/mp.2008.119
25. Sheline YI, Gado MH, Kraemer HC. Untreated depression and hippocampal volume loss. Am J Psychiatry. 2003;160(8):1516–1518. doi:10.1176/appi.ajp.160.8.1516
26. Lavretsky H, Roybal DJ, Ballmaier M, Toga AW, Kumar A. Antidepressant exposure may protect against decrement in frontal gray matter volumes in geriatric depression. J Clin Psychiatry. 2005;66(8):964–967.
27. Sheline YI, Disabato BM, Hranilovich J, et al. Treatment course with antidepressant therapy in late-life depression. Am J Psychiatry. 2012;169(11):1185–1193. doi:10.1176/appi.ajp.2012.12010122
28. Cousins DA, Aribisala B, Nicol Ferrier I, Blamire AM. Lithium, gray matter, and magnetic resonance imaging signal. Biol Psychiatry. 2013;73(7):652–657. doi:10.1016/j.biopsych.2012.09.029
29. Vernon AC, Natesan S, Crum WR, et al. Contrasting effects of haloperidol and lithium on rodent brain structure: a magnetic resonance imaging study with postmortem confirmation. Biol Psychiatry. 2012;71(10):855–863. doi:10.1016/j.biopsych.2011.12.004
30. Jordan VK, Zaveri HP, Scott DA. 1p36 deletion syndrome: an update. Appl Clin Genet. 2015;8:189–200. doi:10.2147/TACG.S65698
31. Zoltewicz JS, Stewart NJ, Leung R, Peterson AS. Atrophin 2 recruits histone deacetylase and is required for the function of multiple signaling centers during mouse embryogenesis. Development. 2004;131(1):3–14. doi:10.1242/dev.00908
32. Kim BJ, Zaveri HP, Shchelochkov OA, et al. An allelic series of mice reveals a role for RERE in the development of multiple organs affected in chromosome 1p36 deletions. PLoS One. 2013;8(2):e57460. doi:10.1371/journal.pone.0057460
33. Wang H, Gui H, Rallo MS, Xu Z, Matise MP. Atrophin protein RERE positively regulates Notch targets in the developing vertebrate spinal cord. J Neurochem. 2017;141(3):347–357. doi:10.1111/jnc.13969
34. Peter CJ, Akbarian S. Balancing histone methylation activities in psychiatric disorders. Trends Mol Med. 2011;17(7):372–379. doi:10.1016/j.molmed.2011.02.003
35. Renthal W, Nestler EJ. Chromatin regulation in drug addiction and depression. Dialogues Clin Neurosci. 2009;11(3):257–268.
36. Egger G, Liang G, Aparicio A, Jones PA. Epigenetics in human disease and prospects for epigenetic therapy. Nature. 2004;429(6990):457–463. doi:10.1038/nature02625
37. Arnone D, McIntosh AM, Ebmeier KP, Munafo MR, Anderson IM. Magnetic resonance imaging studies in unipolar depression: systematic review and meta-regression analyses. Eur Neuropsychopharmacol. 2012;22(1):1–16. doi:10.1016/j.euroneuro.2011.05.003
38. Price JL, Drevets WC. Neurocircuitry of mood disorders. Neuropsychopharmacology. 2010;35(1):192–216. doi:10.1038/npp.2009.104
39. Lacerda AL, Keshavan MS, Hardan AY, et al. Anatomic evaluation of the orbitofrontal cortex in major depressive disorder. Biol Psychiatry. 2004;55(4):353–358. doi:10.1016/j.biopsych.2003.08.021
40. Vasic N, Walter H, Hose A, Wolf RC. Gray matter reduction associated with psychopathology and cognitive dysfunction in unipolar depression: a voxel-based morphometry study. J Affect Disord. 2008;109(1–2):107–116. doi:10.1016/j.jad.2007.11.011
41. Rajkowska G, Miguel-Hidalgo JJ, Wei J, et al. Morphometric evidence for neuronal and glial prefrontal cell pathology in major depression. Biol Psychiatry. 1999;45(9):1085–1098.
42. Wray NR, Ripke S, Mattheisen M, et al. Genome-wide association analyses identify 44 risk variants and refine the genetic architecture of major depression. Nat Genet. 2018;50(5):668–681. doi:10.1038/s41588-018-0090-3
43. Wong ML, Arcos-Burgos M, Liu S, et al. The PHF21B gene is associated with major depression and modulates the stress response. Mol Psychiatry. 2017;22(7):1015–1025. doi:10.1038/mp.2016.174
44. Yu C, Baune BT, Licinio J, Wong ML. A novel strategy for clustering major depression individuals using whole-genome sequencing variant data. Sci Rep. 2017;7:44389. doi:10.1038/srep44389
45. Yu C, Arcos-Burgos M, Baune BT, et al. Low-frequency and rare variants may contribute to elucidate the genetics of major depressive disorder. Transl Psychiatry. 2018;8(1):70. doi:10.1038/s41398-018-0117-7
46. CONVERGE consortium. Sparse whole-genome sequencing identifies two loci for major depressive disorder. Nature. 2015;523(7562):588–591. doi:10.1038/nature14659
47. Amin N, Jovanova O, Adams HH, et al. Exome-sequencing in a large population-based study reveals a rare Asn396Ser variant in the LIPG gene associated with depressive symptoms. Mol Psychiatry. 2017;22(4):634. doi:10.1038/mp.2016.141
48. Yu C, Baune BT, Licinio J, Wong ML. Single-nucleotide variant proportion in genes: a new concept to explore major depression based on DNA sequencing data. J Hum Genet. 2017;62(5):577–580. doi:10.1038/jhg.2017.2
49. Yu C, Baune BT, Fu KA, Wong ML, Licinio J. Genetic clustering of depressed patients and normal controls based on single-nucleotide variant proportion. J Affect Disord. 2018;227:450–454. doi:10.1016/j.jad.2017.11.023
 © 2019 The Author(s). This work is published and licensed by Dove Medical Press Limited. The
full terms of this license are available at https://www.dovepress.com/terms
and incorporate the Creative Commons Attribution
- Non Commercial (unported, 3.0) License.
By accessing the work you hereby accept the Terms. Non-commercial uses of the work are permitted
without any further permission from Dove Medical Press Limited, provided the work is properly
attributed. For permission for commercial use of this work, please see paragraphs 4.2 and 5 of our Terms.
© 2019 The Author(s). This work is published and licensed by Dove Medical Press Limited. The
full terms of this license are available at https://www.dovepress.com/terms
and incorporate the Creative Commons Attribution
- Non Commercial (unported, 3.0) License.
By accessing the work you hereby accept the Terms. Non-commercial uses of the work are permitted
without any further permission from Dove Medical Press Limited, provided the work is properly
attributed. For permission for commercial use of this work, please see paragraphs 4.2 and 5 of our Terms.