Back to Journals » Risk Management and Healthcare Policy » Volume 14
A Simplified Frailty Index Predicts Mortality in Older Adults in Beijing
Authors Zhang L, Ji T, Sun F, Li Y, Tang Z, Ma L ![]()
Received 21 January 2021
Accepted for publication 14 April 2021
Published 3 December 2021 Volume 2021:14 Pages 4867—4873
DOI https://doi.org/10.2147/RMHP.S302354
Checked for plagiarism Yes
Review by Single anonymous peer review
Peer reviewer comments 3
Editor who approved publication: Professor Marco Carotenuto
Li Zhang,1,2,* Tong Ji,1,2,* Fei Sun,2 Yun Li,1 Zhe Tang,1,2 Lina Ma1,2
1Department of Geriatrics, Xuanwu Hospital Capital Medical University, National Clinical Research Center for Geriatric Diseases, Beijing, 100053, People’s Republic of China; 2Beijing Geriatric Healthcare Center, Xuanwu Hospital Capital Medical University, Beijing, 100053, People’s Republic of China
*These authors contributed equally to this work
Correspondence: Lina Ma; Zhe Tang Email [email protected]; [email protected]
Objective: The comprehensive geriatric assessment (CGA) is an integral tool used to identify vulnerable older adults in need of individualized plans to delay the course of diseases and monitor treatment outcomes. We previously developed and validated a 68-item frailty index (FI) based on the CGA in a large, older, Chinese population. However, substantial time is needed to evaluate the 68 items. Therefore, we aimed to develop and validate a simplified FI for use in Chinese older population.
Design: Longitudinal study.
Setting and Participants: Data were drawn from the Beijing Longitudinal Study of Aging. The study was conducted in 2004 with 1808 participants evaluated using the CGA and was followed-up for 13 years. Mortality was recorded at 3, 5, 8, 10, and 13 years intervals.
Measures: 27-Item, 50-item, and 68-item frailty indices were investigated. A Cox proportional hazards model and area under the curve of the receiver operating characteristic (AUC-ROC) were calculated to compare mortality predictions.
Results: The FI was positively correlated with age in males (r = 0.174, P < 0.001) and females (r = 0.270, P < 0.001). The mean baseline FI was 0.225 ± 0.085 (range: 0.04– 0.56) as evaluated by the 27-item FI, 0.181 ± 0.117 (range: 0.02– 0.62) by the 50-item FI, and 0.167 ± 0.101 (range: 0.02– 0.59) by the 68-item FI. Cox regression models showed that mortality was significantly higher in frail people than in non-frail people for all 3 indices (p< 0.001). The AUCs of the 68-item FI, 50-item FI, and 27-item FI for predicting mortality were 0.720, 0.717, and 0.677, respectively (p< 0.001).
Conclusion: The 27-item FI is reasonable to expect that the AUC of the indices with the higher items number is inferior to the performance of the indices with higher number of items (FI50 and FI68). But 27-item maybe used as a tool to identify frail older adults and predict mortality in clinical and primary care practices in China.
Keywords: frailty index, older adults, comprehensive geriatric assessment, mortality
Introduction
Biological aging occurs at different rates in humans and frailty is a better indicator of biological aging than chronological age.1 Understanding frailty is clinically important, as it can predict health outcomes and be measured across the course of a lifetime. Comprehensively assessing patients’ risks and needs, as well as facilitating referrals to community resources, have been identified as common attributes of successful care models for patients with complex needs, such as those with higher levels of frailty.2 The most common methods used to assess frailty are the frailty phenotype3 and the frailty index (FI).4
The FI is an important method for comprehensively assessing the health of the older adults and allows us to quantify how variability in aging might arise across the adult lifespan. Moreover, the level of frailty strongly influences how a given disease might present itself in an individual.5 The FI is measured by the accumulation of deficits6 and is expressed as a ratio of deficits present to the total number of deficits being considered, the result being a number between 0 (no deficits) and 1 (all possible deficits). People with high FI scores are at substantially increased risk of adverse outcomes, including death.7 The FI is also a marker of biological age, which is useful in discriminating different degrees of frailty—even at extremely advanced ages.8
The number and types of variables included in a FI can differ. Indices consider not only physical characteristics, but also the psychosocial characteristics of frailty.9 Some researchers have also incorporated laboratory variables into the FI.10 Therefore, the number of FI variables used in different studies may vary. In general, the precision of the estimate increases with the number of variables included. An index with 30–40 variables has been shown to be sufficiently accurate for predicting adverse outcomes.11
We have previously developed and validated a 68-item FI based on the comprehensive geriatric assessment (CGA),13 entitled the CGA-FI, in a large, older Chinese population. However, this index requires a substantial amount of time to administer. Therefore, we have aimed to develop and validate a shorter, easy-to-use frailty tool for use in busy clinical practices in China.
Methods
Study Design and Data Collection
Data for this study came from the cohort of the 2004 Beijing Longitudinal Study of Aging (BLSA), which comprised 1808 older adults who were available for 3-, 5-, 8-, 10-, and 13-year follow-up assessments. Older community-dwelling adults were selected. Participants who were unable to complete the assessment were excluded from the study. A total of 1459 participants aged 60–100 years were included in the analysis, 349 (19.3%) participants were excluded due to incomplete follow-up. Comparison between the included and excluded participants were in Table S1. At the 13-year follow-up, 938 of the participants were dead.
In the original study, the questionnaire used was designed by an expert committee. Research personnel completed uniform training to conduct face-to-face surveys and participants signed informed consent forms. Instances of death were confirmed by a family member, a neighborhood or village committee. All subjects gave written informed consent in accordance with the Declaration of Helsinki and the study was approved by the ethical review board of Xuanwu Hospital Capital Medical University.
FI Construction
Frailty variables included in the FI were selected according to the requirements by Searle et al.12 The variables must be deficits associated with health status, generally increase with age, not saturate too early, cover a range of systems, and so on.12 A total of 68 variables were included in the 68-item FI, also known as the CGA-FI.13,14 It comprises five dimensions: demographic characteristics, physical health, physical function, living behavior and social function, and mental health. For further details, see Table S2. Mental health was assessed by the Center for Epidemiologic Studies Depression scale (CES-D) and the mini-Mental State Examination (MMSE). After expert panel discussion, the 68-item FI was reduced to a 50-item or 27-item index including the same five dimensions. The expert panel consisted of 12 professors major in geriatric medicine, gerontology, geroscience, epidemiology, internal medicine, evidence-based medicine, neuroscience, public health, and general medicine. In this process, all the variables satisfied the criteria by Searle et al12 and those with the most significant impact on the adverse mortality in older adults were retained. Details are shown in Tables S3 and S4.
Each item was scored as 1 if a deficit was present or 0 if no deficit was present.12 In the 27-item FI, ADL and IADL were evaluated according to the total scores, which were counted as one of the contents of the frailty-index evaluation system. Each sample was evaluated using 68-item FIs, items of FI-50 and FI-27 were selected from the FI-68.
Statistical Methods
The database was established using Epi-Data (Epi-data Association, Odense, Denmark) and then exported into SPSS 19.0 (IBM Corporation, Armonk, NY, USA) after verification and confirmation of data. Continuous measures presented as mean ± SD were compared using t-tests or one-way analysis of variance (ANOVA), and categorical data expressed as proportions were compared using chi-square tests. Age and sex adjusted Cox proportional hazard ratios were used to investigate the association between the FI scores and mortality. Area under the curve of the receiver operating characteristic (AUC–ROC) was also calculated. A value of p < 0.05 was considered statistically significant.
Results
Group Characteristics
After excluding incomplete data, 1459 participants were included in the final analysis. The age ranged from 60 to 100, and the mean age was 74.74 ± 7.25 years at baseline. There were 709 males with a mean age of 74.8 ± 7.37 years, and 750 females with a mean age of 74.68 ± 7.13 years. The cumulative follow-up 13-year mortality was found to be 64.3%.
The FI-27 scores positively correlated with age in both males (R = 0.174, P <0.001) and females (R = 0.270, P <0.001) (Figure 1).
 |
Figure 1 Distribution of FI-27 scores by age at baseline. |
Table 1 shows the demographic characteristics of the participants according to survival status. Differences in mortality between males and females was statistically significant, with male mortality at 68.3% and female mortality at 60.5% (p=0.002). Mortality increased with age (p =0.007). In addition, higher mortality was associated with smoking (p=0.004), drinking alcohol (p =0.023), less social activity (p <0.001), uneducated (p <0.001), low self-satisfaction level (p <0.001) and higher CES-D scores (p <0.001).
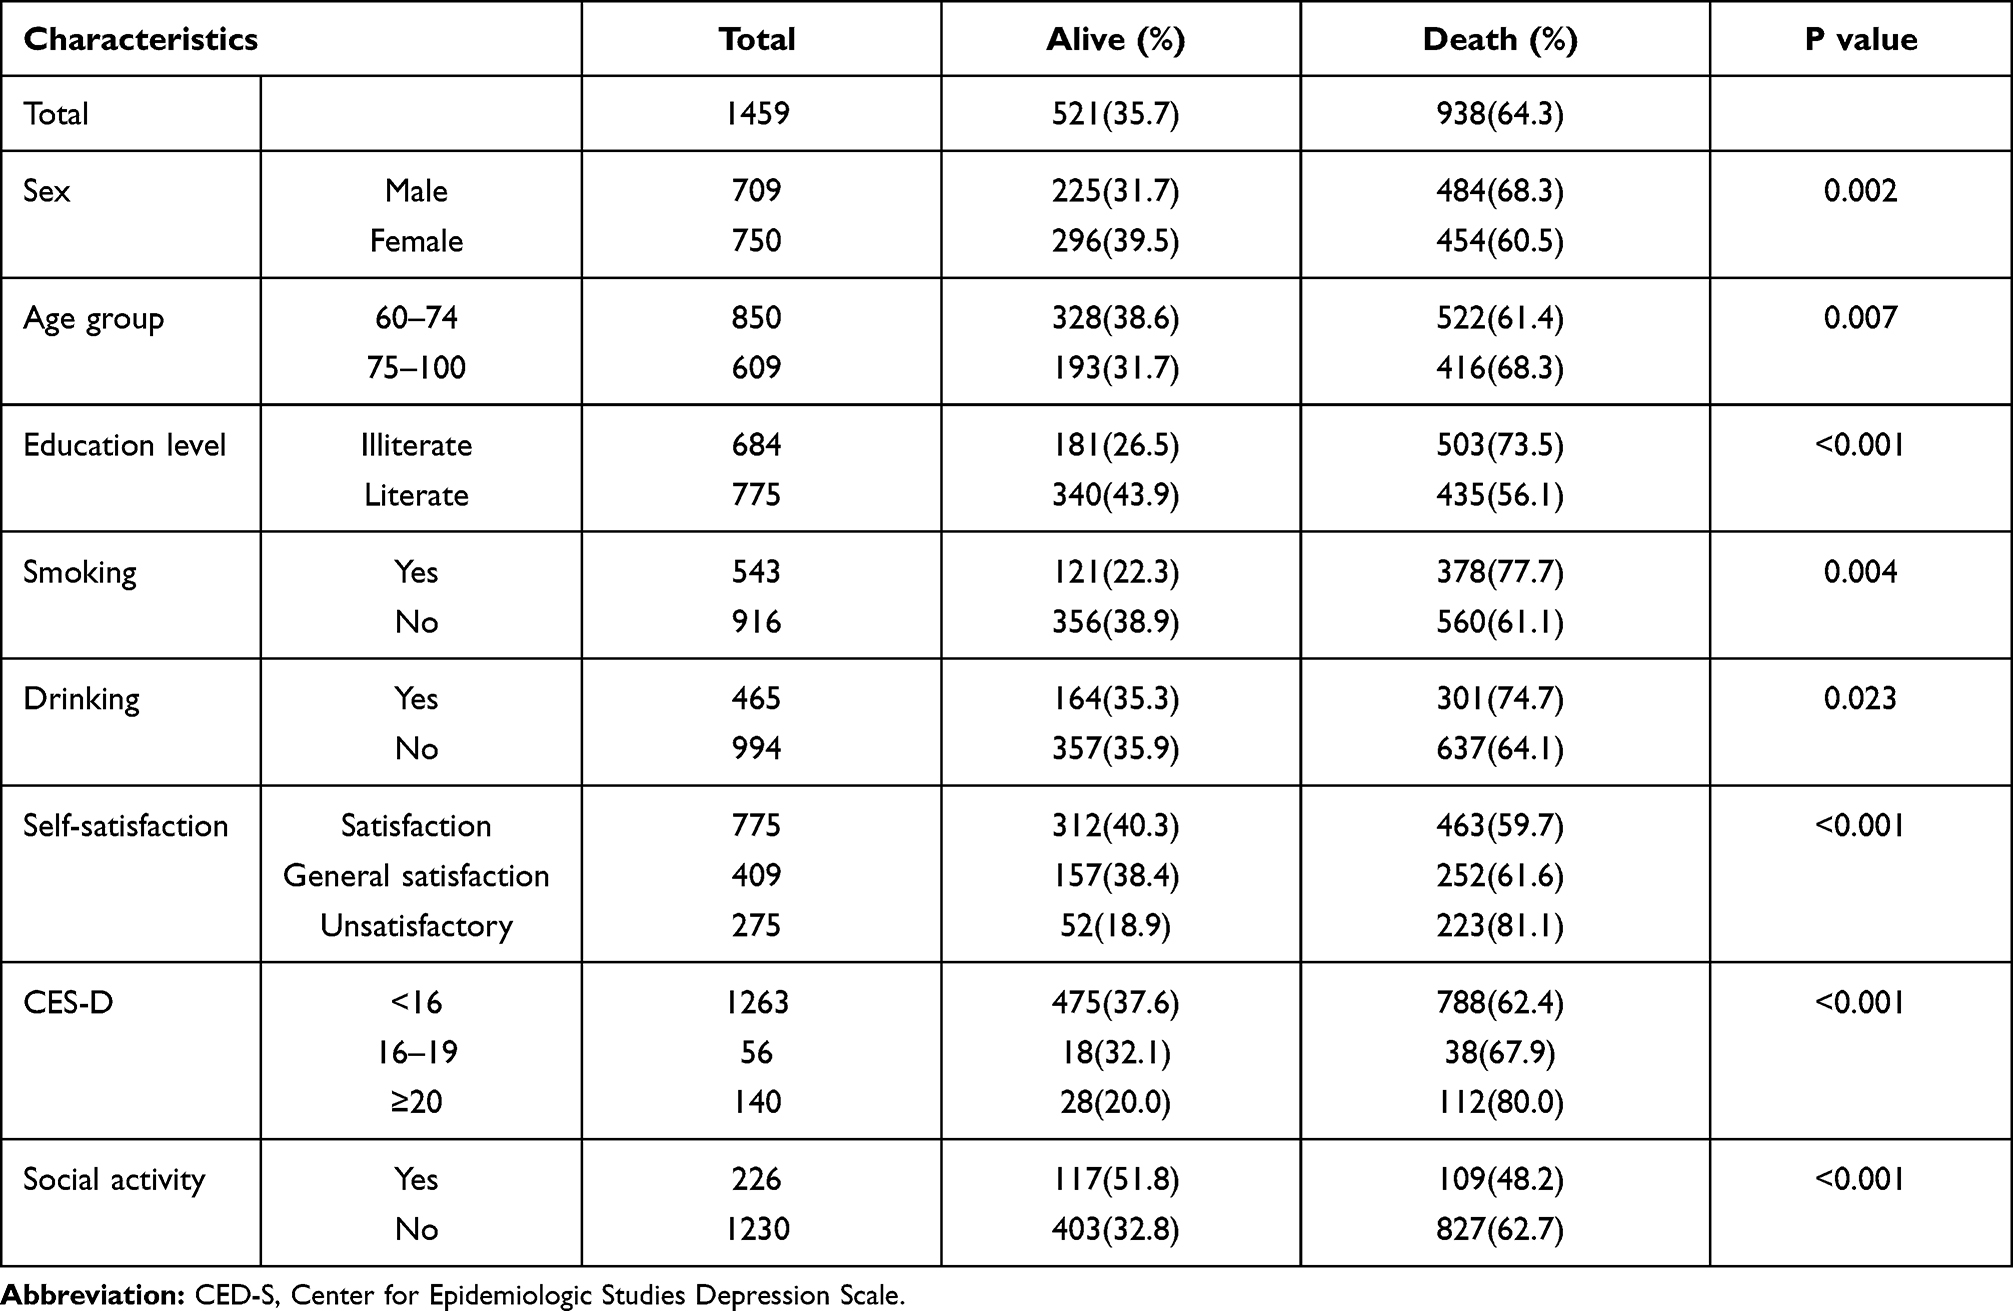 |
Table 1 Demographic and Health Characteristics of Participants According to Survival Status |
Frailty Index Scores of FI 27-Item, 50-Item and 68-Item by Different Characteristics
We examined frailty using the 68-item, 50-item, and 27-item indices (Table 2). The mean baseline CGA-FIs were 0.225 ± 0.085 (range: 0.04–0.56); 0.181 ± 0.117 (range: 0.02–0.62); and 0.167 ± 0.101 (range: 0.02–0.59) for the 27-item, 50-item, and 68-item FIs, respectively. FI scores were higher in females (except 27-item FI group), the uneducated, smokers, non-drinkers, and those with no social-activity groups. Participants with low self-satisfaction scores had higher FI scores than those with high self-satisfaction scores, and those with high CES-D scores also had higher FI scores than those with lower scores.
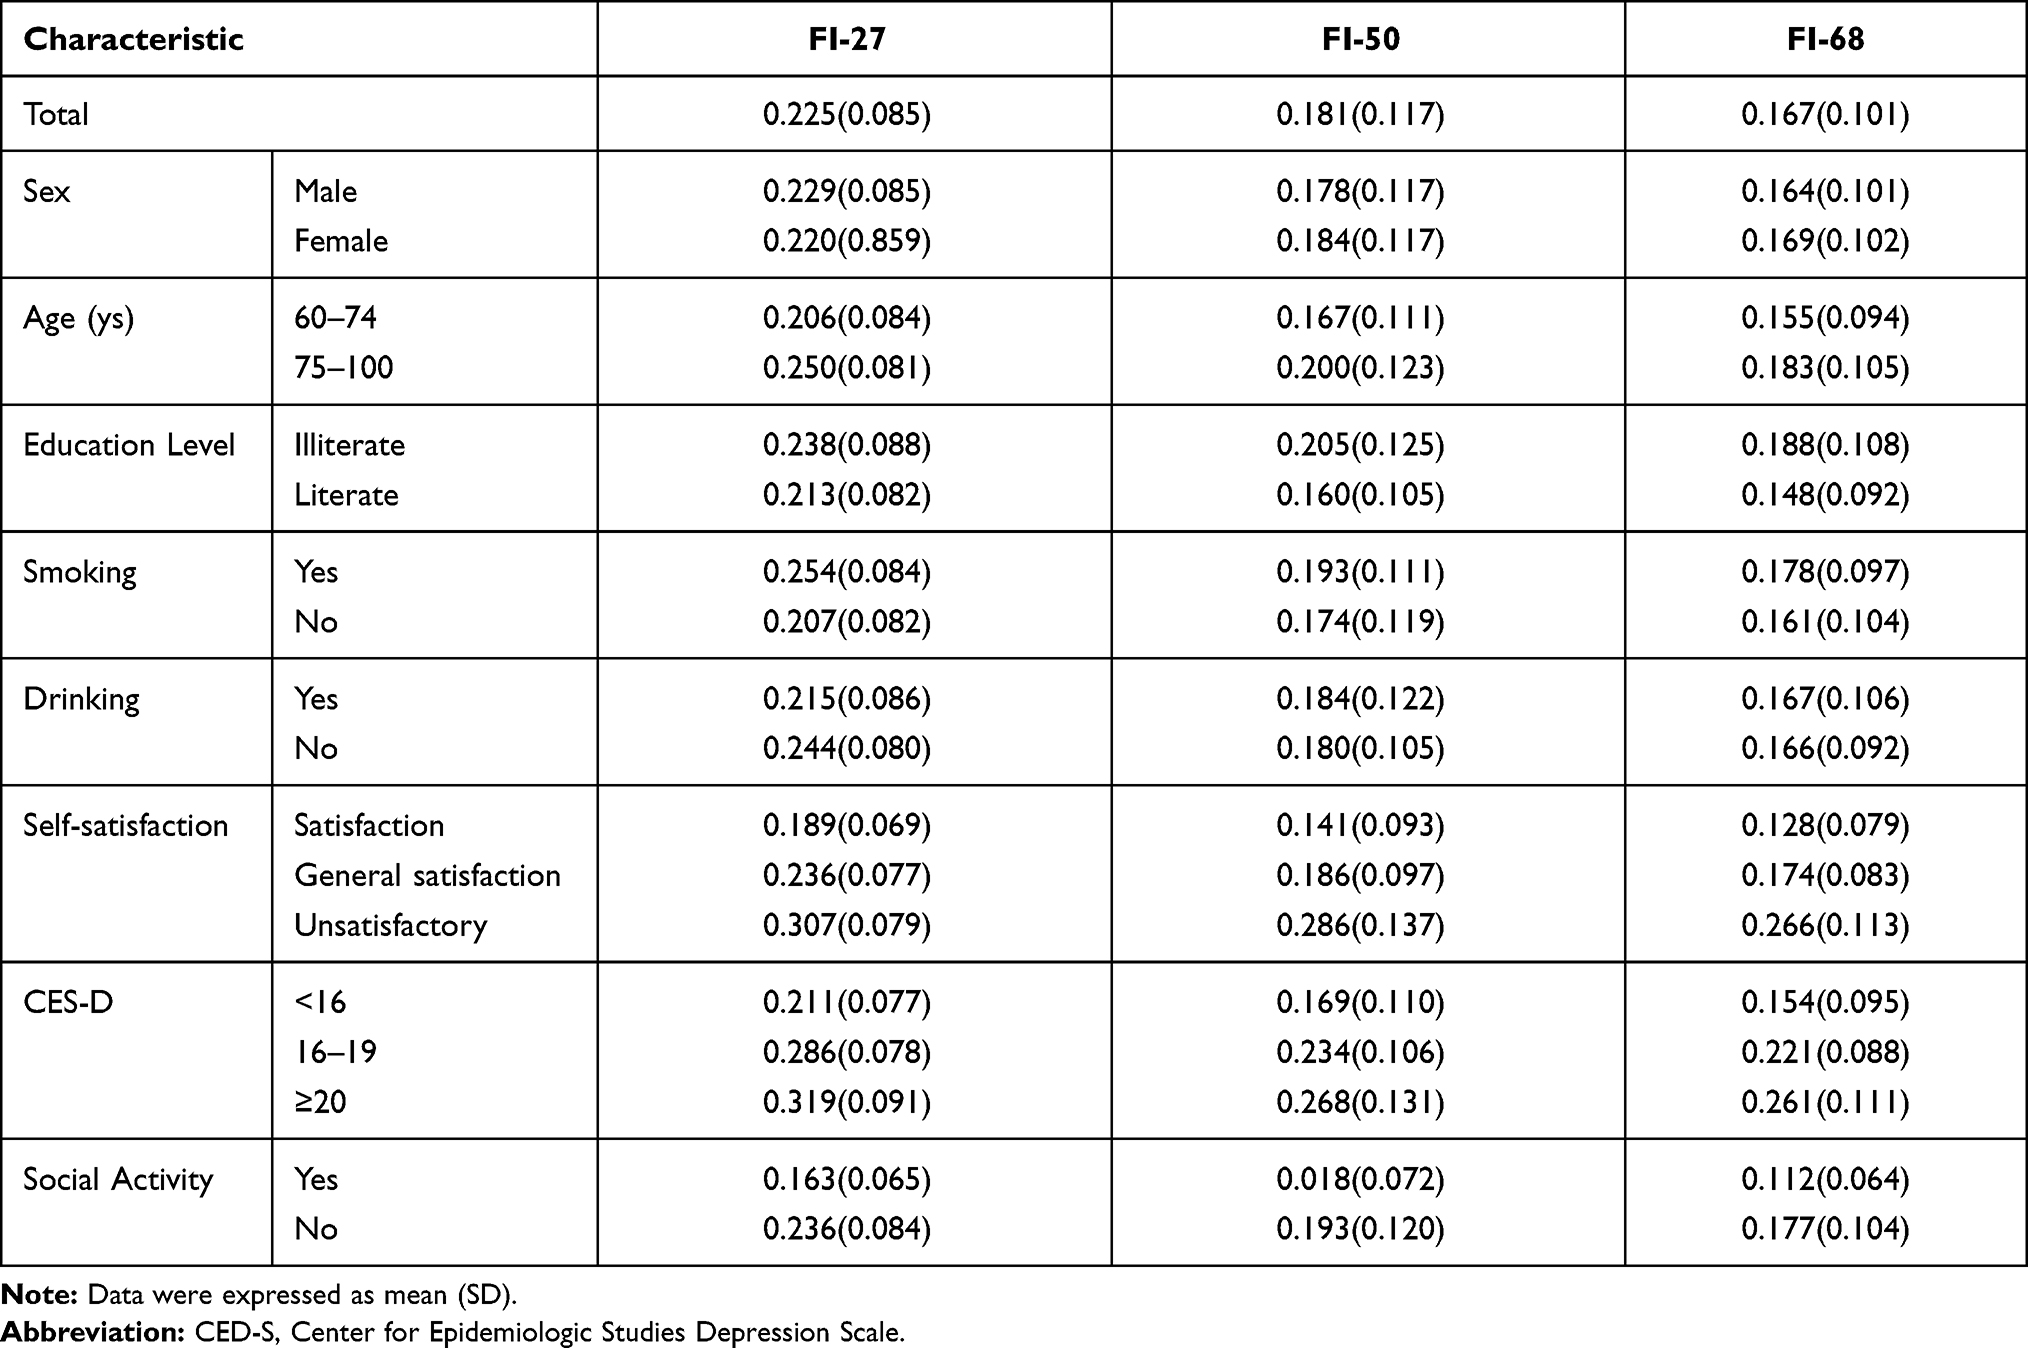 |
Table 2 Frailty Index Scores of FI 27-Item, 50-Item and 68-Item |
Predicts Mortality by the Frailty Index (FI-68, FI-650, FI-27)
The number of frail participants identified by the 68-item, 50-item, and 27-item FIs were 269 (18.44%), 301 (20.63%) and 513 (35.16%), respectively. During follow-up, 938 deaths occurred, and frailty was associated with reduced survival in all groups. The median survival time was 8 years. For the Cox regression models, a score of 0.2 was used as the boundary between frailty and non-frailty.7 The analysis suggested that the mortality of frail people was significantly higher than non-frail people using the 27-, 50-, and 68-item FIs (p<0.001 for all 3 FIs) (Figure 2). The above prediction of FIs for mortality did not change after adjusted for age, sex and chronic diseases (hypertension, diabetes, heart disease, chronic obstructive pulmonary disease) (Table 3). Hence, higher FI scores were associated with reduced survival in all 3 indices.
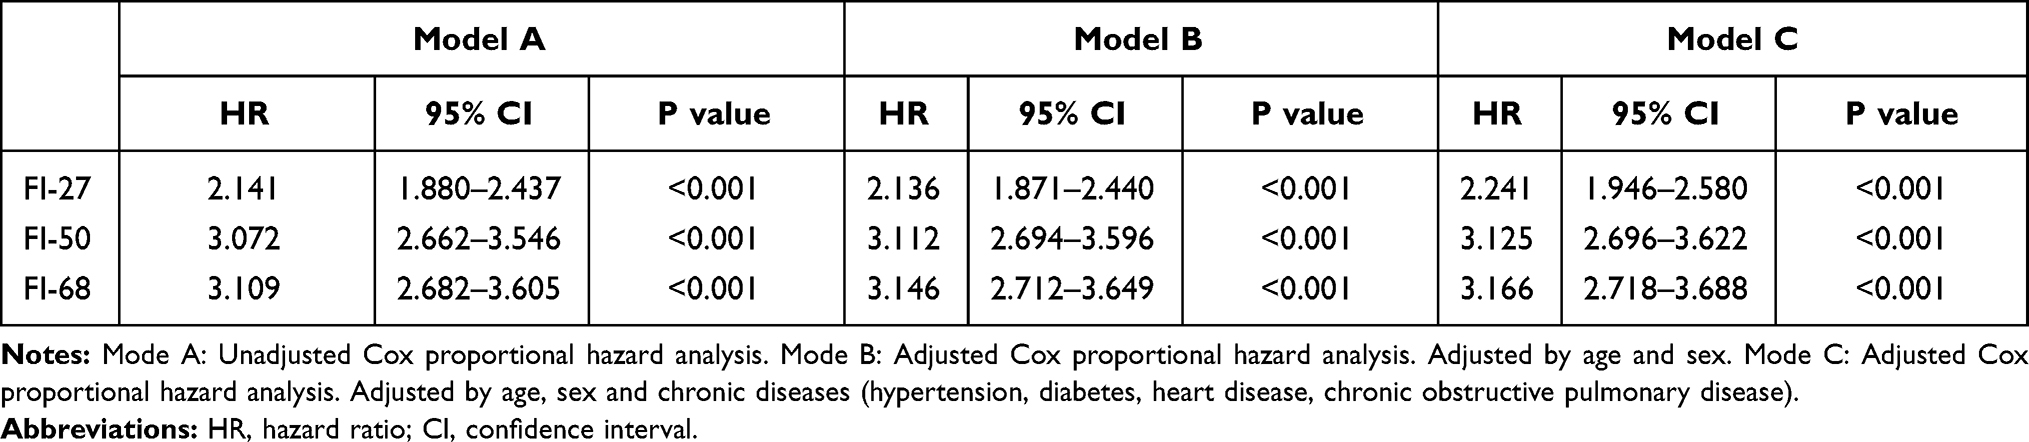 |
Table 3 Predictive Models of Mortality at 13-Year Follow-Up |
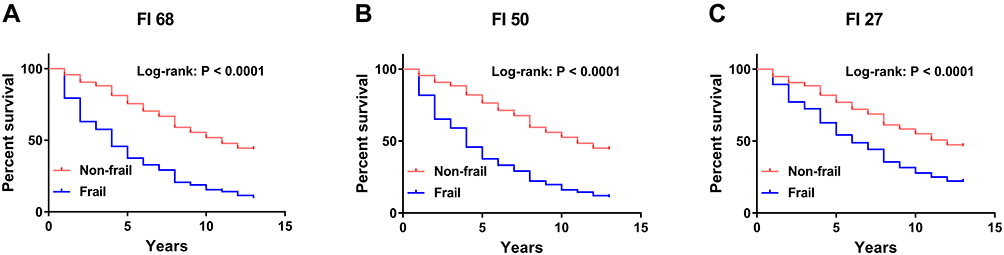 |
Figure 2 Survival curve of 13-year mortality for frail and non-frailty older people measured by FI-68, FI-50, and FI-27. (A) Survival at the frail older adults were higher than non-frail older adults assessed by FI-68 (P<0.001). (B) Survival at the frail older adults were higher than non-frail older adults assessed by FI-50 (P<0.001). (C) Survival at the frail older adults were higher than non-frail older adults assessed by FI-27 (P<0.001). |
Figure 3 shows that the AUCs of the 68-, 50- and 27-item FIs for predicting 13-year all-cause mortality were 0.720, 0.717 and 0.677, respectively. All FI scores were statistically significant (p<0.001). When used 68-item FI as a reference to identify frailty, the AUC-ROC for 50- and 27-item FIs were 0.996 and 0.922 to diagnose frailty, respectively (p<0.001).
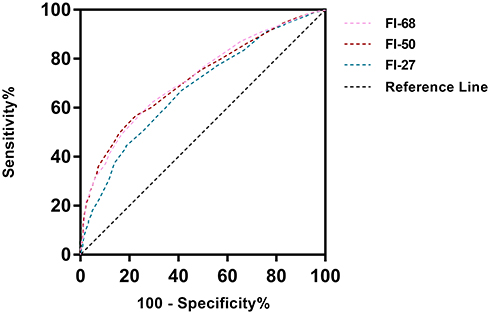 |
Figure 3 The ROC curves of FI-68, FI-50, and FI-27 to predict 13-year mortality. |
Discussion
BLSA is representative sample of older adults in Beijing of China. The present study of 1459 community-dwelling older Chinese adults indicates that, after 13 years of follow-up, the relative risk of mortality was significantly higher in frail participants than non-frail participants. This supports the findings of Mitnitski’s study.7 Łukasz Pulik15 and his team also made a modified frailty index (m-FI5 and m-FI11) as a predictor of the long-term functional result in patients undergoing primary total hip arthroplasty. We modified the 68-item FI to 27 items, which included information regarding physical and psychological characteristics, disease status, as well as other variables that showed a correlation between frailty and age. The FI scores increased with age and were consistent with previous population-based studies.16,17 Rockwood’s study suggests that gender, age, and FI were independent predictors of survival outcomes.18 Previous studies have shown that mortality is higher in men,19 smokers,20 those with depression,20,21 lower education,22 those who were less socially active,23 and those with poor, self-rated general health. These results are consistent with the results of previous and current studies on the Chinese population.14,24,25
We found the mean baseline score of the CGA-FI was 0.225 as evaluated by the 27-item FI, which is similar to a study of Dutch older adults evaluated by a 32-item FI (mean FI = 0.19).16 In the Dutch study, FI scores were higher in males, the uneducated, smokers, non-drinkers and those with no social-activity groups, which corresponded to a high mortality rate of the older adults in those groups.
Our research showed the frailty scores of the 27-item FI was the highest, while the frailty scores of the 68-item FI was the lowest. Furthermore, with the 27-item FI, if we use 0.2 as a cut-off value, more frail older adults were identified as frail. Which suggesting pre-frail older adults may be classified as frail by 27-item. However, comparisons with previous studies are difficult as different variables are frequently used to define frailty.5,15,16
The 68-item FI was used in a community of Chinese older adults, which has sound applicability and provides a useful evaluation of prognoses in older adults in the Beijing area, which is similar to the results of other studies.10,26 Consistency in frailty assessment is important when evaluating the value of an index for clinical applications. Our study used the 68-item FI as a reference, and ROC curve analysis showed that both the 50-item and 27-item FIs can accurately differentiate risk of mortality in older adults. The more essential the deficits that are taken into account, the more precise the estimation of frailty that is obtained.27 Although previous studies have suggested that 30 to 40 variables are the most stable for an evaluation of frailty,11 the 27-item FI may still be used for the rapid evaluation of frailty in the older adults. This assessment is also supported by Traven’s research that showed fewer variables can be used to assess frailty.28 The modified frailty index-11 (mFI-11) made by Łukasz Pulik has been proved to adequately reflect frailty and predict mortality.15 They further modified frailty index-5 (mFI-5) based on mFI-11, has been found the predictive values was lower than those for the general population but still had effective predictive value for mortality.29 So fewer items of FI can still be used as a predictor of mortality.
However, there are several limitations in this study. Firstly, the cumulative lost follow-up was 19.3% during the 13 year follow up in the study. Secondly, in the 27-item FI, the data for each item of ADL and IADL need to be collected which takes much time. Thirdly, the mean values of the 27-item was smaller than the other indices, which indicates that 27-item FI might underestimate the prevalence of frailty.
Conclusions and Implications
We found that FI increased with age and differed according to gender, self-satisfaction, and education level amongst other factors. Moreover, the 27-item FI has the ability to predict adverse outcomes, although it is reasonable to expect that the AUC of the indices with the higher items number is inferior to the performance of the indices with higher number of items (FI50 and FI68). All the variables on the 27-item FI are easily obtained through a questionnaire and can be used to identify high-risk mortality. This method can be easily administered to community-dwelling, older adults, and a shortened amount of time is needed to make the assessments. Strengthening medical knowledge about the health of the older adults can improve their quality of life and further improve their long-term prognoses, thus frailty is an issue deserving more attention. Further studies on application of this simplified method in clinical practice are needed.
Ethics Approval
This study was approved by ethics committee of Xuanwu Hospital Capital Medical University.
Acknowledgments
We acknowledge all the people who participated in the study. Li Zhang and Tong Ji are co-first authors for this study.
Author Contributions
All authors made substantial contributions to conception and design, acquisition of data, or analysis and interpretation of data; took part in drafting the article or revising it critically for important intellectual content; agreed to submit to the current journal; gave final approval of the version to be published; and agree to be accountable for all aspects of the work.
Funding
This work was supported by the National Key Research and Development Project of China (2018YFC2002101, 2018YFC2002100), the Beijing Natural Science Foundation (7202059), Beijing Municipal Hospital Scientific Research Training Project (PX2020036), the Ministry of Health Welfare Industry Special Fund (201002011), and the Milstein Medical Asian American Partnership Foundation Project Award in Geriatrics (2018).
Disclosure
The authors report no conflicts of interest in this work.
References
1. Kim S, Myers L, Wyckoff J, et al. The frailty index outperforms DNA methylation age and its derivatives as an indicator of biological age. Geroscience. 2017;39(1):83–92. doi:10.1007/s11357-017-9960-3
2. McCarthy D, Ryan J, Klein S. Models of care for high-need, high-cost patients: an evidence synthesis. Issue Brief. 2015;31:1–19.
3. Fried LP, Tangen CM, Walston J, et al.; Cardiovascular Health Study Collaborative Research Group. Frailty in older adults: evidence for a phenotype. J Gerontol a Biol Sci Med Sci. 2001;56(3):146–156. doi:10.1093/gerona/56.3.M146
4. Mitnitski A, Mogilner AJ, Rockwood K. Accumulation of deficits as a proxy measure of aging. Sci World J. 2001;1:323–336. doi:10.1100/tsw.2001.58
5. Rockwood K, Blodgett JM, Theou O, et al. A frailty index based on deficit accumulation quantifies mortality risk in humans and in mice. Sci Rep. 2017;7(1):43068. doi:10.1038/srep43068
6. Rockwood K, Mitnitski A. Frailty in relation to the accumulation of deficits. J Gerontol a Biol Sci Med Sci. 2007;62(7):722–727. doi:10.1093/gerona/62.7.722
7. Mitnitski A, Xiaowei S, Skoog I, et al. Relative fitness and frailty of elderly men and women in developed countries and their relationship with mortality. J Am Geriatr Soc. 2005;53(12):2184–2189. doi:10.1111/j.1532-5415.2005.00506.x
8. Arosio B, Ferri E, Casati M, et al. The frailty index in centenarians and their offspring. Aging Clin Exp Res. 2019;31(11):1685–1688. doi:10.1007/s40520-019-01283-7
9. Yanase T, Yanagita I, Muta K, Nawata H. Frailty in elderly diabetes patients. Endocr J. 2018;65(1):1–11. doi:10.1507/endocrj.EJ17-0390
10. Wang Y, Zhang R, Shen Y, et al. Prediction of chemotherapy adverse reactions and mortality in older patients with primary lung cancer through frailty index based on routine laboratory data. Clin Interv Aging. 2019;14:1187–1197. doi:10.2147/CIA.S201873
11. Ferrucci L, Guralnik JM, Studenski S, et al.; Interventions on frailty working group. Designing randomized, controlled trials aimed at preventing or delaying functional decline and disability in frail, older persons: a consensus report. J Am Geriatr Soc. 2004;52(4):625–634. doi:10.1111/j.1532-5415.2004.52174.x
12. Searle SD, Mitnitski A, Gahbauer EA, et al. A standard procedure for creating a frailty index. BMC Geriatr. 2008;30(8):24. doi:10.1186/1471-2318-8-24
13. Ma L, Zhang L, Tang Z, et al. Use of the frailty index in evaluating the prognosis of older people in Beijing: a cohort study with an 8-year follow-up. Arch Gerontol Geriatr. 2016;64(64):172–177. doi:10.1016/j.archger.2015.11.002
14. Ma L, Tang Z, Zhang L, et al. Prevalence of frailty and associated factors in the community-dwelling population of China. J Am Geriatr Soc. 2018;66(3):559–564. doi:10.1111/jgs.15214
15. Pulik Ł, Jaśkiewicz K, Sarzyńska S, et al. Modified frailty index as a predictor of the long-term functional result in patients undergoing primary total hip arthroplasty. Reumatologia. 2020;58(4):213–220. doi:10.5114/reum.2020.98433
16. Hoogendijk EO, Theou O, Rockwood K, et al. Development and validation of a frailty index in the Longitudinal Aging Study Amsterdam. Aging Clin Exp Res. 2017;29(5):927–933. doi:10.1007/s40520-016-0689-0
17. Theou O, Park GH, Garm A, et al. Reversing reversing frailty levels in primary care using the CARES model. Can Geriatr J. 2017;20(3):105–111. doi:10.5770/cgj.20.274
18. Rockwood K, Mitnitski AB, MaeKnight C. Some mathematical models of frailty and their clinical implications. Rev Clin Gerontol. 2002;12(2):109–117. doi:10.1017/S0959259802012236
19. Abe T, Kitamura A, Seino S, et al. Differences in the prevalence of and factors associated with frailty in five Japanese residential areas. Int J Environ Res Public Health. 2019;16(20):3974. doi:10.3390/ijerph16203974
20. Wu PY, Chao CT, Chan DC, et al. Contributors, risk associates, and complications of frailty in patients with chronic kidney disease: a scoping review. Ther Adv Chronic Dis. 2019;10:2040622319880382. doi:10.1177/2040622319880382
21. Almeida O, Hankey G, Yeap B, et al. Depression, frailty, and all-cause mortality: a cohort study of men older than 75 years. J Am Med Dir Assoc. 2015;16(4):296–300. doi:10.1016/j.jamda.2014.10.023
22. Liu HX, Ding G, Yu WJ, et al. Association between frailty and incident risk of disability in community-dwelling elder people: evidence from a meta-analysis. Public Health. 2019;175:90–100. doi:10.1016/j.puhe.2019.06.010
23. Makizako H, Shimada H, Doi T, et al. Physical frailty predicts incident depressive symptoms in elderly people: prospective findings from the Obu Study of health promotion for the elderly. J Am Med Dir Assoc. 2015;16(3):194–199. doi:10.1016/j.jamda.2014.08.017
24. Wu C, Smit E, Xue QL, et al. Prevalence and correlates of frailty among community-dwelling Chinese older adults: the China Health and Retirement Longitudinal Study. J Gerontol a Biol Sci Med Sci. 2017;73(1):102–108. doi:10.1093/gerona/glx098
25. Chen LJ, Chen CY, Lue BH, et al. Prevalence and associated factors of frailty among elderly people in Taiwan. Int J Gerontol. 2014;8(3):114–119. doi:10.1016/j.ijge.2013.12.002
26. Romero-Ortuno R, Kenny RA. The frailty index in Europeans: association with age and mortality. Age Ageing. 2012;41(5):684–689. doi:10.1093/ageing/afs051
27. Rockwood K, MacKnight C, Hogan D. Conceptualization and instrumentation of frailty. Drugs Aging. 2000;17(4):295–302. doi:10.2165/00002512-200017040-00005
28. Traven SA, McGurk KM, Reeves RA, et al. Modified frailty index predicts medical complications, length of stay, readmission, and mortality following total shoulder arthroplasty. J Shoulder Elbow Surg. 2019;28(10):1854–1860. doi:10.1016/j.jse.2019.03.009
29. Subramaniam S, Aalberg JJ, Soriano RP, et al. The 5-factor modified frailty index in the geriatric surgical population. Am Surg. 2020;30:3134820952438.
 © 2021 The Author(s). This work is published and licensed by Dove Medical Press Limited. The
full terms of this license are available at https://www.dovepress.com/terms
and incorporate the Creative Commons Attribution
- Non Commercial (unported, 3.0) License.
By accessing the work you hereby accept the Terms. Non-commercial uses of the work are permitted
without any further permission from Dove Medical Press Limited, provided the work is properly
attributed. For permission for commercial use of this work, please see paragraphs 4.2 and 5 of our Terms.
© 2021 The Author(s). This work is published and licensed by Dove Medical Press Limited. The
full terms of this license are available at https://www.dovepress.com/terms
and incorporate the Creative Commons Attribution
- Non Commercial (unported, 3.0) License.
By accessing the work you hereby accept the Terms. Non-commercial uses of the work are permitted
without any further permission from Dove Medical Press Limited, provided the work is properly
attributed. For permission for commercial use of this work, please see paragraphs 4.2 and 5 of our Terms.