Back to Journals » Risk Management and Healthcare Policy » Volume 14
A Second Wave? What Do People Mean by COVID Waves? – A Working Definition of Epidemic Waves
Authors Zhang SX ![]() , Arroyo Marioli F, Gao R, Wang S
, Arroyo Marioli F, Gao R, Wang S
Received 22 June 2021
Accepted for publication 25 August 2021
Published 13 September 2021 Volume 2021:14 Pages 3775—3782
DOI https://doi.org/10.2147/RMHP.S326051
Checked for plagiarism Yes
Review by Single anonymous peer review
Peer reviewer comments 2
Editor who approved publication: Dr Jongwha Chang
Stephen X Zhang,1 Francisco Arroyo Marioli,2 Renfei Gao,3 Senhu Wang4
1Faculty of Professions, University of Adelaide, Adelaide, SA, Australia; 2Central Bank of Chile, Santiago, Chile; 3Manchester Business School, University of Manchester, Manchester, UK; 4Department of Sociology and the Centre for Family and Population Research, National University of Singapore, Singapore
Correspondence: Stephen X Zhang Email [email protected]
Introduction: Policymakers and researchers describe the COVID-19 epidemics by waves without a common vocabulary on what constitutes an epidemic wave, either in terms of a working definition or operationalization, causing inconsistencies and confusions. A working definition and operationalization can be helpful to characterize and communicate about epidemics.
Methods: We propose a working definition of epidemic waves in the ongoing COVID-19 pandemic and an operationalization based on the public data of the effective reproduction number R.
Results: Our operationalization characterizes the numbers and durations of waves (upward and downward) in 179 countries.
Discussions: The proposed working definition of epidemic waves provides a common and consistent vocabulary that can enable healthcare organizations and policymakers to make better description and assessment of the COVID crisis to make more informed resource planning, mobilization, and allocation temporally in the continued COVID-19 pandemic.
Keywords: COVID wave, epidemic wave, second wave, epidemiology, infection
Introduction
Mike Pence, US vice president then, penned an op-ed in The Wall Street Journal headlined: “There isn’t a coronavirus ‘second wave’”.1 On the same day, the American top federal infectious disease expert, Anthony Fauci, countered via The Wall Street Journal that: “People keep talking about a second wave,” but “we’re still in a first wave”.2 A Google search yielded 30 million mentions of COVID “second wave” by March 2021. What do they mean by “first wave” and “second wave”? Unfortunately, “a wave is just a metaphor … -a term without a precise definition in epidemiology”.3
Despite its lack of a definition, the concept of second wave has gained huge popularity and profound implications. For instance, the UK Prime Minister warned all UK citizens that they must “prepare for the second wave of COVID”. Israeli authorities stated officially that “the country was going through a second wave”.3 And the Chief Medical Officer of Australia said a second wave would be “the most worrying thing of all”. Similarly, scientists have referred to wave repeatedly without even a working definition. Yet, all of us want to know whether a place is experiencing the first wave, have gone through the peak of it, or are battling the second wave, third wave, etc, because such a characterization of COVID-19 epidemics carries profound implications on people’s lives, works, and physical and mental health. After all, the concept of waves in the past pandemics, such as the 1918 influenza epidemic, greatly helped people to understand those pandemics in greater detail to enable better communication, policies and actions.
The article aims to put forward a working definition of what constitutes a wave so that people can have a common language to use, interpret and discuss epidemic waves in the ongoing COVID pandemic. The working definition aims to use the prevailing characterizations of epidemic waves to reduce the arbitrariness that muddles the tumultuous concept at present. A thorough search reveals M.D., epidemiologists, and policymakers do share the same underlying principles of the term wave. Popular media explain “the word ‘wave’ implies a natural pattern of peaks and valleys”.4 WHO stated in order to say one wave is ended, the virus has to be brought under control and cases have to fall substantially, … Then for a second wave to start, you need a sustained rise in infections.5
“A wave is also different to a “spike” in cases — another frequently used term”.3 “A spike [or upsurge] is a momentary phenomenon”.3 Moreover, in the case of epidemic waves of COVID, it is probably not realistic for the number of new cases to drop to zero, but ideally one would like to see sustained decreases in the number of new cases over time or stability in the number of new cases over time.6
Such convergence in conceptual underlying of the term “wave” allows us to offer a working definition of the concept based on two key defining characteristics: 1) an epidemic wave constitutes some upward and/or downward periods; 2) the increase in an upward period or the decrease in a downward period have to be substantial by sustaining over a period of time to distinguish them from an uptick, a downtick, reporting errors, or volatility in new cases.
Method
Based on the working definition, we propose to operationalize the epidemic wave by a publicly-available real-time index, the effective reproduction number, R, which refers to the average number of people infected by a single infectious individual in real-time as the epidemic happens.7 When R>1, the number of cases increases, and when R<1 the number of cases decreases. R plays a central role in the epidemiology of infectious diseases, because R estimates are not sensitive to potential model misspecification and fairly accurate even when new cases are imperfectly measured.7
If R is significantly larger than 1 for a sustained period, we identify that time period as an upward period. Inversely, If R is significantly smaller than 1 for a sustained period, we identify a downward period. This paper establishes a statistical criterion by whether R has been above or below 1 for the past n days (we set n=14). If so, we identify either upward or downward periods. With this method, the readers can characterize using their preferred parameters (eg n=7 or 21), and the method can apply to country as well as region for cross- comparisons. More statistical details can be found in the Online Appendix.
Results
Based on the proposed working definition and operationalization, we used public R data up to January 26th, 2020 to identify waves in 179 countries as an illustration of a working definition of epidemic waves based on the COVID-19 contexts, especially the temporality of transmission and the cyclicity of infection case reporting (details in the Online Appendix). Table 1 reports the total amount of upward/downward periods in 179 countries by January 26, 2021. There are 270 upward periods in total. Most countries (73.2%) had at least one upward periods, and the countries without any upward period are mostly island countries, tiny countries, or undeveloped countries that might lack testing. The number of countries with 1, 2, 3, 4, 5 upward periods are 45, 52, 20, 9 and 5 respectively. There are in total 37 downward periods. Most countries (85.4%) had no downward period so far. The number of countries with 1, 2, 3 downward periods are 19, 6, and 2, respectively. The durations of upward periods and downward periods averaged 61.7 (s.d.= 47.0) and 33.6 (s.d.= 17.0) days respectively. The number and durations of downward periods does not match the number of upwards periods because many countries still could not decrease their COVID-19 cases for a sustained period of time to constitute a downward period by early 2021.
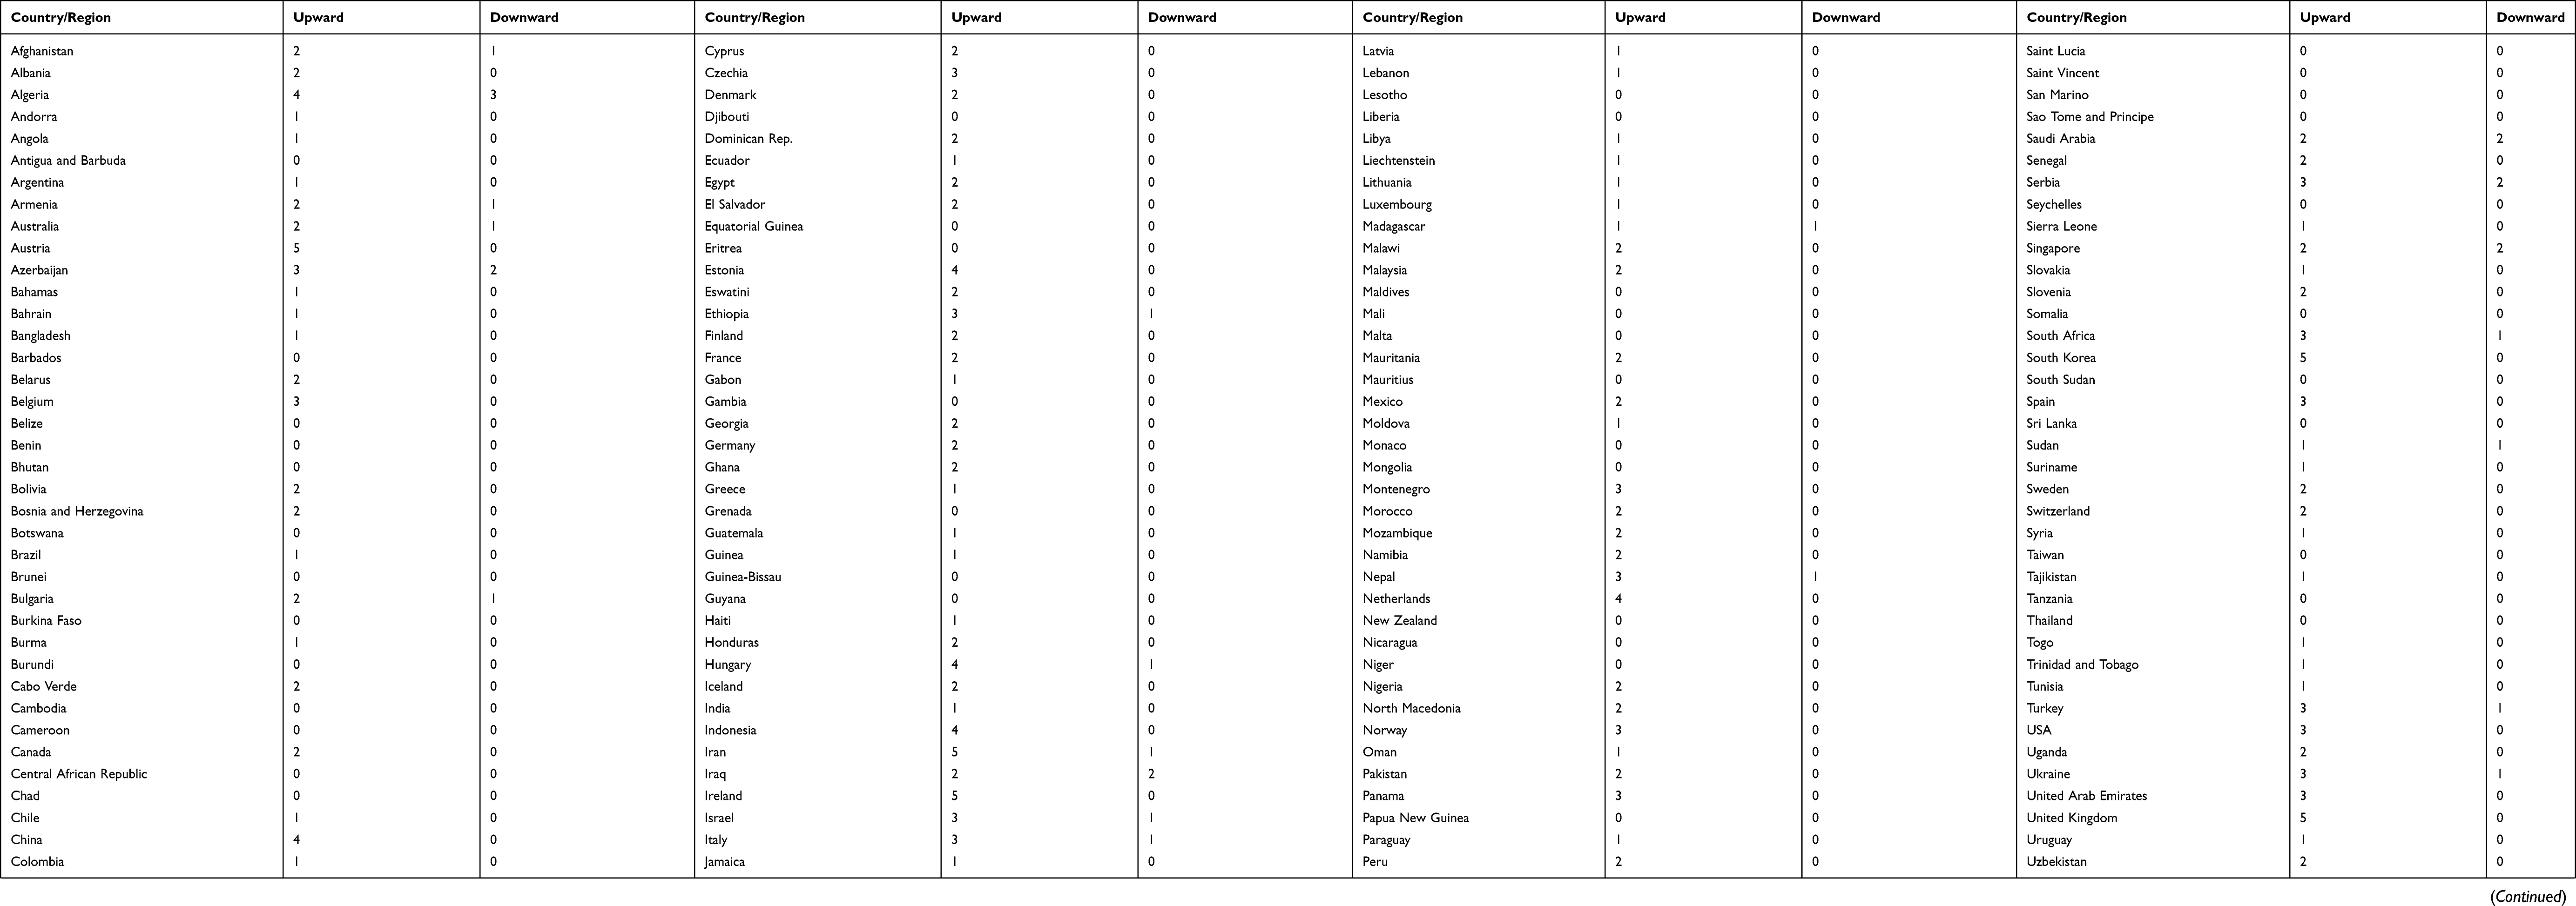 |
Table 1 Number of Upwards and Downwards Periods Across Countries |
The Number and Duration of Upward and Downward Waves by Regions and Country Groups
We break down the count and duration of upward and downward first by developed and developing (including undeveloped) economies. Developed countries have experienced a similar number of upward periods to developing countries (133 times vs 137 times) but shorter upward periods (52.9 days vs 70.2 days; d=−17.3 days) than developing countries. Moreover, developed countries have experienced a similar number of downward periods to developing countries (19 times vs 18 times) but shorter downward periods (30.5 days vs 36.9 days; d=−6.4 days) than developing countries. Most of the developed economies have gone through more than one upward periods, though not always followed by a downward one (65.1% that have at least one upward period have no downwards). For example, the US has suffered three upward periods, but not any downward period; Italy has had three upward periods but only one downward period. Many developed economies have had upward periods, followed by some effort to contain the upward trend, yet the effort has mostly tempered the reproduction to stabilize it rather than being able to lead to a sustained downward period. Such a characterization can help policymakers and healthcare organizations to better understand the typical patterns by not only economic development but also by other attributes (eg, cultural, institutional, populational factors), for better planning, resource allocation and policy decisions in advance. For instance, health authorities can better plan the temporal demand for medical resources, whereas economic policymakers can be more informed in drafting policies.
Correlation Between Upward/Downward Counts/Duration and Other Country-Level Statistics
We examine how the duration and count of upward and downward periods correlated with each other and other key country-level statistics (Table 2). The duration of upward periods and the duration of downward periods are negatively correlated (r=−0.27, p=0.00), indicating countries with longer upward periods tend to have shorter downward periods. The number of upward and the duration of downward period in a country are also positively correlated (r=0.27, p=0.00), indicating countries with more upward periods tend to have more downward periods.
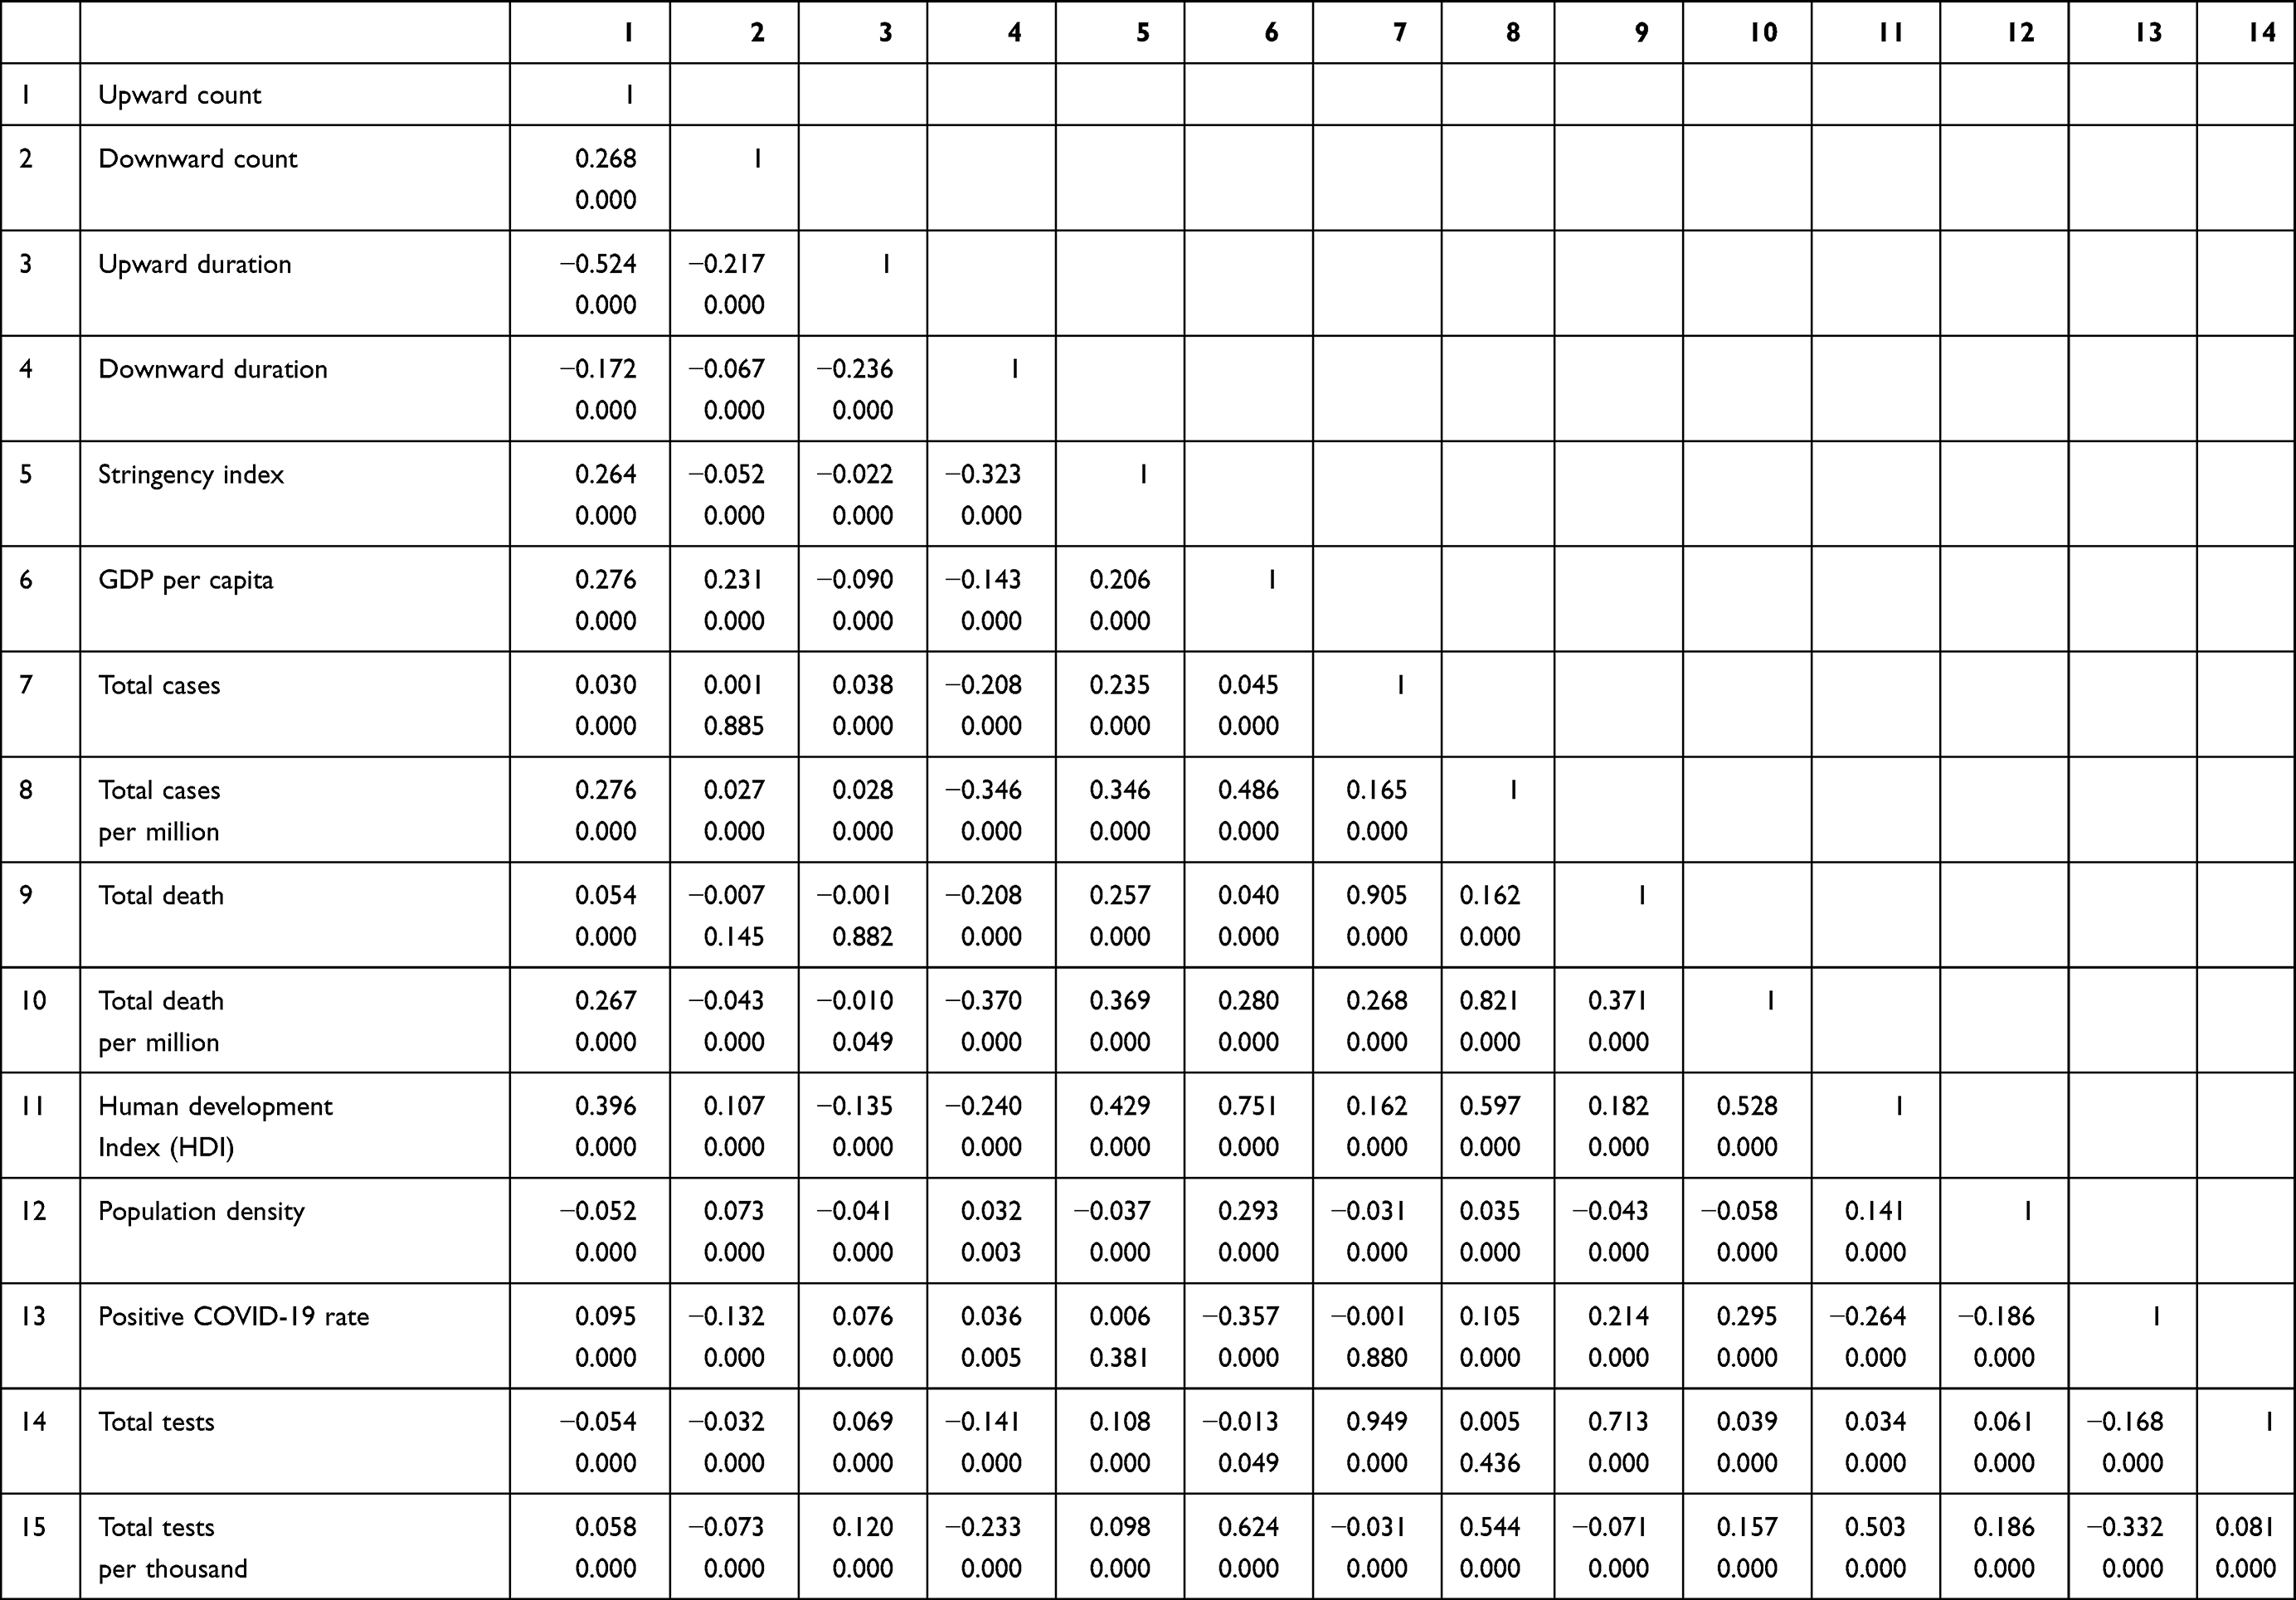 |
Table 2 Correlations Matrix: The Number/Duration of Upward/Downward Periods and Key Country-Level Indicators (Number of Countries: n = 177) |
Countries with higher GDP per capita tend to have shorter duration of upward periods (r= −0.09, p=0.00) and downward periods (r= −0.14, p=0.00) yet more number of upward periods (r= 0.28, p=0.00) and downward periods (r= 0.32, p=0.00). Similarly, countries with higher Human Development Index (HDI) tend to have shorter duration of upward periods (r= −0.14, p=0.00) and downward periods (r= −0.24, p=0.00) yet more number of upward periods (r= 0.40, p=0.00) and downward periods (r= 0.11, p=0.00). Lastly we examine the correlation with the stringency index, which reveals that countries with more stringent measures on COVID-19 have shorter duration of upward periods (r= −0.02, p=0.00) and downward periods (r= −0.32, p=0.00) and more upward periods (r= 0.26, p=0.00) and fewer downward periods (r=−.05, p=0.00).
Discussion
This paper offers a working definition of epidemic waves that can characterize the ongoing COVID pandemic in real-time. The data used to operationalize the epidemic wave are publicly available (eg, the website of John Hopkins COVID-19 statistics) not only at the country-level but also at the more granular regional levels (eg, the USA states) to characterize epidemic waves at different levels. It is also possible to include the upward and downward periods of waves in such websites to enable a common ground for public and the policymakers to understand the ongoing epidemics.
First, it is essential to characterize waves, and our working definition and an operationalization provides a common ground for health communication, as to date such a common ground is lacking among different world leaders and healthcare experts. Our characterization approach consists of a statistical criterion that can be applied in real-time, so that we are not subject to various post hoc interpretations of waves, as it happened in the Spanish flu pandemic. The characterization of waves can help policymakers to make more informed decisions on resource mobilization and distribution over time as the COVID-19 epidemic evolves. Reliable descriptions are essential for estimating the true impact of COVID- 19 and the control of COVID-19 across countries over time. “All of this requires collection of clear, uniform and comparable” characterization of the epidemic in real-time, and we hope our working definition of an epidemic wave offers a springboard in that direction.
Second, our findings that most countries (eg, USA and UK) have had more upward periods than downward periods in the year 2020 suggest that these countries had not decreased the infection for a sustained period of time. The containment strategies in many countries (especially developed countries) have broken the upward periods (ie, upward, stagnant, and then upward) but did not result in a sustained period of time and hence may effectively just delayed the epidemic and could have wasted the window of opportunities. Indeed, many countries and regions declared success in their containment strategies in mid-2020 while in fact they did not decrease the infection for a sustained period of time. Our characterization of epidemic waves can help to examine the effectiveness of interventions from the identification of downward periods as well as the triggers of upward periods across regions to prevent the occurrence of subsequent waves.
While it is hard to compare the daily or total COVID-19 deaths and cases between countries due to their different sizes, waves capture the changes (upward or downward) within a country and hence present an alternative approach to assess the fluctuation of epidemics in a country or a region. The working definition of epidemic waves can be universally applied across countries/regions, hence offering an alternative way that is more comparable, given that epidemiology is built on the idea of studying differences between populations. Much of what we have learnt about the causes of disease has had its origins in comparisons of countries.
As countries adopt different approaches over time to deal with the COVID-19, it offers some possibilities to learn what works best for controlling COVID-19, given the lack of real randomized control experiments in epidemiology. Epidemiologists call for more thoughtful and thorough analyses of country differences, … remain probably the most important and most valid evidence for informing COVID-19 policy in real-time (18).
Specifically, the identification of the upward and downward periods (counts and durations) in various countries may be matched with the containment strategies in those countries to help identify effective strategies to curtail the wave.
Overall, using our results, government and policy makers can have a better understanding of definition of COVID-19 waves and therefore potentially formulate better strategies to allocate medical and public resources. Such patterns can inform policymakers and healthcare organizations. For instance, knowing the pattern that longer upward periods are usually followed by longer downward periods has direct implications for planning and resource allocation decisions on medical supplies, personnel, infrastructure, etc. Such information is crucial not only for healthcare organizations and policies but also for social and economic policies, as the COVID-19 situation changes the social-economic policies that aim to cope with the epidemic situations. Also, establishing an unified framework of defining COVID-19 waves could also facilitate international collaboration across countries to prevent and tackle the pandemic. Such an unified understanding would be particularly helpful for developing countries with scarce medical resources to estimate and understand the epidemic waves locally. However, it should be noted that we demonstrate an approach, and the exact model would require specific calibration to take into account of the situation in COVID-19 or any other epidemics.
Limitation and Future Research
Our approach is limited by the following points. First, COVID-19 daily cases may be misreported, and reporting delays and inconsistent practices for defining and testing COVID-19 cases may also influence the accuracy of daily cases, which are the input to calculate the reproduction rate and hence the characterization of waves. Moreover, as the COVID-19 crisis still continues and worsens in many parts of the world, our findings remain incomplete and need to be updated as new data arrive. To reduce the noise and errors in daily reporting, our definition picks the average of the past 14 days. However, the average over 14-day samples does come at a trade-off that a sharp to exceptionally low values within a couple of days may not be statistically significant. Our choice of the parameter offers one possible illustration of the calibration of a working definition of epidemic waves, and other calibrations are possible. Our working definition characterizes waves by upward periods and downward periods, the fundamental elements of waves. We notice many broken waves (ie, an upward period, a break, an upward period), so epidemic waves may not follow a symmetrical pattern of an upward period followed by a downward period in some waves. In that sense, our approach can be used to characterize continued upward and downward periods as well.
Conclusion
This working definition and operationalization, as we demonstrate, is straightforward yet can be customized or subject to robustness checks. A wave of COVID-19 cannot be declared arbitrarily by any individuals without a common definition. The first questions we need to understand are: “what do we mean by epidemic waves, then where do waves occur and not occur, and what can we learn from this?”.
Data Sharing Statement
All data, code, and materials used in the analysis are available online publicly and can be requested from the corresponding author. The study complied with the Declaration of Helsinki.
Funding
Dr Senhu Wang received funding from the Major Project of the National Social Science Fund of China (No. 19ZDA149) at Nanjing University, China and Assistant Professor Start-up Grant and Center for Family and Population Research Faculty Development Grant at the National University of Singapore.
Disclosure
The authors declare no competing interests.
References
1. Wall Street Journal. There isn’t a coronavirus ‘second wave’. Available from: https://www.wsj.com/articles/there-isnt-a-coronavirus-second-wave-11592327890.
2. Wall Street Journal. Fauci warns of coronavirus resurgence if states don’t adhere to safety guidelines. Available from: https://www.wsj.com/articles/fauci-warns-of-coronavirus-resurgence-if-states-dont-adhere-to-safety-guidelines-11592338771?mod=searchresults&page=1&pos=2%2527.
3. BBC News. South Korea says it has a second wave of coronavirus infections — but what does that really mean? Available from: https://www.abc.net.au/news/2020-06-24/coronavirus-covid-19-countries-second-wave-explainer-south-korea/12385882.
4. The conversation. What makes a ‘wave’ of disease? An epidemiologist explains. Available from: https://theconversation.com/what-makes-a-wave-of-disease-an-epidemiologist-explains-141573.
5. BBC News. Coronavirus: what is a second wave and is one coming? Available from: https://www.bbc.co.uk/news/health-53113785.
6. KHN. Is a second wave of coronavirus coming? Available from: https://khn.org/news/fact-check-is-a-second-wave-of-coronavirus-coming/.
7. Arroyo Marioli F, Bullano F, Kucinskas S, Rondon-Moreno C. Tracking R of covid-19: a new real-time estimation using the Kalman filter. PlosOne. 2021;16:e0244474. doi:10.1371/journal.pone.0244474
 © 2021 The Author(s). This work is published and licensed by Dove Medical Press Limited. The
full terms of this license are available at https://www.dovepress.com/terms
and incorporate the Creative Commons Attribution
- Non Commercial (unported, 3.0) License.
By accessing the work you hereby accept the Terms. Non-commercial uses of the work are permitted
without any further permission from Dove Medical Press Limited, provided the work is properly
attributed. For permission for commercial use of this work, please see paragraphs 4.2 and 5 of our Terms.
© 2021 The Author(s). This work is published and licensed by Dove Medical Press Limited. The
full terms of this license are available at https://www.dovepress.com/terms
and incorporate the Creative Commons Attribution
- Non Commercial (unported, 3.0) License.
By accessing the work you hereby accept the Terms. Non-commercial uses of the work are permitted
without any further permission from Dove Medical Press Limited, provided the work is properly
attributed. For permission for commercial use of this work, please see paragraphs 4.2 and 5 of our Terms.