Back to Journals » Cancer Management and Research » Volume 11
A sample model established by S-index predicting overall survival after curative resection of primary hepatocellular carcinoma
Authors Chen L, Cai BB, Zhou CJ ![]() , Hou XQ, Hu SP, Fang G, Chen WC, Li LH, Yang WJ
, Hou XQ, Hu SP, Fang G, Chen WC, Li LH, Yang WJ
Received 6 November 2018
Accepted for publication 7 December 2018
Published 14 January 2019 Volume 2019:11 Pages 693—703
DOI https://doi.org/10.2147/CMAR.S193593
Checked for plagiarism Yes
Review by Single anonymous peer review
Peer reviewer comments 2
Editor who approved publication: Dr Kenan Onel
Lei Chen,1 Bin-Bin Cai,1 Chao-Jun Zhou,1 Xiang-Qing Hou,2 Si-Pin Hu,1 Guan Fang,3 Wen-Chao Chen,1 Lin-Hui Li,1 Wen-Jun Yang1
1Department of Hepatobiliary Surgery, The First Affiliated Hospital of Wenzhou Medical University, Zhejiang, Wenzhou, China; 2Department of Statistics, School of Public Health and Management, Wenzhou Medical University, Zhejiang, Wenzhou, China; 3Department of Colorectal Anus Surgery, The First Affiliated Hospital of Wenzhou Medical University, Zhejiang, Wenzhou, China
Purpose: Prognostic prediction after curative resection of primary hepatocellular carcinoma (PHCC) remains an arduous task. The S-index calculated from γ-glutamyl transpeptidase, albumin, and platelets is reported to predict the severity of liver fibrosis. We constructed a nomogram for predicting the survival probability of PHCC based on a new indicator, the S-index, combined with other routine clinical parameters.
Patients and methods: We selected 490 patients with PHCC postradical surgery at the First Affiliated Hospital of Wenzhou Medical University between January 2007 and January 2014. The subjects were randomly allocated into the training cohort and the validation cohort in the ratio 7:3 by the digital method. Important variables screened by univariate analysis were included in multivariate analysis to obtain independent risk factors for predicting the prognosis of PHCC. The construction of the nomogram was based on Cox proportional hazard regression models. The concordance index (C-index) was used in the nomogram for evaluating the model performance for prognosis. We drew time-dependent receiver operating characteristic curves to compare our model with other staging systems.
Results: The nomogram based on six independent risk factors after multivariate analyses had good predictive power after radical surgery of PHCC. In the training and validation groups, the C-index of the nomogram was highly consistent for evaluating survival from PHCC. Compared with the traditional scoring system, the areas under time-dependent receiver operating characteristic curves were 0.7382, 0.7293, and 0.7520 for 1-, 3-, and 5-year overall survival, respectively. In summary, the nomogram showed excellent results in terms of prognosis of PHCC.
Conclusion: Based on the S-index and the other clinical indicators, we developed a precise nomogram that predicts the survival probability of patients with PHCC after radical surgery. This tool can provide effective information for surgeons and patients.
Keywords: PHCC, radical resection, nomogram, prognosis
Introduction
Primary hepatocellular carcinoma (PHCC) is the most common hepatic cancer, which is the second largest cause of cancer-related death worldwide.1 Early diagnosis of hepatocellular carcinoma is important to achieve long-term survival. Unfortunately, <30% of patients with hepatocellular carcinoma achieve early diagnosis and treatment.2 Partial hepatectomy remains the most effective intervention for patients with hepatocellular carcinoma. The recurrence rates and the 5-year survival probability remain poor, even after curative resection. At present, the internationally accepted criteria for evaluating the outcomes of liver cancer are various staging paradigms, the most common of which is the seventh edition of the TNM (TNM seventh) system and the Barcelona Clinic Liver Cancer (BCLC) staging system. The Okuda staging system and the Cancer of the Liver Italian Program (CLIP) staging system also play important roles in the assessment of the prognosis of liver cancer.3 Unfortunately, these standards are complicated and have some limitations. We attempted to generate a simpler and more clinically relevant way to evaluate the prognosis of PHCC.
It is well known that cirrhosis and hepatic fibrosis are closely related to primary liver cancer. In recent years, many investigators had found that the models for evaluating and diagnosing hepatic fibrosis had a significant impact on the prognosis of liver cancer. Furthermore, Pang et al found that gamma-glutamyl transpeptidase and platelets (PLTs) ratio was an important factor influencing hepatocellular carcinoma associated with hepatitis B virus infections.4 Choi et al found that the Forns index was an important influencing factor for determining recurrence and death after curative resection of liver cancer.5 Zhou et al found that the S-index obtained by laboratory indicators accurately evaluated the degree of liver cirrhosis and fibrosis for patients with hepatitis B virus infections.6 Nevertheless, the relationship between S-index and prognosis after liver cancer resection remains unknown. In recent years, nomograms have shown excellent performance in predicting various tumor prognoses, including hepatocellular carcinoma,7 colon cancer,8 gastrointestinal stromal tumors, and others.9 Here, we establish a nomogram to study the correlation of survival between the S-index and prognosis after curative resection of PHCC.
Patients and methods
Research design and patients
We obtained clinical and laboratory data from 615 patients with liver cancer who were treated in the First Affiliated Hospital of Wenzhou Medical University between January 2007 and January 2014. We developed the following strict exclusion criteria: 1) patients who were diagnosed with nonprimary hepatocellular carcinoma according to clinical data and postoperative pathological findings; 2) patients without complete clinical data; 3) patients who received other treatments before radical surgery, including interventional therapy, radiofrequency ablation, chemical drugs, and radiation therapy; 4) patients with liver cancer secondary to other malignant tumors; 5) patients with other terminal cancers; 6) patients who cannot undergo curative resection, such as those with distant metastasis; 7) patients with basic diseases, such as those with severe vital organ damage; and 8) patients who died due to other noncancer-related factors such as accidents. Based on the exclusion criteria, we finally selected 490 patients with PHCC. All subjects were randomly allocated into the training set and validation set in a 7:3 ratio by the digital method. The training group consisted of 343 patients for establishing a nomogram, and the remaining 147 patients were placed in the validation group for confirming the predicting power of the nomogram. Our study was supported by the Ethical Committee and Institutional Review Board of the First Affiliated Hospital of Wenzhou Medical University. All patients signed informed consent forms, and all study procedures were conducted in accordance with the latest revision of the World Medical Association Declaration of Helsinki.
Data collection and follow-up
All patients diagnosed with PHCC had complete clinical and laboratory variables collected. The clinical variables were as follows: gender, age, history of alcohol abuse, body mass index, tumor number, tumor size, tumor capsule, cirrhosis, ascites, portal vein tumor thrombus (PVTT), microvascular invasion, lymph node metastasis, intrahepatic metastases, invasion of adjacent tissues, and tumor grade. The laboratory data were as follows: white blood cell (WBC), PLT, total bilirubin (TB), albumin (ALB), fibrinogen, aspartate transaminase (AST), alanine aminotransferase (ALT), alpha-fetoprotein (AFP), prothrombin time (PT), and γ-glutamyl transpeptidase (γ-GT). AFP was determined by UniCel DxI-800 analyzer. TB and hepatic function index (ALT, AST, and γ-GT) were tested by Beckman AU5800 analyzer. Blood clotting function (fibrinogen, PT) was measured on a Diagnostica Stago analyzer. Complete blood count, including WBC and PLT, was tested using a Sysmex XE-2100 analyzer.
Based on these variables, we evaluated the staging system for hepatocellular carcinoma, including Child–Pugh classification, BCLC staging system, TNM staging system, the CLIP, and the Okuda staging system.10 The S-index was calculated from laboratory variables (γ-GT, ALB, and PLTs) with the formula: 1,000× γ-GT/(PLT × ALB).24
All patients were followed up by telephone or outpatient visit every 3 months for the first 2 years, every 6 months after 2 years, and once in every year after 5 years.
Statistical analyses
Continuous variables that conformed to a normal distribution were expressed as mean ± SD (x̄ ±SD); otherwise, they were identified by quartile (P25, P75). Numbers (%) were used to identify categorical variables. Continuous variables were tested by the Student’s t-test or Whitney U test for variables with an abnormal distribution. The chi-squared test or Fisher’s exact test was used to evaluate categorical variables. Overall survival (OS) was calculated by the Kaplan–Meier method and log-rank method, and was defined as the length of time from the date of diagnosis to the date of death or the end of follow-up. Statistically significant variables in univariate analysis (P<0.001) were included in the multivariate analysis. The nomogram that was used to assess the 1-, 3-, and 5-year survival probability was built on variables with P<0.05 in the multivariate analysis. The concordance index (C-index) was used in the nomogram for evaluating the model performance for prognosis in the training and validation sets. The time-dependent receiver operating characteristics (tdROC) curve was used to compare the performance of the nomogram, S-index, BCLC, Okuda, and CLIP for the prognosis of PHCC. Larger C-index and area under the time-dependent receiver operating characteristic (tdAUC) curve indicated higher reliability of prediction and diagnosis. All statistical analyses were carried out with SPSS 22 and RStudio software (version 1.1.447- 2009–2018; RStudio, Inc.)
Results
Baseline characteristics
All patients were diagnosed with PHCC, of which 285 (83.1%) were male in the training group and 128 (87.1%) were male in the validation group. The median survival times were 58.23 and 44.53 months, respectively. Analysis of the baseline characteristics of the 490 patients (343 from the training analysis and 147 from the validation) showed no statistical differences among variables (P>0.05) between the training and validation groups. In the training cohort, the 1-, 3-, and 5-year OS rates were 82.8%, 63.8%, and 47.8%, respectively, corresponding to 77.6%, 58.5%, and 38.8%, respectively, in the validation cohort (Table 1).
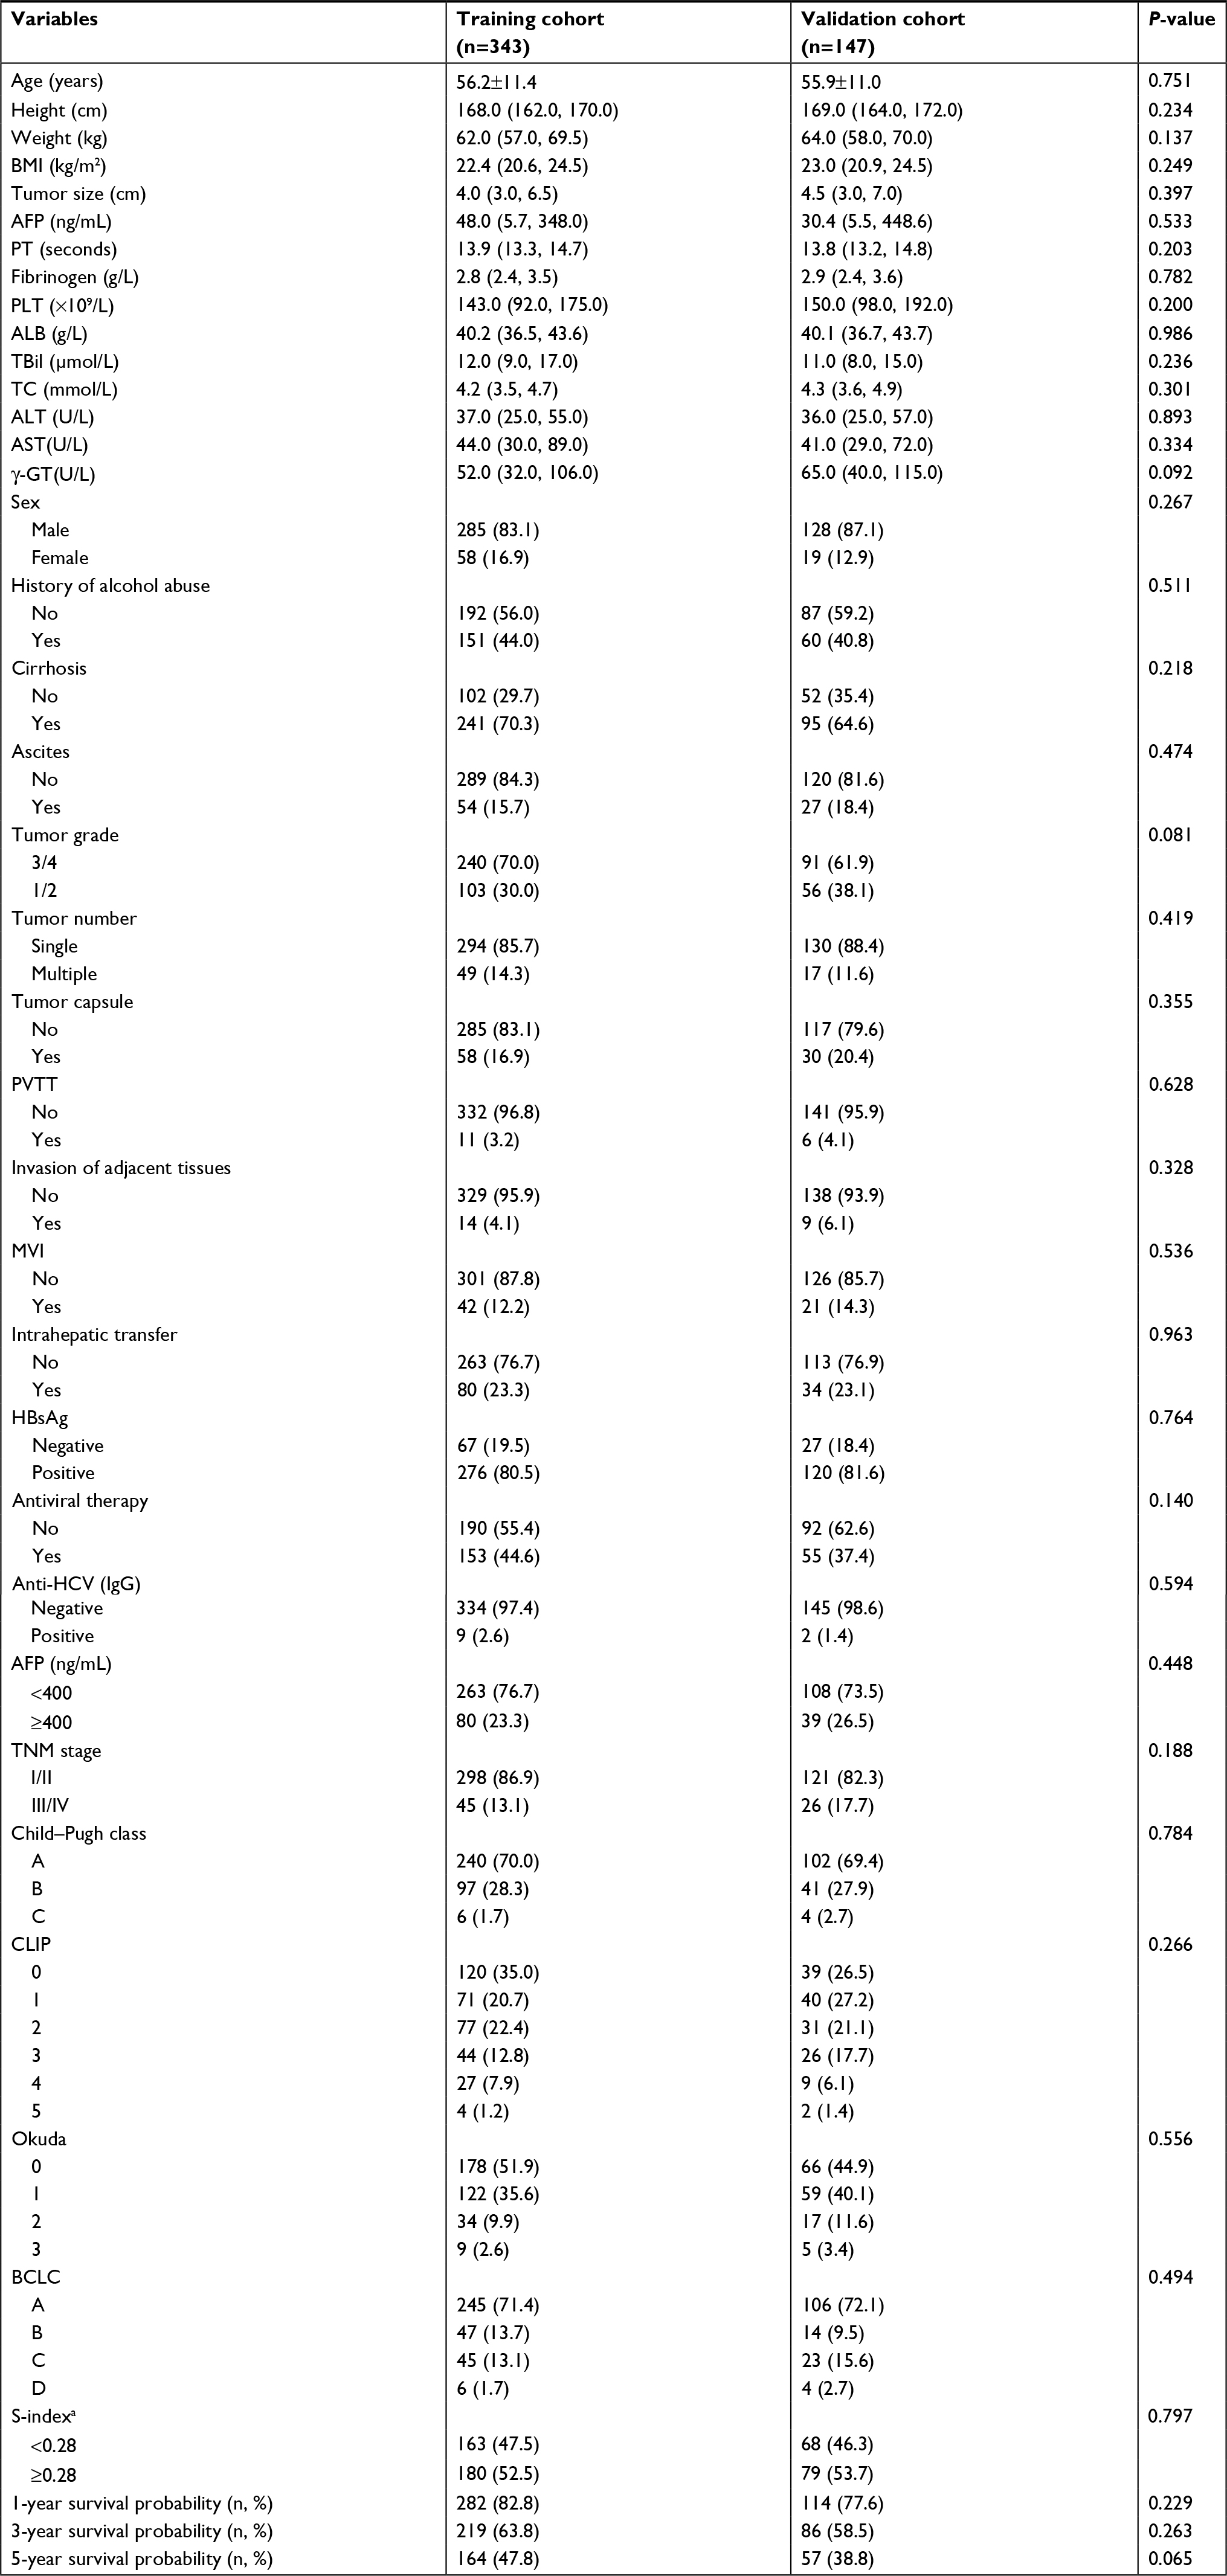 | Table 1 Baseline demographics and clinical characteristics of patients in the training cohort and the validation cohort Note: aThe S-index calculated from γ-GT, ALB, and PLTs is a mathematical model for predicting the severity of liver fibrosis. Continuous variables with an abnormal distribution were identified by quartile (P25, P75). Abbreviations: γ-GT, γ-glutamyl transpeptidase; AFP, alpha-fetoprotein; ALB, albumin; ALT, alanine aminotransferase; AST, aspartate aminotransferase; BCLC, Barcelona Clinic Liver Cancer; BMI, body mass index; CLIP, Cancer of the Liver Italian Program; HCV, hepatitis C virus; MVI, microvascular invasion; PLT, platelet; PT, prothrombin time; PVTT, portal vein tumor thrombus; TBil, total bilirubin; TC, total cholesterol. |
Prognostic factors of the training cohort
The optimal cutoff value of S-index, corresponding to the maximum sensitivity and specificity, was 0.28 according to the Youden’s index (Table S1; Figure S1). Patients were stratified into two groups by the optimal cutoff values of S-index (<0.28 and ≥0.28). The results of the univariate analysis are shown in Table 2. Variables of P-values <0.001 in the univariate analysis were included in multivariate analysis. As shown in Table 3, only six variables were independent risk factors for influencing the survival probability of PHCC: ALB, TB, PVTT, tumor grade, tumor size, and S-index (P<0.05).
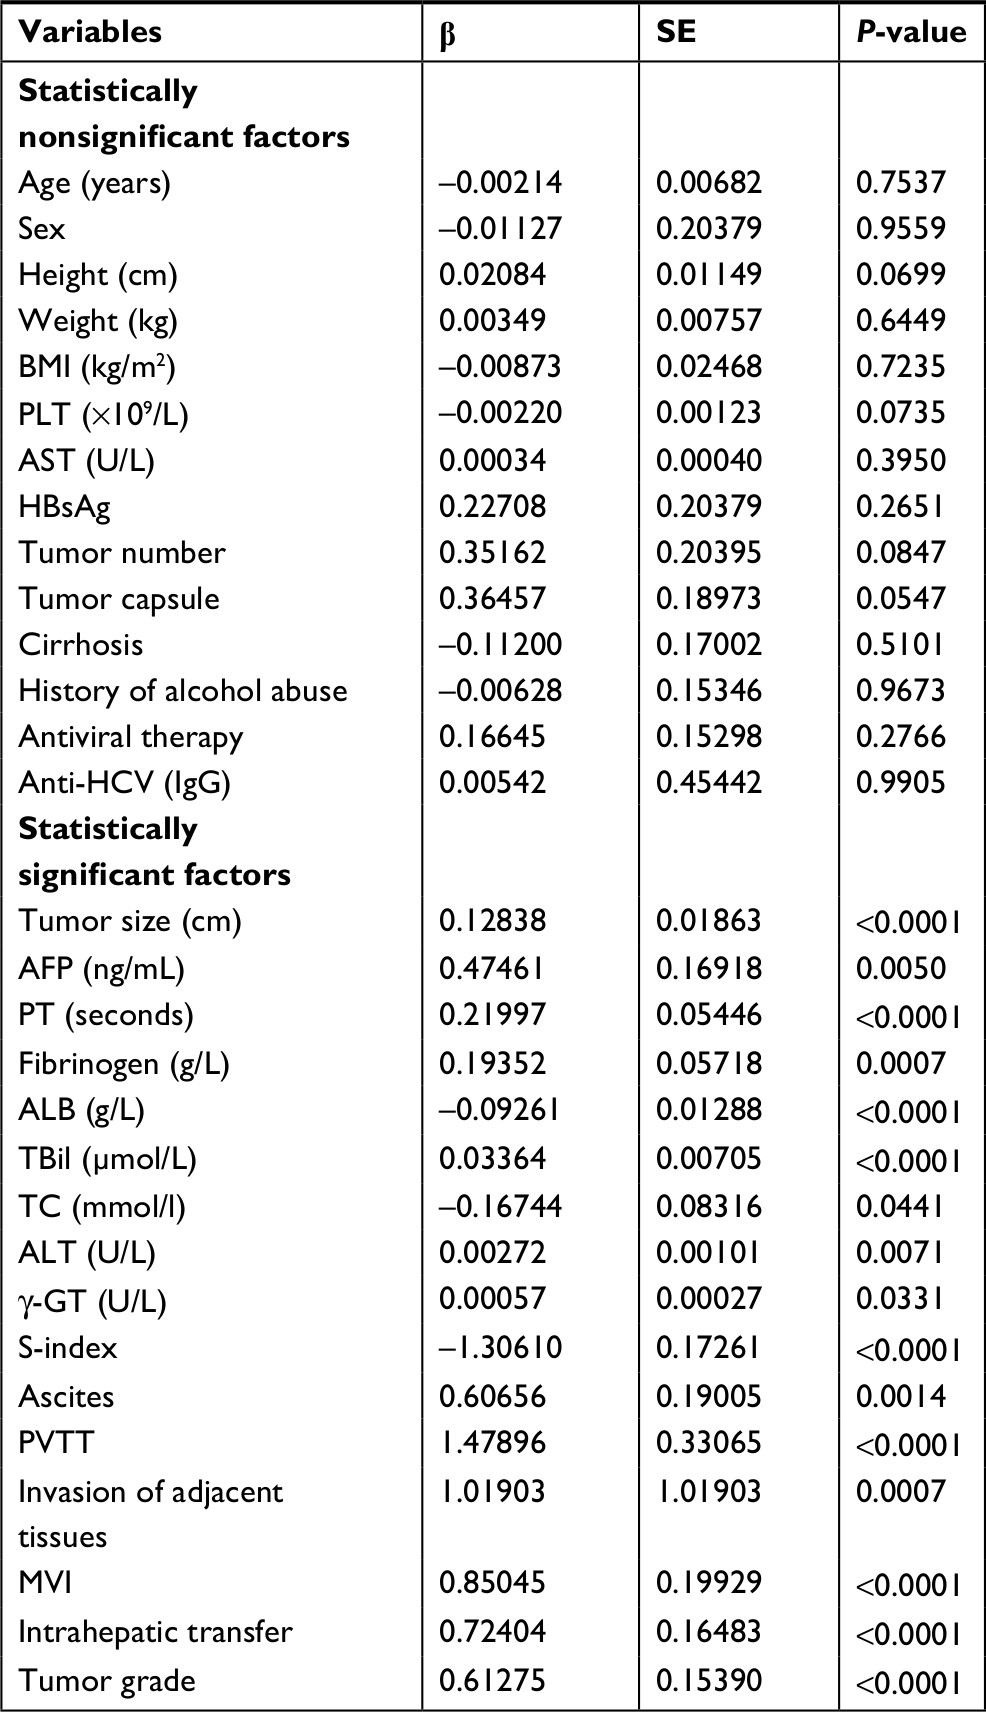 | Table 2 Univariate analysis of the training cohort Abbreviations: γ-GT, γ-glutamyl transpeptidase; AFP, alpha-fetoprotein; ALB, albumin; ALT, alanine aminotransferase; AST, aspartate aminotransferase; BMI, body mass index; HCV, hepatitis C virus; MVI, microvascular invasion; PLT, platelet; PT, prothrombin time; PVTT, portal vein tumor thrombus; SE, standard error; TBil, total bilirubin; TC, total cholesterol. |
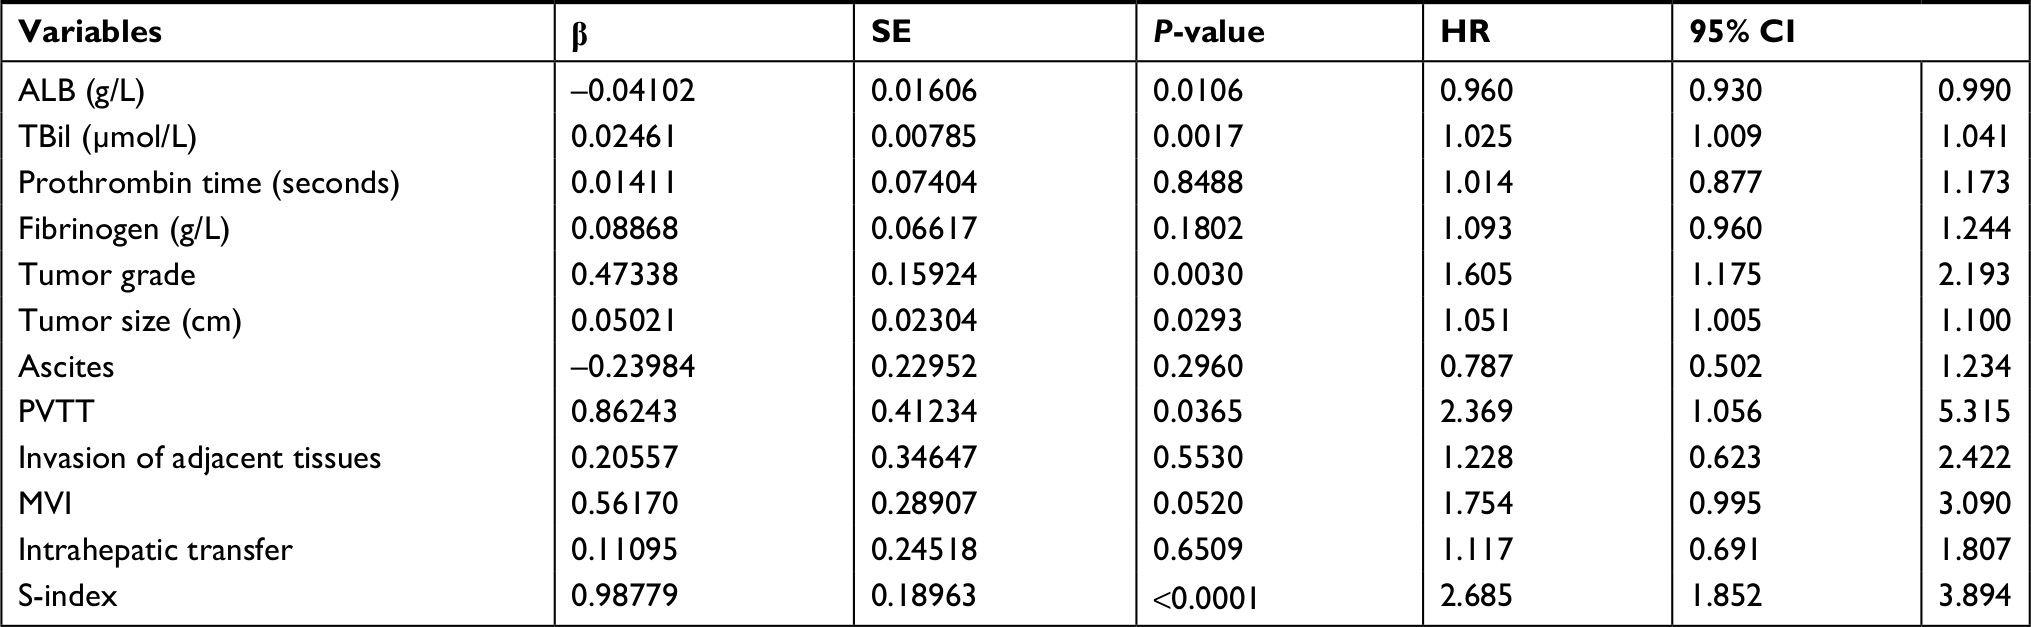 | Table 3 Multivariate analysis of the training cohort Abbreviations: ALB, albumin; MVI, microvascular invasion; PVTT, portal vein tumor thrombus; SE, standard error; TBil, total bilirubin. |
Prognostic nomogram for survival
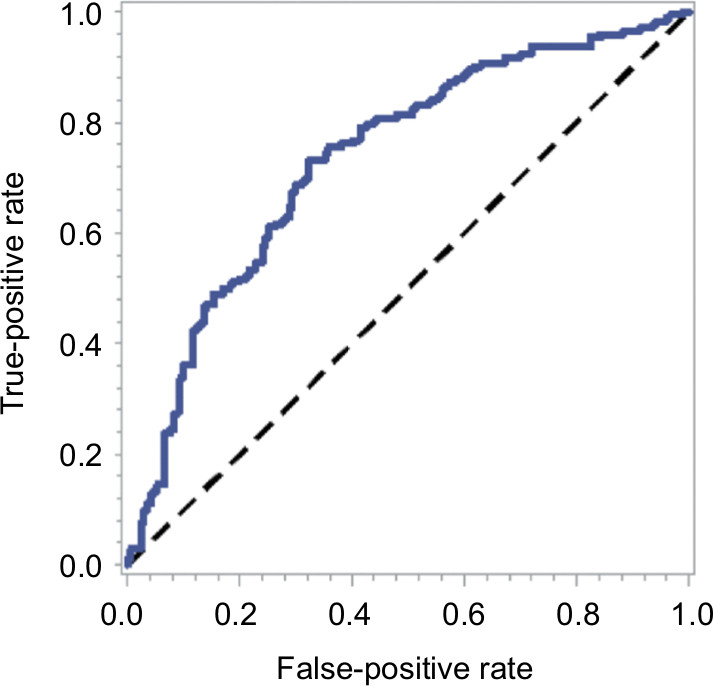
Based on the independent risk factors that were statistically significant in multivariate analysis, nomograms were constructed to predict the OS of PHCC (Figure 1). In order to construct this nomogram, each subgroup variable was assigned a corresponding score. According to the specific situation of each hepatocellular carcinoma, the scores of each subgroup variable were summarized to obtain a total score, and we then obtained the corresponding 1-, 3-, and 5-year survival probabilities by drawing a straight line vertically down from the total scale to the survival probability scale. In order to compensate for the inability to draw lines on the nomogram to accurately obtain the survival rates, the nomogram scoring system was placed in Table 4, accurately predicting the survival rates. Calibration curves were used to verify the performance of the model in predicting OS. The C-indexes of the model for 1-, 3-, and 5-year OS rates were 0.768 (95% CI=0.695–0.841), 0.757 (95% CI=0.706–0.809), and 0.737 (95% CI=0.696–0.779), respectively, in the training group and 0.679 (95% CI =0.579–0.779), 0.683 (95% CI=0.609–0.757), and 0.679 (95% CI=0.616–0.741), respectively, in the validation group, still performing well in the latter (Figure 2). To further validate the performance of the model for evaluating the prognosis of PHCC, we plotted the tdROC curve for the nomogram, S-index, BCLC, Okuda, and CLIP. The tdAUC curve was used to evaluate the difference between predicted 1-, 3-, and 5-year OS rates of each of the indicators mentioned above (Figure 3). Furthermore, we stratified the training group into three subgroups based on the total points of nomogram (low risk: <200; intermediate risk: 200–250; and high risk: >250). In Figure 4, the Kaplan–Meier curves show excellent prediction results in the nomogram predicting survival.
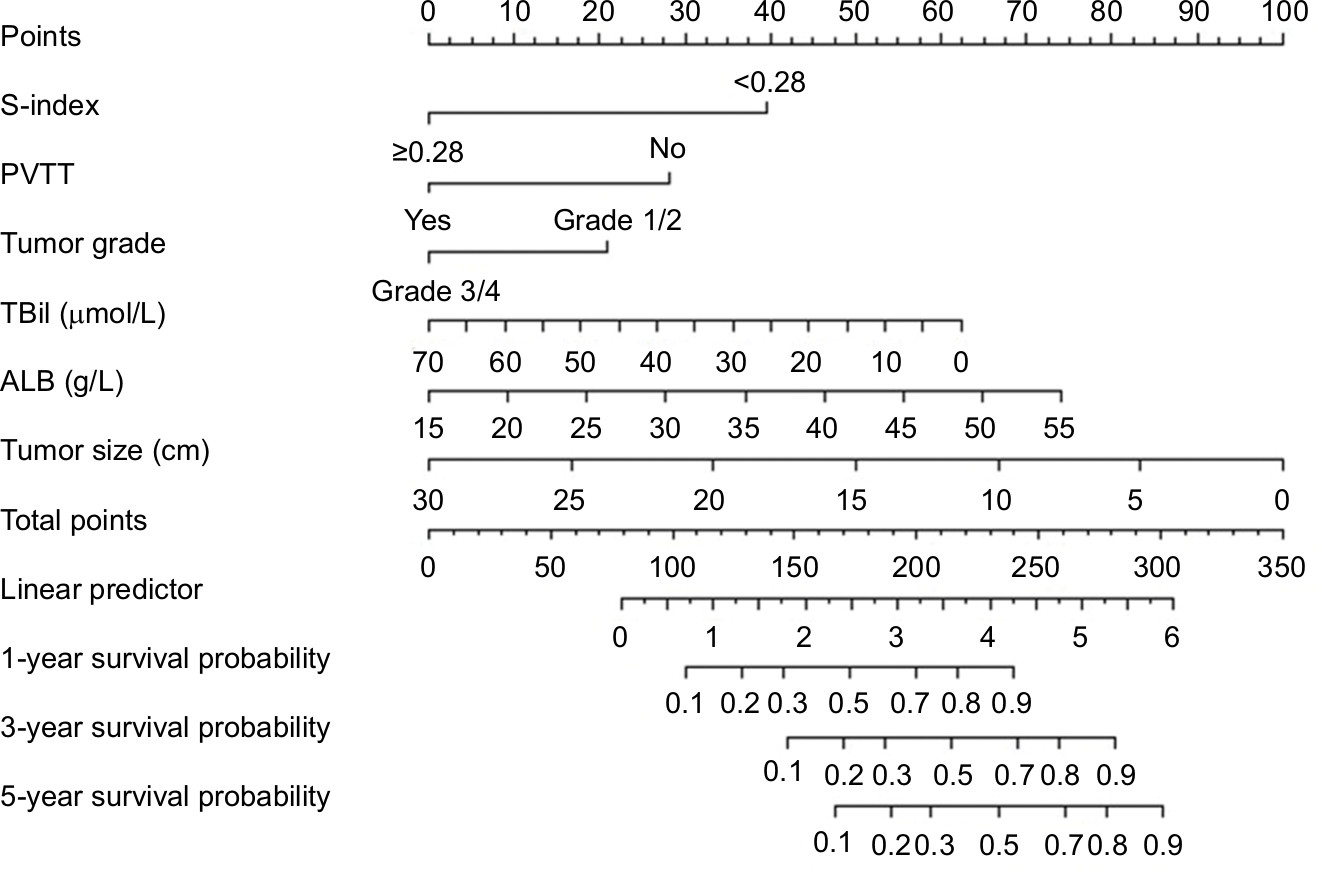 | Figure 1 Nomogram for predicting overall survival after curative resection of PHCC. Notes: To obtain the corresponding survival probability, sum up each variable score and draw a vertical line from the total points scale to the survival rate scale. Abbreviations: ALB, albumin; PHCC, primary hepatocellular carcinoma; PVTT, portal vein tumor thrombus; TBil, total bilirubin. |
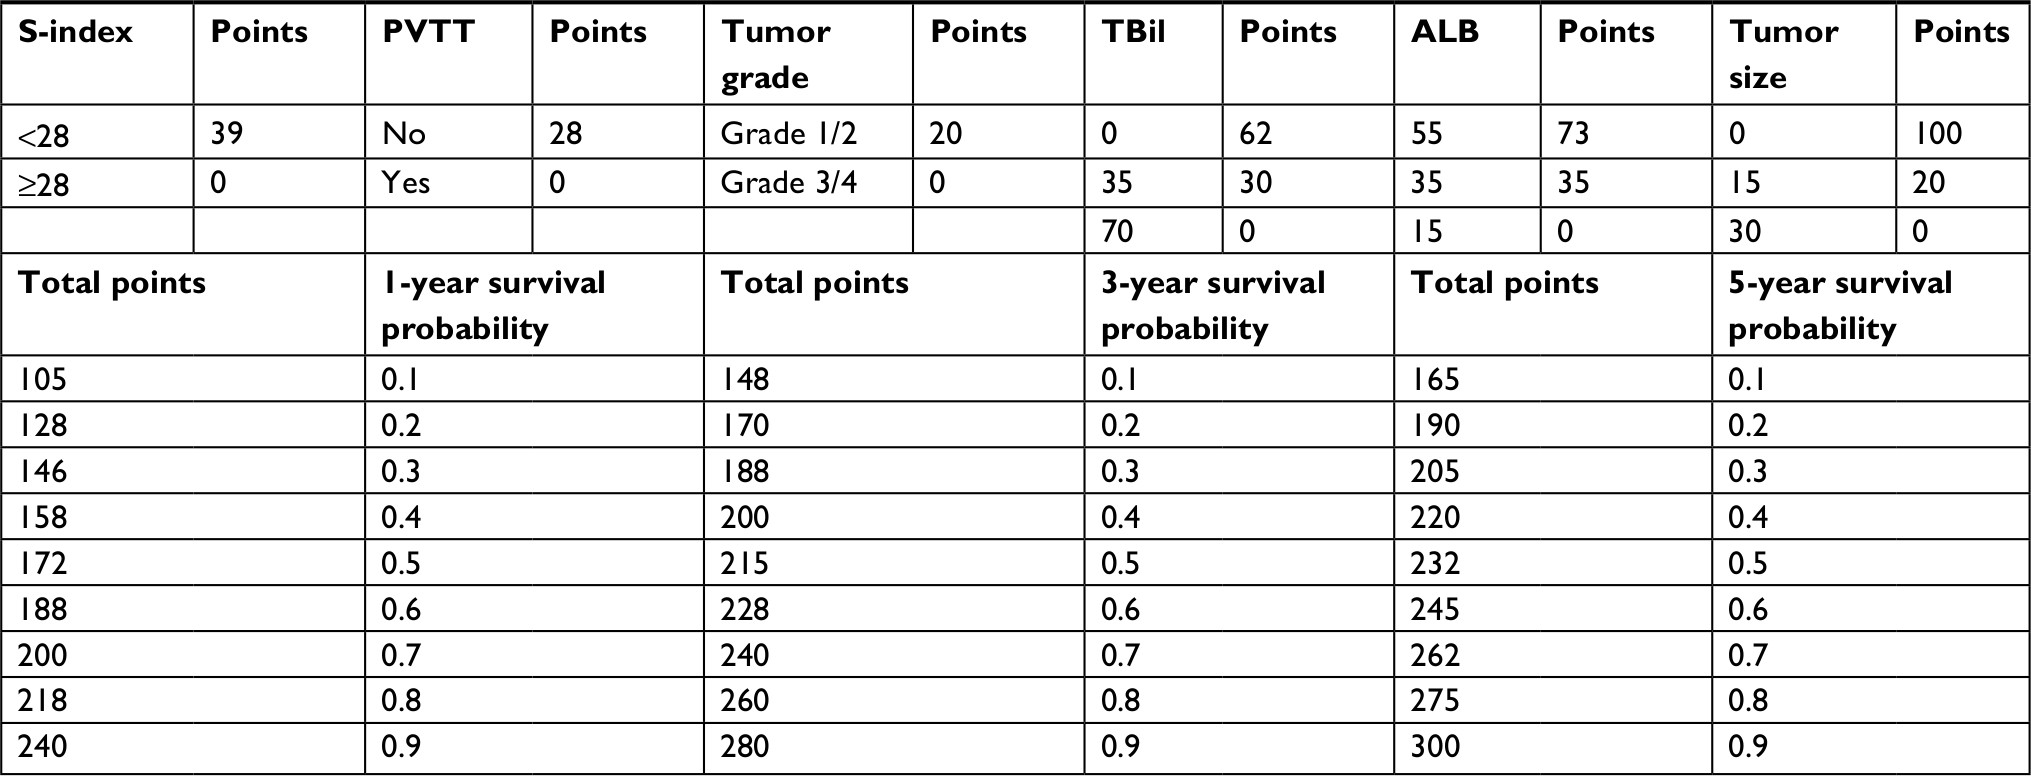 | Table 4 Nomogram scoring system Abbreviations: ALB, albumin; PVTT, portal vein tumor thrombus; TBil, total bilirubin. |
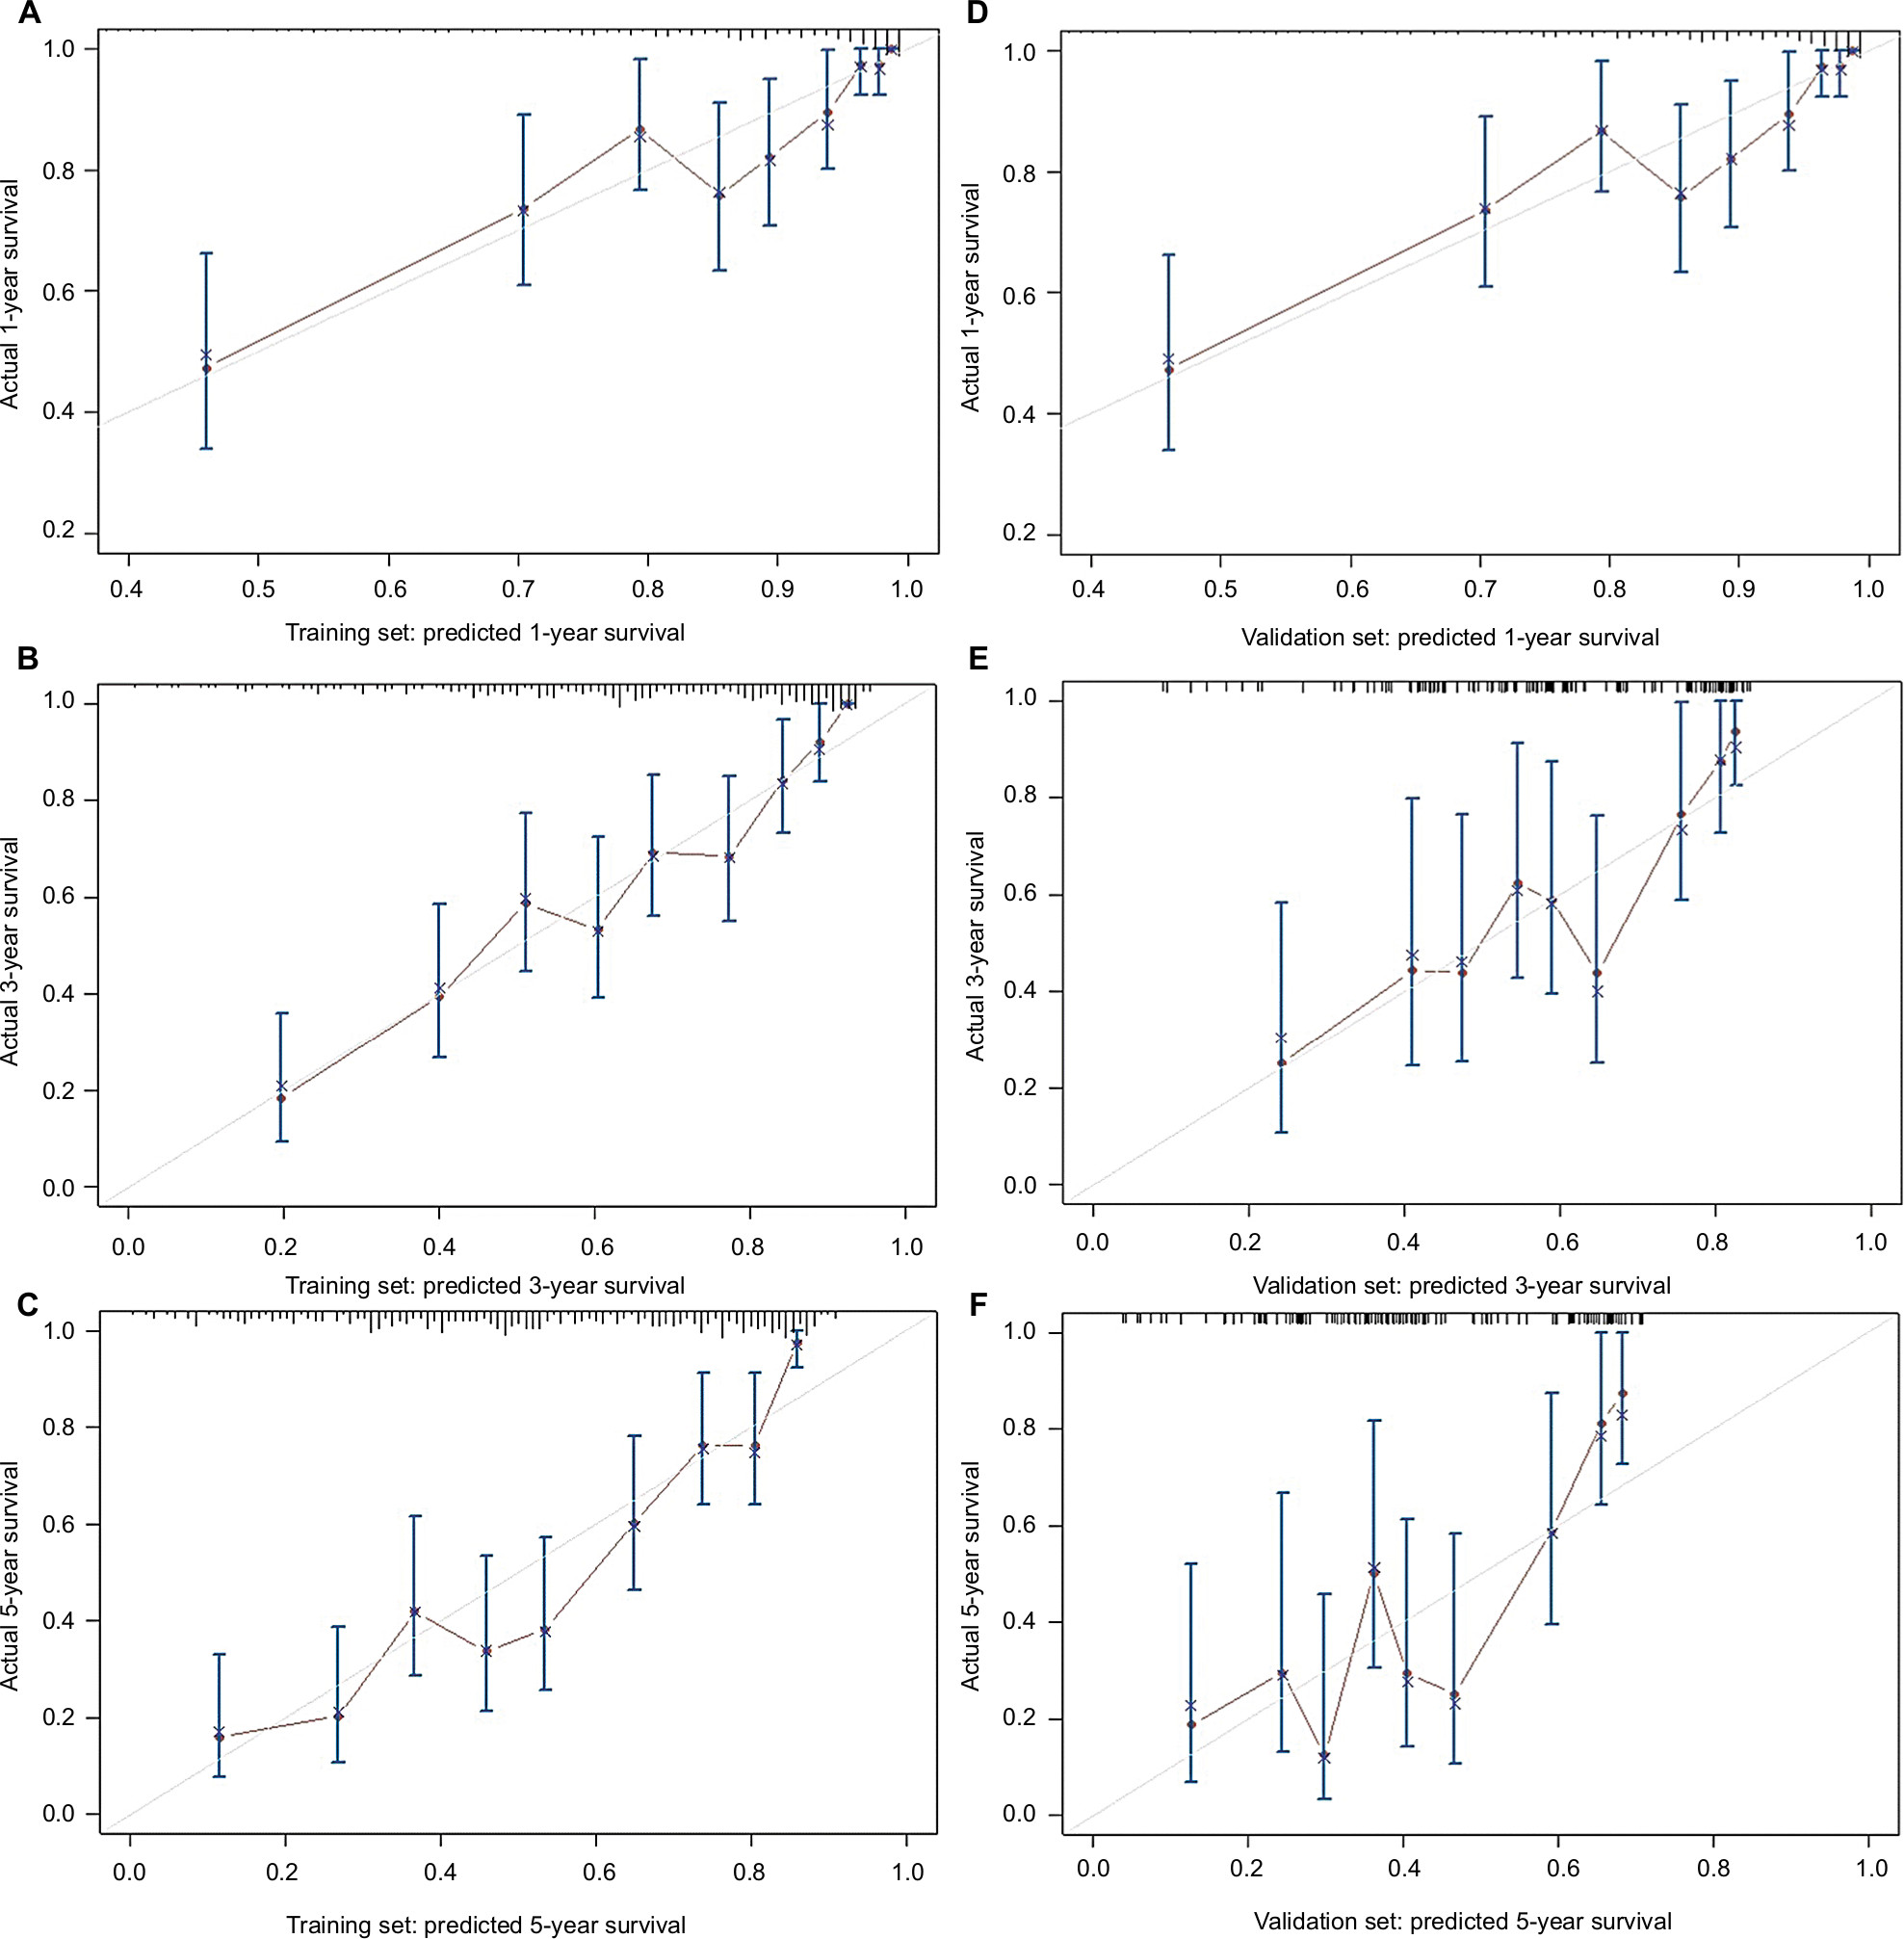 | Figure 2 Calibration curves for predicting overall survival probability by the nomogram in the training and validation sets. Notes: Calibration curves of the prognostic nomogram for 1-year overall survival (A), 3-year overall survival (B) and 5-year overall survival (C) in the training set, correspondingly, calibration curves for 1-year overall survival (D), 3-year overall survival (E), and 5-year overall survival (F) in the validation set. |
 | Figure 3 The tdROC curve of the prognostic nomogram, S-index, CLIP, BCLC and Okuda score in the training cohort. Note: The tdROC curve for 1-year survival (A), 3-year survival (B), and 5-year survival (C). Abbreviations: BCLC, Barcelona Clinic Liver Cancer; CLIP, Cancer of the Liver Italian Program; tdROC, time-dependent receiver operating characteristic. |
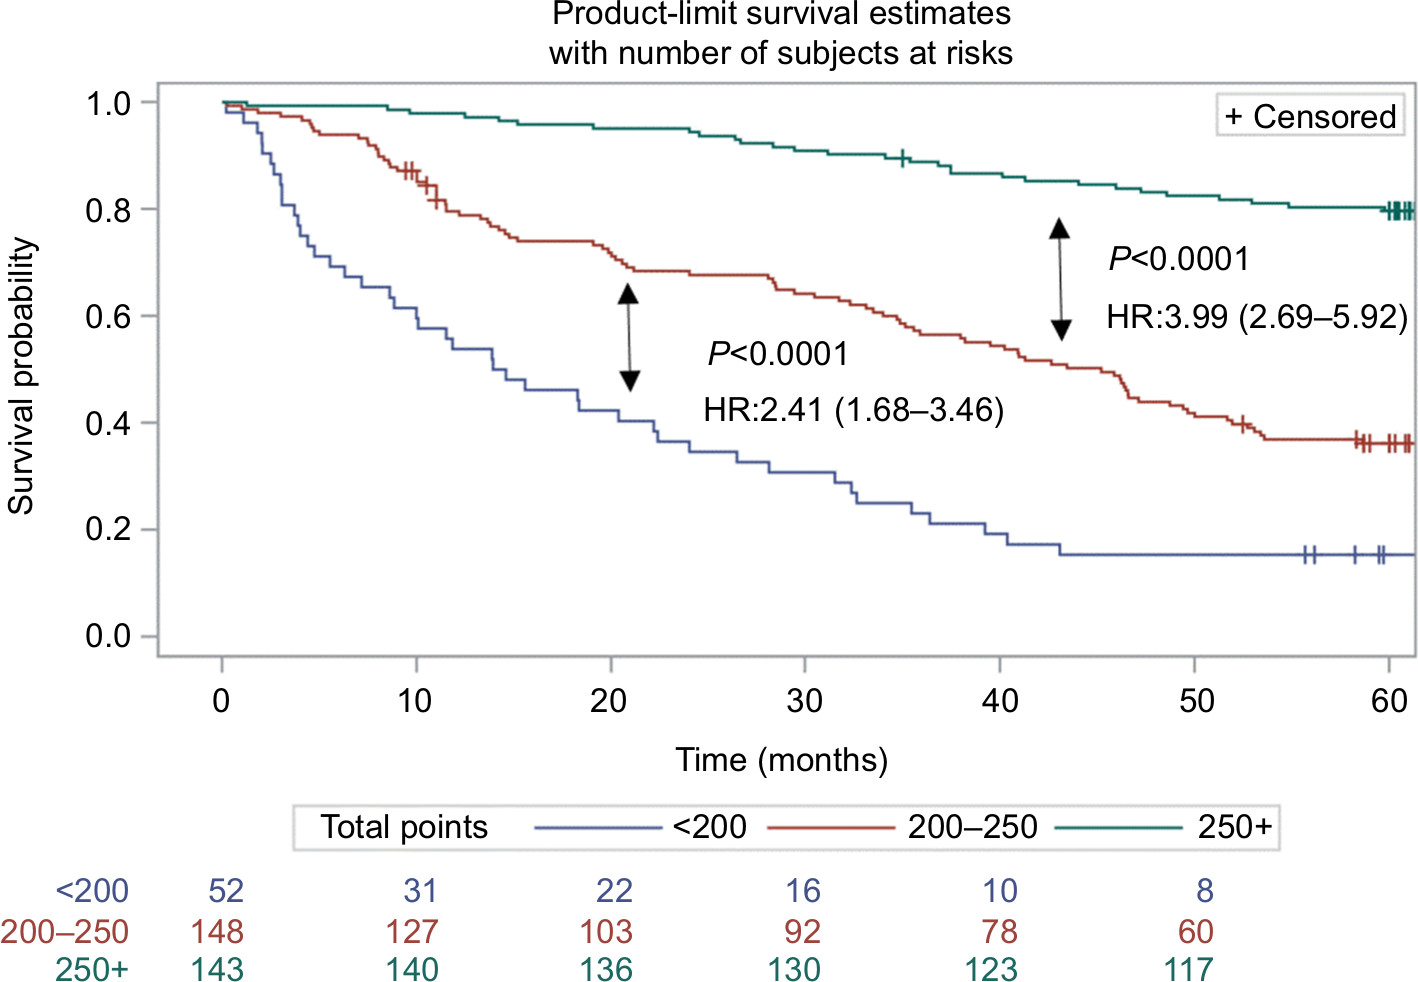 | Figure 4 Survival curves stratified by the score calculated by the nomogram in the training cohort (low risk: <200; intermediate risk: 200–250; and high risk: >250). |
Discussion
A more accurate survival prediction for PHCC after radical surgery is undoubtedly an excellent goal for patients and surgeons. Nevertheless, in terms of predicting survival rates, the conventional staging systems are not satisfactory, including the TNM system and the BCLC staging system.11,12 If a tool that predicts the prognosis of PHCC can be developed, it will provide better clinical treatment advice regarding prognosis. Based on multivariate analysis, we obtained six independent risk factors for evaluating the prognosis of PHCC. Therefore, we developed a nomogram including S-index, PVTT, tumor grade, tumor size, ALB, and TB. The C-indexes of the nomogram in the training and validation groups performed well in predicting the survival of PHCC. Compared with other traditional staging scores, our model was highly accurate for predicting the prognosis of PHCC. Unfortunately, for predicting the 5-year survival probability of PHCC, the tdAUC of the nomogram was similar to but smaller than the S-index. It is well known that the occurrence and development of tumors are related to many factors, while the S-index combines only laboratory indicators of blood. Therefore, we firmly believe that the nomogram based on multiple factors has greater potential. This also requires much clinical research to validate our model.
According to risk stratification of the nomogram, we can easily divide individuals into different risk subgroups, which may make sense for clinicians to make further treatment plans. For example, patients at high-risk stratification may require further treatment or shorter follow-up periods to improve survival.
As novel tools, nomograms have been regarded by scholars as useful and efficient methods for predicting tumor prognosis in recent years. Neoplastic diseases that have been tracked with nomograms to predict prognosis include gastrointestinal stromal tumors,9 colorectal cancer,8 pancreatic cancer,13 and hepatocellular carcinoma.3,7
Our nomogram contained six variables in which tumor staging, PVTT, and tumor size were consistent with those of previous studies.3,7,14 As a carrier for evaluating protein reserves, serum ALB has been associated with many tumors.15–17 Preoperative low serum ALB was a powerful predictor of prolonged hospital stay and mortality.18 Many studies have shown that serum ALB represents preoperative nutritional status in cancer patients and can also predict postoperative outcomes.19 TB is another laboratory indicator included in our model. In recent years, many studies have shown that bilirubin is associated with lymph node metastasis of rectal cancer,20 liver fibrosis of hepatitis B virus,21 and invasiveness of hepatocellular carcinoma.22 In other words, cancer patients with elevated bilirubin values have poor prognoses.
To the best of our knowledge, the S-index contained in the model we established is a new indicator for predicting the prognosis of PHCC. The S-index obtained by laboratory indicators accurately evaluates the degree of liver cirrhosis and fibrosis for patients with hepatitis B virus infections.6 However, the relationship between the S-index and predicted survival rates after curative resection of PHCC remains unknown. It is well known that cirrhosis and fibrosis are closely related to the occurrence of PHCC. Therefore, we believe the S-index and liver cancer may be closely related and our study confirmed this. The S-index is calculated as 1,000×γ-GT/(PLT × ALB),2 containing three important laboratory indicators: γ-GT, PLTs, and ALB. The relationship between ALB and cancer prognosis was described above. Now, we discuss the relationship between the other two variables and PHCC. High γ-GT is closely related to the occurrence of many diseases, including diabetes, liver disease, cardiovascular disease, and all-cause mortality.23 This may be related to the redox regulation and drug resistance of γ-GT in tumor development.24 Carr et al found that PLTs were closely related to the migration and invasion of liver cancer.25 The survival rates of hepatitis B virus-associated hepatocellular carcinoma with antiplatelet therapy were greatly improved.26
For specific individuals, our nomogram is a very intuitive and accurate predictive tool for survival after curative resection of PHCC. The laboratory indicators included in our nomogram are easily obtained and calculated, including TB, ALB, and the S-index. Tumor size, tumor grade, and PVTT can be obtained by abdominal ultrasound, computed tomography, MRI, and pathological findings. Moreover, the indicators included in our nomogram are objective, avoiding the adverse effects of subjectivity of the surgeon. Nevertheless, our study has certain limitations. First, this was a single-center study, that may limit the scope of its application; second, our sample sizes were relatively small, especially in the validation group; third, in the training and validation groups, the C-index of our model was not highly consistent; finally, our model is only suitable for predicting the survival rates after curative resection of PHCC and is not applicable for patients with incurable advanced liver cancer or patients receiving other treatments.
In summary, we developed an accurate and intuitive tool for predicting the 1-, 3-, and 5-year survival rates after curative resection of PHCC. This nomogram can provide corresponding treatment assistance for patients with PHCC and may provide a basis for clinicians to make treatment decisions. Nevertheless, whether our model is applicable to other inpatients, patients in other regions or even other countries has yet to be verified by a large number of clinical studies by scholars.
Author contributions
Lei Chen and Bin-Bin Cai are co-first authors. All authors contributed to data analysis, drafting and revising the article, gave final approval of the version to be published, and agree to be accountable for all aspects of the work.
Disclosure
The authors report no conflicts of interest in this work.
References
Wallace MC, Preen D, Jeffrey GP, Adams LA. The evolving epidemiology of hepatocellular carcinoma: a global perspective. Expert Rev Gastroenterol Hepatol. 2015;9(6):765–779. | ||
Bruix J, Reig M, Sherman M. Evidence-based diagnosis, staging, and treatment of patients with hepatocellular carcinoma. Gastroenterology. 2016;150(4):835–853. | ||
Cai BB, Shi KQ, Li P, et al. A nomogram integrating hepatic reserve and tumor characteristics for hepatocellular carcinoma following curative liver resection. Clin Chim Acta. 2018;485:187–194. | ||
Pang Q, Bi JB, Wang ZX, et al. Simple models based on gamma-glutamyl transpeptidase and platelets for predicting survival in hepatitis B-associated hepatocellular carcinoma. Onco Targets Ther. 2016;9:099–2109. | ||
Choi WM, Lee JH, Ahn H, et al. Forns index predicts recurrence and death in patients with hepatitis B-related hepatocellular carcinoma after curative resection. Liver Int. 2015;35(8):1992–2000. | ||
Zhou K, Gao CF, Zhao YP, et al. Simpler score of routine laboratory tests predicts liver fibrosis in patients with chronic hepatitis B. J Gastroenterol Hepatol. 2010;25(9):1569–1577. | ||
Yantong Y, Shan L, Zhijie C, Youwei Z. A model prediction of long-term prognosis in patients with centrally located hepatocellular carcinoma undergoing hepatectomy. Eur J Surg Oncol. 2018;44(10):1595–1602. | ||
Kawai K, Nozawa H, Hata K, et al. Nomogram predicting survival after recurrence in patients with stage I to III colon cancer: a nationwide multicenter study. Dis Colon Rectum. 2018;61(9):1053–1062. | ||
Song W, Lv CG, Miao DL, et al. Development and validation of a nomogram for predicting survival in patients with gastrointestinal stromal tumours. Eur J Surg Oncol. 2018;44(10):1657–1665. | ||
Duseja A. Staging of hepatocellular carcinoma. J Clin Exp Hepatol. 2014;4(Suppl 3):S74–S79. | ||
Addissie BD, Roberts LR. Classification and staging of hepatocellular carcinoma: an aid to clinical decision-making. Clin Liver Dis. 2015;19(2):277–294. | ||
Yamakado K, Hirota S. Sub-classification of intermediate-stage (Barcelona Clinic Liver Cancer stage-B) hepatocellular carcinomas. World J Gastroenterol. 2015;21(37):10604–10608. | ||
Xu J, Shi KQ, Chen BC, Huang ZP, Lu FY, Zhou MT. A nomogram based on preoperative inflammatory markers predicting the overall survival of pancreatic ductal adenocarcinoma. J Gastroenterol Hepatol. 2017;32(7):1394–1402. | ||
Amisaki M, Uchinaka E, Morimoto M. Post-operative albumin-bilirubin grade predicts long-term outcomes among Child–Pugh grade A patients with hepatocellular carcinoma after curative resection. Hepatobiliary Pancreat Dis Int. 2018;17(6):502–509. | ||
Han S, Huang Y, Li Z, Hou H, Wu A. The prognostic role of preoperative serum albumin levels in glioblastoma patients. BMC Cancer. 2015;15(1):108. | ||
Feliu J, Jiménez-Gordo AM, Madero R, et al. Development and validation of a prognostic nomogram for terminally ill cancer patients. J Natl Cancer Inst. 2011;103(21):1613–1620. | ||
Garg T, Chen LY, Kim PH, Zhao PT, Herr HW, Donat SM. Preoperative serum albumin is associated with mortality and complications after radical cystectomy. BJU Int. 2014;113(6):918–923. | ||
Hollenbeck BK, Miller DC, Taub DA, et al. The effects of adjusting for case mix on mortality and length of stay following radical cystectomy. J Urol. 2006;176(4):1363–1368. | ||
Lambert JW, Ingham M, Gibbs BB, Given RW, Lance RS, Riggs SB. Using preoperative albumin levels as a surrogate marker for outcomes after radical cystectomy for bladder cancer. Urology. 2013;81(3):587–592. | ||
Gao C, Fang L, Li JT, Zhao HC. Significance and prognostic value of increased serum direct bilirubin level for lymph node metastasis in Chinese rectal cancer patients. World J Gastroenterol. 2016;22(8):2576–2584. | ||
Du M, Zhang S, Xiao L, et al. The relationship between serum bilirubin and elevated fibrotic indices among HBV carriers: a cross-sectional study of a Chinese population. Int J Mol Sci. 2016;17(12):2057. | ||
Carr BI, Guerra V, Giannini EG, et al. Association of abnormal plasma bilirubin with aggressive hepatocellular carcinoma phenotype. Semin Oncol. 2014;41(2):252–258. | ||
Koenig G, Seneff S. Gamma-glutamyltransferase: a predictive biomarker of cellular antioxidant inadequacy and disease risk. Dis Markers. 2015;2015(4):1–18. | ||
Hanigan MH. Gamma-glutamyl transpeptidase: redox regulation and drug resistance. Adv Cancer Res. 2014;122:103–141. | ||
Carr BI, Cavallini A, D’Alessandro R, et al. Platelet extracts induce growth, migration and invasion in human hepatocellular carcinoma in vitro. BMC Cancer. 2014;14(1):43. | ||
Sitia G, Iannacone M, Guidotti LG. Anti-platelet therapy in the prevention of hepatitis B virus-associated hepatocellular carcinoma. J Hepatol. 2013;59(5):1135–1138. |
Supplementary materials
 | Table S1 The optimal cutoff value of S-index Abbreviation: AUC, area under the curve. |
 | Figure S1 The tdROC curve for S-index. |
 © 2019 The Author(s). This work is published and licensed by Dove Medical Press Limited. The
full terms of this license are available at https://www.dovepress.com/terms
and incorporate the Creative Commons Attribution
- Non Commercial (unported, 3.0) License.
By accessing the work you hereby accept the Terms. Non-commercial uses of the work are permitted
without any further permission from Dove Medical Press Limited, provided the work is properly
attributed. For permission for commercial use of this work, please see paragraphs 4.2 and 5 of our Terms.
© 2019 The Author(s). This work is published and licensed by Dove Medical Press Limited. The
full terms of this license are available at https://www.dovepress.com/terms
and incorporate the Creative Commons Attribution
- Non Commercial (unported, 3.0) License.
By accessing the work you hereby accept the Terms. Non-commercial uses of the work are permitted
without any further permission from Dove Medical Press Limited, provided the work is properly
attributed. For permission for commercial use of this work, please see paragraphs 4.2 and 5 of our Terms.