Back to Journals » Patient Preference and Adherence » Volume 17
A Quantitative Framework for Medication Non-Adherence: Integrating Patient Treatment Expectations and Preferences
Authors Muiruri C ![]() , van den Broek-Altenburg EM, Bosworth HB
, van den Broek-Altenburg EM, Bosworth HB ![]() , Cené CW, Gonzalez JM
, Cené CW, Gonzalez JM ![]()
Received 12 August 2023
Accepted for publication 21 November 2023
Published 4 December 2023 Volume 2023:17 Pages 3135—3145
DOI https://doi.org/10.2147/PPA.S434640
Checked for plagiarism Yes
Review by Single anonymous peer review
Peer reviewer comments 3
Editor who approved publication: Dr Johnny Chen
Charles Muiruri,1,2 Eline M van den Broek-Altenburg,3 Hayden B Bosworth,1,4 Crystal W Cené,5 Juan Marcos Gonzalez1,6
1Department of Population Health Sciences, Duke University School of Medicine, Durham, NC, USA; 2Duke Global Health Institute, Duke University, Durham, NC, USA; 3University of Vermont Larner College of Medicine, Burlington, VT, USA; 4Durham Veterans Affairs Medical Center, Durham, NC, USA; 5University of California San Diego Health, San Diego, CA, USA; 6Duke Clinical Research Institute, Duke University School of Medicine, Durham, NC, USA
Correspondence: Charles Muiruri, Department of Population Health Sciences Duke University School of Medicine, 215 Morris St., Suite 210, Durham, NC, 27701, USA, Tel +19196603212, Email [email protected]
Introduction: Medication non-adherence remains a significant challenge in healthcare, impacting treatment outcomes and the overall effectiveness of medical interventions. This article introduces a novel approach to understanding and predicting medication non-adherence by integrating patient beliefs, efficacy expectations, and perceived costs. Existing theoretical models often fall short in quantifying the impact of barrier removal on medication adherence and struggle to address cases where patients consciously choose not to follow prescribed medication regimens. In response to these limitations, this study presents an empirical framework that seeks to provide a quantifiable model for both individual and population-level prediction of non-adherence under different scenarios.
Methods: We present an empirical framework that includes a health production function, specifically applied to antihypertensive medications nonadherence. Data collection involved a pilot study that utilized a double-bound contingent-belief (DBCB) questionnaire. Through this questionnaire, participants could express how efficacy and side effects were affected by controlled levels of non-adherence, allowing for the estimation of sensitivity in health outcomes and costs.
Results: Parameters derived from the DBCB questionnaire revealed that on average, patients with hypertension anticipated that treatment efficacy was less sensitive to non-adherence than side effects. Our derived health production function suggests that patients may strategically manage adherence to minimize side effects, without compromising efficacy. Patients’ inclination to manage medication intake is closely linked to the relative importance they assign to treatment efficacy and side effects. Model outcomes indicate that patients opt for full adherence when efficacy outweighs side effects. Our findings also indicated an association between income and patient expectations regarding the health of antihypertensive medications.
Conclusion: Our framework represents a pioneering effort to quantitatively link non-adherence to patient preferences. Preliminary results from our pilot study of patients with hypertension suggest that the framework offers a viable alternative for evaluating the potential impact of interventions on treatment adherence.
Keywords: medication adherence, patient preferences, health production, behavioral model, quantitative framework, treatment efficacy, side effects
Introduction
The lack of consistent adherence to prescribed medication regimens among patients with chronic conditions is a significant issue that affects more than half of this population. This challenge is closely associated with unfavorable health outcomes and substantial healthcare expenses.1–3 To illustrate, in the United States, medication non-adherence is linked to estimated 125,000 preventable deaths annually, along with $100 billion in avoidable medical costs.1,4–7 This problem arises because of a combination of factors spanning patient behavior, healthcare providers, and health systems, necessitating comprehensive interventions across multiple levels.8–10
Given the critical nature of medication non-adherence, extensive research in health psychology and microeconomics has sought to assess and mitigate this concern through evidence-based medication adherence interventions.10–23 A review of the literature reveals several prevailing theoretical models used in medication adherence literature have been developed over the past few decades.
Commonly Applied Theoretical Models
Health Belief Model postulates that the likelihood of continuous medication taking increases if the perceived threat of illness from non-adherence is high, the benefits are greater than the barriers to taking medications, and cues to action (eg reminders) are in place.24 The Theory of Planned Behavior suggests that an individual’s intention to persist with medication taking increases if the perceived consequences are high (ie, attitudes towards behavior and outcome expectancies are positive), they have strong positive beliefs about what others expect (perceived social norms), and they perceive a high level of personal control/self-efficacy with regard to persisting, even when facing barriers. This depends on their perception of internal (eg, knowledge) and external resources (eg, social support).16 Integrated Behavior Model illustrates that different factors explained by the Theory of planned behavior, Theory of reasoned action and Information Integration Theory lead from behavioral intent to performing a behavior-like medication taking.25 Measures used in these theoretical models mostly assess intention to be adherent.26 However, these models fall short of fully addressing the intricate process of quantifying the anticipated level of adherence resulting from individual patients’ decisions when obstacles to adherence are lessened. In medication adherence, self-efficacy is generally described as people’s beliefs about their capabilities (how people feel, think, motivate themselves, and behave) to produce designated levels of adherence to treatment.12 While qualitative research methods can provide insights into self-efficacy, they are limited in their ability to quantify the intricate “mental model” that underlies this construct. Economic theories may assist in developing a quantitative analytical framework to describe and test how people think about medication adherence, motivation to adhere and actual adherence.
Health economists have long applied microeconomic theories of choice behavior to health decisions and policies.27 These theories posit that patients approach health production in a manner akin to other goods or services while expressing preferences regarding the quantity and quality of the health outcomes.28
As with other microeconomic models, health behavior can be assumed to be driven by the intersection of what can be produced and what people wish to produce. While random utility theory has opened the door to the quantification of utility as a result of systematic choices between alternatives,19,20,22,23 a similar framework does not exist for the quantification of health production in the context of treatment non-adherence. The lack of such a framework limits the use of health-preference information as conventionally applied in health-preference research. Crucially, these microeconomic principles overlap with aspects of the frameworks more commonly used to describe treatment non-adherence, like changes in the importance of treatment benefits or barriers.
A Microeconomic Framework for the Estimation of Treatment Adherence
In microeconomics, the relative importance of the outcomes is often defined using utility functions. The utility of outcomes is endogenous to the individual, and defines the impact that outcomes have (or are expected to have) on patient well-being. Utility functions define the relative importance of outcomes and their exchange rate as compensatory attributes that can offset each other in a way that leaves people indifferent between them. For example, increasing the cost of treatment (financial, time commitments, and health payments such as adverse events or risk exposure) might be offset by improvements in efficacy, as people are willing to pay a higher cost for better treatment outcomes.27,28
Utility functions are standard tools in microeconomic theory and allow us to characterize “indifference” curves, where different costs and benefits yield the same level of well-being. Thus, individuals are expected to be indifferent to any point on the curve. However, different curves are associated with different levels of well-being, and people are better off moving to indifference curves associated with higher levels of utility. Figure 1 presents an example plot of the various indifference curves between treatment benefits and costs.
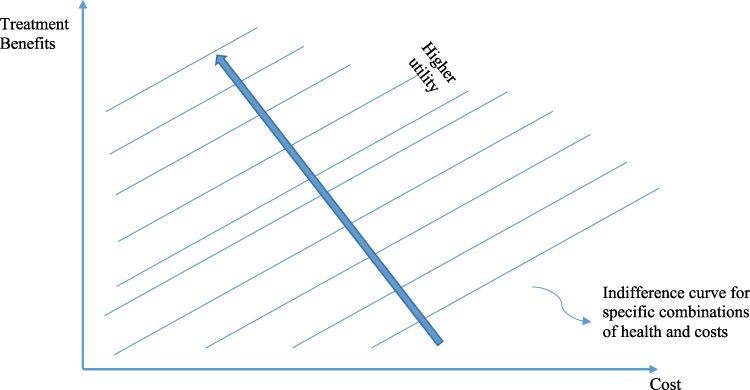 |
Figure 1 Indifference Curves for Treatment Benefits and Cost. |
Utility functions can be estimated through stated-preference or revealed preference methods based on random-utility theory.29 On the production side, health outcomes often represent complex relationships that involve the specifics of the disease, treatment mechanism of action, pharmacokinetics, titration effects, baseline patient conditions, and more. Ideally, patients and clinicians’ understanding of these relationships would be sufficient to describe a clinically factual production function for each patient; however, in the real world, this is almost never the case. Having that much information would be costly in terms of collecting evidence and transferring that knowledge to physicians and patients in the clinical setting. The challenges of accomplishing such transfers are compounded by the observed inertia and “switching costs” in healthcare.30–35
Health decisions are often based on limited information about the outcomes that patients can experience. Given this reality, the specifics of health production through treatment are largely endogenous to the patients. This is particularly true in situations where little to no clinical evidence is available, such as specific changes in outcomes when patients are not adherent to treatment. Thus, health production is arguably a mental construct that depends on patients’ expectations of treatment and their associated outcomes. We propose operationalizing the estimation of individual health production functions by eliciting sufficient information from patients to estimate this mental construct as a function of treatment adherence.
Note that this function may be informed by clinical evidence, but it corresponds to patients’ perception of the implications of clinical evidence in the real world. It is also potentially related to patients’ experiences with treatment and the information they receive from others around them, thereby associated with the processes of adherence (initiation, implementation, persistence, and discontinuation).3
We formalize the definition of health production functions by positing that patients craft a mental model of health production under scenarios that are not covered by interactions with their physicians or by the clinical evidence available to them. This function relates the benefits of health behaviors to the costs associated with achieving such benefits. In its simplest and most broadly applicable form, health production is defined as follows:
H=f(C) Where H is some level of health and f(C) is a continuous function that transforms costs into health outcomes. The first derivative of this function, fʹ(C) defines the exchange rate between health gains and costs as perceived by the patient.
We can define an optimality condition in which the cost of producing health always accomplishes its maximum potential by defining equation S as follows:
Given the assumption that patients will receive the full health benefits they expect from a particular level of treatment costs, this equation will always be zero. Thus, S was defined as both zero and as f(C)-H
We can now expand this definition to explicitly account for treatment adherence by making both health production and cost a function of adherence (A).

Taking the derivative of S with respect to A, yields the following:
We also know that S is always zero. Hence, we know  must equal zero because no change in the value of S is allowed by definition. Thus:
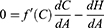
This results in the following:

In other words, under the optimality condition defined above, for a given cost level, the marginal change in health based on cost is the ratio of the marginal change in health with treatment adherence to the marginal change in cost with treatment adherence.
We can then integrate  with respect to A to recover a healthy production function. The integration of this ratio depends on the assumed functional forms of H and C. In the simplest case, these functions can be assumed linear with the reduced form of
  , where β and γ are the marginal effects of adherence on health outcomes and costs, respectively.
A general way to characterize the functional specification of f(C) would be to assume a polynomial function for both the health (H) and cost (C) functions. In this case, the general form of  , where
 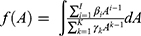 as the reduced form of f(C(A)).
Production and Utility Working Together to Define Adherence Levels
While the form of the health production function for any given population is in fact the empirical question of interest, one can consider example cases (Figure 2) to evaluate their implication on patients’ expected adherence behavior. This function relates cost and health, with the latter representing a general health indicator that decreases whenever an individual experiences health problems, as depicted by a reduction in health from point A to point B in the Figure Increasing health to its original level is assumed to be only possible with some cost C’, as described by the production function to point C.
 |
Figure 2 Three examples of Health-Production Functions. |
In this stylized example, we allow the production function to be globally concave, convex, or linear. Each type of production function has different implications for the expectation of non-adherence. A globally concave health production function implies that costs increase along with the health benefits. In other words, treatment adherence increases costs faster than health benefits. In a globally convex production function, health increases faster than cost. In other words, every additional unit cost results in greater change in health. Finally, a linear production function may exist, implying that health and cost increase at a constant rate.
To explain the implications of the health production function, imagine a patient at point A (Health0) (Figure 3) when they start experiencing an illness or are diagnosed with chronic illness. This reduces their health to point B (Health1) and requires cost C’ to achieve full recovery to Health0 or to control the illness, as in the case of chronic conditions. However, microeconomic theory states that decision makers also consider the relative importance of each unit of cost and the benefit derived from expending that cost. The relative importance is characterized by the slope of the indifference curve, as shown in Figure 3. Note that the highest level of utility achievable with any combination of health and costs on the health-production function is at point D, where the slope of the indifference curve (ie, the relative importance of the outcomes) equals the slope of the production function. At this point, the patient is not willing to commit to the full cost C’ to achieve a Health0. Instead, they settle for a new lower health level associated with a marginal cost that matches the value obtained from treatment (point D). Beyond this point, the marginal cost of achieving better health outcomes increased faster than expected. Only in situations in which patients consider the additional health benefits to be very important relative to the cost will they be expected to be fully adherent to treatment.
 |
Figure 3 Production and Utility Working Together to Define Adherence Levels. |
Based on the expectation that patients will gravitate towards the health production point that maximizes their utility, one can equate the slopes of the health production function and indifference curves to approximate the level of A expected from the patients.
Case Study: Estimating Population-Level Health Production Model for Antihypertensive Non-Adherence
Methods
We conducted a pilot study involving a convenience sample of people living with HIV who were virally suppressed for >2 years, a proxy for optimal HIV medication adherence at the Duke University Medical Center. To be eligible, participants had a diagnosis and were taking medications for hypertension and hyperlipidemia. Eligible individuals were identified from the electronic medical record and were approached by a study coordinator to obtain informed consent. After completing written informed consent, they completed a survey administered using the Research Electronic Data Capture (ie, REDCap)36 data management system. Participants received $25 for their participation in the study.
Data were obtained on participants’ characteristics, and we used double-bounded dichotomous contingent-response questions to assess willingness to pay (level of non-adherence) for treatment efficacy and the intensity of side effects of antihypertensive and lipid lowering medication.37 Double-bounded dichotomous-choice (DBDC) questions have been shown to increase the efficiency of willingness to pay estimates and are commonly used in health-preference research.38–41 We applied this question format to elicit the point at which respondents thought non-adherence would compromise treatment efficacy (health) and side effects (cost). With this format, we asked respondents to state whether they thought a given level of treatment non-adherence would affect treatment efficacy. If a respondent stated that they did not think the level of treatment non-adherence would affect efficacy (or that they were not sure), a subsequent question was asked whether a higher level of non-adherence would affect efficacy. If the respondents thought that the first level of non-adherence indeed affected treatment efficacy (health), they were asked whether a lower level of non-adherence would also affect treatment efficacy. Figure 4 shows the contingent patterns for the questions, and the same types of questions were asked regarding the level of non-adherence to the intensity of the side effects of medications. Although participants of the pilot study were taking HIV, lipid lowering and antihypertensive, for this article, we only analyzed data for antihypertensive medications non-adherence behavior.
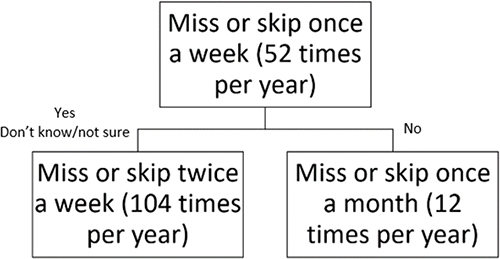 |
Figure 4 Pattern in Contingent-Response Questions on Levels of Medication Nonadherence. |
The first question asked whether skipping antihypertensive medication once a week (~52 times a year) or 85% adherence would increase the likelihood of adverse cardiovascular events (stroke or heart attack). Depending on the response to the first bid, the level of non-adherence increased to twice a week (~104 times a year); 71%) or reduced to once a month (~12 times a year; 97%). This exercise was repeated to determine the sensitivity of the intensity of side effects too.
To analyze these responses, we used two bivariate probit models (one for efficacy and one for side effects, respectively) that regressed the dichotomous variable signaling whether the respondent stated that a particular frequency of non-adherence would affect efficacy and side effects (ie, the respondent answered “yes” to each DBDC question).37 The model specification included linear and quadratic terms of the frequency of non-adherence. We evaluated the significance of the results at the 95% confidence level.
The results from the bivariate probit model were interpreted as a function that describes the effect of non-adherence on treatment efficacy and cost in the form of side effects. A bivariate probit assumes that the data-generating process induces a normally distributed error on our measurement of the sensitivity of efficacy and side effects to non-adherence. Furthermore, the model recognizes the conditional nature of our “bidding” structure for the number of times we asked respondents to assume they would be non-adherent to treatment and estimates a correlation parameter across efficacy questions and separately across side-effect questions. We used these results to derive the health production function by calculating the marginal effect of each unit of adherence on treatment efficacy and side effects (costs).
Finally, we generated interactions between several respondent-specific characteristics and the frequency of non-adherence. These interactions were included in the bivariate probit models to assess the degree to which health production functions differed systematically according to respondents’ age, gender, and income.
Ethical approval for this study was obtained from the Duke University Institution Review Board. This study was conducted in accordance with the principles of the Declaration of Helsinki.
Results
In the pilot project, data were obtained from 39 participants. Appendix A shows a summary of the characteristics of respondents. Average respondent ages were 57.9 years (SD 9.7 years). Most respondents were male – 81.6%; n = 32, and about 40% (n = 16) of respondents reported having an annual household income above $50,000.
Figures 5a and b summarizes the distribution of responses to the DBCB questions. The majority (64%; n = 25) reported that missing antihypertensive medications once per week would increase the chance of experiencing a heart attack or stroke, and about half of those who believed that missing once a week would not increase the likelihood of a heart attack or stroke reported that missing twice a week would increase the likelihood of heart attack or stroke (Figure 5a). Regarding treatment side effects, the majority (59%; n = 23) reported that one missed dose would not affect the intensity of side effects. Among those who did not think that missing a dose once a week would decrease the intensity of side effects, the majority still thought that missing data twice a week would not affect the intensity of side effects (63%; n = 23) (Figure 5b).
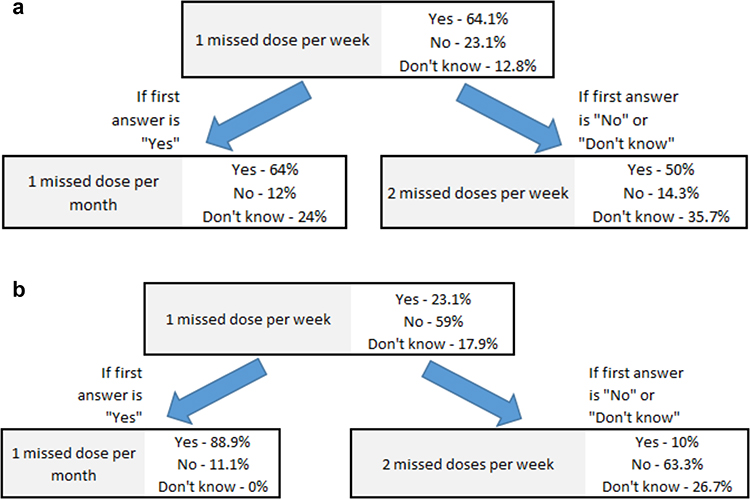 |
Figure 5 (a) Distribution of responses stating that treatment efficacy is compromised by level of non-adherence. (b) Distribution of responses stating that treatment side effects are affected by level of non-adherence. |
We estimated the marginal effect of non-adherence on the efficacy and intensity of the side effects of antihypertensive medications. Table 1 shows the estimates from the bivariate probit models for the efficacy model (H) and side-effects model (C). Specification tests for each function showed that the efficacy model was best described using a linear and quadratic effect for the frequency of non-adherence, whereas the side-effects model was better defined by the linear effect only.
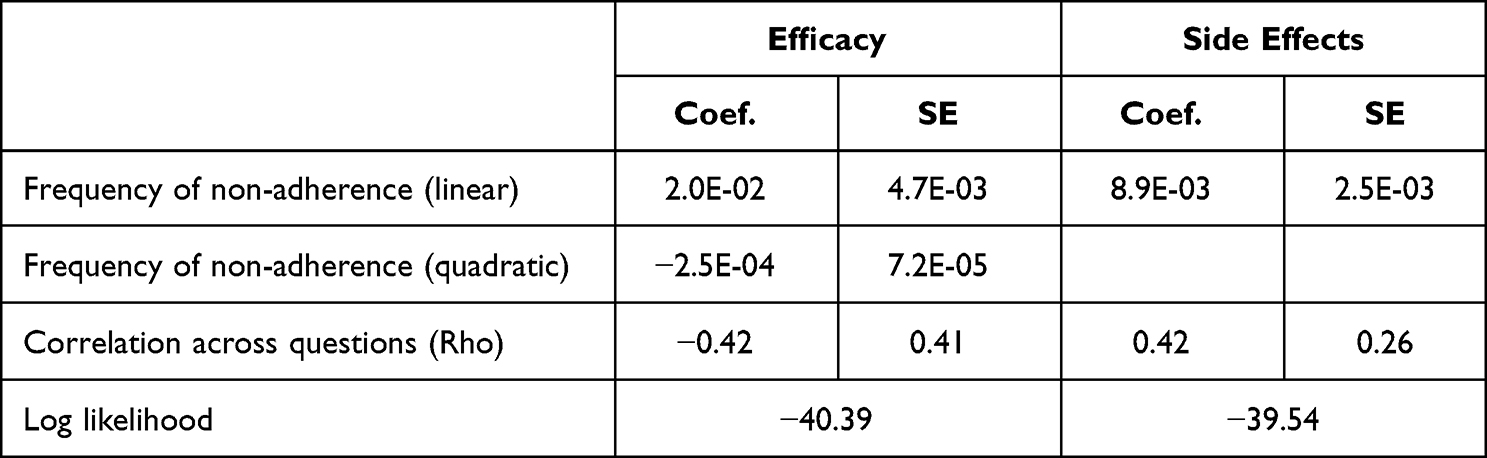 |
Table 1 Regression Results for Efficacy (H) and Intensity of Side Effects (C) Functions (N = 39) |
Given these functional forms for H and C, 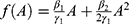 , where β1 is the parameter estimate for the linear effect of non-adherence on treatment efficacy, β2 is the estimate for the quadratic effect, and γ1 is the estimate for the linear effect of non-adherence to medication side effects.
We calculated the population-level health production function based on changes in treatment adherence (Figure 6). The resulting health production function was concave, suggesting that our study participants’ beliefs about the impact of non-adherence on treatment outcomes put them at risk of being non-adherent. A concave function suggests that patients would be expected to have relatively lower treatment initiation hurdles but would likely find the cost of treatment adherence to increase more than expected health gains. Thus, full adherence, given this perception, would be expected to be the exception, not the rule, and most of those who perceive much greater value in the prevention of cardiovascular disease outcomes than the reduction in the intensity of treatment side effects.
 |
Figure 6 Expected Health-Production Function (Mean and 95% CIs) for Antihypertensive Medication Nonadherence. |
The interaction terms for age and sex were not statistically significant at the 95% confidence level. However, interactions with income were significant. Figure 7 presents the derived health production functions for respondents who reported having less than $50,000 in yearly household income and those with at least that amount. As presented in the figure, we estimated that respondents with at least $50,000 had nearly linear health production functions. Meanwhile, they appeared to be much less optimistic about their ability to produce health benefits through antihypertensive medications.
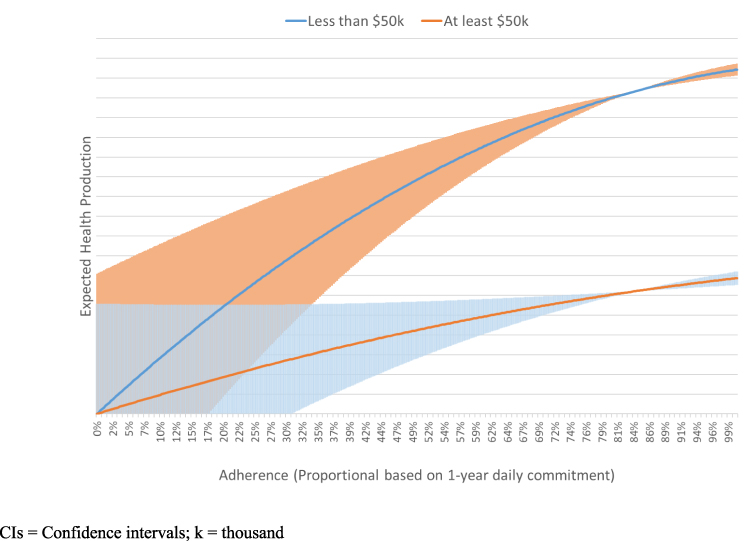 |
Figure 7 Expected Health-Production Function (Mean and 95% CIs) for Antihypertensive Medication Nonadherence by Respondent Household Income. |
Discussion
The framework proposed in this study offers a valuable tool for evaluating medication non-adherence and its intricate relationship with treatment beliefs. Our framework also relates patient preferences and expectations between health production costs and achievable health to determine the level of adherence to medications expected under rational decision-making. In this sense, the framework derives non-adherence as a natural consequence of having patients’ well-being goes beyond health outcomes and identifies the conditions under which adherence is more likely or expected. Intriguingly, our framework suggests that full adherence emerges as an exceptional scenario, arising when health production is relatively “inexpensive”, or the relative value of health outcomes achieved via adherence is notably high.
To operationalize this concept, we used an innovative elicitation format that allowed the estimation of health production functions by gauging sensitivity thresholds across treatment benefits and costs. Despite being a proof of concept, we demonstrated how the proposed method can effectively estimate intricate health production functions with relatively small samples. We also demonstrated how the statistical analysis of the data generated using this method is suitable for identifying systematic variations in patients’ mental model for health production with treatment. In our example, we were able to distinguish health-production expectations by respondents’ income.
Our results with patients taking antihypertensives indicate that they exhibit beliefs about producing health that is consistent with partial adherence to treatment. The average respondent assumed a concave health-production function in which the cost of producing each unit of health increases with adherence. However, it is important to note that an assessment of expected non-adherence depends on the knowledge of the respondents’ preferences, which we did not elicit in our application.
Respondents’ income appears to be correlated with patients’ expectations of health production with antihypertensive medications. Respondents who had a household income at or above $50,000 per year, were more likely to have a less concave and less steep production function than those making less than $50,000 per year. It is worth noting that although a linear production function might make respondents less susceptible to non-adherence, the overall slope of the function for this group also suggests a higher risk of non-adherence. This is because patients who expect higher average costs for adhering to treatment would need to have preferences that consider health outcomes relatively more important than those costs to adhere fully to treatment.
These findings should be interpreted in light of the study’s limitations. We did not evaluate the appropriateness or universal applicability of the levels of non-adherence in the DBDC questions prior to fielding the survey instrument. This may have implications on participants’ ability to provide meaningful signals about their beliefs on how non-adherence affects treatment efficacy and side effects. Finally, this was a pilot study conducted at a single health system with a convenience sample for a specific patient population in the United States. Thus, our results are not considered generalizable. Nonetheless, the proposed framework provides a way to explain non-adherent behavior by quantifying patient expectations about their ability to gain health through treatment as well as their ability to manage treatment side effects through non-adherence. Consistent with other methods to evaluate treatment non-adherence, our framework offers a way to link treatment expectations to patient preferences in a way that can help quantify patients’ risk of non-adherence.
Future research can leverage this tool to evaluate and test mechanisms and the underlying motivations for non-adherence. A comprehensive understanding of how beliefs are formed, altered and influenced by external norms also warrants further exploration.
Acknowledgement
The authors would like to thank the study participants and their healthcare providers for their valuable contribution to the success of the study. Special thanks to Stuart Carr for assistance with regulatory affairs and data collection. Finally, thanks to Shelby D. Reed, F. Reed Johnson and Mersedes Brown for their advice. The students who assisted with the project including Tianbei Zhang, Carl J. Mhina, Connor Volpi, Rita W. Kibicho, and Mary C. Hill.
Funding
This research was supported by the United States National Institutes of Health - the Duke Center for AIDS Research Award # P30AI064518. CM is also supported by NHLBI grant # K01HL159052. The content is solely the responsibility of the authors and does not necessarily represent the official views of the National Institutes of Health.
Disclosure
Dr Hayden Bosworth reports grants and/or personal fees from Sanofi, BeBetter therapeutics, Boehringer Ingelheim, Esperion, Improved Patient Outcomes, Merck, NHLBI, Novo Nordisk, Veterans Health Administration, Elton John Foundation, Hilton foundation, Pfizer, and Webmed, outside the submitted work. The authors report no other conflicts of interest in this work.
References
1. Osterberg L, Blaschke T. Adherence to medication. N Engl J Med. 2005;353(5):487–497. doi:10.1056/NEJMra050100
2. DiMatteo MR. Variations in patients’ adherence to medical recommendations: a quantitative review of 50 years of research. Med Care. 2004;42(3):200–209. doi:10.1097/01.mlr.0000114908.90348.f9
3. Vrijens B, De Geest S, Hughes DA, et al. A new taxonomy for describing and defining adherence to medications. Br J Clin Pharmacol. 2012;73(5):691–705. doi:10.1111/j.1365-2125.2012.04167.x
4. Kleinsinger F. The Unmet Challenge of Medication Nonadherence. Perm J. 2018;22:18–033. doi:10.7812/tpp/18-033
5. Iuga AO, McGuire MJ. Adherence and health care costs. Risk Manag Healthc Policy. 2014;7:35–44. doi:10.2147/rmhp.S19801
6. Viswanathan M, Golin CE, Jones CD, et al. Interventions to improve adherence to self-administered medications for chronic diseases in the United States: a systematic review. Ann Intern Med. 2012;157(11):785–795. doi:10.7326/0003-4819-157-11-201212040-00538
7. Nasseh K, Frazee SG, Visaria J, Vlahiotis A, Tian Y. Cost of medication nonadherence associated with diabetes, hypertension, and dyslipidemia. Am J Pharm Benefits. 2012;4(2):e41–e47.
8. Gellad WF, Grenard J, McGlynn EA. A Review of Barriers to Medication Adherence: A Framework for Driving Policy Options. RAND Corporation; 2009.
9. Neiman AB, Ruppar T, Ho M, et al. CDC Grand Rounds: improving medication adherence for chronic disease management - Innovations and opportunities. Am J Transplant. 2018;18(2):514–517. doi:10.1111/ajt.14649
10. Holmes EAF, Hughes DA, Morrison VL. Predicting adherence to medications using health psychology theories: a systematic review of 20 years of empirical research. Value Health. 2014;17(8):863–876. doi:10.1016/j.jval.2014.08.2671
11. Munro S, Lewin S, Swart T, Volmink J. A review of health behaviour theories: how useful are these for developing interventions to promote long-term medication adherence for TB and HIV/AIDS? BMC Public Health. 2007;7(1):104. doi:10.1186/1471-2458-7-104
12. Bandura A. Self-efficacy: toward a unifying theory of behavioral change. Psychol Rev. 1977;84(2):191. doi:10.1037/0033-295X.84.2.191
13. Bandura A. Social foundations of thought and action. Englewood Cliffs. 1986;1986:23–28.
14. Bandura A, Freeman WH, Lightsey R. Self-Efficacy: The Exercise of Control. Springer; 1999.
15. Becker MH. The health belief model and personal health behavior. Health Educ Monogr. 1974;2:324–473. doi:10.1177/109019817400200407
16. Ajzen I. The theory of planned behavior. Organ Behav Hum Decis Process. 1991;50(2):179–211. doi:10.1016/0749-5978(91)90020-T
17. Leventhal H, Diefenbach M, Leventhal EA. Illness cognition: using common sense to understand treatment adherence and affect cognition interactions. Cognit Ther Res. 1992;16:143–163. doi:10.1007/BF01173486
18. Montano D, Kasprzyk D, Glanz K, Rimer B, Viswanath K. Theory of reasoned action, theory of planned behavior, and the integrated behavior model. Psychol Psychother. 2008;2008:67–96.
19. Ben-Akiva ME, Lerman SR, Lerman SR. Discrete Choice Analysis: Theory and Application to Travel Demand. The MIT Press; 1985.
20. Domencich T. Urban Travel Demand-a Behavioral Analysis North-Holland. Publishing Co.; 1975.
21. Harsanyi JC. Normative validity and meaning of von neumann-morgenstern utilities. In: Prawitz D, Skyrms B, Westerståhl D, editors. Studies in Logic and the Foundations of Mathematics. Elsevier; 1995:947–959.
22. Hensher D, Johnson LW. Behavioural response and form of the representative component of the indirect utility function in travel choice models. Reg Sci Urban Econ. 1981;11:559–572. doi:10.1016/0166-0462(81)90038-7
23. Train KE. Discrete Choice Methods with Simulation. Cambridge university press.; 2009.
24. Rosenstock IM. The health belief model and preventive health behavior. Health Educ Monogr. 1974;2(4):354–386. doi:10.1177/109019817400200405
25. Barajas MS, Bines D, Straussman J. Integrated Behavioral Health and Intervention Models. Pediatr Clin N Am. 2021;68(3):669–683. doi:10.1016/j.pcl.2021.02.015
26. Webb TL, Sniehotta FF, Michie S. Using theories of behaviour change to inform interventions for addictive behaviours. Addiction. 2010;105(11):1879–1892. doi:10.1111/j.1360-0443.2010.03028.x
27. Zweifel PBF, Kifmann M. Health Economics. Springer; 2009.
28. Johnson FR, Scott FI, Reed SD, Lewis JD, Bewtra M. Comparing the Noncomparable: the Need for Equivalence Measures That Make Sense in Health-Economic Evaluations. Value Health. 2019;22(6):684–692. doi:10.1016/j.jval.2019.03.011
29. McFadden D. Conditional Logit Analysis of Qualitative Choice Behavior. In: Zarembka P, editor. Frontiers in Econometrics. Academic Press; 1973.
30. Atherly A, Feldman RD, Dowd B, van den Broek-Altenburg E. Switching Costs in Medicare Advantage. Forum Health Econ Policy. 2020;23(1). doi:10.1515/fhep-2019-0023
31. Handel BR. Adverse selection and inertia in health insurance markets: when nudging hurts. American. Economic Rev. 2013;103(7):2643–2682.
32. de Ruyter K, Wetzels M, Bloemer J. On the relationship between perceived service quality, service loyalty and switching costs. Int J Serv Ind Manag. 1998;9(5):436–453. doi:10.1108/09564239810238848
33. Lamiraud K, Stadelmann P. Switching costs in competitive health insurance markets: the role of insurers’ pricing strategies. Health Econ. 2020;29(9):992–1012. doi:10.1002/hec.4111
34. Milan GS, Eberle L, Bebber S. Perceived Value, Reputation, Trust, and Switching Costs as Determinants of Customer Retention. J Relatsh Mark. 2015;14(109):- . doi:10.1080/15332667.2015.1041353
35. Han J, Ko DW, Urmie JM. The role of satisfaction and switching costs in Medicare Part D choices. Res Social Administrative Pharm. 2014;10(2):398–407. doi:10.1016/j.sapharm.2013.06.010
36. Harris PA, Taylor R, Minor BL, et al. The REDCap consortium: building an international community of software platform partners. J Biomed Inform. 2019;95:103208. doi:10.1016/j.jbi.2019.103208
37. Hanemann M, Loomis J, Kanninen B. Statistical efficiency of double-bounded dichotomous choice contingent valuation. Am J Agric Econ. 1991;73:1255–1263. doi:10.2307/1242453
38. Clarke PM. Valuing the benefits of mobile mammographic screening units using the contingent valuation method. Appl Econom. 2000;32(13):1647–1655. doi:10.1080/000368400420995
39. Prosser LA, Bridges CB, Uyeki TM, et al. Values for preventing influenza-related morbidity and vaccine adverse events in children. Health Qual Life Outcomes. 2005;3:1–9. doi:10.1186/1477-7525-3-18
40. Kennedy CA. Revealed preference valuation compared to contingent valuation: radon‐induced lung cancer prevention. Health Econ. 2002;11(7):585–598. doi:10.1002/hec.724
41. Watson V, Ryan M. Exploring preference anomalies in double bounded contingent valuation. J Health Econ. 2007;26(3):463–482. doi:10.1016/j.jhealeco.2006.10.009
 © 2023 The Author(s). This work is published and licensed by Dove Medical Press Limited. The
full terms of this license are available at https://www.dovepress.com/terms
and incorporate the Creative Commons Attribution
- Non Commercial (unported, 3.0) License.
By accessing the work you hereby accept the Terms. Non-commercial uses of the work are permitted
without any further permission from Dove Medical Press Limited, provided the work is properly
attributed. For permission for commercial use of this work, please see paragraphs 4.2 and 5 of our Terms.
© 2023 The Author(s). This work is published and licensed by Dove Medical Press Limited. The
full terms of this license are available at https://www.dovepress.com/terms
and incorporate the Creative Commons Attribution
- Non Commercial (unported, 3.0) License.
By accessing the work you hereby accept the Terms. Non-commercial uses of the work are permitted
without any further permission from Dove Medical Press Limited, provided the work is properly
attributed. For permission for commercial use of this work, please see paragraphs 4.2 and 5 of our Terms.