Back to Journals » International Journal of Nanomedicine » Volume 15
A Protein Corona Adsorbed to a Bacterial Magnetosome Affects Its Cellular Uptake
Authors Lai W ![]() , Li D, Wang Q, Nan X, Xiang Z, Ma Y
, Li D, Wang Q, Nan X, Xiang Z, Ma Y ![]() , Liu Y
, Liu Y ![]() , Chen J
, Chen J ![]() , Tian J, Fang Q
, Tian J, Fang Q
Received 19 June 2019
Accepted for publication 24 January 2020
Published 6 March 2020 Volume 2020:15 Pages 1481—1498
DOI https://doi.org/10.2147/IJN.S220082
Checked for plagiarism Yes
Review by Single anonymous peer review
Peer reviewer comments 2
Editor who approved publication: Dr Thomas Webster
Wenjia Lai,1,* Dan Li,2,3,* Qingsong Wang,4 Xiaohui Nan,2,3 Zhichu Xiang,2,3 Yan Ma,5 Ying Liu,2 Jiankui Chen,6 Jiesheng Tian,7 Qiaojun Fang2,3
1CAS Key Laboratory of Standardization and Measurement for Nanotechnology, CAS Center for Excellence in Nanoscience, National Center for Nanoscience and Technology, Beijing 100190, People’s Republic of China; 2CAS Key Laboratory for Biomedical Effects of Nanomaterials and Nanosafety, CAS Center for Excellence in Nanoscience, National Center for Nanoscience and Technology, Beijing 100190, People’s Republic of China; 3University of Chinese Academy of Sciences, Beijing 100049, People’s Republic of China; 4State Key Laboratory of Protein and Plant Gene Research, College of Life Sciences, Peking University, Beijing 100871, People’s Republic of China; 5Aviation Service Department, Yantai Engineering & Technology College, Yantai 264000, People’s Republic of China; 6Clinical Laboratory, Affiliated Hospital of Academy of Military Medical Sciences, Beijing 100071, People’s Republic of China; 7State Key Laboratories for Agrobiotechnology and College of Biological Sciences, China Agricultural University, Beijing 100193, People’s Republic of China
*These authors contributed equally to this work
Correspondence: Jiesheng Tian
State Key Laboratories for Agrobiotechnology and College of Biological Sciences, China Agricultural University, No. 2 Yuanmingyuan West Road, Haidian District, Beijing 100193, People’s Republic of China
Tel +86 10-62731440
Email [email protected]
Qiaojun Fang
CAS Key Laboratory for Biomedical Effects of Nanomaterials and Nanosafety, CAS Center for Excellence in Nanoscience, National Center for Nanoscience and Technology, No. 11 ZhongGuanCun Beiyitiao, Haidian District, Beijing 100190, People’s Republic of China
Tel +86 10-82545562
Email [email protected]
Purpose: It is well known that when exposed to human blood plasma, nanoparticles are predominantly coated by a layer of proteins, forming a corona that will mediate the subsequent cell interactions. Magnetosomes are protein-rich membrane nanoparticles which are synthesized by magnetic bacteria; these have gained a lot of attention owing to their unique magnetic and biochemical characteristics. Nevertheless, whether bacterial magnetosomes have a corona after interacting with the plasma, and how such a corona affects nanoparticle–cell interactions is yet to be elucidated. The aim of this study was to characterize corona formation around a bacterial magnetosome and to assess the functional consequences.
Methods: Magnetosomes were isolated from the magnetotactic bacteria, M. gryphiswaldense (MSR-1). Size, morphology, and zeta potential were measured by transmission electron microscopy and dynamic light scattering. A quantitative characterization of plasma corona proteins was performed using LC-MS/MS. Protein absorption was further examined by circular dichroism and the effect of the corona on cellular uptake was investigated by microscopy and spectroscopy.
Results: Various serum proteins were found to be selectively adsorbed on the surface of the bacterial magnetosomes following plasma exposure, forming a corona. Compared to the pristine magnetosomes, the acquired corona promoted efficient cellular uptake by human vascular endothelial cells. Using a protein-interaction prediction method, we identified cell surface receptors that could potentially associate with abundant corona components. Of these, one abundant corona protein, ApoE, may be responsible for internalization of the magnetosome-corona complex through LDL receptor-mediated internalization.
Conclusion: Our findings provide clues as to the physiological response to magnetosomes and also reveal the corona composition of this membrane-coated nanomaterial after exposure to blood plasma.
Keywords: LC-MS/MS, cellular interaction, cellular uptake, biogenic magnetic nanoparticle
Introduction
Magnetosomes are membrane-enclosed nano-sized inorganic crystals that are formed intracellularly in magnetotactic bacteria. They are synthesized and organized in a species-specific manner a process that is genetically regulated by a complex and specific set of genes.1,2 These particles represent a new class of magnetic nanoparticles that have exceptional properties due to their unique magnetic and biochemical characteristics.3 The magnetite cores of magnetosomes are uniform in shape, completely crystalline, and compositionally homogeneous. Compared to artificial magnetites, the thin organic membrane enveloping the individual magnetosomes confers excellent homogeneous dispersion in aqueous solutions and also provides a variety of chemical groups.4,5 These properties are a significant advantage in the use of magnetosomes and have attracted a great amount of interdisciplinary interest and inspired numerous ideas for their use in biotechnological applications6,7 such as magnetic separation, bioremediation, cell separation, DNA/antigen recovery or detection, drug delivery,8,9 and enzyme immobilization.4,10 Analysis of the magnetic properties of these particles has shown that magnetosomes are permanent single-magnetic-domain particles with unique magnetic characteristics, making them superior to synthetic magnetic particles.11,12 These properties allow for their use in medical applications such as hyperthermia treatment13 and magnetic resonance imaging.14
In order for their functionalization and subsequent use of detailed knowledge of the biocompatibility of the isolated magnetosomes is an essential requirement.7,14 The encapsulation of the magnetic crystal within the membrane provides a natural “coating”, which would be predicted to be biocompatible. However, biocompatibility studies of magnetosomes are limited. Some preliminary studies have demonstrated that magnetosomes injected through the sublingual vein induce little pathological damage to important organs in rats15 and also cause little toxicity toward cultured cells.16–18
It is known that when nanoparticles enter living systems, they come into contact with various proteins. The adsorption of proteins and their layering onto nanoparticle surfaces create the so-called “protein corona”.19 The presence of a protein corona on synthetic nanoparticles in a biological fluid has been shown to strongly influence cell interactions.20–22 For example, coating with vitronectin promotes the efficient uptake of nanoparticles into cancer cells expressing high levels of the αvβ3 integrin receptor.23 Similarly, retinol-conjugated nanoparticles can selectively recruit retinol-binding protein 4 into its corona which then directs the nanoparticle towards hepatic stellate cells, which functions as retinol-storing cells.24 Relatively little is known about whether the protein corona also exists on magnetosomes, and if so, how it affects particle-cell interactions. Therefore, intrinsic interactions between magnetosomes and human plasma should be examined to evaluate their biocompatibility and allow for the development of their biomedical applications.
In this study, we explore the interactions between magnetosomes and human plasma and examine the effect of the corona on cellular uptake. We found that, after exposure to plasma magnetosomes become covered with a protein corona. The protein profiles on the surface were analyzed by quantitative proteomics coupled with bioinformatics to identify the potential cell receptors recognized by the abundant corona components. The results of the corona analysis show that magnetosomes selectively adsorb several plasma proteins on their surface and that cellular internalization is enhanced in the presence of a corona. Finally, we identified the low-density lipoprotein (LDL) receptor as promising candidate target of the most abundant corona protein, apolipoprotein E, and this interaction appears to be involved in the uptake of the magnetosome corona complex by human vascular endothelial cells.
Materials and Methods
Bacterial Strains and Culture Conditions
Magnetotactic bacteria, M. gryphiswaldense (MSR-1) were a kind gift from China Agricultural University. MSR-1 were grown at 30°C at 100 rpm in an optimized flask medium, as described previously.25 Sterilized ferric citrate (100 mM) was added to the culture medium as an iron source at a final concentration of 60 µM.
Preparation of Magnetosomes
Following culture, MSR-1 cells were harvested and then washed twice with cold phosphate-buffered saline (PBS, Macgene, China). To extract the magnetosomes, the cells were suspended in PBS and then broken using an ultrasonic cell disruptor (200 W-40 W, work time: 3 s, rest time: 5 s, times: 99) (JY 92-IIN, Scientz, China). Magnetosomes were then separated from the cell debris using DynaMag™-2 magnet (Thermo Fisher Scientific, USA). The extraction was repeated a total of five times.26 After each magnetic separation step, the absorbance of the remaining supernatant was measured at 280 nm and 260 nm, to assess the protein and nucleic acid concentrations, respectively. Finally, the magnetosomes were washed twice with ultrapure water to remove PBS. The purified magnetosomes were diluted with ultrapure water to give a concentration of 1 mg/mL (Fe) based on the determination by o-phenanthroline spectrophotometry.27,28 To prepare a sample for phenanthroline colorimetry, magnetosomes solution (1–2 µL) was dissolved by 10 µL hydrochloric acid (12 mol/L) and boiled to get a clear solution. This process can destroy membranes and dissolve nanocrystal into an iron ion solution which can be measurement by phenanthroline colorimetry test.
Preparation of Mixed Plasma
Pooled human plasma samples were collected as described in a previous study.29 Before use, the plasma was thawed at 4°C and centrifuged for 30 mins at 22,000 × g at 4°C. The supernatant was then used for subsequent experiments.
Transmission Electron Microscopy (TEM)
PEG-Fe3O4 nanoparticles (SMG-30, 30 nm, 1 mg/mL Fe) were purchased from Ocean NanoTech (San Diego, CA, USA). The morphology and sizes of the PEG-Fe3O4 and magnetosome particles were observed by TEM (JEM-1230, Jeol, Japan). To prepare samples for TEM the dispersed nanoparticles suspension (10 μL) was dropped onto a copper grid coated with a carbon membrane and air-dried at room temperature (RT). For negatively stain, 5 μL dispersed magnetosome suspension (1 μg/μL Fe) was dropped onto a copper grid coated with a carbon membrane and incubated for 20 min, then the sample was stained with 1% uranyl acetate for 5 min, washed and air-dried before examined by TEM (Tecnai G2 F30 S-TWIN, FEI, USA).
Plasma Protein Corona Formation
Approximately 150 μL of magnetosomes or PEG-Fe3O4 nanoparticles (equal Fe amounts) were incubated for 1 h at 37°C with three volumes of human plasma to ensure a plasma volume to particle surface ratio greater than 5.55 mL/m2.23,30 The incubated samples were then separated using a strong magnet. After removing the supernatant, the nanoparticle-protein complexes were washed with PBST (0.05% Tween-20 in PBS) by suspending in buffer and incubating for 10 min at RT. The sample was then transferred to a new low protein binding centrifuge tube (Thermo Fisher Scientific, Waltham, MA, USA) followed by another round of magnetic separation. This wash procedure was repeated six times to remove any non-specifically bound proteins and to minimize the binding of plasma proteins to the walls of the tube. The same volume of ultrapure water was used as the control and each sample had a biological replicate created using the same procedure.
Zeta Potential
The zeta potential of the magnetosomes and PEG-Fe3O4 were measured in water or post-exposure to human plasma at 25°C using a Malvern Zetasizer Nano ZS (Malvern Instruments, Worcestershire, UK).
Corona Protein Extraction, Digestion, and Mass Spectrometry
Proteins were extracted from nanoparticles (50 μg Fe) by adding lysis buffer (6 M guanidine hydrochloride, 50 mM Tris, 20 mM tris(2-carboxyethyl)phosphine, 50 mM chloroacetamide), followed by sonication for 5 min and boiling for 10 min. The nanoparticles were then removed by centrifugation at 22,000 × g for 30 min.
The in-solution two-step digestion procedure was performed as described previously.31 Briefly, the lysates were treated with Lys-C (Promega Corporation, Madison, WI, USA) at a ratio of 1:100 (micrograms of enzyme to micrograms of protein) for 4 h at 37ºC. The digestion mixture was then diluted with 25 mM NH4HCO3 to reduce the guanidine hydrochloride concentration and incubated with trypsin (Promega Corporation) at a ratio of 1:50 (micrograms of enzyme to micrograms of protein) overnight at 37ºC. Finally, the peptides were acidified and then desalted using a C18 column (3 M, UK) as described previously.29
Liquid chromatography (LC) was performed using an Easy-nLC 1000 system (Thermo Fisher Scientific) with an in-house made 20 cm reverse-phase capillary emitter column (inner diameter 75 μm, 2.5 μm Venusil C18 resin (Agela Technologies, China). Approximately 1 μL of the digested peptides in 0.1% (v/v) formic acid were loaded onto the column and then eluted with a non-linear 90-min gradient of 5–30% buffer B (0.1% (v/v) formic acid, 90% (v/v) acetonitrile) at a flow rate of 200 nL/min. Mass spectrometry (MS) data were acquired on the Q Exactive instrument (Thermo Fisher Scientific) controlled by Thermo Xcalibur (version 3.1) with a data-dependent MS/MS scans (TopN = 15). The target value for the full MS scan was 3e6 in the 300–1700 m/z range with a maximum injection time of 50 ms and a resolution of 70,000 at m/z of 200. The isolation window was 1.6 m/z and the normalized collision energy was 28. The MS/MS scan resolution was 35,000 at m/z 200 with an ion-target value of 1e5 and a maximum injection time of 100 ms. To avoid the repeated sequencing of a peptide, the exclusion time was set to 45 s. A blank was injected between each type of sample to clean and balance the column as well as to eliminate carryover. To eliminate system errors and ensure data quality, two biological repeats and three technical repeats representing a total of six repeats per sample were performed for LC-MS/MS acquisition.
MS raw files were submitted to the MaxQuant software (version 1.5.1.2) with label-free quantification workflow using the Andromeda search engine.32 Data were used to query the human Uniprot FASTA database (UP000005640, May 2018 download with entries 73,928) with reversed protein sequences and a common contaminants (247 entries). The search included cysteine carbamidomethylation as a fixed modification and variable modifications of methionine oxidation and protein N-terminal acetylation. Enzyme specificity was set as C-terminal to arginine and lysine, and a maximum of two missed cleavages were allowed in the database search. Peptides with at least six amino acids were considered for identification. The false discovery rate for both peptides and proteins was set at 1%. For other options, the software standard settings were used.
After searching, 258 unique proteins were identified across all samples. Contaminants and proteins with fewer than two MS/MS counts in at least one sample were eliminated. The pruning procedure eliminated relatively low-abundance proteins within complex mixtures. To make the quantitative results robust, for each nanomaterial, proteins with only one iBAQ intensity in the biological replicate were eliminated.
Bioinformatics Analysis
Data analysis was performed with Perseus software in the MaxQuant computational platform, SPSS and by R statistical computing environment.33 The three technological repeats of each sample were set as one experiment when running the MaxQuant process and the average value (Av.) of the biological replicates for each protein’s iBAQ intensity was used in the following analysis (Figure 2). The relative abundance of each corona protein for a given material was estimated using the following formula:

where RA%(n) represents the relative abundance of the corona protein “n” on a given material.
Gene ontology (GO) enrichment and protein-interaction network of the top 20 corona proteins were performed by Cytoscape34 plugged ClueGO + CluePedia.35 The interaction data were acquired from BioGRID, IMEx, IntAct, MINT, and UniProt databases, and were merged and filtered using Cytoscape (version 3.6.1). Annotation of protein GO molecular function and cellular components were obtained from the UniProt database. The grand average of hydropathicity (GRAVY) scores for each identified protein were calculated using the ProtParam tool (http://web.expasy.org/protparam/) on the ExPASy Server. The concentrations of plasma proteins were derived from the Plasma Proteome Database (PPD; http://www.plasmaproteomedatabase.org/).36
Corona Protein Analysis by SDS-PAGE and Western Blot
PEG-Fe3O4 and magnetosomes (50 μg Fe amount) with or without corona were boiled in an equal volume SDS loading buffer for 5 min. After centrifugation, the supernatant was analyzed by SDS-PAGE using 8-16% polyacrylamide precast gels (Beyotime Biotechnology, China). As a comparison, 1 μL of whole plasma was loaded. Gels were stained overnight with Coomassie brilliant blue G250 (Beyotime Biotechnology, China).
For the Western blot assay, the protein samples were extracted from an equal amount (based on Fe content) of magnetosomes and PEG-Fe3O4 nanoparticles with or without corona and were separated on 4–20% precast gels and then transferred to a polyvinylidene fluoride membrane (Bio-Rad, Hercules, CA, USA). Membranes were blocked with 5% milk and then incubated with rabbit anti-human ApoE (GeneTex, USA), rabbit anti-human vitronectin/S-Protein (Abcam, UK), or rabbit anti-human serum albumin (Bioss, China) antibodies overnight at 4°C. The membranes were washed three times with PBST and then incubated with HRP-conjugated goat anti-rabbit IgG (SouthernBiotech, AL, USA) for 1 h at room temperature. Finally, ECL reagent (Millipore, CA, USA) was added to allow for band detection and visualization.
Further detailed experiments relating to magnetosome antibodies and LDL receptor expression levels are provided in the Supporting Information.
Circular Dichroism (CD)
Recombinant human vitronectin protein (VTN) (Sino Biological Inc. Beijing, China), human albumin protein (HSA) (Sigma-Aldrich, St. Louis, MO, USA) and human apolipoprotein E3 protein (ApoE) (GeneTex, CA, USA) were diluted with ultrapure water to give a concentration of 1 mg/mL. CD spectra were acquired on a JASCO J-1500 CD (Japan) using a 2 nm bandwidth and 1 s intervals with 1 mm path-length cuvette (ASONE, Japan). Water was used as a blank. Spectra were an average of three consecutive scans. The protein sample (0.02 mg/mL) was measured alone and in the presence of different nanoparticle concentrations (0.02, 0.01 and 0.0033 mg/mL Fe concentration). Nanoparticles alone (0.02, 0.01 and 0.0033 mg/mL Fe concentration) were also measured. Data analysis was performed using Spectra Manager (JASCO, version 2.13). Sample CD spectra were calculated by subtracting the spectra of nanoparticles alone from the spectra of proteins in the presence of nanoparticles, and the value at 260 nm was set to zero to account for spectral drift.37 The percentage of α-helix in ApoE and HSA were estimated using the following formula:37,38
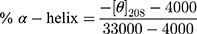
where [θ]208 is the value of mean residue ellipticity at 208 nm.
Cell Culture and Treatment
Human normal aortic endothelial cells (EC) were purchased from CHI Scientific Inc. (MA, USA) and cultured following the manufacturer’s instructions. Cells were grown in Dulbecco’s Modified Eagle Medium:Nutrient Mixture F-12 (DMEM/F12) supplemented with 10% fetal bovine serum (FBS, Gibco BRL, NE, USA), 10% endothelial cell growth supplement (ScienCell, USA), 20 ng/mL recombinant human vascular endothelial growth factor (Novoprotein, China), 50 IU/mL penicillin, and 50 mg/mL streptomycin (Invitrogen, NM, USA) at 37°C in a humidified 5% CO2 atmosphere. Human umbilical vein endothelial cells (PUMC-HUVEC-T1/HUVEC, National Infrastructure of Cell Line Resource, China) were cultured in DMEM with 10% FBS, 50 IU/mL penicillin, and 50 mg/mL streptomycin.
Before treatment, cells were seeded in 12-well plates or culture dishes (Corning, USA) and grown in DMEM/F12 with 10% FBS to confluency. For gene knockdown, at 48 h before the experiment, transfection of LDL receptor siRNA or negative control siRNA (Guangzhou RiboBio Co., China) was carried out on 50% confluent HUVEC cells using a final concentration of 50 nM and lipofectamine 2000 transfection reagent (Thermo Fisher Scientific) according to the manufacturer’s instructions. The day of experiment cells were washed three times in PBS and the medium was replaced with DMEM/F12 without FBS. For the uptake assay, the cells were further exposed to magnetosomes (10 μg/mL Fe concentration) with or without protein corona at 37°C for 3–5 h. For the microscopy and colocalization assays, cells were treated with magnetosomes (20 μg/mL Fe concentration) with or without protein corona at 37°C for 5 h.
Cell Uptake Assay
Following the incubation step, the cells were washed five times with PBS, collected by trypsinization and then washed with PBS once more. These wash steps removed excess magnetosomes. Cells were lysed by sonication and boiled in a buffer containing 6 M guanidine hydrochloride and 50 mM Tris. After centrifugation, the supernatant was collected for a total protein analysis using the Enhanced BCA Protein Assay Kit (Beyotime Biotechnology, China). The debris containing magnetosomes was dissolved in 10 μL hydrochloric acid to obtain a completely clear and transparent solution. Subsequently, the amount of Fe in the solution was determined by o-phenanthroline spectrophotometry. Cellular magnetosome doses (Fe amount) were calculated by normalizing to protein levels.
In order to visualize uptake, the cells utilized for imaging were washed five times with PBS, fixed with 4% paraformaldehyde for 15 min, and then stained with Prussian Blue Iron Stain Kit (with Nuclear Fast Red solution) (Leagene Biotechnology, China) and imaged using OLYMPUS IX-71 microscopy (Japan).
Microscopy and Colocalization Assays
Rabbit polyclonal antibodies to magnetosomes were prepared by the Bioss Company (Beijing, China) (Figure S1). After treatment, the cells were gently washed with PBS and then fixed with 4% paraformaldehyde for 20 min. The cells were then permeabilized with 0.5% Triton X-100 for 20 min and blocked with 10% bovine serum albumin (BSA) in PBST. Samples were incubated overnight at 4°C with a mouse anti-low density lipoprotein (LDL) receptor antibody (Proteintech, USA) and rabbit anti-magnetosomes antibody containing 1% BSA in PBST. Cells were then washed three times with PBST and incubated for 1 h at room temperature with either a TRITC-goat anti-rabbit antibody or a FITC-goat anti-mouse antibody (Southern Biotech, USA). Cells were stained with DAPI (Macgene, China) before being imaged using a Zeiss LSM710 inverted confocal microscope (Zeiss, Germany).
Statistical Analysis
Significance was evaluated with a one-way ANOVA, and p < 0.05 was considered statistically significant. Data were expressed as mean ± standard deviation (SD) of at least three independent experiments.
Results
Protein Corona Formation
Magnetosomes were isolated from M. gryphiswaldense and the remaining supernatants were assessed by A260 and A280 (Figure S2A) to ensure there was no excess bacterial proteins or nucleic acids on the membrane except for intrinsic membrane proteins. The purified magnetosomes were found to be enveloped by membranes (Figure S2B and C), with a size of about 40 nm as determined by TEM. In comparison, the PEG-Fe3O4 nanoparticles had a size of about 30 nm (Figure 1A). The magnetosomes and the PEG-Fe3O4 nanoparticles were incubated with human plasma and then separated from excess plasma using DynaMag™-2 magnet. The zeta potential of the magnetosomes and PEG-Fe3O4 nanoparticles were then determined (Table 1). Compared to the uncoated nanoparticles, the plasma coated PEG-Fe3O4 nanoparticles showed a reduction in surface potential. Notably, plasma incubation did not cause an obvious shift in the zeta potential of the magnetosomes. Protein levels on the nanoparticles (containing equal Fe amounts) were measured by BCA assay, and it was found that there were less corona proteins extracted from the magnetosome surface than for the PEG-Fe3O4 nanoparticle surface (Table S1). Furthermore, SDS-PAGE was performed to confirm the formation of a protein corona and also to provide an overview of the adsorbed proteins. The main protein bands were very similar between the magnetosome and PEG-Fe3O4 nanoparticle coronas, suggesting a similar composition for the corona proteins on the two nanoparticles. The distribution of protein bands in both nanoparticles differed from total human plasma proteins suggesting there is selective protein adsorption upon corona formation (Figure 1B).
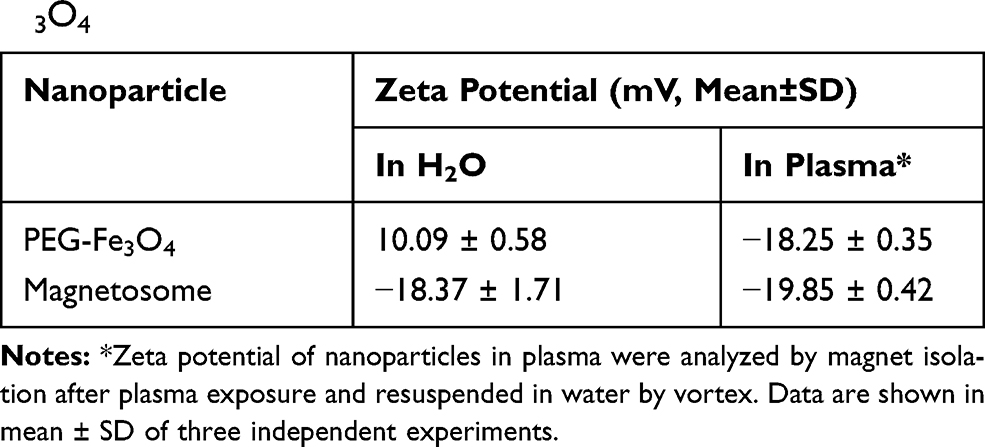 |
Table 1 Zeta Potential Characterization of Magnetosome and PEG-Fe3O4 |
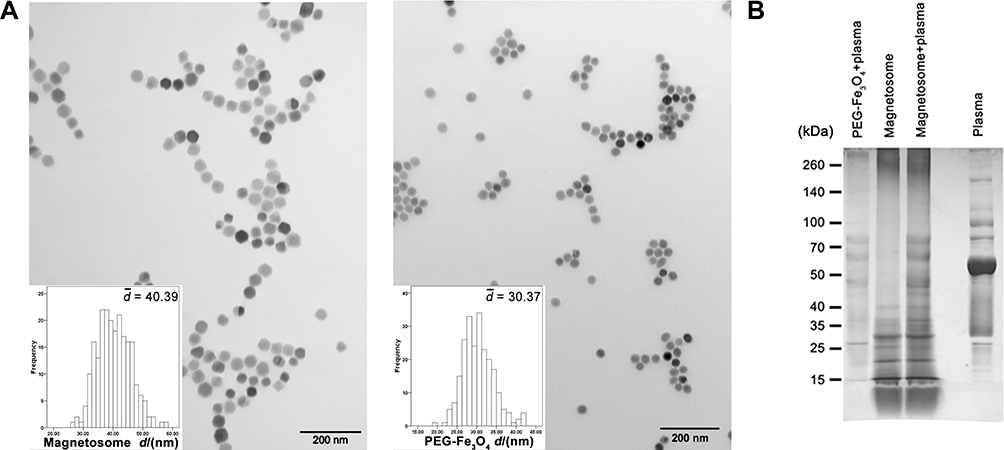 |
Figure 1 Characterization of magnetosome and PEG-Fe3O4. (A) TEM images of typical magnetosome and PEG-Fe3O4 particles. Scale bars, 200 nm. (B) SDS-PAGE image of plasma corona proteins on particles. |
To identify and quantify the composition of the corona proteins, digested protein samples were analyzed by label free protein quantitation using LC-MS/MS. Several filter steps were implemented to obtain the final protein list (Figure 2 and sample preparation in the Materials and Methods). In total, 258 unique proteins were identified, of which 203 were suitable for relative quantification (Table S2). As mentioned above, the corona proteins extracted from the magnetosome surface were less abundant than those on the PEG-Fe3O4 nanoparticle surface. However, the magnetosome intrinsic membrane proteins also had intensities in the LC-MS/MS. Hence, we did not compare the quantitative differences in corona proteins between magnetosomes and PEG-Fe3O4 nanoparticles and the iBAQ intensities32 of 203 identified human proteins (184 in magnetosome and 192 in PEG-Fe3O4) were chosen for the following analysis for each material. As depicted in Figure 2, the MS results showed a high Pearson correlation between two biological replicates, indicating our experiments are highly reproducible. Among the 203 proteins, 173 were shared between the magnetosome and PEG-Fe3O4 nanoparticle coronas (Figure 2). It is well established that the dynamic range of plasma proteins concentration ranges from 10−9 to 101 mg/mL (Figure 3C).36 Compared with whole plasma proteins, many corona proteins had relatively high concentrations in plasma, especially the abundant corona proteins (Figure 3A). However, it should be noted that protein abundance in the corona (Av. iBAQ shown in gradient color) did not correlate with their amounts in plasma (Figure 3 and Figure S3). Table 2 shows the 20 most abundant plasma proteins adhering on the materials surface after 1 h treatment, with 13 out of 20 proteins being shared between the two nanoparticle types (Figure 3D). The top 20 abundant proteins accounted for 75% of the total protein amounts in the magnetosome corona, and for 68% in PEG-Fe3O4 nanoparticle corona. Although the composition of the abundant corona proteins appeared to be similar, the relative abundance of proteins were obviously different between the two nanoparticles (Figure 3E). For example, apolipoprotein E (ApoE), vitronectin (VTN), and serum albumin (HSA) were the top three most abundant corona proteins on the magnetosomes with relative abundances of 9.6%, 8.9%, and 8.86%, respectively, whereas in the PEG-Fe3O4 corona, VTN and HSA were not present in the top 20 most abundant corona proteins and the relative abundance of ApoE was 4.18%, which was less than on the magnetosome surface.
 |
Table 2 Top 20 Most Abundant Plasma Proteins Adsorbed on Magnetosomes and PEG-Fe3O4 Identified by LC-MS/MS |
 |
Figure 2 Overview of identified corona proteins postprocessing. |
 |
Figure 3 Protein plasma concentrations as well as iBAQ intensities of corona proteins identified by LC-MS/MS. Identified magnetosome corona proteins (A) and the most 20 abundant corona proteins (B) iBAQ intensities and relative concentrations in plasma. (C) Plasma protein concentrations from Plasma Proteome Database (PPD).36 Y-axis represents different proteins and x-axis is different concentrations observed for each protein. As in PPD, one protein usually has several concentrations. Intensities in log 2 scales are indicated by different colors. (D) Overlaps of proteins identifications from magnetosome or PEG-Fe3O4 incubated with plasma by LC-MS/MS. Venn plot shows the most 20 abundant corona proteins and top 20 abundant plasma proteins. (E) Comparison of the top 20 abundant proteins (in gene names) relative abundance in the magnetosome and PEG-Fe3O4 corona. |
Characterization of the Top 20 Most Adsorbed Plasma Proteins
As mentioned above the most abundant corona proteins constituted the majority of the corona components, hence the contribution of the protein corona can be approximately evaluated by these proteins.39,40 Abundant corona proteins were classified according to their predicted isoelectric point (pI), molecular weight (MW), GRAVY, and amino acid composition over their relative abundances. The top 20 most abundant plasma proteins (Table S3) were similarly evaluated to provide a comparison.36,41 As shown in Figure 4, the distribution of values were obviously different between the two nanoparticles and plasma. In plasma, 50% of abundant proteins were in a pI range of 5–6, 40% in a MW range of 60–70 kDa, and 54% in a GRAVY range of −0.5 to −0.3. In contrast, the abundant corona proteins in the two nanoparticles did not have a MW distribution similar to that found for abundant plasma proteins. Furthermore, 40% of the abundant corona proteins associated with magnetosomes had a pI range from 5 to 6, whereas only 25% of PEG-Fe3O4 nanoparticle abundant corona proteins were in the same pI range. Hydrophilic proteins (GRAVY: −0.7 to −0.5) were preferentially bound by magnetosomes, whereas PEG-Fe3O4 nanoparticles preferred relatively hydrophobic proteins (GRAVY: −0.2 to 0). An amino acid composition analysis also showed that magnetosome corona proteins contained higher levels of arginine and glutamine, whereas lysine, valine and threonine were more abundant in plasma proteins (Figure 4D).
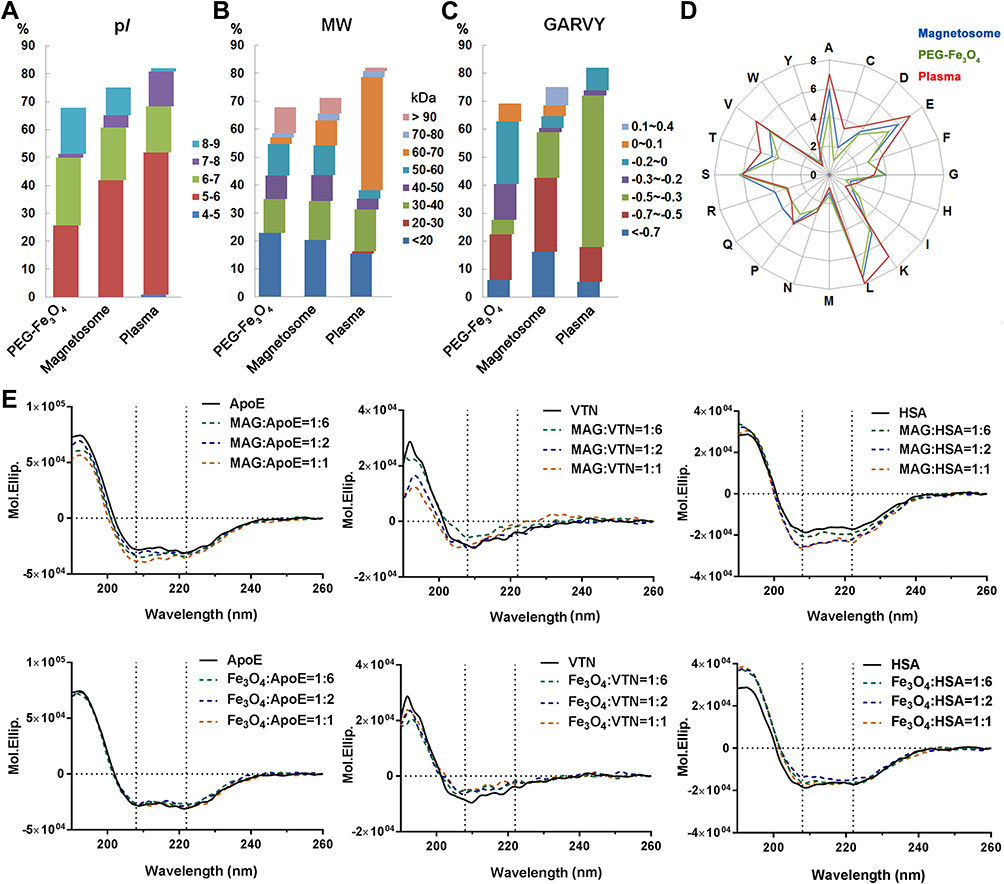 |
Figure 4 Characterization of the top 20 abundant plasma proteins identified on magnetosomes by LC-MS/MS. Classifications according to their isoelectric point (pI) (A), molecular weight (MW) (B) or GRAVY values (C). Amino acid compositions are shown in (D). (E) CD spectra of top three magnetosome corona proteins alone (0.02 mg/mL, black line) or in the presence of magnetosome (MAG) or PEG-Fe3O4 (Fe3O4) with different concentrations (0.02, 0.01 and 0.0033 mg/mL Fe concentration, represented by yellow, blue and green dashed lines, respectively). Spectra are shown in mean residue molar ellipticity (Mol.Ellip.). Black dashed lines correspond to spectral peaks at 208 and 222 nm (principle α-helix peak). |
ApoE, VTN, and HSA were the three most abundant corona proteins associated with the surface of magnetosomes. Their adsorption was confirmed by a Western blot analysis (Figure S4). We hypothesized from the relative protein abundance that since magnetosomes preferentially adsorb these three proteins, there may be some differences between the two nanoparticles upon binding. CD is a powerful analytical tool that can be used to evaluate protein conformational changes in solution or adsorbed onto other molecules. To obtain a further understanding of protein-nanoparticle binding, we used CD spectroscopy to analyze the structures of these purified proteins following incubation with magnetosomes and PEG-Fe3O4 nanoparticles. The spectra were obtained over the wavelength range of 190 to 260 nm, and typical CD spectra for ApoE, HSA, and VTN in the presence and absence of the nanoparticles are shown in Figure 4E and the calculated percentage α-helix content is shown in Table S4. The CD values for ApoE showed little change but progressively shifted to a more positive mean residue ellipticity (Mol.Ellip.) value for VTN and HSA in the presence of PEG-Fe3O4 nanoparticles. In comparison, incubation with magnetosomes resulted in more negative Mol.Ellip. values at 208 nm and 222 nm (principle α-helix peaks) for ApoE and HSA. For VTN, the values increased slightly at 208 nm and 222 nm and markedly decreased around 190 nm. These different spectra indicate that magnetosomes affect the conformation of proteins to a much greater degree, suggesting that the magnetosome membrane has an important impact on protein selection and binding during surface adsorption.
Collectively, our analyses demonstrate that the formation of plasma corona on the natural magnetosomes is selectively and that adsorption can be distinguished from that seen with the synthetic PEG-Fe3O4 nanoparticles.
Prediction of Downstream Biological Interactions
To provide functional information about the magnetosome corona we performed a GO molecular function enrichment on the abundant proteins. The result revealed that most of them have a signaling receptor binding function (Figure 5A and Table S5). Signaling receptors are localized on the plasma membrane, which means these corona proteins may mediate an interaction between magnetosomes and cells. To further understand the potential receptors associated with magnetosome coronas, proteins with a relative abundance threshold of 2% were chosen and their protein–protein interaction data were downloaded and combined using Cytoscape (see Materials and methods). The interacting proteins were filtered by GO annotation to include proteins only with receptor activity and plasma membrane localization (Figure 5B). We also created a list of proteins with only an extracellular matrix (ECM) annotation (Figure S5), as these proteins may also help the magnetosome-corona complex attach to cells.
 |
Figure 5 Bioinformatics analysis of magnetosome-corona protein. (A) GO molecular function enrichment of the top 20 abundant proteins. (p < 0.05) Each protein was represented by a certain gene name; surrounding color shows the relative abundance. Details are given in Table S4. (B) Corona protein-interaction network. Interacted receptors with membrane location were obtained from BioGRID, IMEx, IntAct, MINT and UniProt databases. Abundant corona proteins are colored by their relative abundance. |
More than 60 receptors and 13 ECM proteins were grouped by the corona proteins, and these proteins may participate in the interaction between magnetosomes and cells, especially receptors involved in receptor-mediated endocytosis such as the low-density lipoprotein (LDL) receptor family.42 With the quantitative composition of the magnetosome corona (Table 2), we could now predict the effects of the protein corona on cellular contact. ApoE may have a prominent role in the cellular uptake of magnetosomes from the blood circulation because ApoE is the most abundant protein found in the magnetosome corona and its receptors are LDL receptor family members which are widely expressed in vascular endothelial cells, lymphocytes, monocytes, macrophages, arterial wall smooth muscle cells, liver, and adrenal cortical cells.42
Enhanced Endothelial Cellular Uptake of Magnetosomes by the Protein Corona
To study the effect of the corona on the cellular uptake of magnetosomes, we assessed the ability of human vascular endothelial cells (EC and HUVEC) to internalize the magnetosomes in the presence or absence of a plasma corona. Cells were treated with particles for 3 h, and then internalization was assessed by imaging using a microscope and cellular Fe levels were calculated. The iron ion can react with Prussian blue and appear blue, so that the magnetosomes are stained as blue dots, as shown in Figure 6A and Figure S6. After a 3 h incubation and several wash steps, pristine magnetosomes were barely observable in both cell types. In contrast, blue-stained magnetosomes were clearly visible both at the cell surface and intracellularly and the Fe amount was significantly elevated following incubation of the cells with magnetosomes possessing a corona. It is therefore likely that the corona enhances cellular binding and uptake by interacting with the ECM or receptors on the cell membrane. Notably, both of cells type are LDL receptor-positive, and after subtracting the background level of cellular Fe, a quantitative analysis showed that HUVEC showed increase in Fe uptake when treated with magnetosomes with or without a corona compared to EC. To a certain extent, this is in line with the HUVECs expressing higher levels of the LDL receptor (Figure S7). We also measured the cellular uptake of magnetosome with or without corona in LDL receptor knockdown HUVEC cells. As shown in Figure S7C, the amount of LDL receptor was significantly decreased after siRNA treatment for 48 h. When the magnetosomes with or without a corona were added, LDL receptor knockdown did not affect bare magnetosomes uptake. Compared with it, the Fe amount slightly decreased in LDL receptor knockdown cells after treated with magnetosomes with a corona.
 |
Figure 6 Internalization of magnetosome-corona complexes by EC cells. (A) Enhancement of magnetosome cell uptake in the presence of protein corona. Prussian blue staining and intracellular iron concentrations of EC cells (control) incubated with magnetosomes (10 μg/mL Fe concentration) with or without corona for 3 h. Scale bars 20 μm. **p<0.01 (B) Confocal images of EC cells treated with magnetosomes (20 μg/mL Fe concentration) with or without corona for 5 h. Large colocalization of LDL receptors (green) and magnetosomes (red) signals were found in the presence of corona. Scale bars 10 μm. |
Based on these data, we hypothesized that the most abundant corona protein on the magnetosomes, namely ApoE, may be responsible for the protein-dependent binding and uptake of the magnetosome corona complex through LDL receptor-mediated endocytosis. Next, we investigated whether the LDL receptor plays a role in the internalization of corona coated magnetosomes. Using longer incubation times and a higher concentration of magnetosomes we performed further cell uptake studies using magnetosomes with or without a corona. The localization of magnetosomes (red) and LDL receptor (green) was determined by immunofluorescence using a confocal microscope. If our hypothesis was correct, colocalization of the red and green signals should give rise to a yellow or orange color. As shown in Figure 6B and Figure S8, in the presence of the plasma corona, the red labeled magnetosome-corona complexes were indeed largely colocalized with the green signal, strongly suggesting that the corona coated magnetosomes are strongly colocalized with LDL receptor-positive vesicles. In comparison, pristine magnetosomes showed little colocalization, as the red color did not show clear colocalization with LDL receptor (green).
Discussion
Nanoparticles used in any biological application are exposed to a complex mixture of extracellular proteins that form a protein corona on the nanoparticle surface.37 This is especially true when nanoparticles are directly injected into the blood circulation since human plasma contains thousand proteins whose abundance varies by 12 orders of magnitude.20,39,43 The adsorbed protein layer influences the particle’s surface physicochemical properties,29,39 may affect its trafficking,40 and mediates its subsequent interactions with cells.37,44 A common strategy to reduce corona formation is by covering the surface with moieties such as polyethylene glycol (PEG). The molecular mechanism underlying the protein resistance of grafted with PEG are still not fully understood,45 but a brush-induced steric repulsion preventing contact between proteins and the underlying surface, or the hydration shell surrounding PEG moieties, which suppresses adsorption of proteins, are considered as the two dominating mechanisms.46 However, complete inhibition of corona formation remains a challenge,47 as PEG chains on a nanoparticle’s surface function as a water-binding hydrogel-like brush, with protein-resistant properties that are highly dependent on the length, flexibility, and density of the PEG chains.45 A recent class of nanoparticles has been fabricated by combining synthetic cores with a biologically derived membrane coating, including those derived from red blood cells (RBCs), platelets, white blood cells, cancer cells, and bacteria, has attracted attention.48 Some of these cell-membrane-coated nanoparticles have a significant increase in their circulatory half-life,48,49 or have the ability to better target a region of interest.50 Each of these biomimetic nanoparticles has its own set of unique characteristics that are derived from the versatility and complexity of the cellular membrane used in their synthesis.51,52 As a consequence, these biomimetic nanoparticles with natural surface properties are very different from synthetic nanoparticles that have a chemically modified surface, as the interface of biomimetic nanoparticles and biological systems that exist within the body is biocompatible including natural protein–protein interactions. Magnetosomes are biogenic magnetic nanomaterials, which are synthesized by magnetic bacteria and consists of a magnetic iron mineral enclosed within a membrane vesicle.53 Magnetosomes are therefore membrane-coated nanoparticles that have natural surface properties similar to biomimetic nanoparticles. It has been demonstrated that magnetosomes are protein-rich membrane organelles53 so the interaction between magnetosomes and plasma occurs through natural protein–protein interactions. Previous research has shown that engineered nanoparticles with different surface chemical modifications prefer to adsorb different types of plasma proteins,29,54-56 even if they are covered by PEG.47,57,58 The question arises as to what will happen when magnetosomes enter living systems? Since blood will be the environment that the magnetosomes encounter first after intravenous administration, will there be protein corona formation or some specific plasma protein binding to the natural protein-rich membrane organelles?
In the present study, we investigated the interaction between magnetosomes and human plasma. Although magnetosomes had lower plasma protein binding than PEG-Fe3O4 nanoparticles (Table S1) probably due to the protein-rich membrane prevented large amount of plasma protein’s adsorption, incubation with plasma still resulted in the formation of a protein corona as demonstrated by SDS-PAGE (Figure 1). Unlike PEG-Fe3O4 nanoparticles, pristine magnetosomes are negatively charged due to the presence of their protein-rich membrane, and most corona proteins are acidic proteins (pI < 7) which show negatively charge in plasma (Figure 4A). Both membrane and corona are constituted by negatively charged proteins. This is may be the reason why the interaction with additional plasma proteins did not cause a significant change in the surface zeta potential (Table 1). The composition of the magnetosome corona was determined by a high throughput LC-MS/MS analysis. To quantify the magnetosome corona proteins, we used the iBAQ algorithm (Table S2), which divides the sum of all precursor-peptide intensities by the number of theoretically observable peptides.59,60 By comparing highly abundant corona proteins with high-abundance plasma proteins (Figure 4), we could clearly see that the magnetosome prefers to adsorb certain plasma proteins (such as ApoE, VTN, and HSA), which allows for the formation of a distinctive corona. Notably, the magnetosome membranes were remained following the isolation and purification procedures (Figure S2B–D), which means the iron core is well protected and is not exposed to plasma. Hence the adsorption was predominantly meditated by the magnetosome membranes. Human ApoE and HSA are well-known helix-rich globular proteins,61,62 and both were found to be abundant corona proteins on the magnetosome. The CD spectra of ApoE and HSA showed a slight increase in the percentage of α-helix (Table S4), indicating that the structures of these proteins change or become more stable when interacting with magnetosomes. The greater increase in α-helix content in the presence of a higher magnetosome concentration can probably be attributed to greater protein binding to the surface. Helix transitions induced by anionic gold, silica, and polystyrene nanoparticles have been described for peptides carrying designed heptad repeats,63 intrinsically disordered proteins (α-casein and α-synuclein),64 and bovine serum albumin,37 respectively. Previous studies have also shown that ApoE has a lipid-binding function, and the interaction with lipids induces a change in the conformation of the amino-terminal domain leading to alterations in function; for example, opening of the amino-terminal four-helix bundle in ApoE upon lipid binding is associated with enhanced receptor-binding activity.65,66 HSA, the main protein present in plasma, has a good binding capacity for many substances, including ions, drugs, exogenous proteins,67,68 and can function as a stabilizer. Since the magnetosome membrane contains lipids as well as proteins, we propose that during incubation, protein binding may be mediated by intrinsic membrane proteins through protein–protein interactions or by the interaction with membrane lipids that will induce conformational changes in the binding proteins. In comparison, there is a little loss of HSA α-helicity, likely partially denatured in the presence of PEG-Fe3O4. Experiments using a variety of nanoparticle surfaces and examining protein adsorption indicate that perturbation of protein structure can occur, usually leading to a decrease in α-helicity.37,69,70 Although PEG modification can reduce this effect,58 as mentioned previously, it is highly dependent on the length, flexibility, and density of the PEG chains on the surface, which means the protein adsorption and perturbation of protein structure on the PEG-Fe3O4 nanoparticle may cause by the exposure of the inner iron core. Unlike ApoE and HSA, it is more complicated for VTN, which lacks a three-dimensional structure. From a SWISS-MODEL prediction, VTN appears to be a low α-helix protein and has a more flexible structure71 (data not shown), thus VTN may easily undergo expansion upon adsorption to the surface of both magnetosomes and PEG-Fe3O4 nanoparticles. According to our result, ApoE, HSA, and VTN are the top three abundant corona proteins found in magnetosomes (Table 2), we speculate from the CD spectra that magnetosomes show a higher adsorption capacity for these proteins and the direct interaction occurs on the membrane interface induces a significant conformational change. However, the relative abundant of ApoE, HSA and VTN on PEG-Fe3O4 nanoparticles are much lower and they are not the most preferred corona proteins on PEG-Fe3O4, so the conformational changes are less compared to the magnetosome.
The effect of protein corona formation on the cellular uptake of nanoparticles has been addressed in detail in numerous studies which suggest that the presence of the corona does indeed alter the cellular response through enhancing or decreasing cellular uptake.20,23,37,47,58,72 Hence it is also need to exploit the effect of the magnetosomes corona on cell. All of these findings help us to understand the physiological response to magnetosomes. Combining an interaction database filter and GO annotation, we noticed that magnetosome’s abundant corona components had numerous cell membrane or extracellular matrix binding targets (Figure 5). Among these proteins, ApoE, as the most abundant corona protein, is recognized by the LDL receptor family and functions as one of the major determinants in lipid transport, and plays a critical role in atherosclerosis and other diseases.61 LDL receptors are widely expressed in vascular endothelial cells, lymphocytes, monocytes, macrophages, arterial wall smooth muscle cells, liver, and adrenal cortical cells, and participate in receptor-mediated membrane endocytosis (clathrin-mediated).42 This most likely indicates that the corona, when in the presence of ApoE, may affect the magnetosome uptake process in these cells. Thus, we examined the effect of the plasma corona on the interaction with human vascular endothelial cells that express the LDL receptor. As a result, the corona significantly increased the interaction between the magnetosome-protein complexes and cells compared to the interaction seen with pristine magnetosomes (Figure 6, Figure S6). Moreover, cell reduced the magnetosome-protein complexes uptake when LDL receptor was knockdown (Figure S7). Confocal imaging also showed that pristine magnetosomes do not bind to the LDL receptor when being internalized. In contrast, in the presence of the protein corona, the magnetosome corona complex strongly colocalized with LDL receptor-positive vesicles (Figure 6 and Figure S8). From these data, we propose that receptors contribute to the cellular uptake of magnetosomes when a protein corona is present on the magnetosome surface. However, it is also important to note that pristine magnetosomes are internalized by both cells and LDL receptor knockdown decreased part of magnetosome-protein complexes uptake. In keeping with this, recent reports have shown that the internalization of magnetosomes is mediated by multiple endocytic pathways, such as macropinocytosis and clathrin-mediated endocytosis,73 indicating that we cannot exclude other ways for cellular uptake magnetosomes besides the LDL receptor. Moreover, based on our hypothesis, there are many other corona proteins that have cell surface receptors, and these proteins may also play a role in the cellular uptake process, particularly in cells overexpressing their receptors, although this requires further experiments to verify. Some reports have suggested that downstream biological process prediction based on the abundant proteins found in a corona are not always effective. For example, target binding is also dependent on accessibility, conformation, and orientation in the corona layer.72,74 These findings are usually based on synthetic nanoparticles with a chemically modified surface and we assume that the adsorption of plasma proteins to these surfaces is more complicated with nonspecific direction of adsorbed proteins. However, biologically derived membrane coated with native protein-protein binding allows for more specific interactions. Even though it is unclear the mechanism underlying protein corona formation around magnetosomes such as which part of the magnetosomes mediate plasma protein binding, even the structures of magnetosomes membrane and the protein layers are still unclear and further detailed studies are necessary to address these questions. Corona proteomics and bioinformatics predictions provide clues to study the interaction of magnetosomes and biosystems.
Conclusions
Collectively, the formation of a protein corona on various synthetic nanomaterials has been shown to strongly depend on numerous factors, such as surface curvature, charge, coating, and the properties of the proteins themselves. Adsorption to a nanoparticle may affect protein structure which could lead to partial denaturation. The structure of long macromolecular chains on the nanoparticle surface may also alter the interaction between the nanoparticle and cells. All of these factors create difficulties in predicting the downstream effects of a nanoparticle’s corona. Magnetosomes are biogenic magnetic nanomaterials that are enclosed within a protein-rich membrane and have an interface with biosystems that are completely natural. In this study, we demonstrated the existence of an interaction between magnetosomes and human plasma, revealing that a protein corona can also form on a natural surface. A quantitative analysis of the composition of the protein corona showed that the magnetosome preferentially binds several plasma proteins and that this interaction can alter the cellular uptake of the magnetosomes. Cellular uptake involves an interaction between the most abundant corona proteins’ receptor and the endocytic machinery of the target cell. In addition to this, our bioinformatic prediction of the protein corona provides an insight for understanding the interaction between magnetosomes and biosystems. We anticipate that this work will provide an impetus for studies addressing the physiological response to magnetosomes.
Acknowledgments
We thank China Agricultural University and University of Science & Technology Beijing for transmission electron microscopy measurement. This work is financially supported by the National Natural Science Foundation of China (grant nos. 31700726 and 31600814) and the Key Laboratory of Biomedical Effects of Nanomaterials and Nanosafety, CAS (No. NSKF201810). We would like to thank Editage (www.editage.cn) for English language editing.
Disclosure
The authors report no conflicts of interest in this work.
References
1. Gorby YA, Beveridge TJ, Blakemore RP. Characterization of the bacterial magnetosome membrane. J Bacteriol. 1988;170(2):834–841. doi:10.1128/JB.170.2.834-841.1988
2. Ullrich S, Kube M, Schübbe S, Reinhardt R, Schüler D. A hypervariable 130-kilobase genomic region of Magnetospirillum gryphiswaldense comprises a magnetosome Island which undergoes frequent rearrangements during stationary growth. J Bacteriol. 2005;187(21):7176–7184. doi:10.1128/JB.187.21.7176-7184.2005
3. Bazylinski DA, Lefèvre CT, Lower BH. Magnetotactic bacteria, magnetosomes, and nanotechnology. In: Barton LL, Bazylinski DA, Xu H, editors. Nanomicrobiology: Physiological and Environmental Characteristics. New York (NY): Springer; 2014:39–74.
4. Matsunaga T, Arakaki A. Molecular bioengineering of bacterial magnetic particles for biotechnological applications. In: Schüler D, editor. Magnetoreception and Magnetosomes in Bacteria. Berlin, Heidelberg: Springer; 2007:227–254.
5. Komeili A. Cell biology of magnetosome formation. In: Schüler D, editor. Magnetoreception and Magnetosomes in Bacteria. Berlin, Heidelberg: Springer; 2007:163–174.
6. Uebe R, Schüler D. Magnetosome biogenesis in magnetotactic bacteria. Nat Rev Microbiol. 2016;14:621. doi:10.1038/nrmicro.2016.99
7. Vargas G, Cypriano J, Correa T, Leão P, Bazylinski DA, Abreu F. Applications of magnetotactic bacteria, magnetosomes and magnetosome crystals in biotechnology and nanotechnology: mini-review. Molecules. 2018;23(10):2438. doi:10.3390/molecules23102438
8. Long R-M, Dai Q-L, Zhou X, et al. Bacterial magnetosomes-based nanocarriers for co-delivery of cancer therapeutics in vitro. Int J Nanomed. 2018;13:8269–8279. doi:10.2147/IJN
9. Dai Q, Long R, Wang S, et al. Bacterial magnetosomes as an efficient gene delivery platform for cancer theranostics. Microb Cell Fact. 2017;16(1):216. doi:10.1186/s12934-017-0830-6
10. Tomoko Y, Yoshiaki M, Tadashi M. Bioengineering of bacterial magnetic particles and their applications in biotechnology. Recent Pat Biotechnol. 2010;4(3):214–225. doi:10.2174/187220810793611455
11. Faivre D, Zuddas P. Mineralogical and isotopic properties of biogenic nanocrystalline magnetite. In: Schüler D, editor. Magnetoreception and Magnetosomes in Bacteria. Berlin, Heidelberg: Springer; 2007:175–196.
12. Lang C, Schüler D. Biogenic nanoparticles: production, characterization, and application of bacterial magnetosomes. J Phys Condens Matter. 2006;18(38):S2815–S2828.
13. Le Fèvre R, Durand-Dubief M, Chebbi I, et al. Enhanced antitumor efficacy of biocompatible magnetosomes for the magnetic hyperthermia treatment of glioblastoma. Theranostics. 2017;7(18):4618–4631. doi:10.7150/thno.18927
14. Jacob JJ, Suthindhiran K. Magnetotactic bacteria and magnetosomes – scope and challenges. Mater Sci Eng C. 2016;68:919–928. doi:10.1016/j.msec.2016.07.049
15. Sun J, Tang T, Duan J, et al. Biocompatibility of bacterial magnetosomes: acute toxicity, immunotoxicity and cytotoxicity. Nanotoxicology. 2010;4(3):271–283. doi:10.3109/17435391003690531
16. Raguraman V, Suthindhiran K. Comparative ecotoxicity assessment of magnetosomes and magnetite nanoparticles. Int J Environ Health Res. 2019;30:1–13.
17. Revathy T, Jayasri MA, Suthindhiran K. Toxicity assessment of magnetosomes in different models. 3 Biotech. 2017;7(2):126. doi:10.1007/s13205-017-0780-z
18. Qi L, Lv X, Zhang T, et al. Cytotoxicity and genotoxicity of bacterial magnetosomes against human retinal pigment epithelium cells. Sci Rep. 2016;6:26961. doi:10.1038/srep26961
19. Lynch I, Cedervall T, Lundqvist M, Cabaleiro-Lago C, Linse S, Dawson KA. The nanoparticle - protein complex as a biological entity; a complex fluids and surface science challenge for the 21st century. Adv Colloid Interfac. 2007;134-35:167–174. doi:10.1016/j.cis.2007.04.021
20. Treuel L, Docter D, Maskos M, Stauber RH. Protein corona - from molecular adsorption to physiological complexity. Beilstein J Nanotechnol. 2015;6:857–873. doi:10.3762/bjnano.6.88
21. Zyuzin MV, Yan Y, Hartmann R, et al. Role of the protein corona derived from human plasma in cellular interactions between nanoporous human serum albumin particles and endothelial cells. Bioconjug Chem. 2017;28(8):2062–2068. doi:10.1021/acs.bioconjchem.7b00231
22. Monopoli MP, Aberg C, Salvati A, Dawson KA. Biomolecular coronas provide the biological identity of nanosized materials. Nat Nanotechnol. 2012;7(12):779–786. doi:10.1038/nnano.2012.207
23. Caracciolo G, Cardarelli F, Pozzi D, et al. Selective targeting capability acquired with a protein corona adsorbed on the surface of 1,2-dioleoyl-3-trimethylammonium propane/DNA nanoparticles. ACS Appl Mater Interfaces. 2013;5(24):13171–13179. doi:10.1021/am404171h
24. Zhang Z, Wang C, Zha Y, et al. Corona-directed nucleic acid delivery into hepatic stellate cells for liver fibrosis therapy. ACS Nano. 2015;9(3):2405–2419. doi:10.1021/nn505166x
25. Sun J-B, Zhao F, Tang T, et al. High-yield growth and magnetosome formation by Magnetospirillum gryphiswaldense MSR-1 in an oxygen-controlled fermentor supplied solely with air. Appl Microbiol Biotechnol. 2008;79(3):389. doi:10.1007/s00253-008-1453-y
26. Xiang Z, Yang X, Xu J, et al. Tumor detection using magnetosome nanoparticles functionalized with a newly screened EGFR/HER2 targeting peptide. Biomaterials. 2017;115:53–64. doi:10.1016/j.biomaterials.2016.11.022
27. Agustina E, Goak J, Lee S, Seo Y, Park J-Y, Lee N. Simple and precise quantification of iron catalyst content in carbon nanotubes using UV/visible spectroscopy. ChemistryOpen. 2015;4(5):613–619. doi:10.1002/open.v4.5
28. Wu T, Ding X, Su B, Soodeen-Lalloo AK, Zhang L, Shi JY. Magnetic resonance imaging of tumor angiogenesis using dual-targeting RGD10-NGR9 ultrasmall superparamagnetic iron oxide nanoparticles. Clin Transl Oncol. 2018;20(5):599–606. doi:10.1007/s12094-017-1753-8
29. Lai W, Wang Q, Li L, Hu Z, Chen J, Fang Q. Interaction of gold and silver nanoparticles with human plasma: analysis of protein corona reveals specific binding patterns. Colloids Surf B. 2017;152:317–325. doi:10.1016/j.colsurfb.2017.01.037
30. Lundqvist M, Stigler J, Elia G, Lynch I, Cedervall T, Dawson KA. Nanoparticle size and surface properties determine the protein corona with possible implications for biological impacts. Proc Natl Acad Sci U S A. 2008;105(38):14265–14270. doi:10.1073/pnas.0805135105
31. McDonald WH, Ohi R, Miyamoto DT, Mitchison TJ, Yates Iii JR. Comparison of three directly coupled HPLC MS/MS strategies for identification of proteins from complex mixtures: single-dimension LC-MS/MS, 2-phase MudPIT, and 3-phase MudPIT. Int J Mass Spectrom. 2002;219(1):245–251. doi:10.1016/S1387-3806(02)00563-8
32. Cox J, Hein MY, Luber CA, Paron I, Nagaraj N, Mann M. Accurate proteome-wide label-free quantification by delayed normalization and maximal peptide ratio extraction, termed MaxLFQ. Mol Cell Proteomics. 2014;13(9):2513–2526. doi:10.1074/mcp.M113.031591
33. Team RDC. R: A Language and Environment for Statistical Computing. Vienna, Austria; 2010.
34. Shannon P, Markiel A, Ozier O, et al. Cytoscape: a software environment for integrated models of biomolecular interaction networks. Genome Res. 2003;13(11):2498–2504. doi:10.1101/gr.1239303
35. Bindea G, Mlecnik B, Hackl H, et al. ClueGO: a Cytoscape plug-in to decipher functionally grouped gene ontology and pathway annotation networks. Bioinformatics. 2009;25(8):1091–1093. doi:10.1093/bioinformatics/btp101
36. Nanjappa V, Thomas JK, Marimuthu A, et al. Plasma proteome database as a resource for proteomics research: 2014 update. Nucleic Acids Res. 2014;42(Databaseissue):D959–D965. doi:10.1093/nar/gkt1251
37. Fleischer CC, Payne CK. Secondary structure of corona proteins determines the cell surface receptors used by nanoparticles. J Phys Chem B. 2014;118(49):14017–14026. doi:10.1021/jp502624n
38. Shang L, Wang Y, Jiang J, Dong S. pH-dependent protein conformational changes in albumin: gold nanoparticle bioconjugates: a spectroscopic study. Langmuir. 2007;23(5):2714–2721. doi:10.1021/la062064e
39. Tenzer S, Docter D, Kuharev J, et al. Rapid formation of plasma protein corona critically affects nanoparticle pathophysiology. Nat Nanotechnol. 2013;8(10):772–781. doi:10.1038/nnano.2013.181
40. Monopoli MP, Walczyk D, Campbell A, et al. Physical−chemical aspects of protein corona: relevance to in vitro and in vivo biological impacts of nanoparticles. J Am Chem Soc. 2011;133(8):2525–2534. doi:10.1021/ja107583h
41. Hortin GL, Sviridov D, Anderson NL. High-abundance polypeptides of the human plasma proteome comprising the top 4 logs of polypeptide abundance. Clin Chem. 2008;54(10):1608–1616. doi:10.1373/clinchem.2008.108175
42. Hussain MM. Structural, biochemical and signaling properties of the low-density lipoprotein receptor gene family. Front Biosci. 2001;6:D417–D428. doi:10.2741/hussain1
43. Wolfram J, Yang Y, Shen J, et al. The nano-plasma interface: implications of the protein corona. Colloids Surf B. 2014;124:17–24. doi:10.1016/j.colsurfb.2014.02.035
44. Escamilla-Rivera V, Uribe-Ramirez M, Gonzalez-Pozos S, Lozano O, Lucas S, De Vizcaya-ruiz A. Protein corona acts as a protective shield against Fe3O4-PEG inflammation and ROS-induced toxicity in human macrophages. Toxicol Lett. 2016;240(1):172–184. doi:10.1016/j.toxlet.2015.10.018
45. Heuberger M, Drobek T, Spencer ND. Interaction forces and morphology of a protein-resistant poly(ethylene glycol) layer. Biophys J. 2005;88(1):495–504. doi:10.1529/biophysj.104.045443
46. Marie R, Beech JP, Vörös J, Tegenfeldt JO, Höök F. Use of PLL-g-PEG in micro-fluidic devices for localizing selective and specific protein binding. Langmuir. 2006;22(24):10103–10108. doi:10.1021/la060198m
47. Hadjidemetriou M, Al-Ahmady Z, Mazza M, Collins RF, Dawson K, Kostarelos K. In vivo biomolecule corona around blood-circulating, clinically used and antibody-targeted lipid bilayer nanoscale vesicles. ACS Nano. 2015;9(8):8142–8156. doi:10.1021/acsnano.5b03300
48. Dehaini D, Wei X, Fang RH, et al. Erythrocyte-platelet hybrid membrane coating for enhanced nanoparticle functionalization. Adv Mater. 2017;29(16):1606209. doi:10.1002/adma.201606209
49. Li B, Wang F, Gui L, He Q, Yao Y, Chen H. The potential of biomimetic nanoparticles for tumor-targeted drug delivery. Nanomedicine (Lond). 2018;13(16):2099–2118. doi:10.2217/nnm-2018-0017
50. Hu C-MJ, Fang RH, Wang K-C, et al. Nanoparticle biointerfacing by platelet membrane cloaking. Nature. 2015;526:118. doi:10.1038/nature15373
51. Narain A, Asawa S, Chhabria V, Patil-Sen Y. Cell membrane coated nanoparticles: next-generation therapeutics. Nanomedicine (Lond). 2017;12(21):2677–2692. doi:10.2217/nnm-2017-0225
52. Fang RH, Jiang Y, Fang JC, Zhang L. Cell membrane-derived nanomaterials for biomedical applications. Biomaterials. 2017;128:69–83. doi:10.1016/j.biomaterials.2017.02.041
53. Barber-Zucker S, Zarivach R. A look into the biochemistry of magnetosome biosynthesis in magnetotactic bacteria. ACS Chem Biol. 2017;12(1):13–22. doi:10.1021/acschembio.6b01000
54. Huang H, Lai W, Cui M, et al. An evaluation of blood compatibility of silver nanoparticles. Sci Rep. 2016;6:25518. doi:10.1038/srep25518
55. Zhang H, Burnum KE, Luna ML, et al. Quantitative proteomics analysis of adsorbed plasma proteins classifies nanoparticles with different surface properties and size. Proteomics. 2011;11(23):4569–4577. doi:10.1002/pmic.201100037
56. Walkey CD, Olsen JB, Song F, et al. Protein corona fingerprinting predicts the cellular interaction of gold and silver nanoparticles. ACS Nano. 2014;8(3):2439–2455. doi:10.1021/nn406018q
57. Gref R, Lück M, Quellec P, et al. ‘Stealth’ corona-core nanoparticles surface modified by polyethylene glycol (PEG): influences of the corona (PEG chain length and surface density) and of the core composition on phagocytic uptake and plasma protein adsorption. Colloids Surf B. 2000;18(3):301–313. doi:10.1016/S0927-7765(99)00156-3
58. Zhang T, Tang M, Yao Y, Ma Y, Pu Y. MWCNT interactions with protein: surface-induced changes in protein adsorption and the impact of protein corona on cellular uptake and cytotoxicity. Int J Nanomedicine. 2019;14:993–1009. doi:10.2147/IJN.S191689
59. Shin J-B, Krey JF, Hassan A, et al. Molecular architecture of the chick vestibular hair bundle. Nat Neurosci. 2013;16(3):365–374. doi:10.1038/nn.3312
60. Schwanhäusser B, Busse D, Li N, et al. Global quantification of mammalian gene expression control. Nature. 2011;473:337. doi:10.1038/nature10098
61. Chen J, Li Q, Wang J. Topology of human apolipoprotein E3 uniquely regulates its diverse biological functions. Proc Natl Acad Sci. 2011;108(36):14813–14818. doi:10.1073/pnas.1106420108
62. Sugio S, Kashima A, Mochizuki S, Noda M, Kobayashi K. Crystal structure of human serum albumin at 2.5 Å resolution. Protein Eng Des Sel. 1999;12(6):439–446. doi:10.1093/protein/12.6.439
63. Wagner SC, Roskamp M, Pallerla M, Araghi RR, Schlecht S, Koksch B. Nanoparticle-induced folding and fibril formation of coiled-coil-based model peptides. Small. 2010;6(12):1321–1328. doi:10.1002/smll.200902067
64. Vitali M, Rigamonti V, Natalello A, et al. Conformational properties of intrinsically disordered proteins bound to the surface of silica nanoparticles. Biochim Biophys Acta. 2018;1862(7):1556–1564. doi:10.1016/j.bbagen.2018.03.026
65. Yokoyama S, Kawai Y, Tajima S, Yamamoto A. Behavior of human apolipoprotein-e in aqueous-solutions and at interfaces. J Biol Chem. 1985;260(30):6375–6382.
66. Saito H, Lund-Katz S, Phillips MC. Contributions of domain structure and lipid interaction to the functionality of exchangeable human apolipoproteins. Prog Lipid Res. 2004;43(4):350–380. doi:10.1016/j.plipres.2004.05.002
67. Zhou M, Lucas DA, Chan KC, et al. An investigation into the human serum “interactome”. Electrophoresis. 2004;25(9):1289–1298. doi:10.1002/(ISSN)1522-2683
68. Choi MH, Sun HY, Park RY, et al. Human serum albumin enhances the hemolytic activity of Vibrio vulnificus. Biol Pharm Bull. 2006;29(1):180–182. doi:10.1248/bpb.29.180
69. Kharazian B, Hadipour NL, Ejtehadi MR. Understanding the nanoparticle–protein corona complexes using computational and experimental methods. Int J Biochem Cell Biol. 2016;75:162–174. doi:10.1016/j.biocel.2016.02.008
70. Lacerda SH, Park JJ, Meuse C, et al. Interaction of gold nanoparticles with common human blood proteins. ACS Nano. 2010;4(1):365–379. doi:10.1021/nn9011187
71. Waterhouse A, Bertoni M, Bienert S, et al. SWISS-MODEL: homology modelling of protein structures and complexes. Nucleic Acids Res. 2018;46(W1):W296–W303. doi:10.1093/nar/gky427
72. Mirshafiee V, Kim R, Park S, Mahmoudi M, Kraft ML. Impact of protein pre-coating on the protein corona composition and nanoparticle cellular uptake. Biomaterials. 2016;75:295–304. doi:10.1016/j.biomaterials.2015.10.019
73. Wang P, Chen C, Chen C, Li Y, Pan W, Song T. The interaction of bacterial magnetosomes and human liver cancer cells in vitro. J Magn Magn Mater. 2017;427:105–110. doi:10.1016/j.jmmm.2016.10.106
74. Dobrovolskaia MA, Neun BW, Man S, et al. Protein corona composition does not accurately predict hematocompatibility of colloidal gold nanoparticles. Nanomedicine. 2014;10(7):1453–1463. doi:10.1016/j.nano.2014.01.009
 © 2020 The Author(s). This work is published and licensed by Dove Medical Press Limited. The
full terms of this license are available at https://www.dovepress.com/terms
and incorporate the Creative Commons Attribution
- Non Commercial (unported, 3.0) License.
By accessing the work you hereby accept the Terms. Non-commercial uses of the work are permitted
without any further permission from Dove Medical Press Limited, provided the work is properly
attributed. For permission for commercial use of this work, please see paragraphs 4.2 and 5 of our Terms.
© 2020 The Author(s). This work is published and licensed by Dove Medical Press Limited. The
full terms of this license are available at https://www.dovepress.com/terms
and incorporate the Creative Commons Attribution
- Non Commercial (unported, 3.0) License.
By accessing the work you hereby accept the Terms. Non-commercial uses of the work are permitted
without any further permission from Dove Medical Press Limited, provided the work is properly
attributed. For permission for commercial use of this work, please see paragraphs 4.2 and 5 of our Terms.