Back to Journals » Risk Management and Healthcare Policy » Volume 14
A Proactive Approach to Identify the Exposure Risk to COVID-19: Validation of the Pandemic Risk Exposure Measurement (PREM) Model Using Real-World Data
Authors Grima S ![]() , Rupeika-Apoga R
, Rupeika-Apoga R ![]() , Kizilkaya M
, Kizilkaya M ![]() , Romānova I
, Romānova I ![]() , Dalli Gonzi R
, Dalli Gonzi R ![]() , Jakovljevic M
, Jakovljevic M ![]()
Received 27 September 2021
Accepted for publication 11 November 2021
Published 26 November 2021 Volume 2021:14 Pages 4775—4787
DOI https://doi.org/10.2147/RMHP.S341500
Checked for plagiarism Yes
Review by Single anonymous peer review
Peer reviewer comments 2
Editor who approved publication: Dr Jongwha Chang
Video abstract presented by Rebecca Dalli Gonzi.
Views: 124
Simon Grima, 1 Ramona Rupeika-Apoga, 2 Murat Kizilkaya, 3 Inna Romānova, 2 Rebecca Dalli Gonzi, 4 Mihajlo Jakovljevic 5,6
1Department of Insurance, Faculty of Economics, Management and Accountancy, University of Malta, Msida, Malta; 2Faculty of Business, Management and Economics, University of Latvia, Riga, Latvia; 3Department of Economics, Faculty of Economics and Administrative Sciences, Ardahan University, Ardahan, Turkey; 4Department of Construction & Property Management, University of Malta, Msida, MSD, 2080, Malta; 5Institute of Comparative Economic Studies ICES, Faculty of Economics, Hosei University, Tokyo, Japan; 6Department of Global Health Economics and Policy, Faculty of Medical Sciences, University of Kragujevac, Kragujevac, Serbia
Correspondence: Simon Grima
University of Malta, Msida, MSD, 2080, Malta
Tel +356 79 651 410
Email [email protected]
Purpose: To statistically validate the PREM (Pandemic Risk Exposure Measurement) model devised in a previous paper by the authors and determine the model’s relationship with the level of current COVID-19 cases (NLCC) and the level of current deaths related to COVID-19 (NLCD) based on the real country data.
Methods: We used perceived variables proposed in a previous study by the same lead authors and applied the latest available real data values for 154 countries. Two endogenous real data variables (NLCC) and (NLCD) were added. Data were transformed to measurable values using a Likert scale of 1 to 5. The resulting data for each variable were entered into SPSS (Statistical Package for the Social Sciences) version 26 and Amos (Analysis of a Moment Structures) version 21 and subjected to statistical analysis, specifically exploratory factor analysis, Cronbach’s alpha and confirmatory factor analysis.
Results: The results obtained confirmed a 4-factor structure and that the PREM model using real data is statistically reliable and valid. However, the variable Q14 – hospital beds available per capita (1000 inhabitants) had to be excluded from the analysis because it loaded under more than one factor and the difference between the factor common variance was less than 0.10. Moreover, its Factor 1 and Factor 3 with NLCC and Factor 1 with NLCD showed a statistically significant relationship.
Conclusion: Therefore, the developed PREM model moves from a perception-based model to reality. By proposing a model that allows governments and policymakers to take a proactive approach, the negative impact of a pandemic on the functioning of a country can be reduced. The PREM model is useful for decision-makers to know what factors make the country more vulnerable to a pandemic and, if possible, to manage or set tolerances as part of a preventive measure.
Keywords: COVID-19, pandemic risk exposure, PREM, proactive, vulnerability
Introduction
Reducing the impact of any pandemic depends on an early prediction strategy to be better prepared and reduce the burden on the health system. This strategy is multifaceted and contains both immediate and proactive solutions, while simultaneously covering all areas of activity: medicine, pharmaceuticals, economics, information technology, legal, social and environmental aspects. There have been many pandemic studies, including COVID-19 risk assessment studies, which suggested different prediction and mitigation models.2–5 However, all these models are comparable to extinguishing a fire, which, of course, must be done immediately in order to survive. In this paper, we explore a Pandemic Risk Exposure Measurement (PREM) model1 that identifies factors that influence a country’s perceived vulnerability to pandemic risk exposure such as COVID-19. This proactive risk prediction model should help countries to proactively prepare to meet the new challenges posed by pandemics in the future. Why is the death rate high in some countries, and much lower in others with the same cases of COVID-19 infection? For example, in Estonia as of September 7, 2021, the total number of cases per million was 108,761, and in France - 104,509, while the death rate in Estonia was 983 cases per million, and in France – 1757.6 Why is the spread of COVID-19 infection so different in countries with similar populations? For example, in Slovakia, as of September 7, 2021, the total number of positive cases of COVID-19 per million was 72,580, while in Norway it was 30,792 and only 23,610 in Finland.6 We can find many examples that show that the number of positive cases and mortality are not directly related to the level of wealth and population density.6 Some neighbouring countries with similar economic and social characteristics are in different situations. There is no clear answer to this question, but we hope that the PREM can help countries become proactive in reducing their vulnerability to pandemics.
The main purpose of the study is to reveal the pandemic risk exposure, based on the real data of the countries by confirming that the model suggested by Grima et al1 works for determining the vulnerability of countries to a pandemic. We do this by inserting a real value for the perceived variable determined from the previous study and verify the relationship with the Level of COVID-19 cases per 1 million population and COVID-19 Deaths per 1 million population.
When using the real values for the variables of the model proposed by Grima et al (2020)1 can we confirm that the PREM model can be used to identify the vulnerability of a country to a Pandemic?
Our findings have theoretical and practical contributions. Our main theoretical/methodological contribution includes testing a PREM model based on expert expectations on the real data. The literature review emphasizes that existing studies use either expert expectations or literature review models, while this study combines both steps: selection of variables based on literature review and confirmation of expert expectations (PREM model); and testing the PREM model on real data for 154 countries.
The main practical contribution is that the PREM model allows a proactive approach to reducing the risks of pandemics. Using real data values to confirm the reliability of the model, this study seeks to validate the perceived variables outlined in a previous study by the lead authors Grima S. et al (2020).1 The PREM model is useful for policymakers to understand what factors make a country more vulnerable to a pandemic and, if possible, manage or set tolerances as part of preventive measures.
Materials and Methods
Theoretical Background and Hypotheses
Policymakers work with scientists and academics to assess a country’s capacity to prevent, detect, and respond rapidly to public health threats, regardless of whether they are natural, intentional, or accidental. The World Health Organization (WHO) plays an essential role in the global governance of health and diseases; due to its core global functions of establishing, monitoring and enforcing international norms and standards, and coordinating multiple actors toward common goals.7 As a multilateral agency, WHO is unique among stakeholders in global health in that it wields the authority to promulgate both binding and non-binding agreements. The International Health Regulations (IHR) serve as a particularly noteworthy example of a binding agreement made by WHO and have presently been accepted by 196 member countries. The IHR specifies the process by which WHO may formally declare a Public Health Emergency of International Concern (PHEIC).8 WHO has developed a framework to support the evaluation of a country’s functional ability to detect and respond to a health emergency – “The International Health Regulations Monitoring and Evaluation Framework (IHR MEF)”.9 It requires countries to report outbreaks of specific infectious diseases that may have crossed borders with the WHO. The Framework is a set of four components: one mandatory and three voluntary. Countries are required to report through an annual multi-sectoral self-assessment process known as the State Parties Self-Assessment Annual Reporting (SPAR).10,11 The SPAR collects 13 IHR capacities, including Legislation and Financing, IHR coordination and National Focal Points functions, Zoonotic events and the human-animal health interface, Food Safety, Laboratory, Surveillance, Human resources, National health emergency framework, Health service provision, Risk communication, Points of entry, Chemical events and Radiation emergencies.12 The three voluntary components are the Joint External Evaluation, the After-action Reviews and the Simulation exercises. The Joint External Evaluation focuses on the ability to assess the status of implementation of the IHR; the after-action reviews focus on functionality to assess real events (after an event); and the simulation exercises that focus on functionality to assess non-real events (before any event).9
As COVID-19 continues to spread, academics are hard at work developing models that can predict pandemics. One strand of the literature focuses on predictive models for diagnosing coronavirus disease. A systematic review identified 232 models described in 169 studies and divided them into three categories: models for the general population to predict the risk of having COVID-19 or being admitted to hospital for COVID-19; models to support the diagnosis of COVID-19 in patients with suspected infection; and models to support the prognostication of patients with COVID-19.13 Predictive models for the general population are mainly based on medical evidence such as previous hospitalization, influenza, acute bronchitis or upper respiratory tract infections, comorbidities,4,13–15 including more general characteristics such as age, gender, social determinants of health and demography.16 Diagnostic models to detect COVID-19 in patients with suspected infection and prognostic models for patients with a diagnosis of COVID-19 use even more specific medical data. These models are based on vital signs, such as temperature, heart rate, respiratory rate, oxygen saturation, blood pressure; flu-like signs and symptoms, such as shiver and fatigue; and image features such as pneumonia signs on CT scan.17,18 Prognostic models for patients with a diagnosis of COVID-19 include variables such as recovery, length of hospital stay, intensive care unit admission, intubation (duration of) mechanical ventilation, acute respiratory distress syndrome, cardiac injury and thrombotic complication.13,19,20
These models are an urgent solution to the pandemic problem and are based mainly on medical data to measure how quickly a pandemic can spread in different countries and with what consequences. This is an active approach to reducing the risks of a pandemic; however, society also needs a proactive approach.
Another strand of literature is devoted to a proactive approach to combating pandemics such as COVID-19. To assess the risk of importation per country, Gilbert et al used the volume of air travel departing from airports in the infected provinces in China and directed to Africa, identifying the country’s capacity in terms of preparedness using the WHO IHR MEF; and vulnerability using the Infectious Disease Vulnerability Index. They found that countries with the highest importation risk have moderate-to-high capacity to respond to outbreaks, while countries at moderate risk have the variable capacity and high vulnerability.21
Kandel et al used 18 indicators from the IHR SPAR tool and the associated data from national SPAR reports to develop five indices: (1) prevent, (2) detect, (3) respond, (4) enabling function, and (5) operational readiness. To calculate the indices, each SPAR score was scored on a scale from 1 to 5. They found that 96 countries have strong operational readiness capacities in place, which suggests that an effective response to potential health emergencies could be enabled, including COVID-19.22
As the literature review shows, several studies have used indicators from the IHR SPAR tool and associated data from national SPAR reports to model existing health security and vulnerability metrics for countries.21,22
To identify factors influencing vulnerability to infectious disease outbreaks, Moore et al used demographic, health care, public health, disease dynamics, political-domestic, political-international, and economic domains. Based on data from the World Bank, the World Health Organization created an index generation tool that allows to identify and rank potentially vulnerable countries. The main findings of their assessment include a heat map showing the normalized scores for all countries in the world in terms of their vulnerability to infectious disease outbreaks, with the most vulnerable countries in the Africa region.23
While Cartaxo et al believe that the exposure risk to COVID-19 mirrors a country’s ability to cope with the pandemic, measured by both the speed and the incidence of cases.3 To analyse the countries’ response capacities to the exposure risk to COVID-19, considering socioeconomic, political, and health infrastructure conditions, 67 variables were selected. Fourteen variables from the IBGE database, including the following categories: social, economy, population, and health;24 fourteen indicators from the World Bank, including such categories as a worldview, people, environment, economy, states and markets, and global links, as well as the GINI index;25 and six health indicators from the WHO Observatory database.26 The indicators were normalized and ordered to allow a comparative analysis among the six countries to specifically identify the sensitivity of each indicator. To identify vulnerable countries, a three-stage model was developed using XGBoost, a machine learning algorithm, including total population, population density, longitude, hypertension prevalence, chronic respiratory mortality rate, cancer crude rate, and diabetes prevalence. They found that population, population density, percentage of people aged over 70 years, and prevalence of comorbidities play an important role in predicting COVID-19 occurrences.27
Our current study is based on Grima et al1 which was addressed using the purposely built semi-structured survey results of experts.1 This survey was designed by using the inventory of factor variables determined in the Grima et al PREM model used to measure a country’s exposure to a pandemic risk such as COVID-19.
In the previous study, we developed a Pandemic Risk Exposure Measurement (PREM) model to determine the factors that affect a country’s prospective vulnerability to a pandemic risk exposure such as COVID-19. This study was expanded to test the reliability of PREM using real-world data to determine whether the previously obtained perceived factor variables used in the PREM model to predict the vulnerability of a country to a pandemic were valid and reliable when using real values.
Therefore, we have made the following supplementary hypothesis:
H1: The PREM model using real data is statistically reliable and valid. H0: The PREM model using real data is not statistically reliable and valid.
Methodology
Data Collection and Variables
For the purpose of this study, we used the perceived variables suggested in a previous study by the same authors in Grima et al1 as listed in Table 1 and plugged in the latest available real-data values for 154 countries, the list of which is provided in Table 2. We maintained the same numbering as per the original paper. We, however, added two endogenous variables: 1) NLCC (Level of COVID-19 cases per 1 million population) and 2) NLCD (COVID-19 Deaths per 1 million population), to enable us to determine their relationship with the other variables.
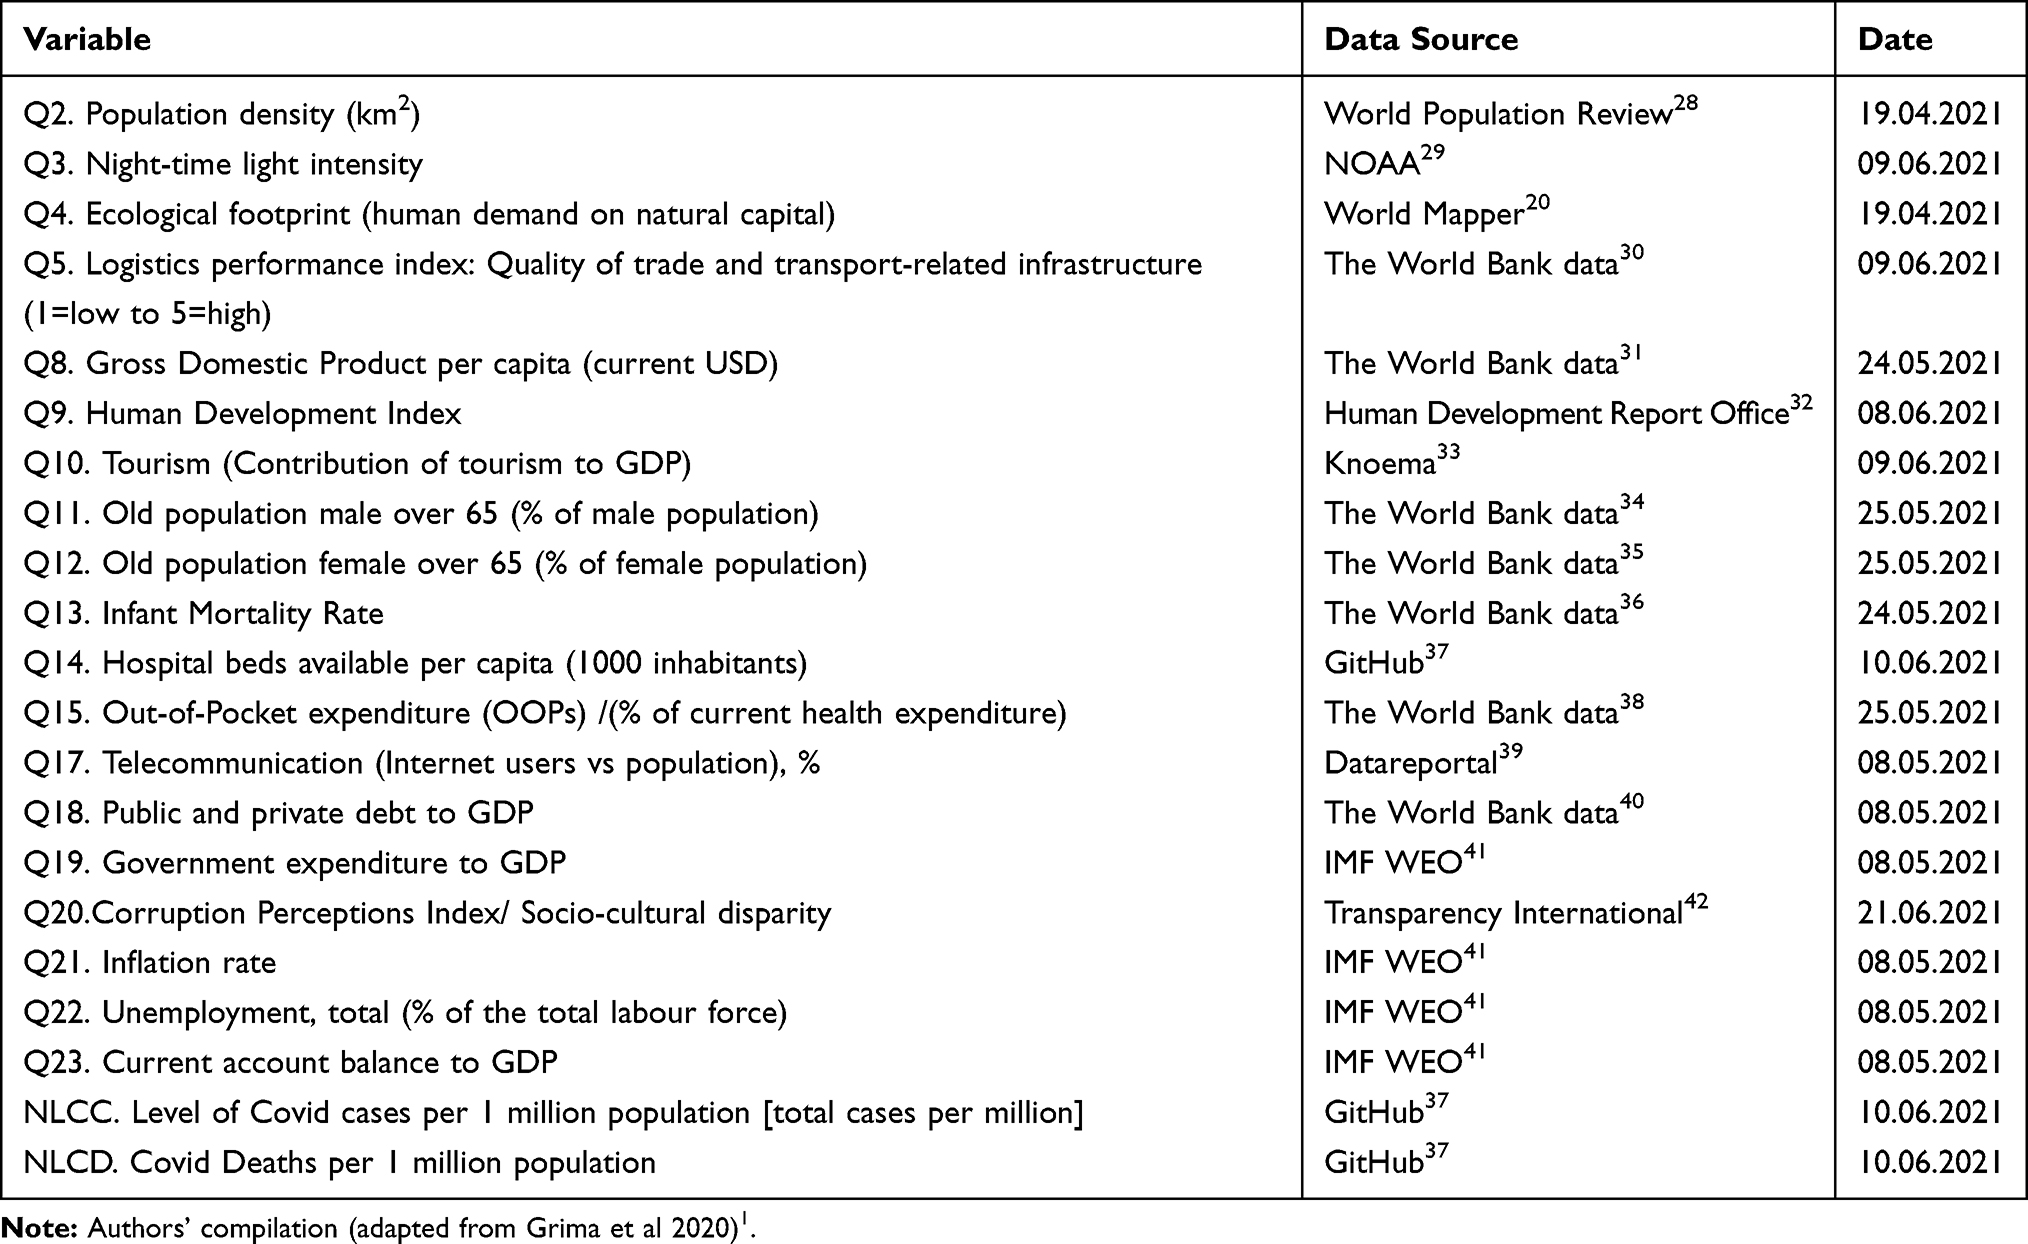 |
Table 1 Variables |
 |
Table 2 Countries |
To enable an analysis of data using similar measures, the data was then transformed using a Likert scale of 1 to 5 (1 being the least value and 5 being the largest value). This was done by taking the variables one by one and subtracting the Minimum value (say X) of that variable from the Maximum Value (say Y) of that variable and dividing the answer by 5. For simplicity’s sake, we will denote the result herein as (S). Then
The range from X to (X +S) = Likert Scale 1,
The range from (X+S)+1 to (X+2S) = Likert scale 2,
The range from (X+2S)+1 to (X+3S) = Likert scale 3,
The range from (X+3S)+1 to (X+4S) = Likert scale 4,
The range from (X+4S)+1 to (Y) = Likert scale 5.
Data Analysis
The resultant data for each variable were inputted into the SPSS version 26 and Amos version 21 application software and subjected to statistical analysis specifically Exploratory factor Analysis, Cronbach’s alpha and Confirmatory factor analysis.
Results
Whether the data are suitable for factor analysis is usually determined by the Kaiser-Meyer-Olkin (KMO) test. In order for the data to be suitable for factor analysis, the KMO value must be greater than 0.5.43 The KMO in our model = 0.820 and the Bartlett’s test for sphericity, which tests for the presence of correlations among variables = 1866.595 and is statistically significant with a p-value <0.01. These values showed that the data were suitable for factor analysis. Principal Component Analysis was used as the extraction method, and Varimax was used as the rotation method. There is no variable with a factor load below 0.40. However, the variable Q14 (Hospital beds available per capita (1000 inhabitants)) was excluded from the analysis because it loaded under more than one factor and the difference between the factor common variance was less than 0.10. As a result of the analysis, a 4-factor structure emerged (Table 3).
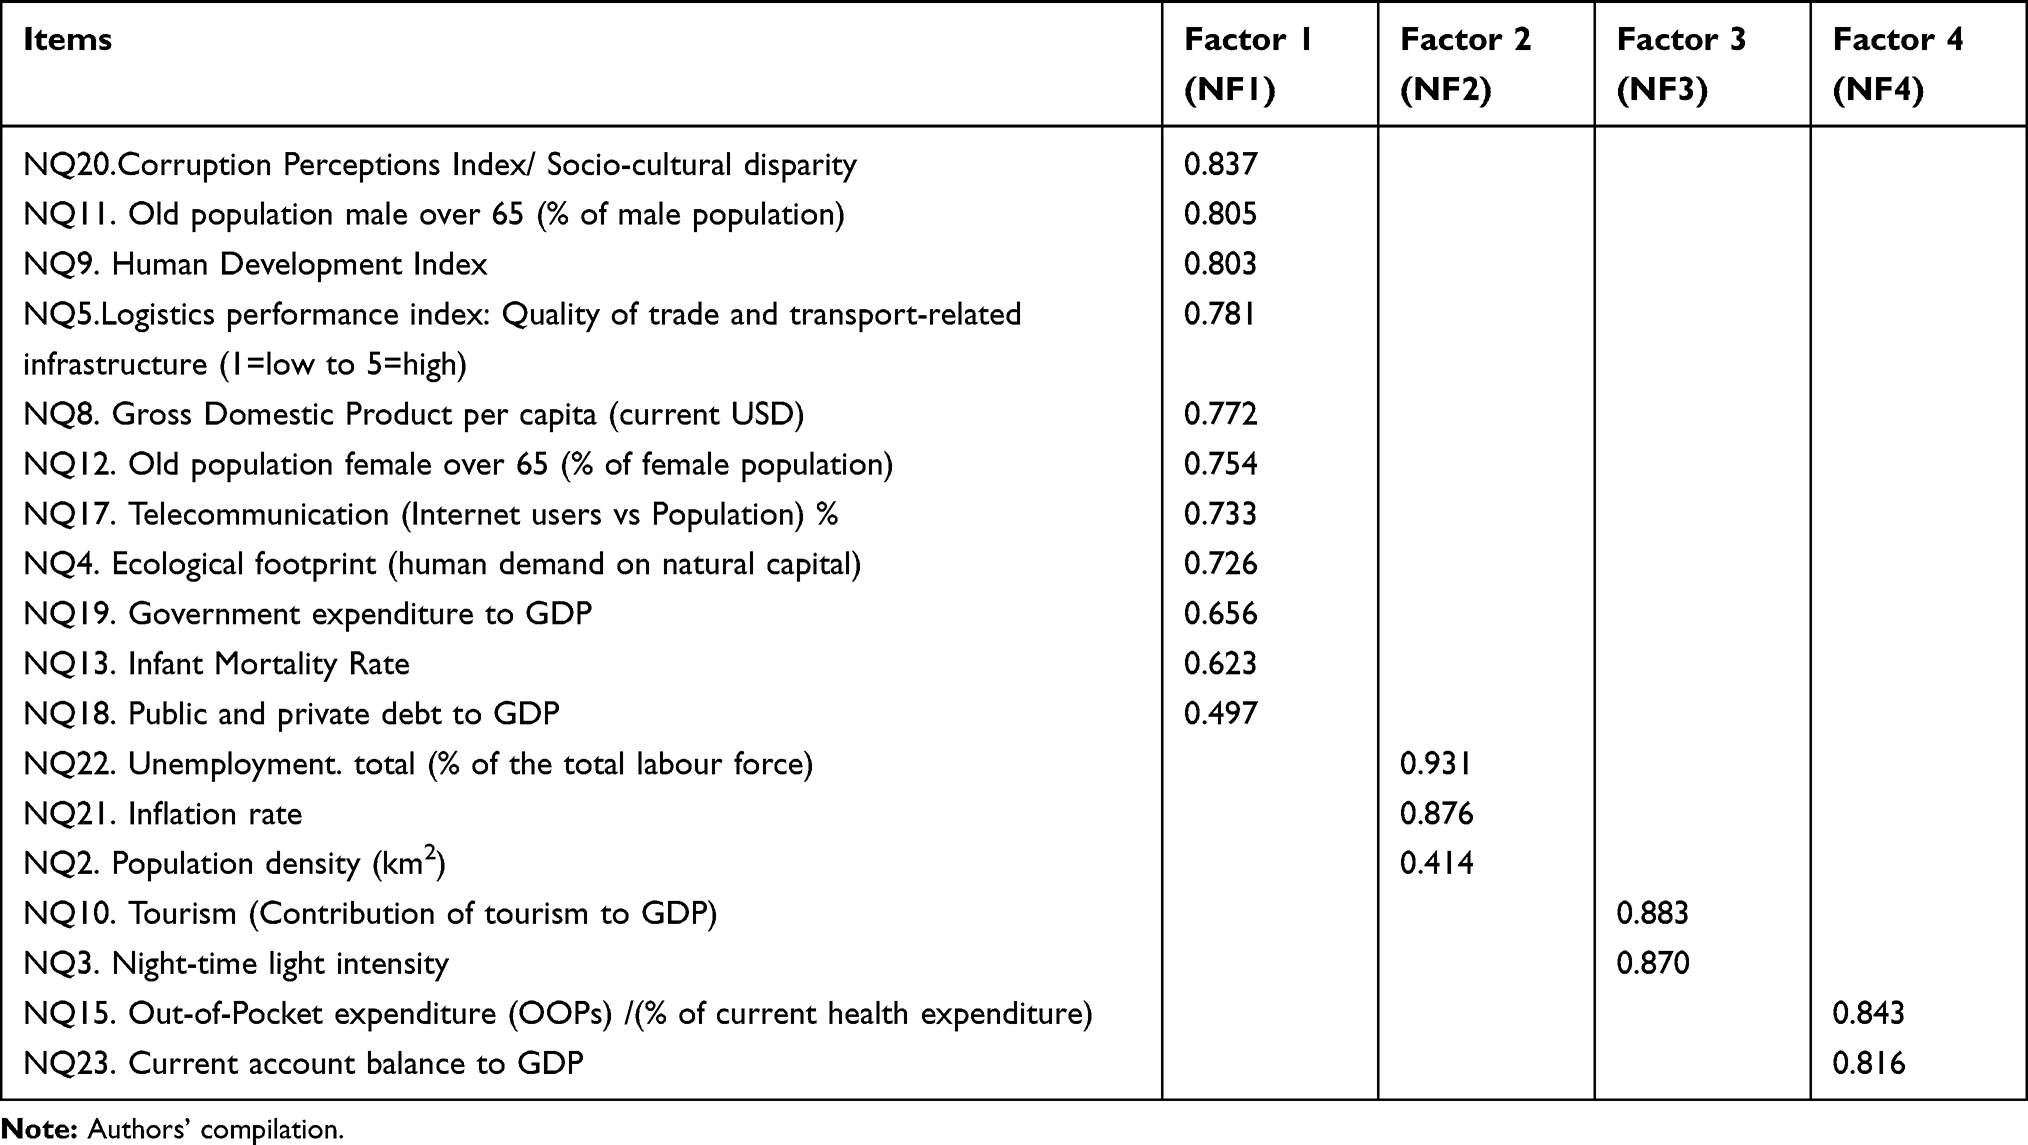 |
Table 3 Factor Analysis Results |
The 4-factor structure was examined further, and the Cronbach’s Alpha and the part explained by the factor in the total variance are given for each factor in Table 4. The Cronbach’s Alpha coefficient shows the reliability of the grouped items under each factor. A score between 0.60 and 0.80 indicates that the scale is reliable, and a score between 0.80 and 1.00 indicates that it is highly reliable.44 The Cronbach’s Alpha coefficient of the whole scale used was calculated to be 0.826. Alpha coefficients of each sub-dimension vary between 0.685 and 0.918. This shows that the scale used is reliable. All 4 Factors in total explained 67.425% of the total variance.
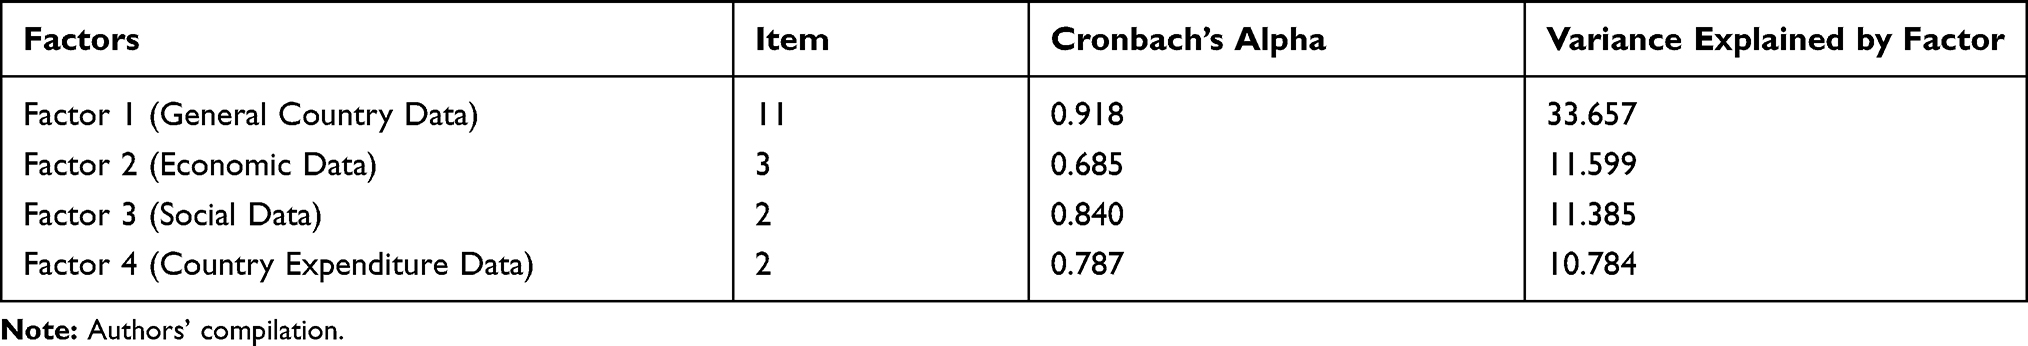 |
Table 4 Cronbach's Alpha and Total Variance Explained |
The sub-dimensions of each factor in the 4-factor structure, which as noted in Table 3 have been labelled Country Data (NF1), Economic Data (NF2), Social Data (NF3) and Country Expenditure Data (NF4) and are shown in detail in Table 4. The labels were given to represent the features of the grouped variables.
Therefore, this leads us to test the following hypothesis that:
H2 – Country Data (NF1) affects NLCC.
H3 – Economic Data (NF2) affects NLCC.
H4 – Social Data (NF3) affects NLCC.
H5 – Country Expenditure Data (NF4) affects NLCC.
H6 – Country Data (NF1) affects NLCD.
H7 – Economic Data (NF2) affects NLCD.
H8 – Social Data (NF3) affects NLCD.
H9 – Country Expenditure Data (NF4) affects NLCD.
Confirmatory Factor Analysis (CFA) was performed to measure the accuracy of the 4-factor structure that emerged as a result of the analysis. CFA, as a measurement tool, is an important method that is frequently used in the development of measurement models that aim to reveal how and how much a group of observable variables explain the latent variables called factors.45 Figure 1
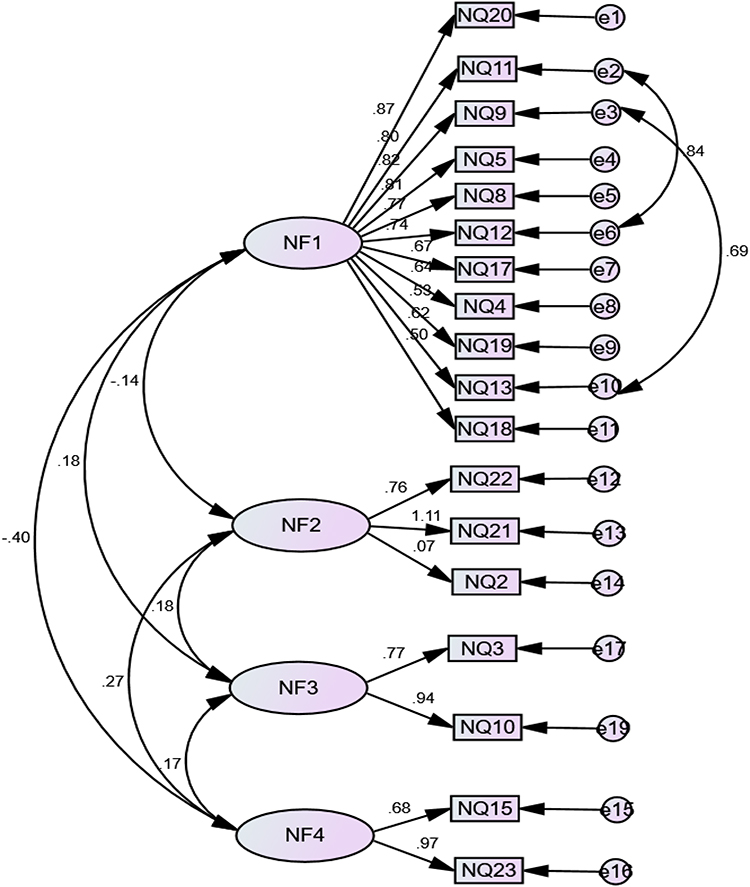 |
Figure 1 The confirmatory factor analysis with its standard loads (CFA Results). |
The model’s goodness-of-fit statistics indicate whether the model as a whole is supported by the available data. The values that are most frequently used as goodness-of-fit indices of the model and the calculated values are given in Table 5.46
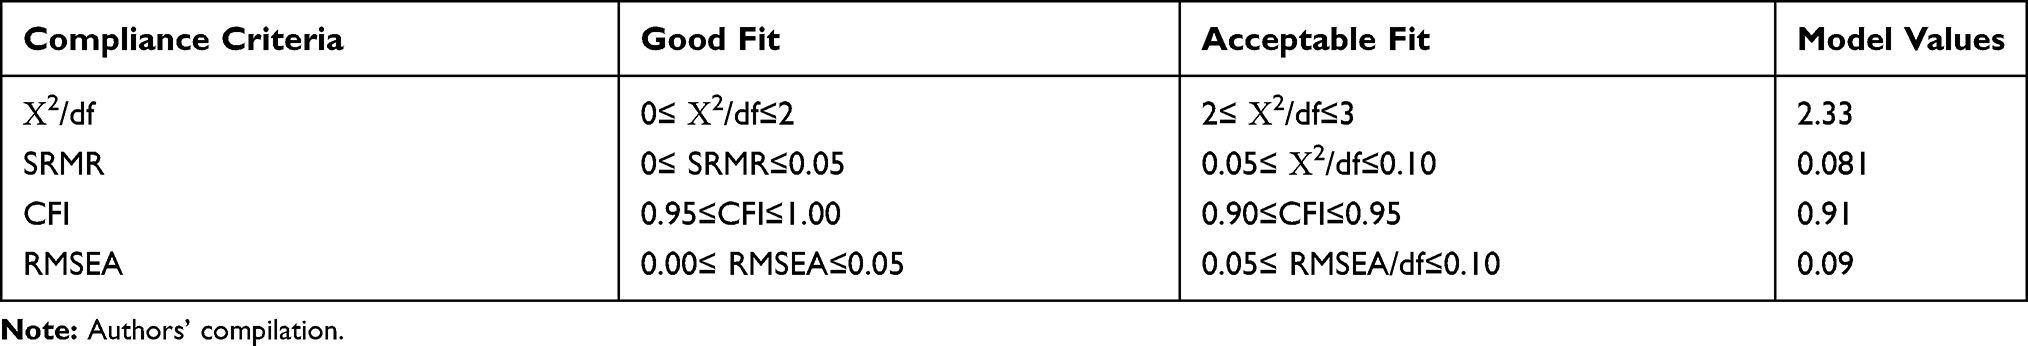 |
Table 5 Goodness-of-Fit and Model Values |
The results revealed that the model had an acceptable fit. Therefore, we can accept H1. The results obtained confirmed the 4-factor structure. Structural Equation Models were created separately to measure their effects on the “Level of COVID-19 cases per (million) population (NLCC)” and the “COVID-19 Deaths per million population (NLCD)”. The models obtained after the necessary modifications are shown in Figures 2 and 3 with their standard values. Model goodness-of-fit statistics of these two models is given in Table 6.
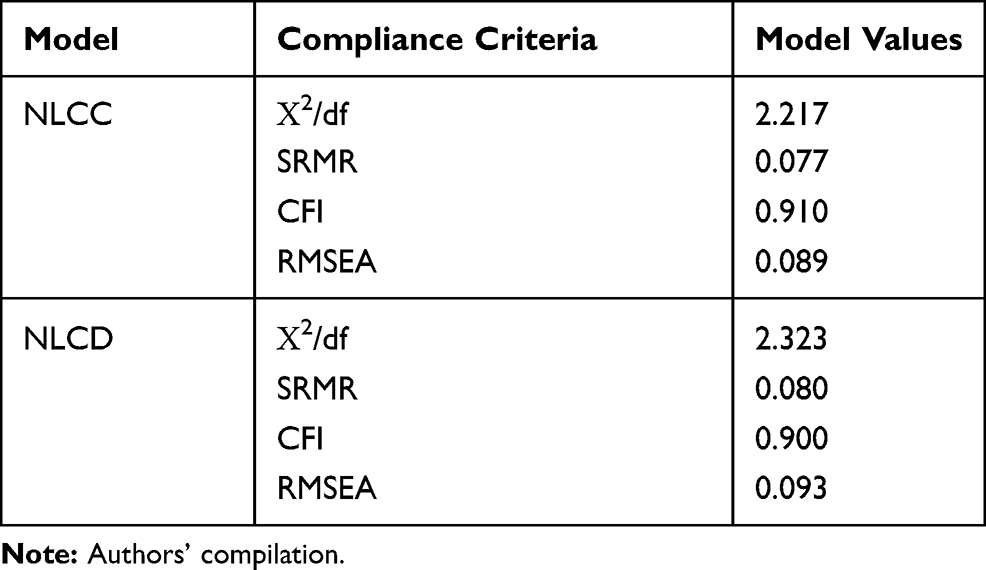 |
Table 6 Goodness of Fit for NLCC and NLCD |
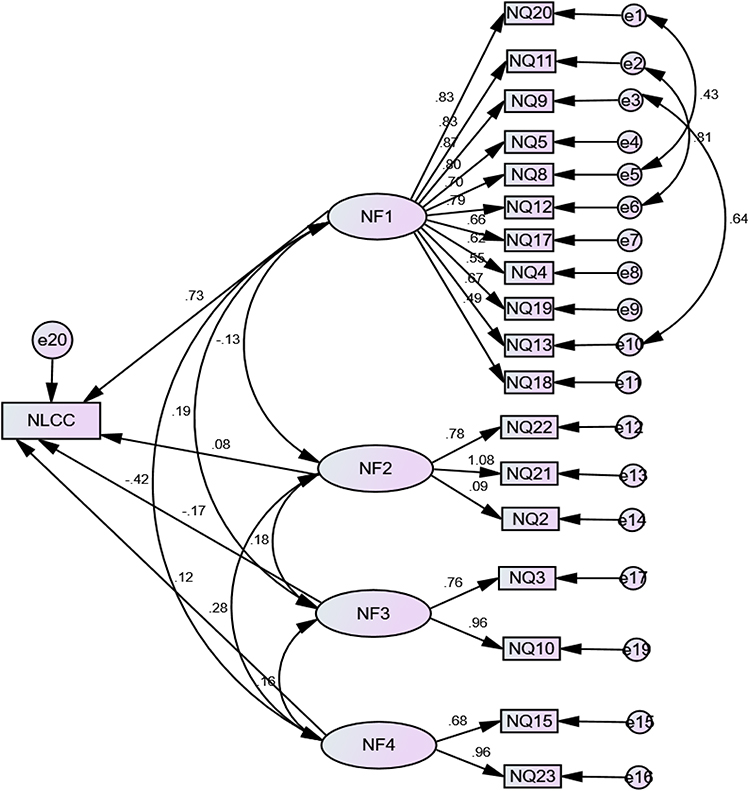 |
Figure 2 Effect of factor variables on NLCC. |
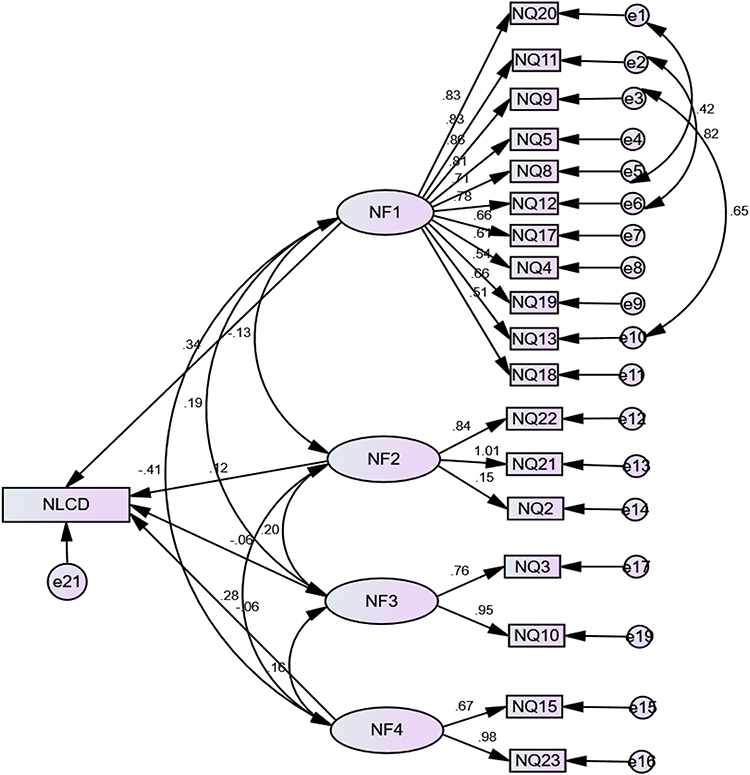 |
Figure 3 Effect of factor variables on NLCD. |
Model fit indices show that both models have an acceptable fit. The standard coefficients of the models are shown in Table 7.
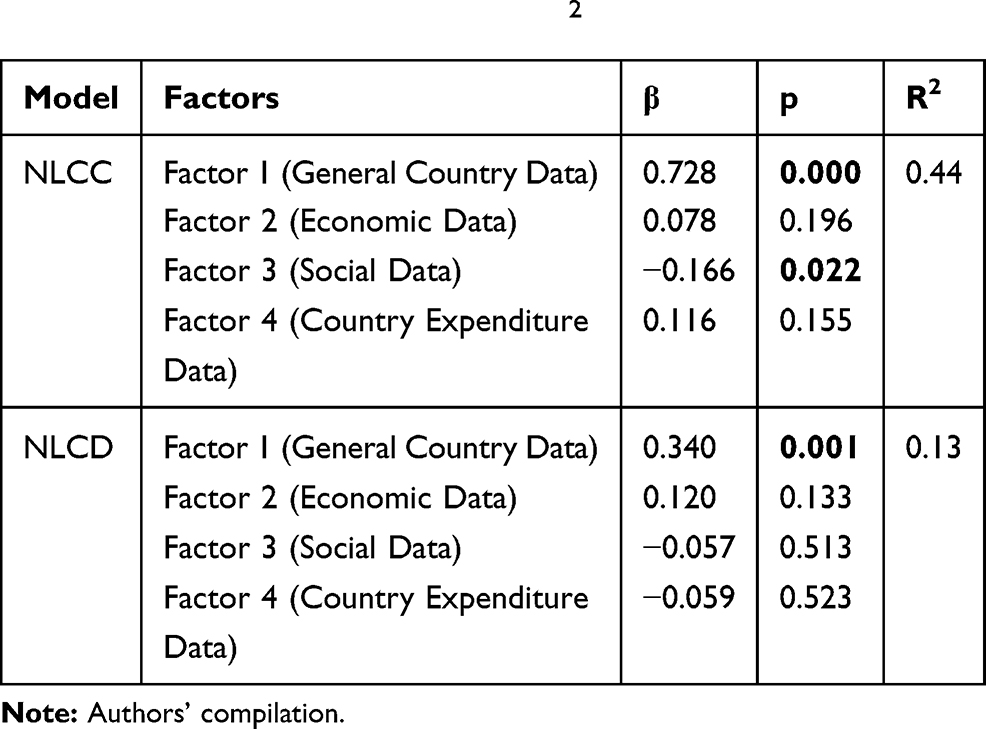 |
Table 7 Standard Coefficients and R2 |
While the path coefficients of Factor 1 and Factor 3 are statistically significant in the NLCC model, the coefficients of the other factors are insignificant. Factor 1 affects NLCC positively and Factor 3 affects NLCC negatively. An increase of 1 unit in Factor 1 causes an increase of 0.728 units in NLCC, while an increase of 1 unit in Factor 3 causes a decrease of 0.166 units in NLCC. The R2 value resulted to be equal to 0.44. This means that the Factors explain 44% of the change in NLCC. H2 and H4 are accepted since the P-value <0.01. H3 and H5 could not be accepted since the P-value >0.01.
In the NLCD model, only the coefficient of Factor 1 is significant, and the coefficients of all other factors are insignificant. The R2 value of the model resulted as equal to 0.13. Therefore, an increase of 1 unit in factor 1 causes an increase of 0.340 units in NLCD. That means that Factors explain 13% of the change in NLCD. H5 accepted since the P-value <0.01. H8, H8 and H9 were not accepted since the P-value > 0.01.
Discussion
COVID-19 has required enormous multinational decisions in a short period, many of which have affected people’s lives in the most severe ways, so the continued development of effective coping strategies for public health in the future is very valuable. With this study, we aimed to test the PREM and validate the previously identified factors that influence a country’s perceived vulnerability to pandemic risks in order to propose a proactive risk prediction model. This should help countries to cope with the new challenges posed by pandemics in the future. Given the current COVID-19 pandemic landscape worldwide, the consequences of an inactive or delayed response are significant. The pandemic has been tested in many countries in a variety of areas. Therefore, the PREM model was developed to help countries proactively reduce their vulnerability to epidemics, especially for countries with the greatest vulnerability (as in the African region), and countries that have not been able to cope with the rapidly changing nature of the risk imposed. Using real data values to confirm the reliability of the model, this study seeks to validate the perceived variables outlined in a previous study by the lead authors.
The PREM model was derived using perceptions of risk expert participants consisting of four factors Country’s Activity Features (Factor 1), Demographic features (Factor 2), Societal Vulnerability (Factor 3) and Economic Exposure (Factor 4). The distribution of the Factors in accordance with the experts’ expectations was more even: four variables for Factor 1 and Factor 3, 3 variables for Factor 4 and the broadest Factor 2, which consists of 8 variables. Although real data provide a different distribution of factors, the broadest of these is Factor 1, which includes 11 variables out of Factors 1–3. This can be explained by the fact that experts expect the relationship between variables to be more sensitive than the data can support.47–50 Experts can tackle issues that go beyond what they have experienced, or they can learn from their experiences. Modern behavioural economists combine rich insights from psychology to understand how economic incentives and motivations change, often fundamentally, under the influence of psychological influences. The PREM model represents a behavioural analysis of incentives and motivations; social influences; heuristics, bias and risk; time and planning; and the influence of personality and emotions on decision-making.51–53
In an update of this previously developed PREM model, we revised the factor names to Country Data (NF 1), Economic Data (NF2), Social Data (NF 3), and Country Expenditure Data (NF 4) Variables (see Table 8). This is because although the variables under these factors are still the same, as previously perceived in our first model (Grima et al 2020),1 except for the variable Q14, these variables are grouped differently as can be seen in Table 8. Q14 – Hospital beds available per capita (1000 inhabitants) was excluded from the analysis because it loaded under more than one factor and the difference between the factor common variance was less than 0.10. Results revealed that the (PREM) model was found to be statistically reliable and fit for purpose.
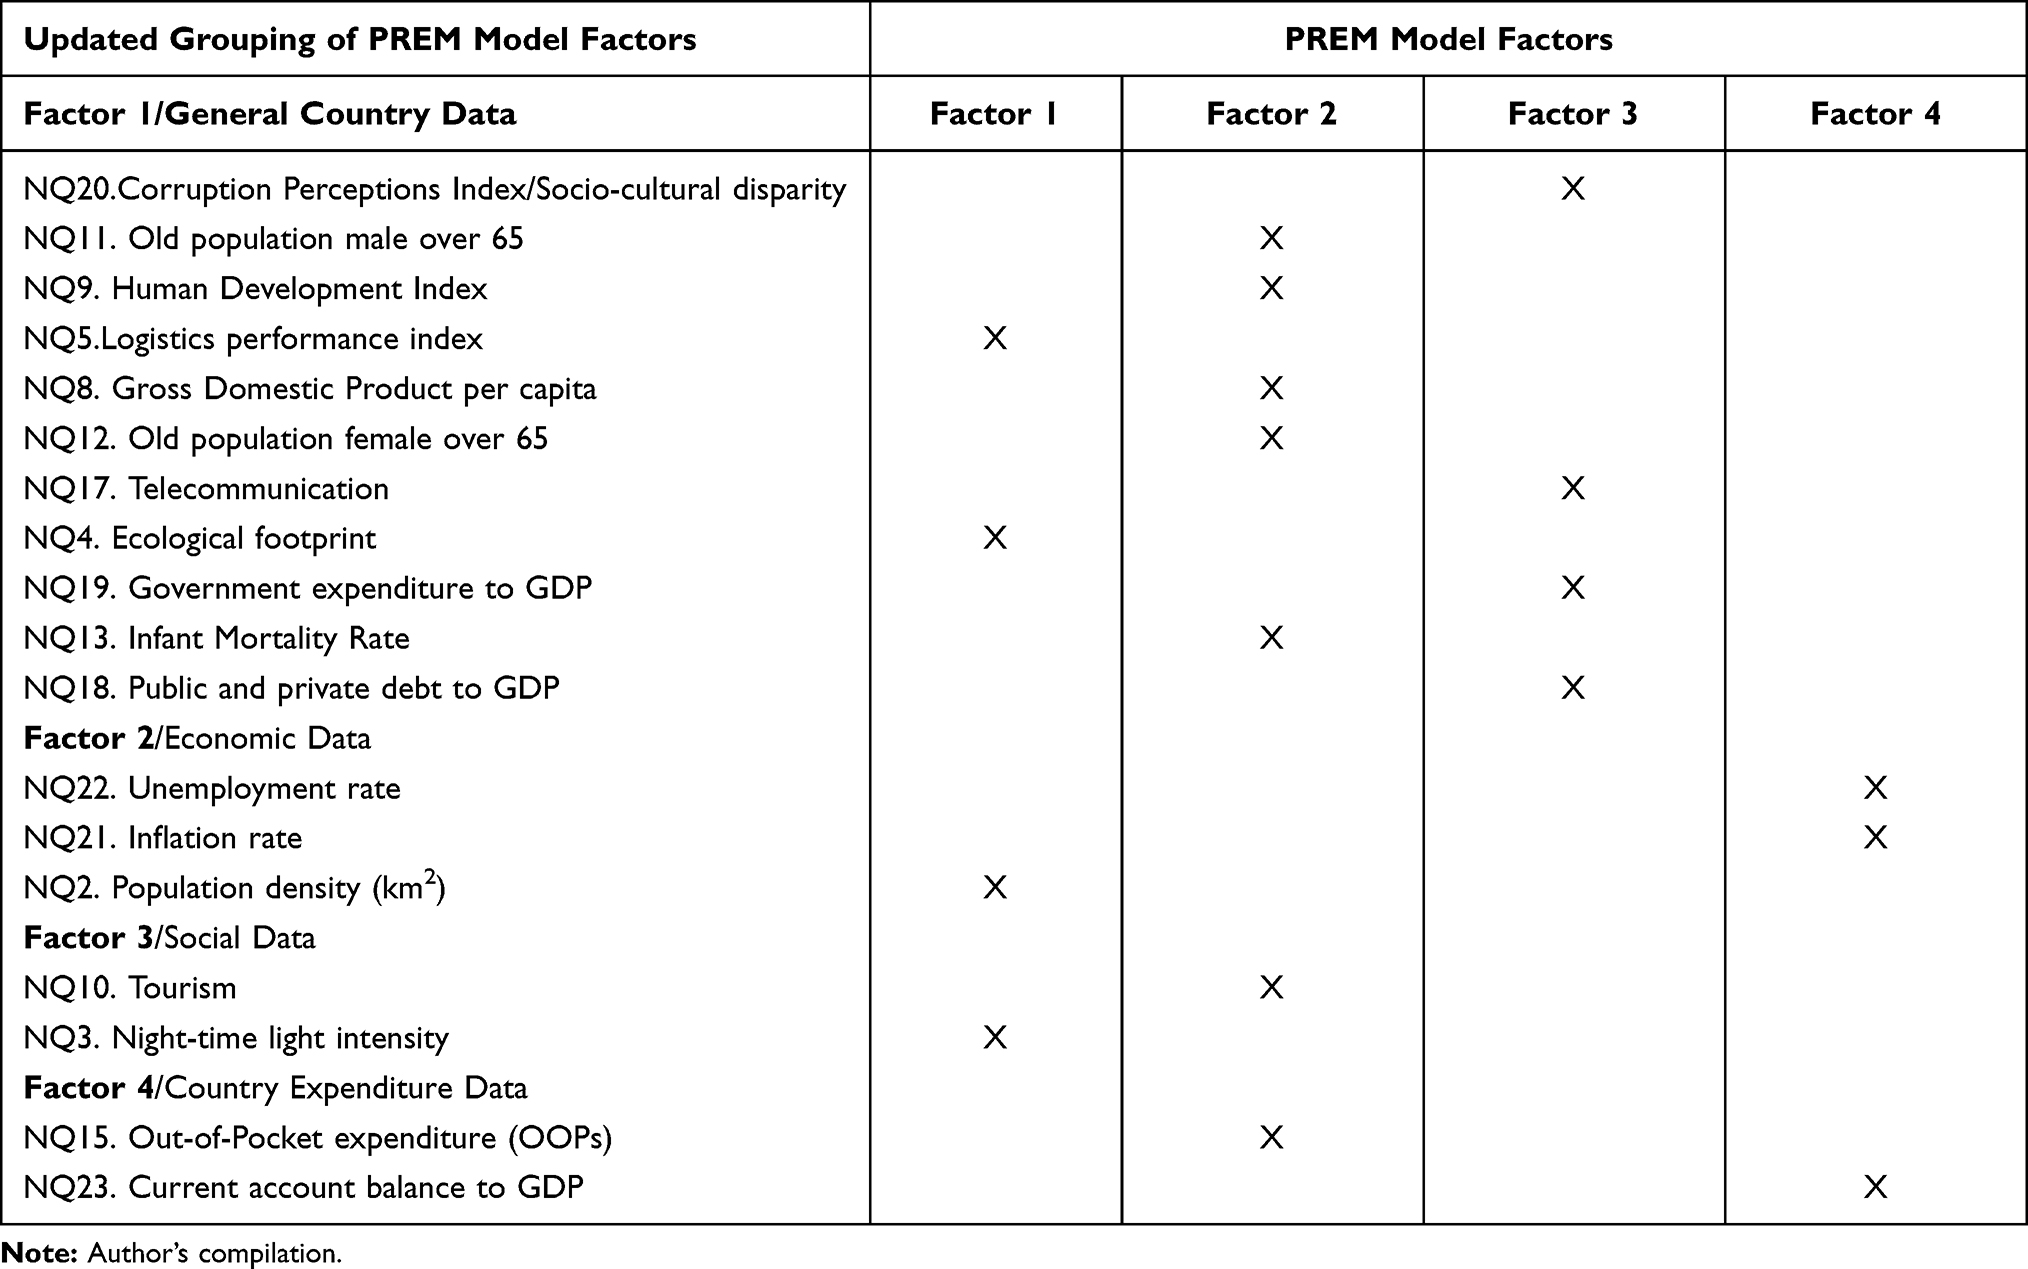 |
Table 8 Updated Grouping of PREM Model Factors |
As mentioned in the methodology section, the study is based on real data from 154 countries, which was used to validate the initial model proposed by Grima et al.1 Based on the analysis done, we can confirm that the PREM model is statistically significant and that as part of it explains 44% of NLCC and 13% of NLCD. Using real data, the relationship of the variable “General Country Data” (Factor 1) with NLCC and NLCD is statistically significant, while “Social Data” (Factor 3) is statistically significantly associated only with NLCD. The main advantage of PREM over other proposed risk assessment models for COVID-1925,23,54,55 is that it allows for a proactive approach, which aims at risk management by identifying countries’ vulnerability to the pandemic.
Although we tried as much as possible to address the limitations encountered in our study, some limitations were inevitable. Although, the number of countries in our sample is satisfactory for this research (relying on the rule of thumb as proposed by Hinkin (1995),56 who notes that an ideal sample size should have an item-to-response ratio ranging from 1:4 to 1:10, therefore a minimum sample size of 84 and a maximum sample size of 210) it would be useful to include all countries in the study. Unfortunately, data for these countries are not publicly available resulting in missing data. In addition, it would be interesting to study which factors have a greater impact on different continents or groups of countries with common cultural characteristics, such as religion, income level, and so on.
Conclusion
Supported by the work carried out previously by Grima et al,1 the study has moved from a conclusion based on perception to one rooted in reality. By proposing a model that allows governments and policymakers to take a proactive approach, the impact of a pandemic on the functioning of a country can be reduced. The PREM model we have developed is useful for policymakers, risk managers and legislators to understand what factors make the country more vulnerable to a pandemic and, if possible, to manage or set tolerances, limits, regulations, or guidelines as part of a preventive measure. (In this context, note that the more the score tends toward 5, the more vulnerable a country is, and the more the score tends toward 1, the less vulnerable it is.) Policymakers would need to retrieve their country scores so that the data input into the model indicates where the country is “suffering” the most, and in which area the country should either be supported with additional resources or where it should improve its response. We can therefore conclude that the PREM model will help to manage emerging health, social and economic needs so that timely proactive action can be taken to ensure continuity and sustainability of the norm as we know it.
Funding
Underlying research efforts behind this contribution have been partially funded through Grant Em-CEAS of The Science Fund of the Republic of Serbia and Grant OI175014 of the Ministry of Education Science and Technological Development of the Republic of Serbia.
Disclosure
The authors report no conflicts of interest in this work.
References
1. Grima S, Kizilkaya M, Rupeika-Apoga R, et al. Country pandemic risk exposure measurement model. RMHP. 2020;13:2067–2077. doi:10.2147/RMHP.S270553
2. Sun Z, Di L, Sprigg W, et al. Community venue exposure risk estimator for the COVID-19 pandemic. Health Place. 2020;66:102450. doi:10.1016/j.healthplace.2020.102450
3. Cartaxo ANS, Barbosa FIC, de Souza Bermejo PH, et al. The exposure risk to COVID-19 in most affected countries: a vulnerability assessment model. PLoS One. 2021;16(3):e0248075. doi:10.1371/journal.pone.0248075
4. Dashraath P, Wong JLJ, Lim MXK, et al. Coronavirus disease 2019 (COVID-19) pandemic and pregnancy. Am J Obstet Gynecol. 2020;222(6):521–531. doi:10.1016/j.ajog.2020.03.021
5. Atnafie SA, Anteneh DA, Yimenu DK, et al. Assessment of exposure risks to COVID-19 among frontline health care workers in Amhara Region, Ethiopia: a cross-sectional survey. PLoS One. 2021;16(4):e0251000. doi:10.1371/journal.pone.0251000
6. COVID live update: 222,137,140 cases and 4,592,436 deaths from the coronavirus - worldometer. Available from: https://www.worldometers.info/coronavirus/.
7. Ruger JP, Yach D. The global role of the world health organization. Glob Health Gov. 2009;2(2):1–11.
8. The World Health Organization’s role in combatting the COVID-19 pandemic: a brief overview global Council for Science and the Environment (GCSE). Available from: https://www.gcseglobal.org/gcse-essays/world-health-organizations-role-combatting-covid-19-pandemic-brief-overview.
9. IHR Monitoring and Evaluation Framework. Strategic partnership for health Security and Emergency Preparedness (SPH) portal. Available from: https://extranet.who.int/sph/ihr-monitoring-evaluation.
10. Implementation of the International Health Regulations (2005): draft five-year global strategic plan to improve public health preparedness and response, 2018–2023: draft decision reflecting the outcome of an informal consultation of Member States. World Health Organization; 2018. Available from: https://apps.who.int/iris/handle/10665/277270. Accessed November 18, 2021.
11. World Health Organization. International health regulations (2005): state party self-assessment annual reporting tool. World Health Organization; 2018. Available from: https://apps.who.int/iris/handle/10665/272432.
12. e-SPAR Public. Available from: https://extranet.who.int/e-spar/Home/Capacity.
13. Wynants L, Calster BV, Collins GS, et al. Prediction models for diagnosis and prognosis of covid-19: systematic review and critical appraisal. BMJ. 2020;369:m1328. doi:10.1136/bmj.m1328
14. DeCaprio D, Gartner J, Burgess T, et al. Building a COVID-19 vulnerability index; 2020. Available from: https://ui.adsabs.harvard.edu/abs/2020arXiv200307347D.
15. Zaidi SH, Rupeika-Apoga R. Liquidity synchronization, its determinants and outcomes under economic growth volatility: evidence from emerging asian economies. Risks. 2021;9(2):43. doi:10.3390/risks9020043
16. Rodriguez-Morales AJ, Cardona-Ospina JA, Gutiérrez-Ocampo E, et al. Clinical, laboratory and imaging features of COVID-19: a systematic review and meta-analysis. Travel Med Infect Dis. 2020;34:101623. doi:10.1016/j.tmaid.2020.101623
17. Imran A, Posokhova I, Qureshi HN, et al. AI4COVID-19: AI enabled preliminary diagnosis for COVID-19 from cough samples via an app; 2020. Available from: https://ui.adsabs.harvard.edu/abs/2020arXiv200401275I.
18. Wang S, Zha Y, Li W, et al. A fully automatic deep learning system for COVID-19 diagnostic and prognostic analysis. Eur Respir J. 2020;56(2):2000775. doi:10.1183/13993003.00775-2020
19. Ucar F, Korkmaz D. COVIDiagnosis-Net: deep Bayes-SqueezeNet based diagnosis of the coronavirus disease 2019 (COVID-19) from X-ray images. Med Hypotheses. 2020;140:109761. doi:10.1016/j.mehy.2020.109761
20. Barda N, Riesel D, Akriv A, et al. Performing risk stratification for COVID-19 when individual level data is not available – the experience of a large healthcare organization. medRxiv. 2020. doi:10.1101/2020.04.23.20076976
21. Gilbert M, Pullano G, Pinotti F, et al. Preparedness and vulnerability of African countries against importations of COVID-19: a modelling study. Lancet. 2020;395(10227):871–877. doi:10.1016/S0140-6736(20)30411-6
22. Kandel N, Chungong S, Omaar A, et al. Health security capacities in the context of COVID-19 outbreak: an analysis of International Health Regulations annual report data from 182 countries. Lancet. 2020;395(10229):1047–1053. doi:10.1016/S0140-6736(20)30553-5
23. Moore M, Gelfeld B, Okunogbe AT, et al. Identifying future disease hot spots: infectious disease vulnerability index. RAND Corporation; 2016. Available from: https://www.rand.org/pubs/research_reports/RR1605.html.
24. IBGE. Países. Available from: https://paises.ibge.gov.br/#/.
25. DataBank. The world bank. Available from: https://databank.worldbank.org/home.aspx.
26. Universal health coverage. Available from: https://www.who.int/data/gho/data/major-themes/universal-health-coverage-major/GHO/universal-health-coverage.
27. Mehta M, Julaiti J, Griffin P, et al. Early stage machine learning–based prediction of US county vulnerability to the COVID-19 pandemic: machine learning approach. JMIR Public Health Surveill. 2020;6(3):e19446. doi:10.2196/19446
28. Countries by density; 2021. Available from: https://worldpopulationreview.com/country-rankings/countries-by-density.
29. NOAA/NGDC - earth observation group - defense meteorological satellite program, boulder. Available from: https://ngdc.noaa.gov/eog/dmsp/download_nldi.html.
30. Logistics performance index: quality of trade and transport-related infrastructure (1=low to 5=high) | data. Available from: https://data.worldbank.org/indicator/LP.LPI.INFR.XQ.
31. GDP per capita (current US$) | data. Available from: https://data.worldbank.org/indicator/NY.GDP.PCAP.CD.
32. Human development reports. Available from: http://hdr.undp.org/en/indicators/137506#.
33. World travel and tourism council data - knoema.com. Knoema. Available from: https://knoema.com//WTTC2019/world-travel-and-tourism-council-data.
34. Population ages 65 and above, male (% of male population) | data. Available from: https://data.worldbank.org/indicator/SP.POP.65UP.MA.ZS.
35. Population ages 65 and above, female (% of female population) | data. Available from: https://data.worldbank.org/indicator/SP.POP.65UP.FE.ZS.
36. Mortality rate, infant (per 1000 live births) | data. Available from: https://data.worldbank.org/indicator/SP.DYN.IMRT.IN.
37. covid-19-data/public/data at master · owid/covid-19-data. GitHub. Available from: https://github.com/owid/covid-19-data.
38. Out-of-pocket expenditure (% of current health expenditure) | data. Available from: https://data.worldbank.org/indicator/SH.XPD.OOPC.CH.ZS.
39. Digital 2021 April statshot report. datareportal – global digital insights. Available from: https://datareportal.com/reports/digital-2021-april-global-statshot.
40. Domestic credit to private sector (% of GDP) | data. Available from: https://data.worldbank.org/indicator/FS.AST.PRVT.GD.ZS.
41. World economic outlook database. IMF; 2021. Available from: https://www.imf.org/en/Publications/WEO/weo-database/2021/April.
42. Corruptions perceptions index 2014 for Denmark. transparency.org. Available from: https://www.transparency.org/en/cpi/2014.
43. Altunışık R, Coşkun R, Bayraktaroğlu S, et al. Sosyal Bilimlerde Araştırma Yöntemleri SPSS Uygulamalı[SPSS applied research methods in social sciences]. Serdivan: Sakarya Kitabevi; 2017. Available at https://www.researchgate.net/profile/Recai-Coskun/publication/320372550_Sosyal_Bilimlerde_ARASTIRMA_YONTEMLERI_SPSS_Uygulamali/links/59e076ef458515371611c507/Sosyal-Bilimlerde-ARASTIRMA-YOeNTEMLERI-SPSS-Uygulamali.pdf. Accessed November 18, 2021.Turkish.
44. Kalaycı Ş, editor. SPSS Uygulamalı Çok Değişkenli Istatistik Teknikleri [SPSS Applied Multivariate Statistics Techniques]. Ankara: Asil Yayın Dağıtım; 2010. Turkish. ISBN:9786051221533
45. Jöreskog KG, Sörbom D. LISREL 8 User’s Reference Guide. Scientific Software International; 1993.
46. Schumacker RE, Lomax RG. A Beginner’s Guide to Structural Equation Modeling:.
47. Kaplan S. Expert information’ versus ‘expert opinions’. Another approach to the problem of eliciting/ combining/using expert knowledge in PRA. Reliab Eng Syst Saf. 1992;35(1):61–72. doi:10.1016/0951-8320(92)90023-E
48. De Grauwe P, Ji Y. Behavioural economics is useful also in macroeconomics: the role of animal spirits. Comp Econ Stud. 2018;60(2):203–216. doi:10.1057/s41294-018-0061-9
49. Manalo IF, Gilbert KE, Wu JJ. Survey of trends and gaps in dermatologists’ cardiovascular screening practices in psoriasis patients: areas still in need of improvement. J Am Acad Dermatol. 2015;73(5):872–874.e4. doi:10.1016/j.jaad.2015.07.029
50. Rupeika-Apoga R, Solovjova I. Profiles of SMEs as borrowers: case of Latvia. Contemp Stud Econ Financ Anal. 2016;98:63–76. doi:10.1108/S1569-375920160000098005
51. Chang K-P. Behavioral Economics versus Traditional Economics: Are They Very Different? Social Science Research Network; 2019; doi:10.2139/ssrn.3350088
52. Schläpfer F, Getzner M. Beyond current guidelines: a proposal for bringing behavioral economics to the design and analysis of stated preference surveys. Ecol Econ. 2020;176:106720. doi:10.1016/j.ecolecon.2020.106720
53. Girlando A, Grima S, Boztepe E, et al. Individual risk perceptions and behavior. In: Grima S, Özen E, Boz H, editors. Contemporary Studies in Economic and Financial Analysis. Emerald Publishing Limited; 2021:367–436. doi:10.1108/S1569-375920210000106023
54. Rakhsha A, Azghandi S, Taghizadeh-Hesary F. COVID-19 pandemic and patients with cancer: the protocol of a clinical oncology center in Tehran, Iran. Rep Pract Oncol Radiother. 2020;25(5):765–767. doi:10.1016/j.rpor.2020.07.001
55. Siavashpour Z, Taghizadeh-Hesary F, Rakhsha A. Recommendations on management of locally advanced rectal cancer during the COVID-19 pandemic: an Iranian consensus. J Gastrointest Cancer. 2020;51(3):800–804. doi:10.1007/s12029-020-00454-4
56. Hinkin TR. A review of scale development practices in the study of organizations. J Manage. 1995;21(5):967. doi:10.1177/014920639502100509
 © 2021 The Author(s). This work is published and licensed by Dove Medical Press Limited. The
full terms of this license are available at https://www.dovepress.com/terms
and incorporate the Creative Commons Attribution
- Non Commercial (unported, 3.0) License.
By accessing the work you hereby accept the Terms. Non-commercial uses of the work are permitted
without any further permission from Dove Medical Press Limited, provided the work is properly
attributed. For permission for commercial use of this work, please see paragraphs 4.2 and 5 of our Terms.
© 2021 The Author(s). This work is published and licensed by Dove Medical Press Limited. The
full terms of this license are available at https://www.dovepress.com/terms
and incorporate the Creative Commons Attribution
- Non Commercial (unported, 3.0) License.
By accessing the work you hereby accept the Terms. Non-commercial uses of the work are permitted
without any further permission from Dove Medical Press Limited, provided the work is properly
attributed. For permission for commercial use of this work, please see paragraphs 4.2 and 5 of our Terms.