Back to Journals » International Journal of General Medicine » Volume 14
A Preliminary Study on the Feasibility of the Quantitative Parameters of Dual-Energy Computed Tomography Enterography in the Assessment of the Activity of Intestinal Crohn’s Disease
Authors Xiao W, Zhu Y, Zhang Z, Luo M, Ma M
Received 6 August 2021
Accepted for publication 13 September 2021
Published 21 October 2021 Volume 2021:14 Pages 7051—7058
DOI https://doi.org/10.2147/IJGM.S331763
Checked for plagiarism Yes
Review by Single anonymous peer review
Peer reviewer comments 2
Editor who approved publication: Dr Scott Fraser
Wei-xiong Xiao,* Yu-ting Zhu,* Zhi-chao Zhang, Min Luo, Ming-ping Ma
Department of Radiology, Fujian Provincial Hospital, Provincial Clinical College of Fujian Medical University, Fuzhou, People’s Republic of China
*These authors contributed equally to this work
Correspondence: Min Luo; Ming-ping Ma
Department of Radiology, Fujian Provincial Hospital, Provincial Clinical College of Fujian Medical University, No. 134 East Street, Gulou District, Fuzhou, 350001, People’s Republic of China
Tel +86 59187557768
Email [email protected]
Objective: To investigate the value of dual energy CT enterography (DECTE) in evaluating the activity of Crohn’s disease (CD).
Methods: The endoscopy and imaging data of 29 patients with CD confirmed by clinic and pathology were analyzed retrospectively. The clinical CD activity index (CDAI) was used as the disease activity grouping standard, 29 patients with CD were grouped into activity groups, 18 patients in the active group (CDAI ≥ 150) with 36 intestinal segments, and 11 patients in the remission group (CDAI < 150) with 20 intestinal segments.The virtual single energy CT value, slope of energy spectrum curve and iodine content were analyzed to evaluate the evaluation of intestinal CD activity by DECTE.
Results: There were statistically significant differences in virtual single energy CT value (except 90 keV and 100 keV virtual single energy CT value), curve slope and iodine content between remission group and active group (P < 0.05), and has more diagnostic value for active phase (AUC > 0.5). ① Virtual single energy CT value: the AUC of 60 keV in arterial phase was the highest (0.924). The specificity of diagnosing CD in active stage was high (95%). ② Curve slope: the AUC of portal vein phase was the largest (0.731). The specificity of diagnosing CD in active stage was higher (85%). ③ Iodine content: the AUC of arterial phase was the highest (0.885). The specificity of diagnosing CD lesions in the active stage was 100%.
Conclusion: The virtual single energy CT value, energy spectrum curve slope and iodine content can provide reference for clinical accurate diagnosis of CD activity.
Keywords: Crohn’s disease, computed tomography, dual energy CT, virtual single
Introduction
Crohn’s disease (CD) is a chronic granulomatous disease of unknown origin that alternates between exacerbation and remission, with gastrointestinal disease as a clinical manifestation. According to the guidelines,1 The diagnosis of CD is based on a combination of clinical presentation and endoscopic, radiologic, histologic, and pathologic findings that demonstrate some degree of focal, asymmetric, and transmural granulomatous inflammation of the luminal GI tract and the clinical treatment options during active and remission stages of CD should differ.The active phase can be treated with amino salicylic acid agents, immunosuppressive agents, biological agents alone or in combination with systemically acting hormones to induce remission depending on the degree of CD activity, and patients with complex severe CD can be treated with surgical interventions.
The small bowel is one of the most common areas affected by inflammation in patients with CD. Much of the inflammation is beyond the reach of standard endoscopic evaluation. Therefore, the correct determination of the active and remission stages through imaging information can help in the selection of appropriate treatment, especially for those patients with contraindication to endoscopic evaluation. CTE has a reported sensitivity as high as 90% in detecting lesions associated with CD. While MRE has similar sensitivity to CTE with wall enhancement, mucosal lesions, and T2 hypersensitivity as suggestive of intestinal inflammation.1,2
Dual-energy computed tomography enterography (DECTE) uses the difference in virtual monoenergetic CT values of different substances to localize and capture an image of an irradiated object in two-dimensional energy space. The most commonly used base substance pairs are iodine and water. The decomposition algorithm can be used to calculate the relative contribution of iodine and water components within a substance, thus enabling the identification and quantitative analysis of the properties of the substance.
Although the activity of CD varies with the degree of congestion, edema, and fibrosis of the intestinal wall, material separation and quantitative analysis can be achieved through DECTE. The present study aimed to investigate the value and feasibility of the quantitative parameters of DECTE in the assessment of the activity of intestinal CD in both its remission and active stages.
Materials and Methods
Subjects
The data of 29 patients (Table 1) diagnosed with CD between July 1, 2016, and December 31, 2019, in the Department of Gastroenterology, Fujian Provincial Hospital, were retrospectively collected and subjected to double-phase DECTE enhancement scans. In each patient, the diseased intestinal segments (mucosal hyperenhancement, wall thickening (small intestine ≥3mm, large intestine ≥5mm), mural stratification with a prominent vasa recta (comb sign), mesenteric fat stranding, and Extra-intestinal complications (fistulas, peri-intestinal abscesses)1–5)was selected for the observation group (when there was more than one diseased segment, up to four segments were selected at the same time), and the normal intestinal segments (with an intestinal lumen diameter of <2.5 cm and intestinal wall thickness of <3 mm without morphological signs of CD) were selected for the control group, resulting in a total of 56 segments being included.
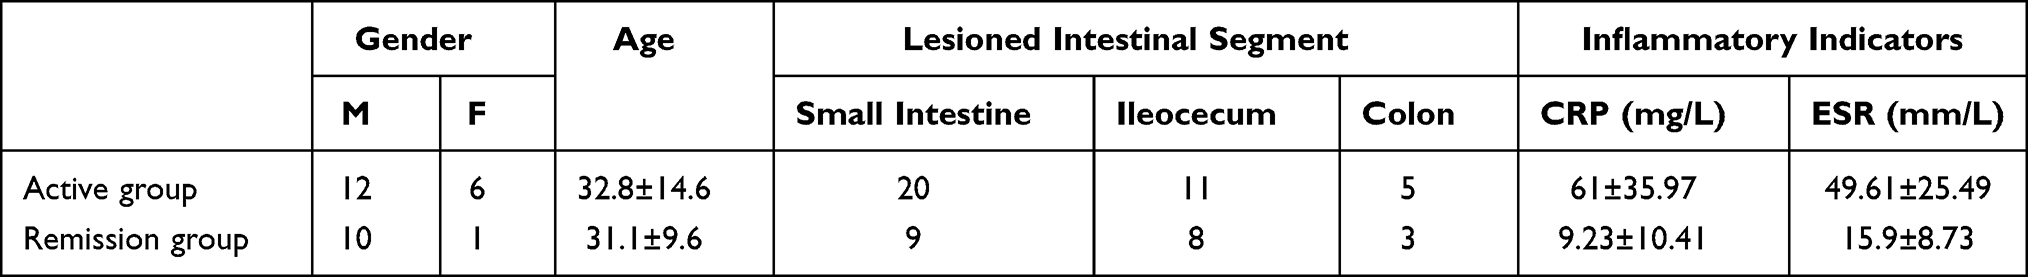 |
Table 1 Summary of Clinical Information Related to a Total of 56 Intestinal Segments in 29 Crohn’s Patients |
Inclusion criteria: (1) Patients who met the diagnostic criteria for CD as recommended by the American Gastrointestinal Association’s clinical guidelines (2018);1 (2) patients without contraindications for enhanced CT scanning.
Exclusion criteria: (1) Patients with a history of surgical resection; (2) patients who underwent a capsule endoscopy to examine their small intestine but failed to discharge the capsule, or patients with any obvious local image artifacts that might affect observation; (3) patients with poor bowel preparation that might affect observation and measurement.
The present study complied with the ethical principles of medical research set out in the Declaration of Helsinki and was approved by the ethics committee of Fujian Provincial Hospital.
Examination Methods
Preparation before the examination: (1) One day before the examination, the patient was fed a semi-liquid diet with little residue and received intestinal preparation. (2) 1.5 hours before the examination, 1500 mL of 2% isotonic mannitol solution was administered orally to the patient (in the case of no contraindication) to fill the stomach and duodenum. (3) 15 minutes before the examination, the patient (in the case of no contraindication) was given an intramuscular injection of 20 mg of anisodamine (654–2) to inhibit intestinal motility. (4) 800 mL of 2% mannitol solution was infused through the patient’s anal canal to fill the colon (in the case of no contraindication). Bowel preparation was not conducted in patients with intestinal obstruction, and the examination was conducted under gastrointestinal decompression. For patients with a weak constitution, the enema was conducted without the oral administration of isotonic mannitol solution.
A Somatom Force dual-source CT (Siemens, Germany) was used for the scans. The patient was instructed to hold their breath, and volume scanning was conducted from the top of the diaphragm to the symphysis pubis.
Parameters of the DECTE scanning: The A/B tube voltage was Sn80 kVp/Sn150 kVp, respectively, and the A/B tube current was 130 mAs/65 mAs, respectively. The speed was 0.5 s/r, and the pitch was 0.6. 1.2 mL/kg of the contrast agent ioversol (320 mg/mL). 15 mL of 0.9% NaCl solution was used for the enhancement scanning. After scanning, the reconstructed thin-layer data with a thickness of 1.5 mm were transferred to a post-processing workstation (syngo.via VB10, Siemens, Germany) for dual-energy image data analysis.
Image Analysis and Processing
The results of the clinical disease activity index (CDAI) were completed independently by a physician with associate seniority or higher in the Department of Gastroenterology. The DECTE results were completed by two residents and the associate chief of the Department of Radiology. The target bowel segment was determined by two residents independently; when there was disagreement on the selected target segment, the final decision was made by the associate chief physician through a review of the films. Both examinations used a double-blind method.
The scanned arterial phase and portal phase Sn80 kVp and Sn150 kVp images were transferred to a Siemens post-processing workstation (syngo.via VB10) with the adoption of the dual-energy module. The monoenergetic module was selected for energy-spectrum analysis, and the most obvious lesion on the mesenteric side of the observation group in transverse, coronal, or sagittal position was selected. A circular region of interest (ROI) with a range of 70–80% of the overall intestinal wall was outlined, with avoidance of the tissues outside the intestinal wall. The energy spectrum curve was automatically drawn by the system, and the CT values of 40–100keV were measured with adjustment of keV. The liver NVC module was used to obtain an iodine chart, and the appropriate ROI was selected. The same processing was performed on the segments in the control group at the same time. Measurements were taken three times by two residents independently and consecutively in three layers, and the mean of both was recorded.
Statistical Analysis
SPSS 25.0 was used for data processing. A Shapiro–Wilk test was used to test the normality of all measured data, and those conforming to a normal distribution were described as mean ± standard deviation; those that did not were described as median ± interquartile range. An independent sample t-test or a Mann–Whitney U-test was used to compare the different virtual monoenergetic CT values, the slope of energy-spectrum curve K, and iodine content. P = 0.05 was considered the standard value. The receiver operating curve (ROC) was plotted and the area under the curve (AUC Area Under Curve) calculated.
Results
Clinical Data
Data concerning age, gender, disease duration, CDAI, C-reactive protein (CRP), erythrocyte sedimentation rate (ESR), and type of diseased intestinal segment were collected from the enrolled patients. Of the 29 cases that were enrolled, 22 were male and 7 were female. The ages of the enrolled patients ranged between 15 and 80 years, with an average age of 32.8 ± 12.8 years. The disease duration ranged between 0.5 and 10 years, with an average duration of 3.7 ± 3.0 years. Of the 56 diseased intestinal segments included, 29 were from the small intestine, 19 were ileocecal, and 8 were from the colon. A total of 36 bowel segments were placed in the active group (CDAI ≥ 150), with an average CRP of 61 ± 35.97 mg/L and an average ESR of 49.61 ± 25.49 mm/L, and a total of 20 segments were placed in the remission group (CDAI < 150), with an average CRP of 9.23 ± 10.41 mg/L and an average ESR of 15.9 ± 8.73 mm/L.
Image Data
Comparison of Different Virtual Monoenergetic CT Values, The Slope of Energy-Spectrum Curve K, and Iodine Content Between the Control Group (The Normal Intestinal Segments) and the Observation Group (The Diseased Intestine Segments) (Table 2)
Analysis of the characteristics of the DECTE intestinal wall energy spectrum (Figures 1F, J, 2F and J) revealed that the CT value of the intestinal wall in the virtual monoenergetic map in the observation group decreased with the increase of keV; the decrease was faster between 40 and 100 keV, with a larger slope, and the slope between 100 and 190 keV was parallel to the horizontal axis. The curves of the two phases of the intestinal wall in the control group were close in position and were all located below the curves of the intestinal wall in the observation group. The comparison suggested that there were statistically significant differences between the observation group and the control group in the virtual monoenergetic CT values, the slope of energy-spectrum curve K, and iodine content.
 |
Table 2 Summary of Different Virtual Single Energy CT Values, Slope K of Energy Spectrum Curve and Iodine Content in Diseased Intestine and Normal Intestine |
 |
Figure 1 A 27-year-old male patient with the main complaint of a change in the nature of his stools and abdominal pain for more than two years. CDAI = 80.1 (remission stage). (A and B) show the endoscopic manifestations: the pentagonal markers indicate white scars and triangular markers indicate pseudogranulomas. (C and D) show the virtual monoenergetic charts, in the arterial phase, of 40 keV and 100 keV, respectively; the CT values of the diseased intestinal segment (pink arrow) were 186.8 HU and 67.7 HU, respectively. (G and H) show the virtual monoenergetic charts, in the portal phase, of 40 keV and 100 eV, respectively; the CT values of the diseased intestinal segment (pink arrow) were 271.3 HU and 78 HU, respectively. (E and I) show the iodograms in the arterial and portal phase, respectively; the iodine contents of the diseased intestinal segment (pink arrow) were 2.1 mg/mL and 2.9 mg/mL, respectively. (F and J) show the arterial and portal energy-spectrum curves, respectively, with the diseased bowel segment at the top and the normal bowel segment at the bottom. |
Comparison of Different Virtual Monoenergetic CT Values, The Slope of Energy-Spectrum Curve K, and Iodine Content Between the Remission Group and the Active Group (Table 3)
No statistically significant difference was found between the remission group and the active group in the CT values of the intestinal wall at the portal phase of 90 and 100 keV (P > 0.05 in both). There were, however, statistically significant differences in the CT values, slope of energy-spectrum curve K, and iodine content of the intestinal wall at other keVs (P < 0.05 in all), and the CT values, slope of energy-spectrum curve K, and iodine content of the intestinal wall were higher in the active group than in the remission group.
 |
Table 3 Comparison of Different Virtual Single Energy CT Values, K and Iodine Contents in the Intestinal Wall Between the Remission Group and the Active Group |
A 27-year-old male patient with the main complaint of a change in the nature of his stools and abdominal pain for more than two years. CDAI = 80.1 (remission stage), with endoscopy, pathology, arterial phase 40 and 100 Kev virtual monoenergetic images and iodine map (Figure 1A–E, G–I).Meanwhile,A 32-year-old male patient with the main complaint of recurrent abdominal pain for more than a year. CDAI = 380 (active stage), with endoscopy, pathology, arterial phase 40 and 100 Kev virtual monoenergetic images and iodine map (Figure 2A–E, G–I). In the active group, the enhancement of the “diseased bowel wall” at 40 Kev in the arterial phase was more pronounced than in the remission group, and iodine content of the intestinal wall were higher in the active group than in the remission group.
 |
Figure 2 A 32-year-old male patient with the main complaint of recurrent abdominal pain for more than a year. CDAI = 380 (active stage). (A and B) show the endoscopic manifestations: the pentagonal markers indicate congestion and edema. (C and D) show the virtual monoenergetic charts, in the arterial phase, of 40 keV and 100 keV, respectively; the CT values of the diseased intestinal segment (pink arrow) were 303.5 HU and 67.1 HU, respectively. (G and H) show the virtual monoenergetic charts, in the portal phase, of 40 keV and 100 keV, respectively; the CT values of the diseased intestinal segment (pink arrow) were 314.5 HU and 73.1 HU, respectively. (E and I) show the iodograms in the arterial and portal phase, respectively; the iodine contents of the diseased intestinal segment (pink arrow) were 3.3 mg/mL and 3.6 mg/mL, respectively. (F and J) show the arterial and portal energy-spectrum curves, respectively, with the diseased bowel segment at the top and the normal bowel segment at the bottom. |
The Values of Different Virtual Monoenergetic CT Values, The Slope of Energy-Spectrum Curve K, and Iodine Content in the Assessment of the Activity of CD (Table 4)
The ROC curves (Figure 3) of the three quantitative parameters in the active group and remission group were plotted separately. The results suggested that virtual monoenergetic CT values, energy-spectrum curve K, and iodine content were of higher diagnostic value in the active stage of CD than in the remission stage (AUC > 0.5 in all).
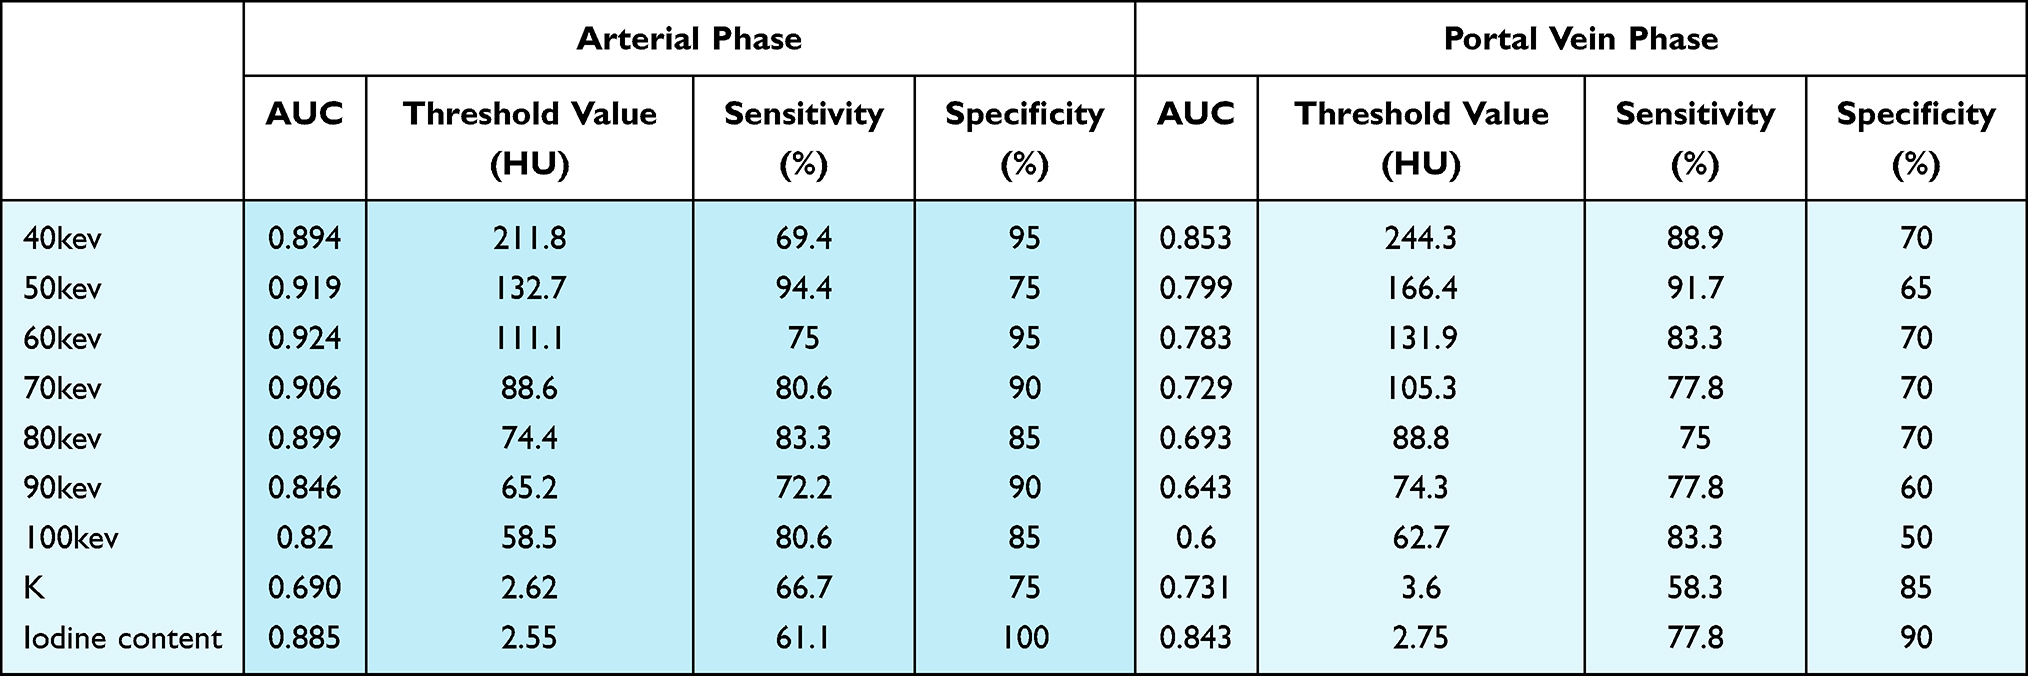 |
Table 4 The Value of Different Virtual Single Energy CT Values, K and Iodine Content in the Assessment of CD Activity in Arterial and Portal Phases |
 |
Figure 3 ③ and ④ show the ROC curves of the virtual monoenergetic CT values, slope of the energy-spectrum curve, and iodine content in the active stage and in the remission stage, respectively. |
Different virtual monoenergetic CT values: At 60 keV in the arterial phase, the different virtual monoenergetic CT values were highest at AUC = 0.924; at this time point, when the virtual monoenergetic CT value was ≥111.1 HU, the sensitivity and specificity of the virtual monoenergetic CT values for diagnosing the bowel segment in patients with CD in the active stage were 75% and 95%, respectively.
Energy-spectrum curve K: In the portal phase, the slope of the energy-spectrum curve K was highest at AUC = 0.731; at this time point, when K was ≥3.6, the sensitivity and specificity of the energy-spectrum curve K for diagnosing the bowel segment in patients with CD in the active stage were 58.3% and 85%, respectively.
Iodine content: In the arterial phase, the iodine content was highest at AUC = 0.885; at this time point, when iodine content was ≥2.55, the sensitivity and specificity of the iodine content for diagnosing the bowel segment in patients with CD in the active stage were 61.1% and 100%, respectively. (See Figures 1–3.)
Discussion
CD is a chronic granulomatous disease of unknown etiology, and treatment options vary with different degrees of activity. Therefore, how the activity of CD is assessed is critical. Although there are numerous methods for the assessment of CD activity, there is not yet a single gold standard. CDAI is still the main scoring system for the activity of CD, but although it is used as a criterion for assessing the efficacy of drug therapy in CD, it has limitations. The CD endoscopic index of severity (CDEIS) is more refined, but it is not suitable for patients with combined intestinal strictures; it is also painful, complex, time-consuming, inconvenient, and does not allow observation of the entire intestinal wall and peristomal conditions. Ultrasound examination is convenient and fast but has higher requirements for the physician. Magnetic resonance enterography does not use radiation, but the contents of the intestinal cavity affect image quality, so greater intestinal preparation and a longer examination duration are required, leading to higher costs. CTE is also commonly used in the diagnosis of CD, but, although it has a short examination duration, the activity of CD can only be assessed using morphology.
In recent years, many studies have looked at the separation function of DECTE substances, mostly focusing on analysis and differentiation using quantitative parameters, such as iodine value and energy-spectrum profile.2–12 DECTE scanning technology offers evaluation with the adoption of morphological results and improved diagnostic accuracy with the virtual monoenergetic spectrum CT values, energy-spectrum curve slope, and iodine content of organ and tissues as well as other quantitative parameters obtained by post-processing. The increased contrast in low keV images may help with lesion identification, and the increased signal-to-noise ratio in high keV images may assist with detailed observation. Taguchi et al9 concluded that the CT values of the intestinal wall in the virtual monoenergetic chart decreased with increasing keV due to the photoelectric effect, that the sensitivity and specificity of intestinal wall CT values were higher at 40 keV, and that the portal phase was better than the arterial phase. Another study12 found that virtual scanning can replace conventional plain scanning. Therefore, DECTE scans can eliminate the need for conventional CT plain scans and two-phase enhancement, resulting in a significant reduction in scan duration and radiation dose. Moreover, the use of iodograms (iodine content graph) can quantify the blood supply to diseased tissues and more accurately reflect the changes in the blood supply of the tissue.
De Kock et al4 suggested that there was a difference in the iodine content of the intestinal wall between the active and remission stages of CD, and Liu et al11 suggested that iodine values in dual-energy CT parameters might reflect CD activity to some extent. The present study indicates that the reason for this might be that the formation of inflammatory congestion, inflammatory cell infiltration, and non-caseous granuloma in the diseased intestinal wall could lead to changes in the tissue type of the intestinal wall. The degree of mucosal injury, intestinal wall congestion, edema, and fibrosis in the diseased intestinal segment during the remission stage and the active stage of CD might also be different, which would make the intestinal wall’s absorption and attenuation to X-rays different between the observation group and the control group and between the remission group and the active group, resulting in different characteristics of the energy spectrum. The difference in blood supply to the intestinal wall between the observation group and the control group and between the remission group and the active group might also lead to differences in the iodine content of the examined tissues. In this study, in addition to investigating the differences in energy spectrum curves and slopes between “diseased bowel segments” and “normal bowel segments”, we also further investigated the differences in energy spectrum curves and slopes between the active and remission groups and their values for assessing CD activity.
The present study found that the virtual monoenergetic CT values, slope of the energy-spectrum curve, and iodine content were higher in the active stage of CD than in the remission stage, probably because the combing sign was obvious in the active stage of CD, with the intestinal wall being inflamed and congested and an increased blood supply and iodine content in the tissues, resulting in higher CT values. In the remission stage, the intestinal wall was mainly infiltrated by chronic inflammatory cells and fibrosis, and the degree of inflammatory congestion in the active stage was not as high, so the blood supply might not be as obvious as in the active stage and the iodine content in the tissues not as high. This was also evidenced by the presence of the combing sign during the active stage and the degree of elevated inflammatory indicators.
The present study also found that the diagnostic values of the virtual monoenergetic CT values, slope of the energy-spectrum curve, and iodine content were higher in the active stage of CD than in the remission stage. This may be due to the fact that, in the active stage of CD, the intestinal wall undergoes an acute inflammatory reaction, and the degree of increased vascular permeability, congestion, and edema of the intestinal wall is more obvious than in the remission stage; the degree of fibrosis, however, is more obvious in the remission stage than in the active stage. Peng et al6 suggested that the mucosal injury, intestinal wall congestion, edema, and fibrotic changes of intestinal segments in different active stages of CD differed and that there were differences in the quantitative parameters of dual-energy CT and the characteristics of energy-spectrum curves, which is consistent with the results of the present study. Compared to MRE, DECTE has a lower price and shorter examination time, making it easier for patients to cooperate.The DECTE scan technique provides an accurate assessment of the activity of CD patients by combining morphological signs and multiple quantitative parameters, especially for those patients with contraindication to endoscopic evaluation.
The present study had some limitations. The adoption of CDAI as a criterion for classifying the activity of CD was highly subjective, and the number of enrolled cases was limited, so further studies in prospective trials with large samples are needed.
Conclusion
CD is an inflammatory lesion of the whole intestinal wall, and its activity is closely correlated with its treatment and prognosis. The present study showed that virtual monoenergetic CT values, energy-spectrum slope, and iodine content have good diagnostic value, sensitivity, and specificity in the assessment of the activity of CD, thereby providing a reference for accurate clinical diagnosis.
Ethics Approval and Consent to Participate
This study was conducted in accordance with the declaration of Helsinki.This study was conducted with approval from the Ethics Committee of Fujian Provincial Hospital. A written informed consent was obtained from all participants.
Disclosure
The authors report no conflicts of interest in this work.
References
1. Lichtenstein GR, Loftus EV
2. Rosenfeld G, Brown J, Vos PM, Leipsic J, Enns R, Bressler B. Prospective comparison of standard- versus low-radiation-dose CT enterography for the quantitative assessment of Crohn disease. AJR Am J Roentgenol. 2018;210(2):W54–W62. doi:10.2214/AJR.17.18296
3. Chang R, Xu JX, Dong HP, et al. Value of CT spectral imaging in the evaluation of Crohn’s disease activity. Diagnostic Theory Pract. 2019;4:432–435.
4. De Kock I, Delrue L, Lecluyse C, Hindryckx P, De vos M, Villeirs G. Feasibility study using iodine quantification on dual-energy CT enterography to distinguish normal small bowel from active inflammatory Crohn’s disease. Acta Radiol. 2019;60(6):679–686. doi:10.1177/0284185118799508
5. Kim YS, Kim SH, Ryu HS, Han JK. Iodine quantification on spectral detector-based dual-energy CT enterography: correlation with Crohn’s disease activity index and external validation. Korean J Radiol. 2018;19(6):1077–1088. doi:10.3348/kjr.2018.19.6.1077
6. Peng JC, Feng Q, Zhu J, et al. Usefulness of spectral computed tomography for evaluation of intestinal activity and severity in ileocolonic Crohn’s disease. Therap Adv Gastroenterol. 2016;9(6):795–805. doi:10.1177/1756283X16668309
7. Fulwadhva UP, Wortman JR, Sodickson AD. Use of dual-energy CT and iodine maps in evaluation of bowel disease. Radiographics. 2016;36(2):393–406. doi:10.1148/rg.2016150151
8. Lee SM, Kim SH, Ahn SJ, Kang HJ, Kang JH, Han JK. Virtual monoenergetic dual-layer, dual-energy CT enterography: optimization of keV settings and its added value for Crohn’s disease. Eur Radiol. 2018;28(6):2525–2534. doi:10.1007/s00330-017-5215-z
9. Taguchi N, Oda S, Kobayashi T, et al. Advanced parametric imaging for evaluation of Crohn’s disease using dual-energy computed tomography enterography. Radiol Case Rep. 2018;13(3):709–712. doi:10.1016/j.radcr.2018.04.002
10. Wang CL, Han D, Huang YL. Feasibility study of dual energy CT spectral curve in evaluating the activity of Crohn’s disease of colon. J Clin Radiol. 2019;8:1443–1448.
11. Liu CR. Feasibility of dual source CT dual energy technique in evaluating the activity of Crohn’s disease. Kunming: Kunming Medical University; 2016: 18–21.
12. Javadi S, Elsherif S, Bhosale P, et al. Quantitative attenuation accuracy of virtual non-enhanced imaging compared to that of true non-enhanced imaging on dual-source dual-energy CT. Abdom Radiol. 2020;45(4):1100–1109. doi:10.1007/s00261-020-02415-8
 © 2021 The Author(s). This work is published and licensed by Dove Medical Press Limited. The
full terms of this license are available at https://www.dovepress.com/terms
and incorporate the Creative Commons Attribution
- Non Commercial (unported, 3.0) License.
By accessing the work you hereby accept the Terms. Non-commercial uses of the work are permitted
without any further permission from Dove Medical Press Limited, provided the work is properly
attributed. For permission for commercial use of this work, please see paragraphs 4.2 and 5 of our Terms.
© 2021 The Author(s). This work is published and licensed by Dove Medical Press Limited. The
full terms of this license are available at https://www.dovepress.com/terms
and incorporate the Creative Commons Attribution
- Non Commercial (unported, 3.0) License.
By accessing the work you hereby accept the Terms. Non-commercial uses of the work are permitted
without any further permission from Dove Medical Press Limited, provided the work is properly
attributed. For permission for commercial use of this work, please see paragraphs 4.2 and 5 of our Terms.