Back to Journals » Clinical, Cosmetic and Investigational Dermatology » Volume 16
A Preclinical Study Comparing the Activity and Potency of OnabotulinumtoxinA and PrabotulinumtoxinA
Authors Rupp DC, Canty D, Rhéaume C, Sondergaard B, Niño C, Broide RS ![]() , Brideau-Andersen AD
, Brideau-Andersen AD
Received 17 November 2022
Accepted for publication 27 February 2023
Published 8 March 2023 Volume 2023:16 Pages 581—591
DOI https://doi.org/10.2147/CCID.S397999
Checked for plagiarism Yes
Review by Single anonymous peer review
Peer reviewer comments 2
Editor who approved publication: Dr Jeffrey Weinberg
David C Rupp, David Canty, Catherine Rhéaume, Birgitte Sondergaard, Celina Niño, Ron S Broide, Amy D Brideau-Andersen
Allergan Aesthetics, an AbbVie Company, Irvine, CA, USA
Correspondence: David C Rupp, Allergan Aesthetics, an AbbVie Company, 2525 Dupont Drive, Irvine, CA, 92612, USA, Tel +1-714-246-4059, Email [email protected]
Objective: The goal of this study was to compare the unit-to-unit biological activity of the vacuum-dried formulation of prabotulinumtoxinA (prabotA) and onabotulinumtoxinA (onabotA) in preclinical assays.
Methods: Reconstituted 100 U vials of prabotA and onabotA were tested in 3 distinct assays: plate-capture light chain activity (PC-LCA), measuringlight chain enzymatic activity after recovery of toxin from reconstituted product using a proprietary toxin capture step; cell-based potency assay (CBPA), measuring the intoxication steps of binding, translocation, and light chain activity (synaptosomal-associated protein 25 [SNAP25] cleavage); and mouse Digit Abduction Score (DAS), evaluating muscle paresis. Each assay tested 3 separate prabotA and onabotA lots on several independent test dates.
Results: Multiple orthogonal assays established that when assessed on a unit-to-unit basis, the biological activity of prabotA is lower than that of onabotA. In the PC-LCA and CBPA assays, onabotA displayed 1.51 ± 0.14–fold higher (mean ± SD) and 1.33 ± 0.07–fold higher (mean of pooled lots ± SEM) activity than prabotA, respectively. Similarly, the mouse DAS data showed that onabotA had 1.4 ± 0.1–fold higher (mean ± SEM) potency than prabotA. Results of all 3 assays demonstrated differences in potency, efficacy, and duration of action between onabotA and prabotA on a unit-to-unit basis.
Conclusion: Preclinical assays established differences in the biological activity of onabotA and prabotA, supporting that the units of biological activity are not interchangeable.
Keywords: pharmaceutical preparations, biological assays, enzyme assays, animal studies, motor neurons, protein binding
Introduction
Botulinum neurotoxin serotype A (BoNT/A) blocks the release of acetylcholine at neuromuscular junctions, inhibiting neuronal signaling and resulting in temporary muscle paralysis.1–3 BoNT/A-induced paralysis has been utilized in a variety of therapeutic and aesthetic treatment applications, such as treating cervical dystonia and reducing wrinkles ingrained by facial muscles.1,2,4,5 The key steps in the BoNT/A intoxication of target muscles include neuronal cell receptor-mediated binding and internalization, translocation of the protease domain (light chain) into the cytosol, and proteolytic cleavage of the soluble N-ethylmaleimide–sensitive factor attachment receptor (SNARE) protein synaptosome-associated protein 25 substrate (SNAP25).2,6
There are several subtypes of the BoN/TA serotype, which differ in their amino acid sequence.1,2 Several commercially available BoNT/A subtype 1 (BoNT/A1) products, derived from Clostridium botulinum bacteria, are approved for therapeutic and/or facial aesthetic indications.1,4,7 These products are formulated and produced using techniques that differ across manufacturers.4,8,9 The types and concentrations of excipients (eg, serum albumin) used to add bulk and for stabilization can also vary among manufacturers.4,8,10 Toxin producers test BoNT/A1 potency in proprietary assays, specific to the manufactured product(s), in addition to having unique product release criteria.8,9 As a result, these BoNT/A1 products have distinct pharmacological dosing, duration, efficacy, diffusion, and immunogenicity characteristics.5,7,9 The clinical performance of individual BoNT/A1 preparations varies in terms of biologic activity, efficacy, and safety profiles.9,11,12
Finishing and drying are key steps in the manufacture of BoNT/A1 products.9 Drying is accomplished by lyophilization, freeze-drying, or vacuum-drying.9 Not all lyophilization, freeze-drying, and vacuum-drying processes are equivalent. Manufacturers use proprietary drying methods that can potentially influence the pharmacologic and clinical profiles of the final product.13–15
OnabotulinumtoxinA (onabotA [Botox®]; Allergan Aesthetics, an AbbVie Company, Irvine, CA, USA) was the first commercially available BoNT/A1 product, having received US Food and Drug Administration approval in 1989.7 PrabotulinumtoxinA (prabotA) is a more recently available BoNT/A1 product, originally developed by Daewoong Pharmaceutical Co., Ltd., Seoul, Korea, and currently approved for reducing the appearance of glabellar lines in the Republic of Korea (2013)16,17 and the United States (2019).18 Additionally, AEON Biopharma, Inc. is studying this formulation (as ABP-450) for therapeutic indications, such as cervical dystonia.
PrabotA, originally produced as a lyophilized product, was converted to a vacuum-dried product by Daewoong Pharmaceutical Co., Ltd. for commercialization in Europe, Canada, and the United States.19 Because manufacturing processes can affect the clinical performance of BoNT/A1 products, the current study was conducted to compare the biological activity and durability between the well-established onabotA and the newer BoNT/A1 formulation, prabotA, both of which are vacuum-dried,19,20 using several in vitro and in vivo assays, including plate-capture light chain activity high-performance liquid chromatography (PC-LCA-HPLC), cell-based potency assay (CBPA), and mouse Digit Abduction Score (DAS) assay. To strengthen the statistical implications of the results, this study evaluated separate lots of prabotA and onabotA on multiple test dates.
Methods
Each BoNT/A1 product, onabotA and prabotA, was tested in triplicate on separate dates, with the 100 U vial presentation of each product used in all assays.
PC-LCA-HPLC
BoNT/A light chain activity was measured after toxin was recovered from reconstituted product using an established PC-LCA-HPLC method.21 Greater light chain activity corresponds to greater biological activity with respect to cleavage of SNAP25 and disruption of neuronal signaling.21,22 BoNT/A substrate derived from the SNAP25 sequence was coupled with reverse-phase HPLC to detect and quantify light chain activity from reconstituted product following a proprietary toxin recovery method.21 Each BoNT/A1 product was reconstituted with 2 mL of phosphate-buffered saline. Triplicate aliquots (200 μL) of reconstituted product were transferred to a 96-well plate coated with a monoclonal antibody directed against epitopes of the BoNT/A heavy chain that are exposed only when the toxin molecule is in its correct conformation. Plates containing toxin samples were then incubated at 4°C overnight in a biocontainment unit on a shaker set at 600 rpm (Titramax 1000; Heidolph Instruments, Schwabach, Germany). After incubation, toxin solution was removed from each well. Each well was then washed 5 times with 350-μL volumes of 50 mM HEPES buffer (pH 7.4), containing 0.5 mM zinc acetate and 0.05% Tween 20. After washing, digestion buffer (200 μL) containing 0.5 mM zinc acetate, 0.5% Triton X-100 (Dow Chemical Company, Midland, MI, USA), 0.5 mg/mL human serum albumin (HSA), and 2 mM dithiothreitol (DTT) in 50 mM 4-(2-hydroxyethyl)-1-piperazine ethanesulfonic acid (pH 7.4) was added to each well. All concentrations of Triton X-100, HSA, and DTT were optimized to increase assay sensitivity. Plates were then incubated for 30 minutes at 37°C to facilitate toxin reduction. Aliquots (50 μL) of 200 μM SNAPtide 520 substrate (List Biological Laboratories Inc., Campbell, CA, USA) were added to each well, then incubated at room temperature for 72 hours to allow for substrate cleavage.
The substrate cleavage reaction was quenched by addition of 25 μL of 5% trifluoroacetic acid to each sample well, and the fluorescently labeled cleavage product(s) were separated and detected via reverse-phase HPLC21 using a Waters 2695 XE Separations Module and Waters 2475 Multi λ Fluorescence Detector (Waters Corporation, Milford, MA, USA). In brief, 25 μL of quenched sample was loaded onto a Symmetry C18 column (300 Å, 3.5 μm, 4.6 mm × 150 mm; Waters Corporation) maintained at 35°C. Separation was accomplished using a 10% to 90% CH3CN (0.1% TFA) gradient for 30 minutes, with a flow rate of 1 mL/min. The column effluent was monitored fluorescently (excitation λ=322 nm, emission λ=420 nm) to detect the o-aminobenzoic acid fluorophore on the N-terminal cleaved fragment of SNAPtide 520.
The SNAPtide cleavage product (529; List Biological Laboratories, Inc.) was utilized to identify retention time of the cleavage product, as 529 is the unquenched calibration peptide for SNAPtide 520 substrate for C botulinum type A neurotoxin. Data were collected and analyzed via Waters Empower Pro software (Waters Corporation). Light chain activities of product lots were then compared after being tested head-to-head on the same plate. Data from the 2 independent test dates were summarized by calculating the mean fold differences ± standard deviation (SD) between each BoNT/A1 product, then analyzed using a one-way analysis of variance (ANOVA). In addition, the pooled data from both test dates were analyzed using an unpaired t-test (2 tailed) with Welch’s correction. Post hoc comparisons were determined using the Tukey’s multiple comparison test. Statistical analysis for PC-LCA-HPLC data was performed using GraphPad Prism v7.02 (GraphPad Software, Inc, San Diego, CA, USA).
CBPA
The CBPA measures the cleavage of SNAP25 in SiMa neuroblastoma cells following treatment with BoNT/A.23 This assay allows for the direct comparison of unit potency between BoNT/A1 products in live cells,23 with potency (EC50) defined as the effective concentration (units/mL) required for cleavage of 50% of SNAP25. The methodology for the research version of the CBPA used in this study was adapted from Fernández-Salas et al.23 In summary, human neuroblastoma SiMa H1 cells (DSMZ; Braunschweig, Germany) were plated onto poly-D-lysine 96-well plates at 100,000 cells/well in serum-free media (SFM) with 25 µg/mL of GT1b (Enzo Life Sciences, Farmingdale, NY, USA) for 3 days. The different lots of prabotA and onabotA were reconstituted in SFM with 25 µg/mL of GT1b on the day of testing. Each product was tested at a dose range of 0.04–250 U/mL, with each dose run in triplicate. PrabotA and onabotA were run head-to-head on the same assay plate to allow for direct comparison of product potencies. After 24 hours of treatment, the BoNT/A1 toxin was removed, and cells were incubated in fresh SFM with 25 µg/mL of GT1b for an additional 48 hours.
Detection of cleavage product was determined using an enzyme-linked immunosorbent assay (ELISA)-based method. In brief, cells were lysed, and lysates were transferred to MSD High Bind plates (Meso Scale Diagnostics, LLC, Rockville, MD, USA) coated with anti-SNAP25197 monoclonal antibody (mAb). Plates were then washed with 0.05% phosphate-buffered saline with Tween 20 (PBST) and incubated with SULFO-TAG NHS-Ester (Meso Scale Diagnostics, LLC) labeled anti-SNAP25 pAb (Sigma, St. Louis, MO, USA). The electrochemiluminescent (ECL) signal of captured BoNT/A toxin-cleaved SNAP25 was then quantified on an MSD plate reader (SECTOR S 600; Meso Scale Diagnostics, LLC).
To account for plate-to-plate variability, ECL data from each product on a given assay plate were normalized to the maximal dose values for that product to obtain percent of maximal dose values (% of Max Dose ECL). Normalized data were analyzed using nonlinear regression (3-parameter logistic model; applying curve constraint at the top equal to 100) to generate pharmacological potency values (EC50) using GraphPad Prism v7.02 (GraphPad Software Inc., San Diego, CA, USA). To determine whether potency was significantly different between the 2 products, mean normalized EC50 values for onabotA and prabotA lots that were run head-to-head on the same assay plates were compared via paired 2-tailed t-test. To determine whether the 3 lots tested for each product could be pooled, mean normalized EC50 values for onabotA and prabotA were compared via one-way ANOVA with Tukey’s multiple comparison test. In addition, the individual potency values from onabotA and prabotA were used to generate average relative potency ratios of prabotA to onabotA. These values represent the fold increase in prabotA required to obtain the same observed potency as onabotA in the CBPA. All plotting, curve fitting, and statistical analyses for CBPA data were carried out using GraphPad Prism.
Mouse DAS Assay
The mouse DAS assay is a preclinical in vivo assessment of toxin-induced temporary muscle paralysis following intramuscular injection into a mouse hind limb gastrocnemius (calf) muscle.24–26 This assay measures the dose-dependent effects of toxin diffusion from the injection site into anterior hind limb muscles (ie, extensor digitorum longus and tibialis anterior muscles) responsible for the natural dorsiflexion startle response in mice and is used to characterize toxin in vivo pharmacological activity.25,26 The DAS assay has been used to evaluate hind limb muscle paralysis induced by different BoNT serotypes and BoNT/A1 products, allowing comparison of their potency, efficacy, and duration of action.24,27–30 DAS is measured at peak response and over time.24,25,29 Potency data are expressed as the units of the effective dose per kilogram to cause a 50% reduction in digit abduction (ED50).25,29
All procedures involving mice were approved by the Allergan Animal Care and Use Committee (AACUC; protocol #225-100051-2019; approved February 7, 2019), following guidelines put forward by the American Association for Laboratory Animal Science (AALAS). The DAS assay has been described previously.25,29 Female CD-1 mice (Charles River Laboratories, Wilmington, MA, USA) weighing between 20 and 28 g were housed in groups of 6 and maintained on a 12-hour light–dark cycle, with food and water provided ad libitum. Three separate lots (same as those used for the PC-LCA-HPLC and CBPA testing above) of each BoNT/A1 product, prabotA and onabotA, were tested head-to-head in triplicate (N=3 independent studies), with each replicate commencing on 1 of 9 different test dates, and with a new vial of each product reconstituted for individual test replicates. For each experimental replicate, 4 comparable doses of each BoNT/A1 product were prepared based on labeled units, with n=6 mice per dose. Working solutions for onabotA and prabotA were prepared via serial dilution in 0.9% saline to yield final concentrations for each product (5.47, 9.10, 15.10, and 24.30 U/kg). Based on previous data,29 these concentrations represent projected DAS ED25, ED50, ED75, and ED90 doses, respectively, for onabotA. Investigators and observers were blinded to the test articles and doses.
On day 0, mice were randomized to receive 5 μL of diluted test product into the right gastrocnemius muscle using a 30-gauge needle attached to a 250-μL sterile glass syringe affixed to PB600-1 repeating dispensers (Hamilton Co., Reno, NV). Toxin-induced muscle paralysis was scored at various intervals following the injections using a 5-point DAS scale, with “0” representing a normal startle response and “4” representing maximum reduction in digit abduction.25 All groups were rated not only for DAS, but also observed for any changes in general activity level within the home cage according to AACUC-approved criteria for assessing the clinical well-being of a test animal, on days 1−4, 7, 9, 11, 14, 16, 18, and 21. Upon achievement of 2 consecutive DAS = 0 ratings for all mice in a group, further DAS rating and general activity observations were discontinued.
Scatterplots of the maximum average DAS versus dose (U/kg) were generated for individual replicates, and regression analyses were performed via a 3-parameter logistic model for each replicate by using curve restraints at the minimum (0) and maximum (4) values. These regression analysis output parameters were then used to calculate the median effective dose (ED50) values for each product. ED50 values for individual replicates were used to calculate a mean (± standard error of the mean [SEM]) ED50 value for each product. Mean ED50 values were compared across replicate sets via one-way ANOVA prior to data pooling to ensure they did not differ significantly. The individual potency values from onabotA and prabotA samples were then used to generate average relative potency ratios of prabotA to onabotA. Finally, comparison of duration of action between onabotA and prabotA was achieved by determining line and scatter plots of “DAS versus time (day)” and by calculating area under the curve (AUC) values for the onabotA and prabotA duration plots. Individual replicate AUC values were used to calculate a mean (±SEM) AUC value. Mean ED50 and AUC values were compared via one-way ANOVA followed by post hoc analysis using the pooled data. All analyses involving plotting, curve-fitting, and statistics for in vivo DAS data were conducted using SigmaPlot v13.0 (SysStat Software, Inc, San Jose, CA, USA).
Results
PC-LCA-HPLC
In the PC-LCA-HPLC assay, onabotA and prabotA consistently showed differences in biological activity on a unit-to-unit basis, with all 3 lots of onabotA demonstrating greater light chain enzymatic activity than all 3 lots of prabotA on both test dates (Figure 1A and B). The peak areas of each onabotA lot were significantly different (P<0.01) than the peak areas of each prabotA lot on both test dates (based on one-way ANOVA; Tukey’s multiple comparisons test), suggesting greater cleavage of SNAP25 substrate by onabotA (Table 1). When data from both test dates for the lots of onabotA and prabotA were pooled (18 vials per product; Figure 1C), prabotA exhibited 66.91% ± 6.39% (mean ± SD) of the light chain activity of onabotA, which was significantly different (P<0.0001; Welch’s unpaired 2-tailed t-test). Therefore, a 1.51 ± 0.14–fold overall difference (mean ± SD) in the light chain enzymatic activity was observed between onabotA and prabotA (Table 1).
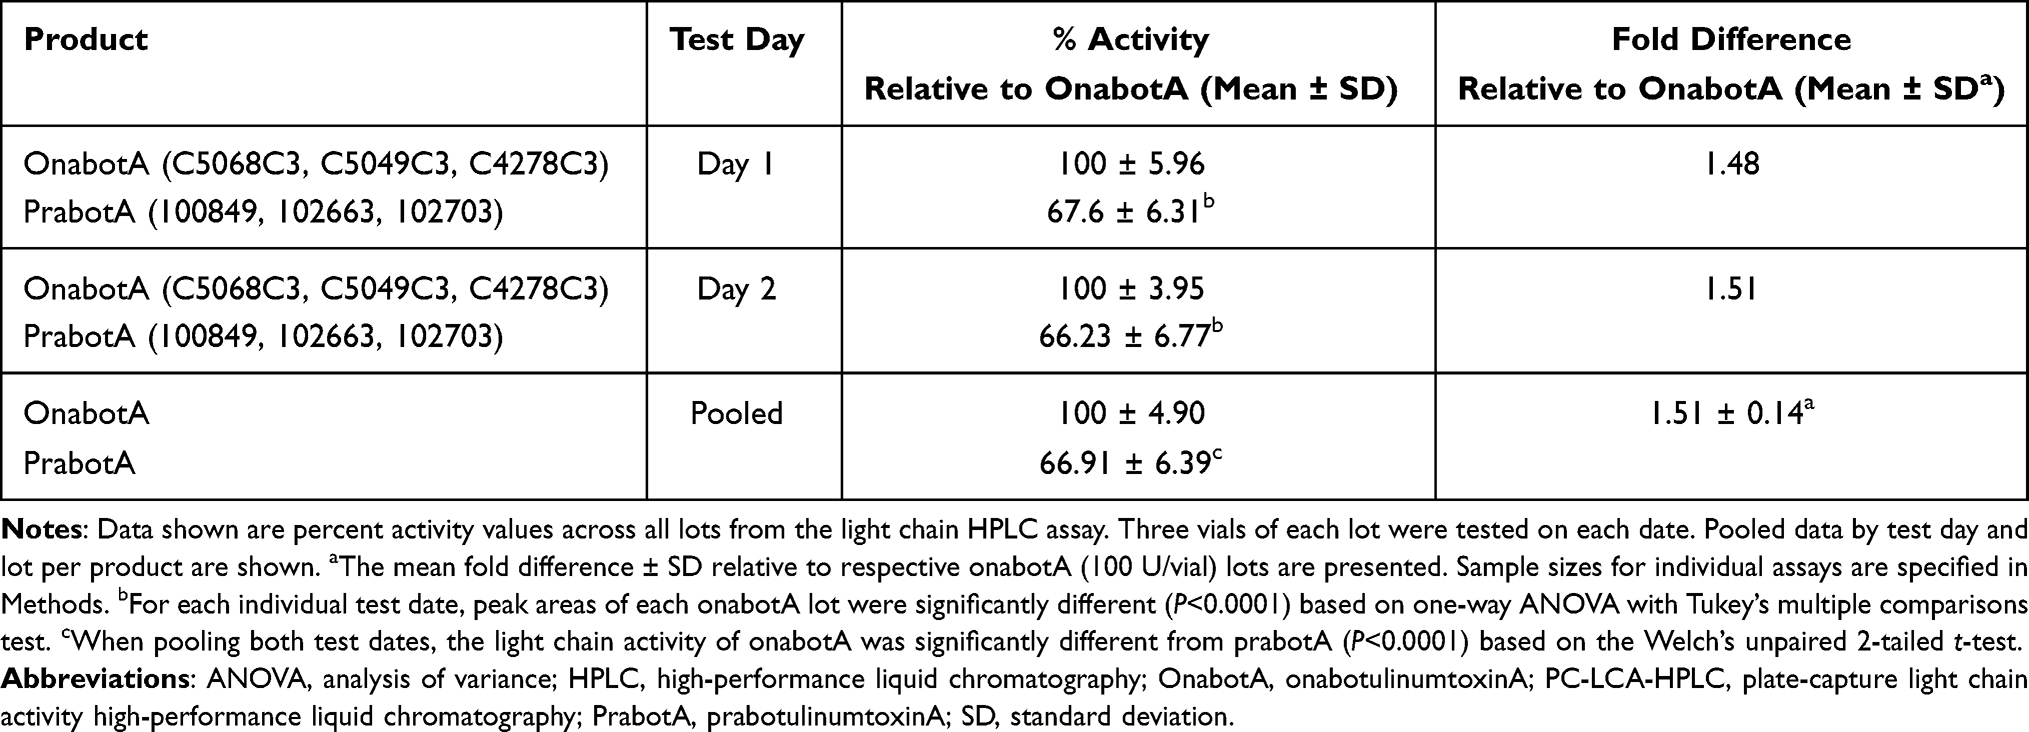 |
Table 1 Summarized Data Showing PC-LCA-HPLC Comparison of OnabotA and PrabotA |
 |
Figure 1 Plate-capture light chain activity high-performance liquid chromatography (PC-LCA-HPLC) comparison of onabotulinumtoxinA (onabotA) and prabobotulinumtoxinA (prabotA) vials. (A) First test date. (B) Second test date. SNAPtide cleavage product area in relative fluorescence units (± standard deviation [SD]) for 3 separate lots of onabotA versus 3 separate lots of prabotA is shown for each test date (N=3 independent studies). Three vials were tested per product lot on each test date. Differences were analyzed using a one-way analysis of variance (ANOVA). Post hoc comparisons were determined using the Tukey’s multiple comparison test. Statistically significant differences of P<0.01 were observed between onabotA and prabotA samples on both test dates. (C) Pooled normalized data from both test dates for onabotA and prabotA. Normalized data are presented as mean ± SD percent average onabotA response. Differences in normalized means for prabotA versus onabotA were analyzed using an unpaired t-test (2-tail) with Welch’s correction. A statistically significant difference of P<0.01 was observed between the normalized and combined mean for onabotA and prabotA. *P<0.01. |
CBPA
In the CBPA assay, wherein 3 lots of each product were evaluated, onabotA and prabotA demonstrated differences in potency based on a product-labeled unit-to-unit comparison. PrabotA showed higher EC50 in all 3 of the lot comparisons, suggesting lower potency relative to onabotA (Figure 2A, Table 2). This difference was statistically significant (P<0.05; paired 2-tailed t-test) for lot comparisons #1 (P=0.03) and #3 (P=0.02) but not for lot comparison #2 (P=0.09; Table 2). Similar results were observed when the 3 lots of each product were pooled, as indicated by a rightward shift in the dose–response curve (Figure 2B), with mean (± SEM) EC50 values of 10.44 ± 0.50 U/mL for onabotA and 13.84 ± 0.06 U/mL for prabotA (Table 2). Comparison of the mean normalized EC50 values revealed a significant difference between onabotA and prabotA (P<0.0001, paired 2-tailed t-test). Furthermore, onabotA displayed a 1.33 ± 0.07–fold increase in activity compared with prabotA. The relative potency of prabotA was 0.76 ± 0.04 (mean ± SEM), indicating that 25% more prabotA units would be necessary to obtain the same effect as onabotA in this assay (Table 2).
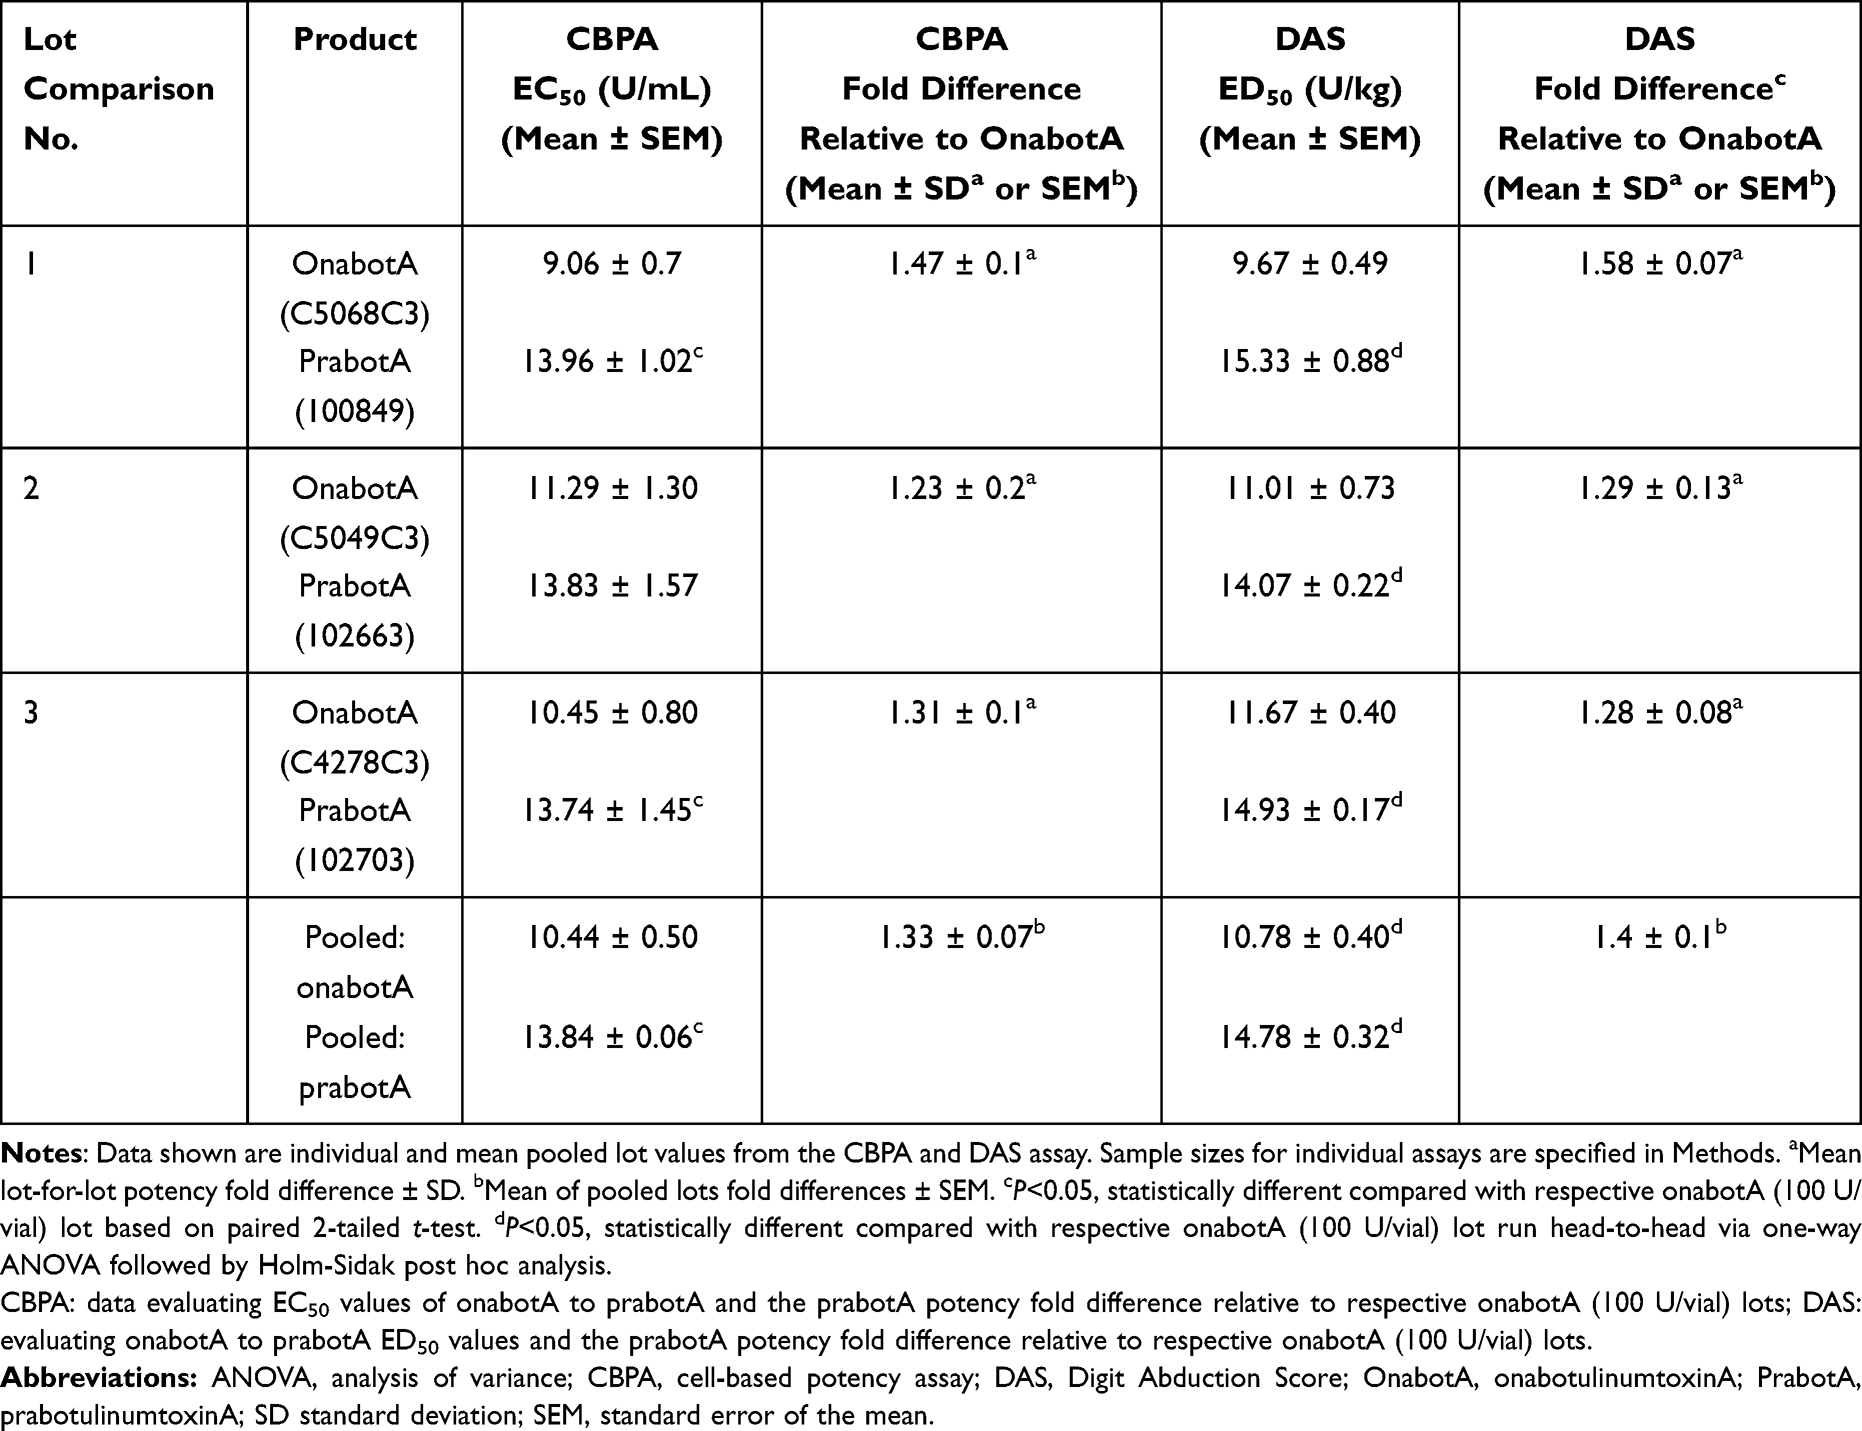 |
Table 2 Summary of Normalized Mean CBPA EC50 and Mean DAS ED50 Values for OnabotA and PrabotA |
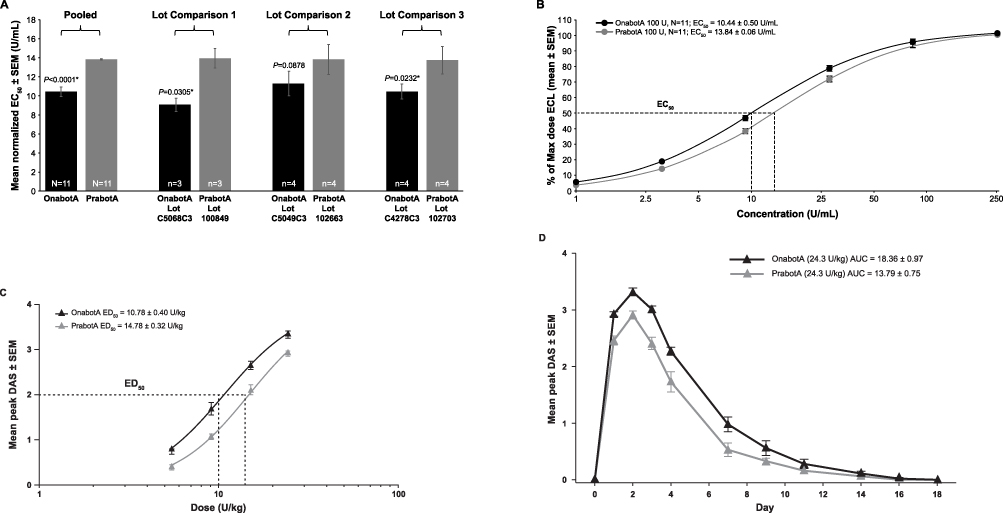 |
Figure 2 In vitro and in vivo pharmacological comparisons between onabotulinumtoxinA (onabotA) and prabobotulinumtoxinA (prabotA) products. (A) Cell-based potency assay (CBPA) mean normalized EC50 values showing statistically significant differences (P<0.05) between the mean pooled lot comparison as well as for 2 of the 3 individual product lot comparisons of onabotA and prabotA (Table 2). (B) CBPA mean normalized dose–response curves for the 3 pooled lots of onabotA and prabotA are shown as percent of maximal dose of electrochemiluminescent (ECL) ± standard error of the mean (SEM; N=11). Individual dose–response curves were assessed using nonlinear regression (3-parameter logistic model applying curve constraint at the top equal to 100) to generate pharmacological potency (EC50) values that were significantly different (P<0.0001) for the pooled product lot comparison. (C) Pooled mean peak mouse Digit Abduction Score (DAS) assay from N=3 independent studies comparing onabotA and prabotA products (n=6 mice per dose). DAS dose–response curves were assessed using nonlinear regression (3-parameter logistic model applying curve constrain at the top equal to 4) to generate pharmacological potency (ED50) values (mean ± SEM) that were significantly different (P<0.05) between individual and pooled product lot comparisons of onabotA and prabotA (Table 2). (D) Mean DAS responses (± SEM) over time are shown for 3 pooled lots of prabotA and onabotA at the 24.3 U/kg dose (N=9). Area under the curve (AUC) values for each product were compared and were *significantly different between the 2 products (P<0.05). |
Mouse DAS
Both 100 U/vial labeled strengths of prabotA and onabotA showed an increasing dose–response relationship in the mouse DAS assay (Figure 2C). However, prabotA showed reduced potency when compared with onabotA on a lot-to-lot basis, as indicated by a rightward shift in the overall dose–response curve for the mean peak DAS. Mean ED50 values for prabotA vials were significantly higher across each tested lot compared with onabotA reference lots (P<0.05; Table 2). This reduced potency resulted in a difference of 1.28- to 1.58-fold between prabotA and onabotA across the different lot comparisons. Furthermore, the mean pooled ED50 value (± SEM) for prabotA (14.78 ± 0.32 U/kg) was significantly higher when compared with the mean ED50 value from the pooled onabotA data (10.78 ± 0.40 U/kg; P<0.05), resulting in an overall mean difference of 1.38 ± 0.1–fold between the 2 products (Table 2). The difference in potency between the 2 products was associated with a longer duration of muscle paralysis for onabotA compared with prabotA at equivalent doses. When administered at equivalent doses (≈24 U/kg), onabotA demonstrated a longer duration of action compared with prabotA (Figure 2D). The calculated AUC value (± SEM), representing overall product efficacy, of the 24.3 U/kg dose of onabotA was significantly higher (18.36 ± 0.97; P=0.002) compared with the 24.3 U/kg dose of prabotA (13.79 ± 0.75), indicating that more prabotA was required to achieve comparable peak response and duration compared with onabotA in the mouse DAS assay (Figure 2D).
Discussion
The non-interchangeability of BoNT/A1 products has been described extensively in the literature and is supported by an abundance of scientific and clinical evidence.9,11,12,20,24,31–37 In this study, we compared units of prabotA and onabotA in 3 independent in vitro and in vivo assays. Results of all 3 assays demonstrated differences in potency, efficacy, and duration of action between onabotA and prabotA on a unit-to-unit basis. These findings confirm that, similar to other BoNT/A1 products,33 the units of prabotA and onabotA are not interchangeable.
Recently, a non-inferiority trial to support the regulatory approval of prabotA for the treatment of glabellar lines was conducted in Europe and Canada.19 The 150-day active- and placebo-controlled study was designed to demonstrate prabotA is non-inferior to an active comparator already approved in the market (onabotA) by a pre-specified margin (no greater than 10%) at a specific time point (day 30 post-injection).19 A single dose of 20 U prabotA was shown to be non-inferior to 20 U onabotA in improving the severity of glabellar lines on day 30 post-injection. Responder rates were numerically higher for prabotA than onabotA, but no statistical analysis was performed between the active treatment arms to assess statistically significant differences between prabotA and onobotA.19 Therefore, while the study showed non-inferiority of prabotA vs onabotA, it did not, by design, establish statistical superiority for prabotA. Non-inferiority trials may have limitations in their study designs, including a potential for inadequate sensitivity of the analysis, lack of justification for choice of non-inferiority margin, inconsistency between significance level chosen in sample size calculations and the confidence interval, opportunity for bias, and comparisons based on outdated or incomplete assumptions about treatments.38–41
There are several factors that play a role in the lack of interchangeability of BoNT/A1 products, such as the unique manufacturing processes, formulation, and potency assays of each product, as reviewed by Brin et al.9 Various preclinical studies have demonstrated that BoNT/A units cannot be readily interchanged with other preparations of botulinum toxin products.24,29,42,43 To compare the potencies of 3 different BoNT/A1 products, 1 in vivo study quantified hind limb paresis after injection of BoNT/A1 into the hind limbs of mice and found that units of incobotulinumtoxinA (incobotA), abobotulinumtoxinA (abobotA), and onabotA are not interchangeable.43 In a study using 2 in vitro and 2 in vivo assays, onabotA displayed significantly different biological activity on a unit-to-unit basis compared with incobotA.29 These in vitro and in vivo findings were similar to those from studies demonstrating dosing non-interchangeability occurs clinically.29,37 Currently, regulatory agencies worldwide have established that BoNT/A units are not interchangeable, as stipulated in commercial product labeling.44–47
However, in the current study, the difference in potency translated into a greater response and longer duration of muscle paralysis in the mouse DAS assay with onabotA versus prabotA administered at equivalent unit doses (≈24 U/kg). Based on these data, it is reasonable to predict that a 1:1 dose ratio for onabotA and prabotA would not produce equivalent clinical outcomes.
Previous clinical studies provide support that units of BoNT/A1 products are not interchangeable. The results of a retrospective, non-interventional clinical study that observed patients (N=288) with blepharospasm who received ≥8 consecutive treatments with either onabotA, abobotA, or incobotA showed that none of these BoNT/A1 products had a 1:1 dose conversion ratio with another.37 Furthermore, a multicenter, randomized, double-blind study of 224 patients with moderate or severe glabellar lines who received a single onabotA 20 U or incobotA 30 U treatment found similar percentages of responders in each group, as defined by at least a 1-point reduction in the Facial Wrinkle Scale at maximum contraction at day 28 post-injection.12 In another study, 62 patients with moderate or severe glabellar lines at maximum contraction were randomized to onabotA 20 U or abobotA 50 U.11 At week 12, 77% of the 20 U onabotA group and 59% of the abobotA 50 U group achieved at least a 1-grade improvement or greater in glabellar line severity at maximum contraction.11 However, a prospective, randomized, double-blinded, parallel-group study in 250 patients found that incobotA 20 U and onabotA 20 U were equivalent in the treatment of glabellar lines at 1 month post-injection, within a prespecified ±15% margin of equivalence, and that efficacy and tolerability were similar between treatment groups through 4 months.48 Limitations in interpreting equivalence studies, as well as non-inferiority studies, include factors such as limited and investigator-selected time and efficacy endpoints, subjective selection of what constitutes a difference, and lack of statistical power to detect differences.38,39
Like previous studies, the current data further support that BoNT/A1 products lack interchangeability. The current preclinical data demonstrate differences in the biological activity and potency of onabotA and prabotA when tested on a unit-to-unit basis. The data thereby reinforce the regulatory statements on all commercially available BoNT/A1 products that dosing units are not interchangeable with those of any other botulinum toxin preparation and cannot be compared with or converted into units of any other product.44 The findings have increasing relevance as new therapies enter the clinical milieu with different properties related to dosing and duration of effect.
Abbreviations
abobotA, abobotulinumtoxinA; ANOVA, one-way analysis of variance; BoNT/A, botulinum neurotoxin serotype A; BoNT/A1, botulinum neurotoxin serotype A subtype 1; CBPA, cell-based potency assay; DAS, Digit Abduction Score; DTT, dithiothreitol; ECL, electrochemiluminescent; ELISA, enzyme-linked immunosorbent assay; HSA, human serum albumin; incobotA; incobotulinumtoxinA; mAb, monoclonal antibody; onabotA, onabotulinumtoxinA; PC-LCA-HPLC, plate-capture light chain activity high-performance liquid chromatography; prabotA, prabotulinumtoxinA; SD, standard deviation; SEM, standard error of the mean; SFM, serum-free media; SNARE, soluble N-ethylmaleimide–sensitive factor attachment receptor; SNAP25, synaptosome-associated protein 25 substrate; VD, vacuum-dried.
Data Sharing Statement
AbbVie is committed to responsible data sharing regarding the clinical trials we sponsor. This includes access to anonymized, individual, and trial-level data (analysis data sets), as well as other information (eg, protocols, clinical study reports, or analysis plans), as long as the trials are not part of an ongoing or planned regulatory submission. This includes requests for clinical trial data for unlicensed products and indications. These clinical trial data can be requested by any qualified researchers who engage in rigorous, independent, scientific research, and will be provided following review and approval of a research proposal, Statistical Analysis Plan (SAP), and execution of a Data Sharing Agreement (DSA). Data requests can be submitted at any time after approval in the US and Europe and after acceptance of this manuscript for publication. The data will be accessible for 12 months, with possible extensions considered. For more information on the process or to submit a request, visit the following link: https://www.abbvieclinicaltrials.com/hcp/data-sharing/.html.
Ethical Statements
The authors confirm that the ethical policies of the journal, as noted on the journal’s author guidelines page, have been adhered to. All procedures involving mice were approved by the Allergan Animal Care and Use Committee (AACUC; protocol #225-100051-2019; approved February 7, 2019).
Acknowledgments
Writing and editorial assistance was provided to the authors by Regina Kelly, MA of Peloton Advantage, LLC, an OPEN Health company, Parsippany, NJ, and funded by AbbVie. The authors thank Nazanin Ashourian, PhD and Mariana Nelson, PhD of AbbVie for their invaluable assistance in the interpretation of data and in the development of this manuscript.
Author Contributions
All authors made a significant contribution to the work reported, whether that is in the conception, study design, execution, acquisition of data, analysis and interpretation, or in all these areas; took part in drafting, revising, or critically reviewing the article; gave final approval of the version to be published; have agreed on the journal to which the article has been submitted; and agree to be accountable for all aspects of the work.
Funding
Allergan Aesthetics, an AbbVie Company, funded this study and participated in the study design, research, analysis, data collection, interpretation of data, reviewing, and approval of the publication. All authors had access to relevant data and participated in the drafting, review, and approval of this publication. No honoraria or payments were made for authorship. Medical writing support was provided to the authors by Regina Kelly, MA of Peloton Advantage, LLC, an OPEN Health company, Parsippany, NJ, and was funded by AbbVie.
Disclosure
All authors are employees of AbbVie, and may hold AbbVie stock. The authors report no other conflicts of interest in this work.
References
1. Steward L, Brin MF, Brideau-Andersen A. Novel native and engineered botulinum neurotoxins. Handb Exp Pharmacol. 2021;263:63–89 doi:10.1007/164_2020_351.
2. Pirazzini M, Rossetto O, Eleopra R, Montecucco C. Botulinum neurotoxins: biology, pharmacology, and toxicology. Pharmacol Rev. 2017;69(2):200–235. doi:10.1124/pr.116.012658
3. Coleman K. Botulinum toxin: mode of action and serotypes. In: Botulinum Toxin in Facial Rejuvenation.
4. Brin MF. Botulinum toxins: pharmacology, immunology, and current developments. In: Benedetto AV, editor. Botulinum Toxins in Clinical Aesthetic Practice. Vol. 1.
5. Flynn TC. Botulinum toxin: examining duration of effect in facial aesthetic applications. Am J Clin Dermatol. 2010;11(3):183–199. doi:10.2165/11530110-000000000-00000
6. Burstein R, Blumenfeld AM, Silberstein SD, Manack Adams A, Brin MF. Mechanism of action of onabotulinumtoxinA in chronic migraine: a narrative review. Headache. 2020;60(7):1259–1272. doi:10.1111/head.13849
7. Carruthers A, Kane MA, Flynn TC, et al. The convergence of medicine and neurotoxins: a focus on botulinum toxin type A and its application in aesthetic medicine—a global, evidence-based botulinum toxin consensus education initiative: part I: botulinum toxin in clinical and cosmetic practice. Dermatol Surg. 2013;39(3 Pt 2):493–509. doi:10.1111/dsu.12147
8. Nestor MS, Arnold D, Fischer DL. The mechanisms of action and use of botulinum neurotoxin type A in aesthetics: key clinical postulates II. J Cosmet Dermatol. 2020;19(11):2785–2804. doi:10.1111/jocd.13702
9. Brin MF, James C, Maltman J. Botulinum toxin type A products are not interchangeable: a review of the evidence. Biologics. 2014;8:227–241. doi:10.2147/BTT.S65603
10. Ramirez-Castaneda J, Jankovic J, Comella C, Dashtipour K, Fernandez HH, Mari Z. Diffusion, spread, and migration of botulinum toxin. Mov Disord. 2013;28(13):1775–1783. doi:10.1002/mds.25582
11. Lowe P, Patnaik R, Lowe N. Comparison of two formulations of botulinum toxin type A for the treatment of glabellar lines: a double-blind, randomized study. J Am Acad Dermatol. 2006;55(6):975–980. doi:10.1016/j.jaad.2006.07.006
12. Moers-Carpi M, Dirschka T, Feller-Heppt G, et al. A randomised, double-blind comparison of 20 units of onabotulinumtoxinA with 30 units of incobotulinumtoxinA for glabellar lines. J Cosmet Laser Ther. 2012;14(6):296–303. doi:10.3109/14764172.2012.738913
13. Butreddy A, Janga KY, Ajjarapu S, Sarabu S, Dudhipala N. Instability of therapeutic proteins—an overview of stresses, stabilization mechanisms and analytical techniques involved in lyophilized proteins. Int J Biol Macromol. 2021;167:309–325. doi:10.1016/j.ijbiomac.2020.11.188
14. Bjelošević M, Zvonar Pobirk A, Planinšek O, Ahlin Grabnar P. Excipients in freeze-dried biopharmaceuticals: contributions toward formulation stability and lyophilisation cycle optimisation. Int J Pharm. 2020;576:119029. doi:10.1016/j.ijpharm.2020.119029
15. Izutsu KI. Applications of freezing and freeze-drying in pharmaceutical formulations. Adv Exp Med Biol. 2018;1081:371–383.
16. Cheon HI, Jung N, Won CH, Kim BJ, Lee YW. Efficacy and safety of prabotulinumtoxin A and onabotulinumtoxin A for crow’s feet: a phase 3, multicenter, randomized, double-blind, split-face study. Dermatol Surg. 2019;45(12):1610–1619. doi:10.1097/DSS.0000000000001920
17. Republic of Korea Ministry of Food and Drug Safety. Biological products (biologics, recombinant DNA products); 2020. Available from: https://www.mfds.go.kr/eng/brd/m_30/view.do?seq=70651.
18. US Food and Drug Administration. Drug approval package: jeuveau for injection; 2019. Available from: https://www.accessdata.fda.gov/drugsatfda_docs/nda/2019/761085Orig1s000Approv.pdf.
19. Rzany BJ, Ascher B, Avelar RL, et al. A multicenter, randomized, double-blind, placebo-controlled, single-dose, phase III, non-inferiority study comparing prabotulinumtoxinA and onabotulinumtoxinA for the treatment of moderate to severe glabellar lines in adult patients. Aesthet Surg J. 2020;40(4):413–429. doi:10.1093/asj/sjz110
20. Ferrari A, Manca M, Tugnoli V, Alberto L. Pharmacological differences and clinical implications of various botulinum toxin preparations: a critical appraisal. Funct Neurol. 2018;33(1):7–18. doi:10.11138/FNeur/2018.33.1.007
21. Hunt T, Rupp D, Shimizu G, Tam K, Weidler J, Xie J. Characterization of SNARE cleavage products generated by formulated botulinum neurotoxin type-a drug products. Toxins. 2010;2(8):2198–2212. doi:10.3390/toxins2082198
22. Vaidyanathan VV, Yoshino K, Jahnz M, et al. Proteolysis of SNAP-25 isoforms by botulinum neurotoxin types A, C, and E: domains and amino acid residues controlling the formation of enzyme-substrate complexes and cleavage. J Neurochem. 1999;72(1):327–337. doi:10.1046/j.1471-4159.1999.0720327.x
23. Fernandez-Salas E, Wang J, Molina Y, Nelson JB, Jacky BP, Aoki KR. Botulinum neurotoxin serotype A specific cell-based potency assay to replace the mouse bioassay. PLoS One. 2012;7(11):e49516. doi:10.1371/journal.pone.0049516
24. Brown M, Nicholson G, Ardila MC, et al. Comparative evaluation of the potency and antigenicity of two distinct BoNT/A-derived formulations. J Neural Transm. 2013;120(2):291–298. doi:10.1007/s00702-012-0854-3
25. Broide RS, Rubino J, Nicholson GS, et al. The rat Digit Abduction Score (DAS) assay: a physiological model for assessing botulinum neurotoxin-induced skeletal muscle paralysis. Toxicon. 2013;71:18–24. doi:10.1016/j.toxicon.2013.05.004
26. Aoki KR. Preclinical update on BOTOX (botulinum toxin type A)-purified neurotoxin complex relative to other botulinurn neurotoxin preparations. Eur J Neurol. 1999;6(S4):s3–s10. doi:10.1111/j.1468-1331.1999.tb00032.x
27. Donald S, Elliott M, Gray B, et al. A comparison of biological activity of commercially available purified native botulinum neurotoxin serotypes A1 to F1 in vitro, ex vivo, and in vivo. Pharmacol Res Perspect. 2018;6(6):e00446. doi:10.1002/prp2.446
28. Kwak S, Kang WH, Rhee CH, Yang GH, Cruz DJM. Comparative pharmacodynamics study of 3 different botulinum toxin type A preparations in mice. Dermatol Surg. 2020;46(12):e132–e138. doi:10.1097/DSS.0000000000002402
29. Rupp D, Nicholson G, Canty D, et al. OnabotulinumtoxinA displays greater biological activity compared to incobotulinumtoxinA, demonstrating non-interchangeability in both in vitro and in vivo assays. Toxins. 2020;12(6):393. doi:10.3390/toxins12060393
30. Aoki KR. A comparison of the safety margins of botulinum neurotoxin serotypes A, B, and F in mice. Toxicon. 2001;39(12):1815–1820. doi:10.1016/S0041-0101(01)00101-5
31. Samizadeh S, De Boulle K. Botulinum neurotoxin formulations: overcoming the confusion. Clin Cosmet Investig Dermatol. 2018;11:273–287. doi:10.2147/CCID.S156851
32. Kordestani R, Small KH, Rohrich RJ. Advancements and refinement in facial neuromodulators. Plast Reconstr Surg. 2016;138(4):803–806. doi:10.1097/PRS.0000000000002569
33. Walker TJ, Dayan SH. Comparison and overview of currently available neurotoxins. J Clin Aesthet Dermatol. 2014;7(2):31–39.
34. Chen JJ, Dashtipour K. Abo-, inco-, ona-, and rima-botulinum toxins in clinical therapy: a primer. Pharmacotherapy. 2013;33(3):304–318. doi:10.1002/phar.1196
35. Bakshi E, Hartstein ME. Compositional differences among commercially available botulinum toxin type A. Curr Opin Ophthalmol. 2011;22(5):407–412. doi:10.1097/ICU.0b013e328349b0b6
36. Brodsky MA, Swope DM, Grimes D. Diffusion of botulinum toxins. Tremor Other Hyperkinet Mov. 2012;2:tre-02-85-417–1. doi:10.7916/D88W3C1M
37. Kollewe K, Mohammadi B, Köhler S, Pickenbrock H, Dengler R, Dressler D. Blepharospasm: long-term treatment with either Botox, Xeomin or Dysport. J Neural Transm. 2015;122(3):427–431. doi:10.1007/s00702-014-1278-z
38. Rehal S, Morris TP, Fielding K, Carpenter JR, Phillips PP. Non-inferiority trials: are they inferior? A systematic review of reporting in major medical journals. BMJ Open. 2016;6(10):e012594. doi:10.1136/bmjopen-2016-012594
39. Walker J. Non-inferiority statistics and equivalence studies. BJA Educ. 2019;19(8):267–271. doi:10.1016/j.bjae.2019.03.004
40. Snapinn SM. Noninferiority trials. Curr Control Trials Cardiovasc Med. 2000;1(1):19–21. doi:10.1186/CVM-1-1-019
41. Pater C. Equivalence and noninferiority trials—are they viable alternatives for registration of new drugs? (III). Curr Control Trials Cardiovasc Med. 2004;5(1):8. doi:10.1186/1468-6708-5-8
42. Hunt T, Clarke K. Potency evaluation of a formulated drug product containing 150-kd botulinum neurotoxin type A. Clin Neuropharmacol. 2009;32(1):28–31. doi:10.1097/WNF.0b013e3181692735
43. Kutschenko A, Manig A, Reinert MC, Mönnich A, Liebetanz D. In-vivo comparison of the neurotoxic potencies of incobotulinumtoxinA, onabotulinumtoxinA, and abobotulinumtoxinA. Neurosci Lett. 2016;627:216–221. doi:10.1016/j.neulet.2016.06.001
44. Botox cosmetic [package insert]. Dublin, Ireland: Allergan plc; 2020.
45. Dysport [package insert]. Wrexham, UK: Ipsen Biopharm Ltd.; 2020.
46. Xeomin [package insert]. Raleigh, NC: Merz Pharmaceuticals; 2021.
47. Jeuveau [package insert]. Newport Beach, CA: Evolus Inc.; 2020.
48. Kane MA, Gold MH, Coleman WP, et al. A randomized, double-blind trial to investigate the equivalence of incobotulinumtoxinA and onabotulinumtoxinA for glabellar frown lines. Dermatol Surg. 2015;41(11):1310–1319. doi:10.1097/DSS.0000000000000531
 © 2023 The Author(s). This work is published and licensed by Dove Medical Press Limited. The
full terms of this license are available at https://www.dovepress.com/terms
and incorporate the Creative Commons Attribution
- Non Commercial (unported, 3.0) License.
By accessing the work you hereby accept the Terms. Non-commercial uses of the work are permitted
without any further permission from Dove Medical Press Limited, provided the work is properly
attributed. For permission for commercial use of this work, please see paragraphs 4.2 and 5 of our Terms.
© 2023 The Author(s). This work is published and licensed by Dove Medical Press Limited. The
full terms of this license are available at https://www.dovepress.com/terms
and incorporate the Creative Commons Attribution
- Non Commercial (unported, 3.0) License.
By accessing the work you hereby accept the Terms. Non-commercial uses of the work are permitted
without any further permission from Dove Medical Press Limited, provided the work is properly
attributed. For permission for commercial use of this work, please see paragraphs 4.2 and 5 of our Terms.