Back to Journals » Risk Management and Healthcare Policy » Volume 13
A Policy Category Analysis Model for Tourism Promotion in China During the COVID-19 Pandemic Based on Data Mining and Binary Regression
Authors Chen T, Peng L ![]() , Yin X, Jing B, Yang J
, Yin X, Jing B, Yang J ![]() , Cong G, Li G
, Cong G, Li G
Received 29 September 2020
Accepted for publication 25 November 2020
Published 31 December 2020 Volume 2020:13 Pages 3211—3233
DOI https://doi.org/10.2147/RMHP.S284564
Checked for plagiarism Yes
Review by Single anonymous peer review
Peer reviewer comments 3
Editor who approved publication: Professor Marco Carotenuto
Tinggui Chen,1 Lijuan Peng,1 Xiaohua Yin,1 Bailu Jing,2 Jianjun Yang,3 Guodong Cong,4 Gongfa Li5
1School of Statistics and Mathematics, Zhejiang Gongshang University, Hangzhou 310018, People’s Republic of China; 2School of Management and E-Business, Zhejiang Gongshang University, Hangzhou 310018, People’s Republic of China; 3Department of Computer Science and Information Systems, University of North Georgia, Oakwood, GA 30566, USA; 4School of Tourism and Urban-Rural Planning, Zhejiang Gongshang University, Hangzhou 310018, People’s Republic of China; 5Hubei Key Laboratory of Mechanical Transmission and Manufacturing Engineering, Wuhan University of Science and Technology, Wuhan 430081, People’s Republic of China
Correspondence: Guodong Cong Email [email protected]
Background and Aim: At the end of 2019, the outbreak of COVID-19 had a significant impact on China’s tourism industry, which was almost at a standstill in the short-term. After reaching the preliminarily stable state, the government and the scenic area management department implemented a series of incentive policies in order to speed up the recovery of the tourism industry. Therefore, analyzing all sorts of social effects after policy implementation is of guiding significance for the government and the scenic areas.
Methods: Targeted as the social effect with the implementation of tourism promotion policy during the COVID-19 pandemic, this paper briefly analyzes the impact of COVID-19 on the national cultural and tourism industry and selects several representative types of tourism policies, crawls the comment data of Weibo users, analyzes users’ perception and emotional preference to the policy, and thus mines the social effect of various policies. Subsequently, by identifying the social effects of various policies as dependent variables, a binary logistic regression model is constructed to obtain the best combination of tourism promotion policies and promote the rapid revitalization of the cultural and tourism industry.
Results: The results show that from the single policy, the social effect of the “safety” policy is the best. From the perspective of combination policies, the simultaneous release of “safety” policies and “economy” policies have the greatest social impact, which can dramatically accelerate the recovery of the cultural and tourism industry. Finally, this paper proposes suggestions for policy formulation to improve the ability of the cultural tourism industry to cope with crisis events.
Conclusion: These results explain the perceived effects of the public on the government policies and can be used to judge whether the policies have been released in place. Based on the above results, corresponding suggestions are proposed as follows: 1) the combination of economic policies and security policies can achieve better results; and 2) the role of “opinion leaders” can be played to improve the perceived effect of policies.
Keywords: online comments, social effects, combination optimization, data mining, binary logistic regression, COVID-19
Introduction
With the progress of science and technology, as well as the improvement of people’s living conditions and material level, China’s tourism industry has entered a new take-off stage after more than 20 years of development. However, the outbreak of COVID-19 in late 2019 greatly impacted on China’s tourism industry, wiping out more than 450 million tourist revenues. About 2 months after the enforcement of prevention and control, on February 25, the national culture and tourism office issued the guidance to lead the national scenic spots to implement the epidemic prevention and control to make recovery steadily. Meanwhile, local governments and scenic spots have issued a series of promoting policies, such as travel coupons, current limiting, 2.5-days off, which aims to stimulate recovery of the tourism industry while preventing COVID-19. However, the policies have received mixed reviews from netizens, who have focused on the safety issues brought about by the opening of scenic spots. For the government and scenic spots, the most concerning question is which kind of policies have the most obvious stimulating effect on the tourism economy. In order to answer these questions, it is necessary to conduct an emotional analysis of a series of policies issued by the government and scenic spots, measure the effect of policy implementation according to online netizens’ comments, and summarize the policy combination with the best implementation effect, so as to help the government and scenic spots maximize the validity to promote recovery.
At present, domestic and foreign scholars have carried out some researches on the implementation effect of tourism policies, mainly including drawing on multi-disciplinary research methods such as consumer behavior, public management, and journalism and communication, designing research scales and measurement processes, and conducting research on the impact of tourism policies based on tourism consumption behavior intention. However, few scholars directly use online comment data of tourism public opinion for research, but whether to travel is easily affected by public opinion. Therefore, it is of great significance to carry out text mining on tourists’ online comment data on tourism policy, so as to analyze the social effect of policy implementation.
Based on this, this paper evaluates the effects of a series of policies issued by the government and scenic spots against the background of COVID-19. In particular, this paper analyzes the present situation and the existing supporting policy to select the representative tourism policies released by government, then reviews Weibo comments data to understand users’ intention and emotion preference, as well as the social effect of all kinds of policy implementation. Besides, this article builds a binary logistic regression model, making social effects influenced by various policies as the dependent variable, and making other factors (Weibo comments, comments time, like quantity) as independent variables. In turn, it combines the results of the single policy and mixed policy with the most promoting effect for tourism, providing suggestions for the government and the scenic spot to accelerate the revitalization of the culture and tourism industry.
The structure is as follows: Literature Review analyzes the literature of tourism policy; Analysis on Supporting Policies of Cultural Tourism Industry During COVID-19 discusses the tourism support policies; Data Mining Based on Online Comments of Travel Policies During COVID-19 conducts data mining on the online comments on tourism policies; The Social Effect Analysis of Tourism Policies Based on Binary Logistic Regression Model constructs a binary logistic regression model to measure the social effects of tourism revitalization policies and seek for the optimal combination of policies; Conclusions and Suggestions summarizes the whole paper and provides policy suggestions.
Literature Review
At present, there are text mining, emotion analysis, and combinatorial optimization methods for policy implementation effect analysis in both domestic and international research. These methods are still practiced in the study of tourism policy implementation effect. Therefore, this paper draws on the methods of evaluating the implementation effect of other policies to analyze the research status of a tourism policy implementation effect.
Tourism policies mainly refer to policies that promote tourism activities in various aspects. In order to understand the impact of these policies on the actual tourism industry, scholars have conducted in-depth studies with policy measurement tools, and the representative results are as follows: David et al1 introduces the research method of system theory into the political field, and puts forward the “political system theory” for the first time. It holds that the interaction between policy system and environment is realized through “input, transformation and output” in politics through “requirements and support” existing in the environment. Rossouw and Saayman2 demonstrated the relevance and necessity of using the tourism satellite account (TSAs) as a tool for South African decision-makers (especially tourism decision-makers) to improve and expand the application of the general equilibrium (AGE) model. The reasons for the need for economic models for policy analysis and other purposes were expounded, and the new and old methods for tourism policy modeling were summarized. Steve3 extended and applied a non-parametric method to estimate the effect of heterogeneous treatment, and examined how the policy effect changed over time. The study showed that this method had potential value in evaluating the impact of a series of environmental policies and environmental impacts. Dong and Liu4 used a threshold model and quantile regression model to explore the threshold effect of policy power on policy implementation effect and the transformation of policy implementation effect in different development stages. The results showed that the effect of industrial policy varied greatly in different development stages, and policy power had a significant threshold effect on its operation intensity. Matousek et al5 studied how the uncertainty of economic policy affected the capital shortage of financial companies in the new crisis of the event. The study found that if the response of policy-makers and politicians was not timely and decisive during the severe market downturn, then there would be a price for the delay. Joseph6 used the classical stability theory to model the complex social and political system, and the causes of social collapse were studied. Chen et al7,8 analyzed the polarization of public opinion in group behavior based on the SIR model, and at the same time considered the influence of external information and individual internal characteristics on the polarization of public opinion. Alexander and Yusaku9 took Japan as an example, and carried out a survey experiment to let citizens understand the policy information of the US, which varied according to the source, policy content, and problem prominence. The results showed that when the source signal (Trump attribution) led to negative views in the US, policy content (cooperative than uncooperative) had a greater impact on shaping the opinions of American citizens. Ho10 analyzed the success factors of a convalescent tourism policy, and discussed the priority and importance of success factors of the recuperation tourism policy by using an AHP analysis method. Yin11 redefined the theory of the political system based on the agenda setting theory in communication science, and constructed a “network public opinion decision hypothesis model” to analyze how and to what extent network public opinion affects government decision-making. In addition, as there are many types of policies, some scholars have classified the policy tools, among which Rothwell and Zegvelk12 were the most representative ones. When studying industrial innovation and public policy, they divided the policy tools into three types: Environmental policy tools, Supply-oriented policy tools, and Demand-oriented policy tools.
In spite of various studies on tourism policy, even though some scholars explore the effects of tourism policy implementation, few scholars study the optimal combination of tourism policy, namely through the data mining of online reviews, research released by any combination of tourism policy content can bring about a better social effect. In addition, as far as the social effects of tourism policies are concerned, there is still a lack of objective analysis based on network text data, so the research methods need to be innovated. In view of this, this paper takes the Weibo comments as the data source to find out the optimal combination that can make tourism promotion policies exert the greatest social effect, so as to provide suggestions on the content form of policies issued by government departments.
In order to understand the actual effect of policy implementation, scholars have conducted relevant studies on the evaluation methods of the policy implementation effect. Kim et al13 studied the “free public transport” policy and the “citizen participation alternative day no driving” system implemented by Seoul government in order to reduce dust. They adopted a regression analysis method to analyze the impact of traffic on fine dust, and used text mining technology to analyze the response of two traffic policies and citizens’ petition, and proposed policy improvement direction according to the research results. Lee et al14 used text mining technology and emotional text analysis technology to test the online evaluation of Japanese tourism websites after the 2011 Japanese tsunami, and studied the impact of the tsunami on Japan’s tourism industry. The results show that the low exchange rate and the positive sentiment of online reviews from tourism websites have a positive impact on the number of tourists to Japan. Chen et al15,16 used text mining and emotion analysis methods to implement the effect of online education under the epidemic situation. Also, the experience effect was studied from the perspective of user and platform. Bucek17 used text mining technology to investigate the twitter accounts of US President Barack Obama from March 2012 to January 2016, so as to study whether politicians’ behavior on social networks would affect actual economic policy. Qi et al18 analyzed the innovative fiscal policy texts of provinces and cities in China based on python, so as to understand the regulation and control of tax policies. The results declared that fiscal policy and regional innovation capability showed obvious spatial heterogeneity, and R&D investment and industrial structure were the main sources of improving innovation capability. Sun19 proposed an evaluation scheme to optimize the policy process by using sorting and clustering strategies, and proposed a combination algorithm combining the algorithm with policy priority evaluation. Finally, satisfactory policies and rules were selected to improve the matching speed. The experimental results showed that the method reduced the matching operation and improved the evaluation efficiency. Pellesova20 discussed the technology of using an econometric method to optimize economic policy, mainly studied the target variable method, and explored the advantages and disadvantages of the selected method and its possible application in the formulation of optimal economic policy. Dash and Kajiji21 proposed a mixed integer nonlinear objective program (MINLGP), which aimed to solve the model of multi-objective portfolio optimization decision-makers facing binary hedging decision-making between Portfolio Rebalancing periods. It was found that when percentile risk measurement was used, the expected catastrophic loss of the best diversified portfolio of hedging was obviously less than that of non hedging products. Yang et al22 evaluated the impact of the recently implemented policy of improving gasoline quality on reducing the concentration of fine particulate matter (PM). The study illustrated that it was difficult to completely solve the particulate pollution problem in China by a single policy, and a series of policy system designs were needed to alleviate this problem. Geng and Kamal23 analyzed the optimal policy options for two main types of price regulation in China, and found that the domestic optimal external reference pricing (ERP) policy reduced domestic prices while maintaining export incentives for enterprises. Maansi and Nomesh24 measured the efficiency of Indian high courts using Data Envelopment Analysis (DEA). Secondly, they studied the impact of including pending cases on judicial efficiency. Kelly et al25 proposed a composite index to assess home-heating energy-poverty risk across 18,641 small area clusters in Ireland. The index offered the capacity to analyze changes in energy-poverty risk associated with specific policy intervention proposals, including major contemporary environmental policy transitions. Elke and Andreas26 examined the acceptance of burden sharing rules by using multivariate binary and ordered Probit models. The rule involved the costs of the German energy transition, which was one of the most challenging and disputed national climate and energy policy measures. The results declared that polluter-pays rule had by far the highest support. Carlotta et al27 used Random Forest and Gradient Boosted Regression Trees algorithms to predict the response of freshwater ecosystems to multiple anthropogenic pressures, with the goal of informing the definition of water policy targets and management measures to recover and protect aquatic biodiversity. Ekaterina et al28 confirmed a positive impact of the zone merger on the gas trading market’s spatial equilibrium and indicated the causes of remaining market inefficiencies used by an extended parity bounds model, which provided a tool for evaluating the efficiency of policy decision-making. Dong and Liu29 analyzed the optimal functioning power of policies and determined the direction of future policy implementation. This paper utilized the COPA framework to analyze policy evolution in respect of the new-energy vehicle industry (NEVI). Smith and Hasan30 discussed the methods and practices involved in quantitative evaluations of implementation research studies, and analyzed available measurement methods for common quantitative implementation outcomes involved in such an evaluation-adoption, fidelity, implementation cost, reach, and sustainment, and the sources of such data for these metrics using established taxonomies and frameworks.
According to the above literature, many scholars have studied public policies and built many models. However, due to the epidemic, the formulation of tourism policies should also take the characteristics of emergencies, health, and safety into account. At present, there are few studies on this aspect in the literature. Therefore, this paper takes the implementation of the promotion policy as the background, classifies policy, analyzes online reviews, uses the binary regression model to evaluate the implementation effect under a different combination of policies, and finally selects policy combination ways with better effect, which provide a decision basis and support for the release of the government’s policy.
Analysis on Supporting Policies of the Cultural Tourism Industry During COVID-19
The status of the cultural and tourism industry during COVID-19 needs to be analyzed before analyzing the implementation effect of the tourism revitalization policy issued by the government. In light of the update of the epidemic, when should the government issue policies? What policies have been issued? What topics have been discussed on Weibo? Which media does report the policy heavily? What kind of publicity effect did it have? Based on this, the current situation of tourism is elaborated below, and the current implementation of decentralized tourism revitalization policies are summarized. More topics related to tourism policies discussed by the public are selected through the Microblog platform, and the online comment data of the public are retrieved, so as to prepare for the subsequent in-depth analysis of the social effects brought by the implementation of policies.
A Brief Analysis of the Current Situation of the Cultural Tourism Industry in China
The outbreak of COVID-19 at the end of 2019 spread rapidly across the country and seriously affected China’s economic and social development and people’s livelihood. In particular, the impact of the epidemic on the tourism industry includes both direct losses of many tourism enterprises and related employees and indirect losses of related industries in the tourism industry. Just consider the Spring Festival, the direct economic loss caused by the shutdown of China’s tourism industry is as high as 400 to 500 billion Yuan, resulting in the annual expectation to change from a “year-on-year growth of about 10% to a negative growth of 14% to about 18%. On January 24, the General Office of the Ministry of Culture and Tourism of China issued an Urgent Notice on COVID-19 prevention and control to suspend the business activities of tourism enterprises, requiring travel agencies and the online tourism industry of China to suspend the operation of group tourism and “air ticket + hotel” tourism products. As of February 1, 450 million people had canceled or postponed their Spring Festival trips.
Statistics show that during the Spring Festival in 2018, the country received 386 million tourists, rising 12.1% year on year. Tourism revenue reached 475 billion Yuan, rising 12.6% year on year. During the Spring Festival in 2019, 415 million tourists traveled across the country, rising 7.6% year-on-year. Tourism revenue reached 513.9 billion Yuan, up 8.2% year on year. By 2020, more than 450 million tourism revenues have been lost. At the same time, online travel agency (OTA) platforms such as Ctrip and Tuniu have invested more than hundreds of millions of Yuan in cancellation fees, and more than 260,000 travel agencies are struggling. According to STR, the hotel occupancy rate on the Chinese mainland peaked at 70% in early January 2020, and began to plummet a day later, plummeting to 17% on January 26.
As can be seen from the above brief description of the current situation, with the sudden outbreak of COVID-19, the Chinese government responded quickly and took various measures to block the transmission channels of COVID-19. As it turned out, China suddenly went into a “dormant” state. However, the economic development, especially the development of the tertiary industry, has encountered regression this year. The cultural and tourism industries, which are characterized by crowd gathering, bear the brunt of the contraction. How much impact will this “disaster” have on economic development? Can the cultural tourism industry survive? Is tourism a fragile industry? Experts, scholars, and ordinary people are concerned about these issues.
Supporting Policies of the Cultural and Tourism Industry During COVID-19
The cultural and tourism industry is a modern service industry with human service targeted with human services. Its basic feature is the movement of people, and the pursuit of security is the primary condition for people’s needs. By May 2020, the epidemic prevention and control situation in China has been stable, laying the foundation and creating the basic conditions for people to travel safely during the May 1 holiday. Since the outbreak, the industry has acquired high attention from international organizations to the central ministries and commissions, and from local government, industry association to the tourism enterprises, and tourism-related aspects. Taking positive action and dealing with unprecedented pressure that the tourism industries are facing should manage well in two aspects: the first is to provide epidemic prevention and control, the second is to introduce all kinds of policy for supporting all kinds of damaged industries and enterprises. As for the various policies issued by the government, through the Internet reports of major media, the public can express their own opinions and cognitive emotions on the public events they care about, thus forming mixed opinions on the revitalization of tourism policy.
Based on the comprehensive analysis of Weibo content and online comment related to the policy of “revitalizing tourism”, this paper summarizes the policies that netizens have paid close attention to and discussed enthusiastically, striving to cover and describe the public’s response to the government’s policies in the cyberspace to the greatest extent. Firstly, this paper summarizes government policy as five major series and regards them as the first-level subject category, collects the network comment, and chooses the topic with most comments on each category acknowledged by the CCTV news, the blue whale financial journalist work platform, Sina News, People’s Daily, and the Paper. Further, it uses the octopus Weibo topic review as a selected collection to distinguish between policy and Weibo topics. In order to distinguish policies and the post in Weibo, ”#” is used to annotate. The categories of policies and online discussion topics for revitalizing tourism are shown in Table 1. (The number of the comments in Table 1 are all from Weibo. The limitation search of Weibo is as follows: first, it may produce a lot of meaningless information; second, the search of Weibo still adopts the traditional way, and the information content cannot be reprocessed.)
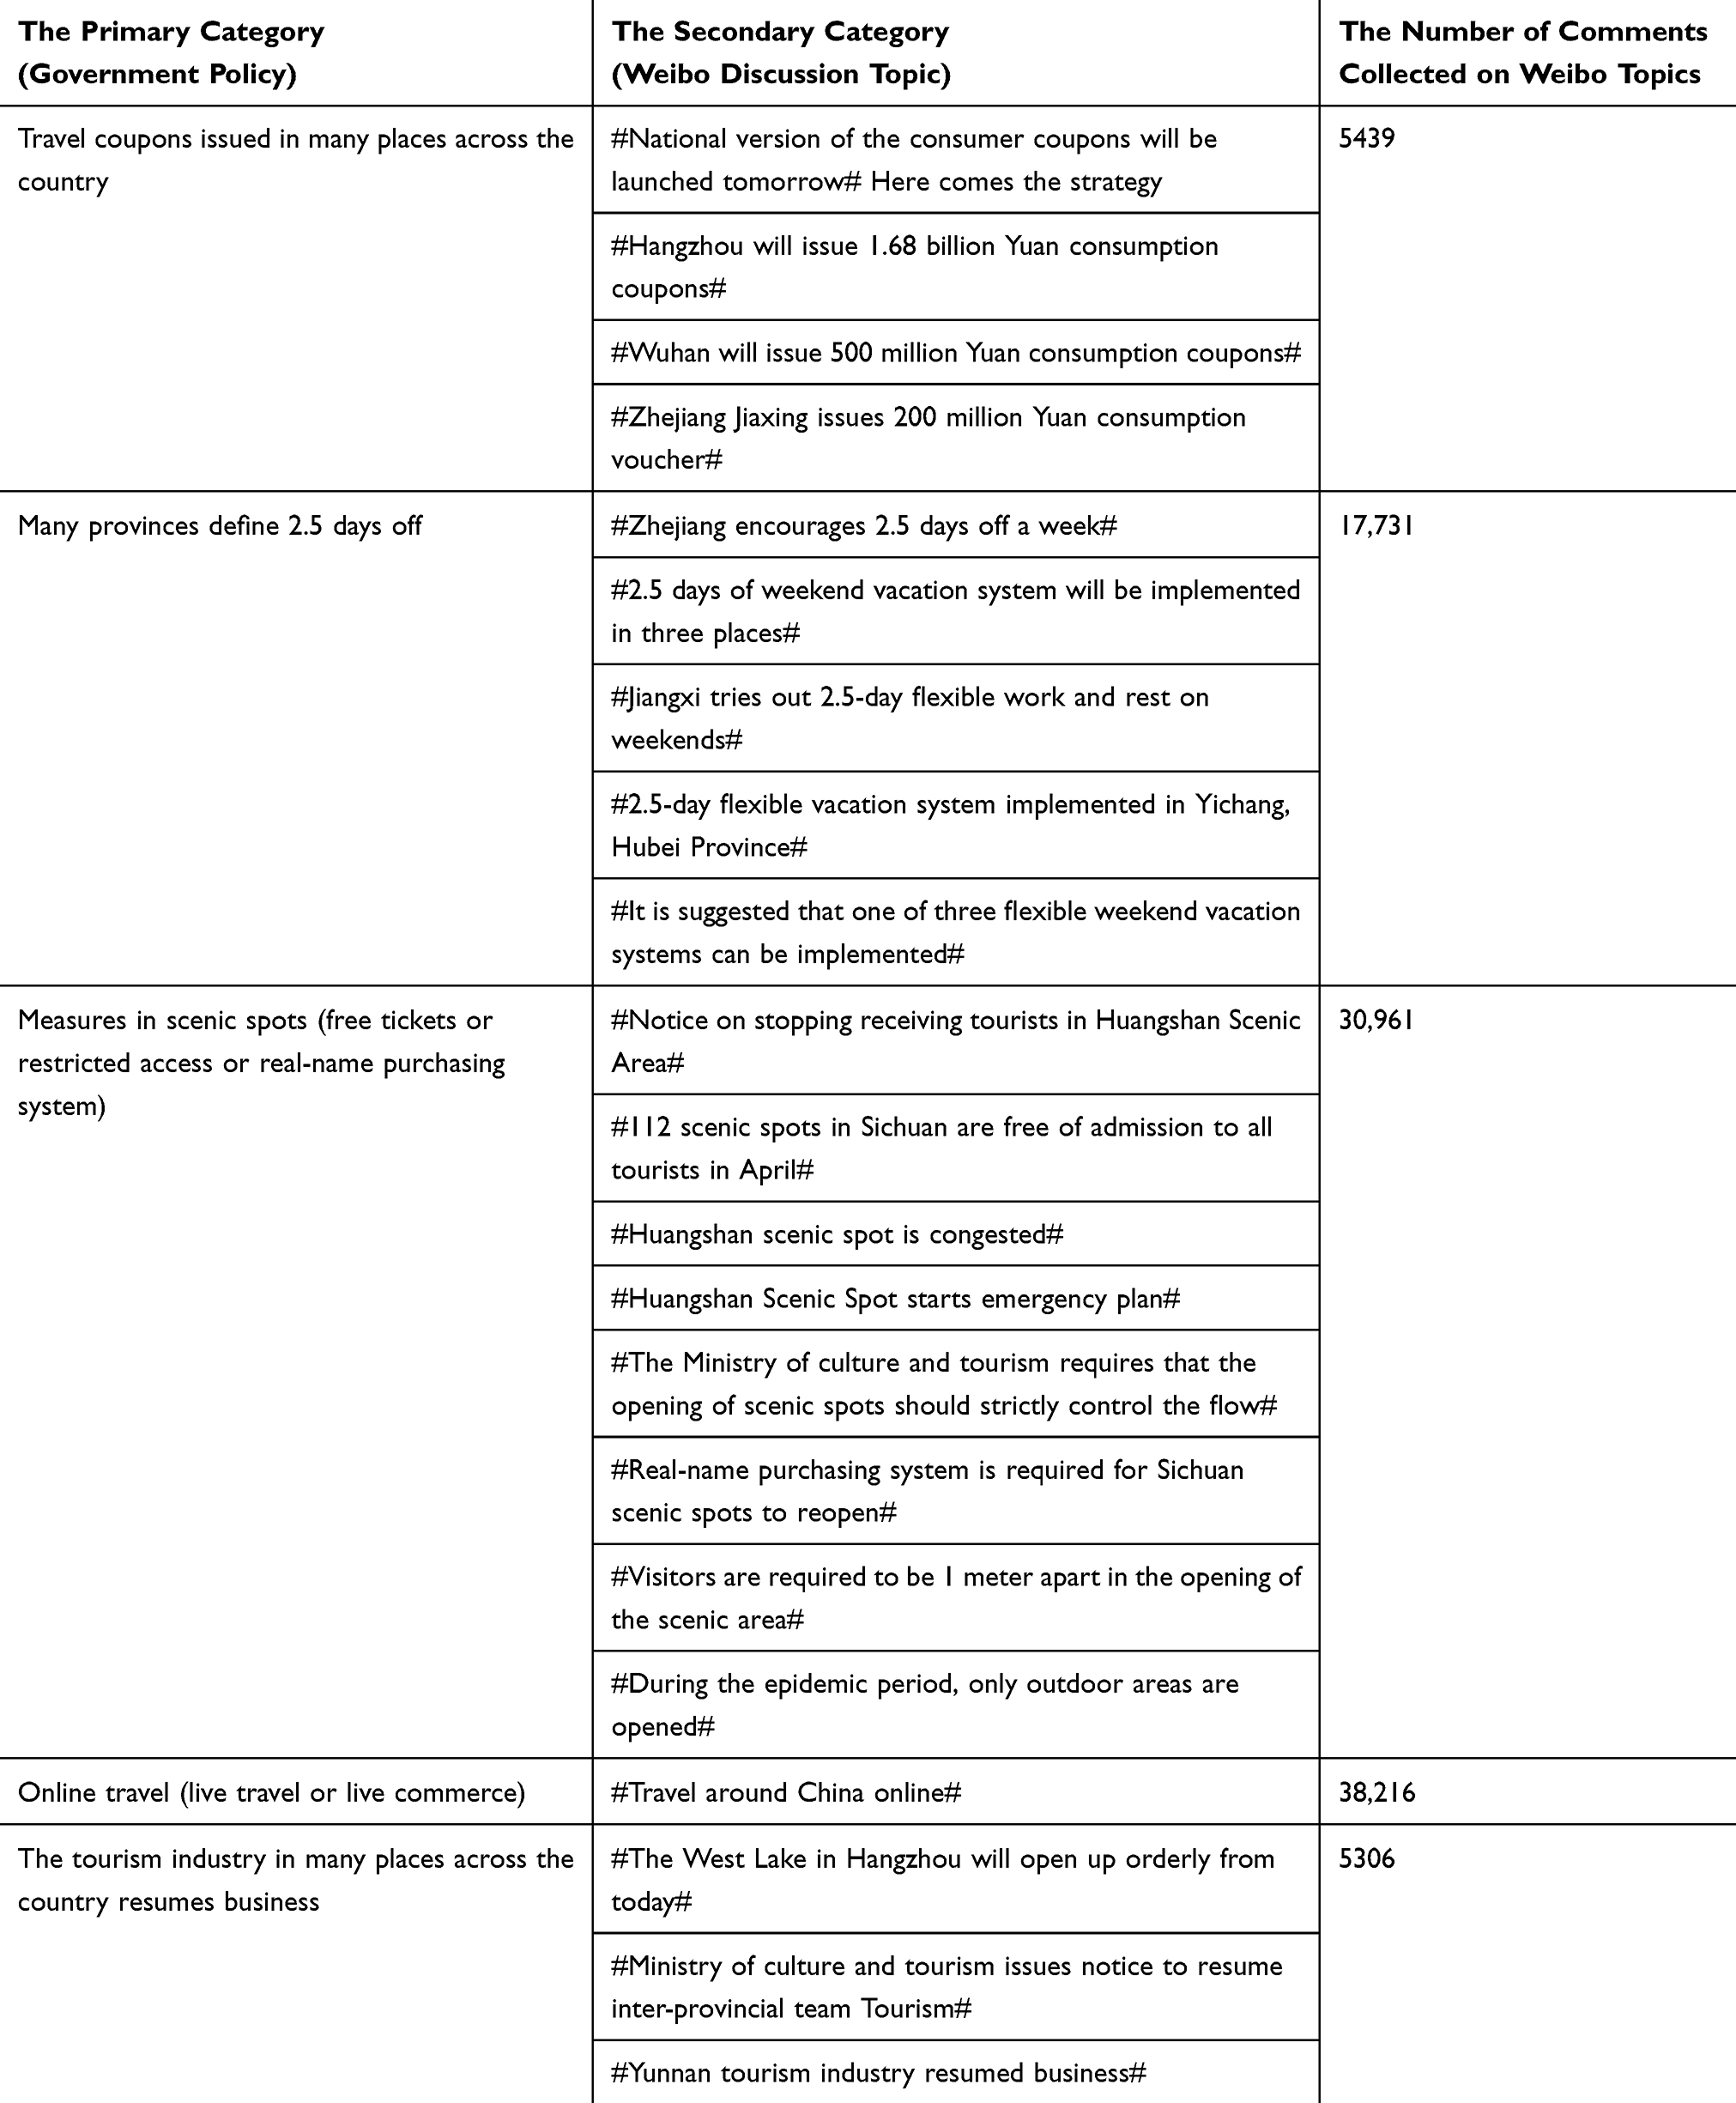 |
Table 1 Policies on Revitalizing Tourism and Classification of Online Discussion Topics |
Data Mining Based on Online Comments of Travel Policies During COVID-19
The Internet represents an important channel for people to express their interests and emotions. Since the COVID-19 outbreak, people have become more vocal on the Internet due to restrictions on travel, and there has been a lot of discussion about the travel-related topic. As a reflection of public sentiment, the influence of online public opinion is not only manifested in its influence on major developments, but also penetrates the political level, becoming an important channel for the government to listen to the voices of the people and understand public opinion. In order to explore the public’s attitudes towards various official tourism policies during COVID-19, this section conducts data mining on the comments on the Weibo topic mentioned above. Firstly, the data of netizen comments were selected and cleaned, then the pre-processed netizen comments were analyzed from the perspective of policy perception, and the categories of policies were divided. Finally, the visualization analysis and emotional analysis of netizen comments were conducted based on different policy categories.
The Selection and Cleanout of Comments
According to the second-level microblog topics, comments on Weibo topics at different times were selected as the research objects. In the first category, under the government policy “online tourism,” the topic #Travel around China online# and the netizens’ comments from April 25 to May 5, 2020 were selected. In the second category, under the government policy of #Many provinces define 2.5 days off#, the netizens’ comments on five topics on January 14, 2020, from March 19 to April 1, from April 26 to July 24 were selected. In the third category, under the government policy #Measures in scenic spots (free tickets or restricted access or real-name purchasing system)#, eight hot topics were selected and the discussions were divided into two categories: because Huangshan Mountain scenic spot was congested, the government introduced a series of policies for the situation rapidly to adjust scenic spot, which arouses heat discussion in the Internet. The comments with regard to #Huangshan Scenic Spot starts emergency plan# from April 5 to April 6 were collected. After the introduction of policies for national scenic spots, the comments were collected from February 19 to March 18, and from April 13 to April 15. In the fourth category, under the government policy #The tourism industry in many places across the country resumes business#, the netizens’ comments from February 21 to April 29, 2020 and from July 14, 2020 to July 15 were collected. In the fifth category, under the government policy #Travel coupons issued in many places across the country#, the netizens’ comments from March 26, 2020 to July 1, 2020 were selected.
Through octopus crawling to get the corresponding Weibo topic comments, as the original data contains some trivial comments, these trivial comments will interfere with the subsequent analysis results, so the trivial data needs to be processed. In view of the requirement of emotion analysis, the data needs to be processed. First, the symbols, emoticons, punctuation, and some useless marks in the comments should be removed. The second is to clean out comments irrelevant to the policy, such as advertising, the word count comments, etc. The software Python is mainly used to remove Chinese and English symbols, emoticons, invalid texts (such as “ah”, “en”, and other modal words, comments that are not related to the tourism topic of this article, and irrelevant advertisements), and some key codes to realize this function are as follows: import re; the line = line. decode (“utf8”); String = re.sub (“ [\s +\!\/_ $% ^ * (+\“\”] + | [+ -.??, ~ @ # $% and * () “+”. decode (“utf8”), ““. decode (“utf8”),line). The data after cleanout is shown in Table 2.
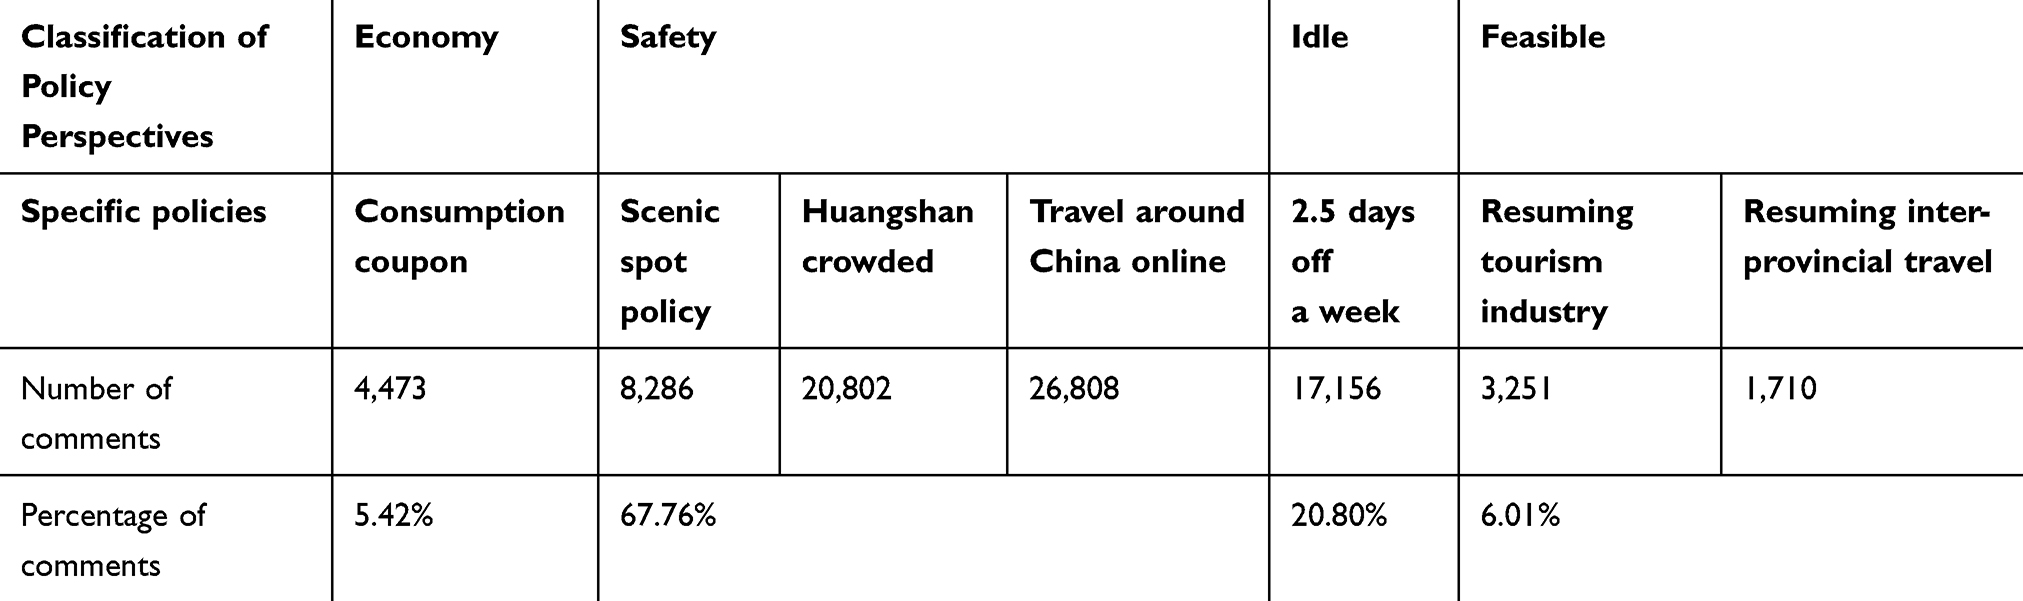 |
Table 2 Selected Data After Cleanout |
Analysis of Netizens’ Perception of the Policy
The Classification of Comments
Netizen perception refers to whether the netizen’s understanding of the policy is consistent with policy-makers’ desired goals. From the perspective of policy, this paper divides the above five policy categories into four categories, namely, economy, safety, idle, and feasible category. The economy category refers to the policy-makers’ expectation to achieve the purpose of promoting the economy through the policy, such as “consumption coupon”. The safety category refers to the policies formulated by policy-makers to avoid crowd gathering and virus cross-infection in scenic spots from the perspective of safety, such as “Scenic spot policy”, “Huangshan crowded”, and “Travel around China online”. The idle category refers to the policy made by the policymaker from the perspective of whether tourists have free time to travel, such as “2.5 days off a week”. The feasible category refers to whether the scenic spot is open, such as “Resuming tourism industry”, “Resuming inter-provincial travel”.
Although policymakers formulate from the above four perspectives, different netizens have different understanding of policy. Taking coupon for example, some netizens consider it from an economy perspective, and point out that “in order to stimulate consumption, various places think about the different ways”. From a safety perspective, some netizens think “it will lead to offline congestion, which is not safe”. Therefore, in order to understand netizens’ perception of the four types of policies, we divided netizen comments into five types according to their comment content and designated tag numbers for subsequent data processing. The specific division criteria are shown in Table 3.
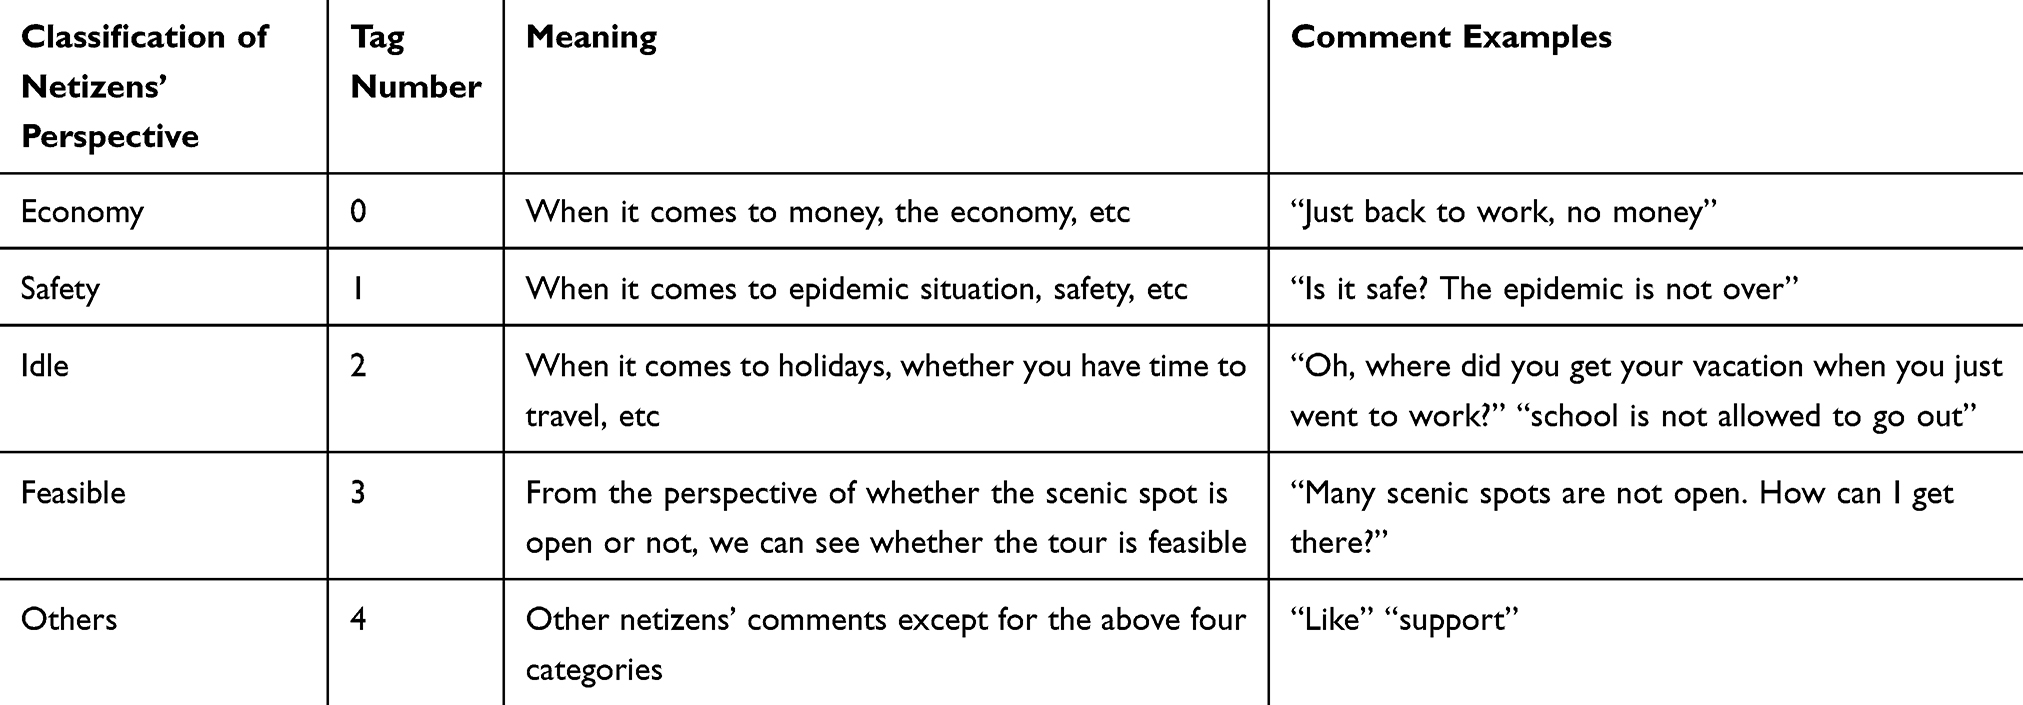 |
Table 3 Policy Division Criteria from the Perspective of Netizens |
According to the above criteria, all the comments made by netizens should be classified. Since the total number of comments on all policies is as huge as 82,486, TextCNN convolutional neural network is adopted in this paper to automatically classify the comments. TextCNN is a deep learning algorithm. By inputting a training set and a verification set with classification tags, the computer can automatically learn the classification method, so as to classify and predict other data. The algorithm includes five parts: word list construction, word vector construction, convolution, maximum pooling, and K classification. The specific steps for classifying netizen comments are as follows:
1) Data cleaning: emoji, spaces, blank lines, and other contents should be cleaned up to make the message content more concise. Remove invalid messages, such as duplicate 1, 11, etc.
2) Training data selection: 20,000 pieces of data were randomly selected from more than 80,000 comments for model training, accounting for about 25% of the total data. A better model training effect will be achieved. The policies of each category were selected in proportion, and finally 1,240 economic categories, 12,600 security categories, 4,780 free categories, and 1,380 feasible categories were selected.
3) Manual labeling of the selected training data: the selected netizen comment data of a total of 20,000 pieces were manually classified according to the classification labels of five types of netizens, and each data was labeled (label number is 0–4).
4) Training neural network model: 20,000 pieces of data were randomly divided into a training set, validation set, and test set according to a proportion of 80%, 10%, and 10%, and put into the model for training. The test set was used to test the classification accuracy of the final trained model, and the results showed that the accuracy of the training set reached 88.6%, indicating that the model training effect was good and could be used for classification prediction.
5) Prediction by model: The model trained in the previous step is used to automatically classify the remaining more than 60,000 pieces of data.
The Analysis of Results
All comments were classified by the above steps, and the classification results are shown in Table 4.
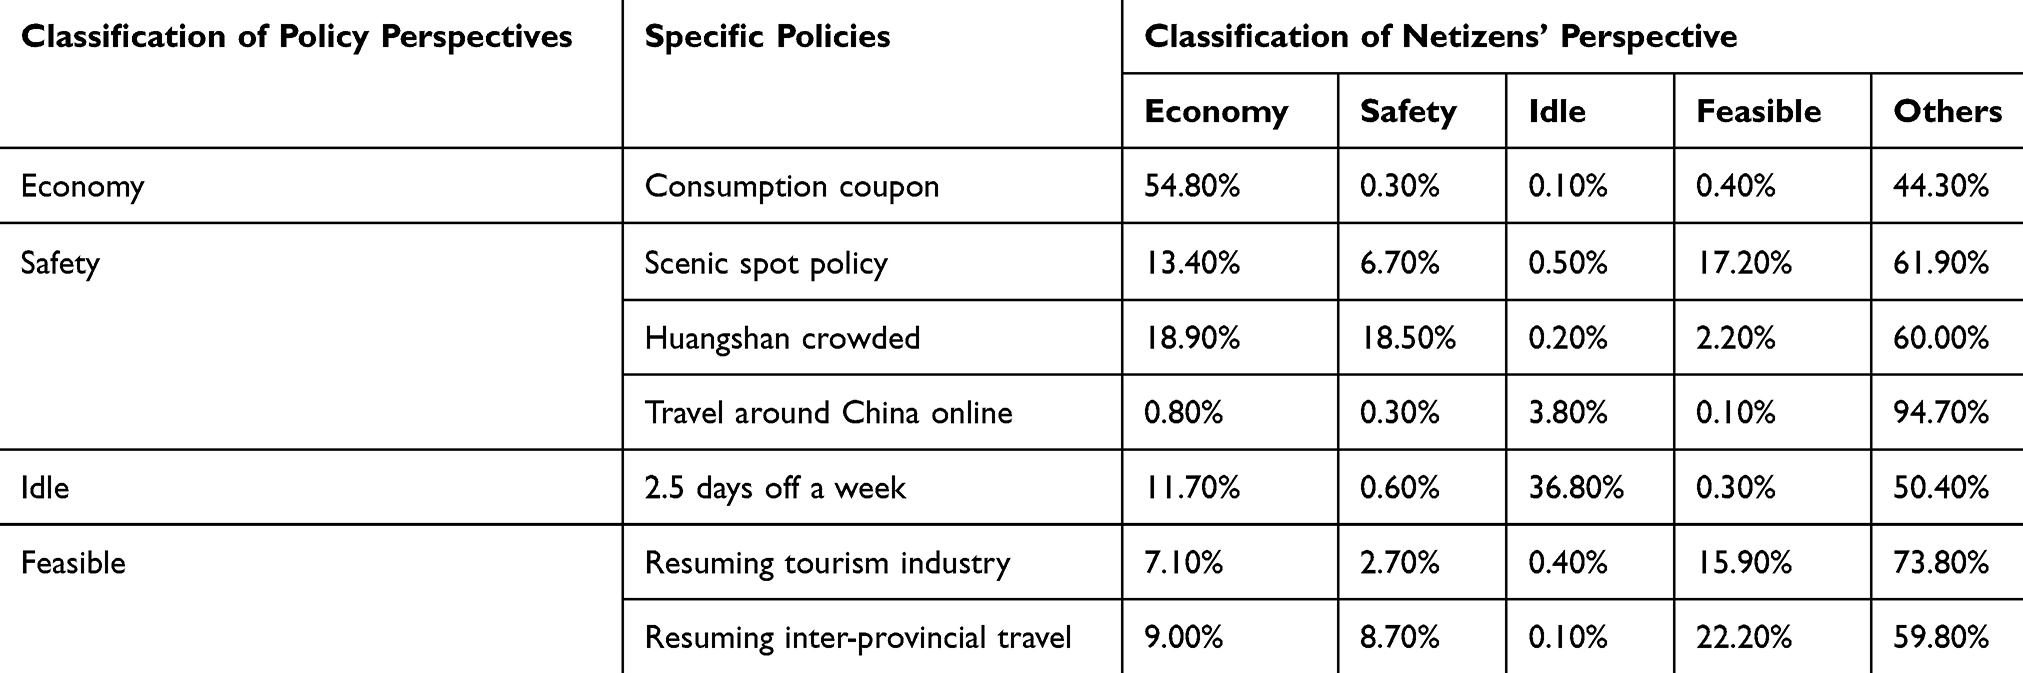 |
Table 4 Classification Results of Netizens’ Comments |
As can be seen from Table 4, netizens’ comments are mixed with many contents irrelevant to the policy perspective, that is, comments of other categories take up a large proportion. In addition to these unrelated perspectives, netizens have different perceptions of various policies.
Overall, the perception of policies is ranked as economy > idle > feasible > safety.
In terms of economy, “consumption coupon” policies were the most popular, with 54.8% of netizens expressing their views from an economic perspective, which may be related to the timing and characteristics of the coupon policy. Consumption coupon aims to stimulate the social economy after the epidemic turned around, when the epidemic was not serious and people were less worried about safety. At the same time, the policy also has low requirements for travel. People can use coupon for offline dining and shopping without worrying about no free time.
In terms of safety, the netizens’ perception of the three policies was relatively low, with 6.7%, 18.5%, and 0.3% of the netizens respectively expressing their opinions from the perspective of safety. Under the “scenic spot policy”, most people think about the travel problem. Under the topic #Huangshan crowded#, people have considered both economy and safety issues. Some people mentioned the economic help of the free ticket policy, but people are still concerned about the virus infection caused by cluster behaviors during COVID-19. Under the topic of #Travel around China online#, people expressed their opinions from a more free perspective, such as “Travel around China online every weekend at 9:30 am”. This policy allows people to enjoy the beautiful scenery of different places without leaving home, which disperses the risk of crowd gathering brought by offline travel, and there is no time limit.
In terms of idle, netizens with the #Many provinces define 2.5 days off# policy perceived better, with 36.8% of netizens expressing their opinions from the perspective of idle. Some netizens were skeptical of the policy, saying “we don’t even have a two-day weekend anyway.” Some netizens understood the purpose of the proposal, saying that “tourism is an important pillar of future development, so we can take a few more days off.”
In terms of feasibility, netizens’ perception of the two policies was general, 15.9% and 22.2% of netizens, respectively, expressed their opinions from the perspective of feasibility. In early February, netizens commented on the restoration of the scenic spot, questioning whether it should be open to the public. In April, when the epidemic was greatly controlled in China, most netizens expressed their support for the opening of the Yellow Crane Tower scenic spot, saying that it was getting better and better after a long time.
Visual Analysis Based on Different Policy Categories
The online comments of the public on the policies during the epidemic period were obtained from the websites. As they were relatively redundant and dispersed, the software ROST CM5.8.0 was used to classify the emotional tendency of user comments, and analyze the policies that aroused better public perception and the emotional tendency of the public on such policies. Then, according to the visual analysis technology of the semantic network, the hot public concern about the travel during the epidemic period is mined, which can be used as the basis for the follow-up test of whether the public perceives the policy.
Sentiment Analysis
ROST CM31 software is a digital research platform for humanities and social sciences based on content mining. It is a group of digital academic research platforms with close functional connections, which can collaborate intelligently with each other, and finally conduct an intelligent analysis of humanities and social sciences according to a certain paradigm. ROST CM software is capable of semantic network and emotion analysis. In this paper, ROST CM5.8 is used for emotion analysis, and the analysis results are used to integrate the proportion of positive, neutral, and negative comments brought by the implementation of four kinds of policies during COVID-19, as shown in Table 5.
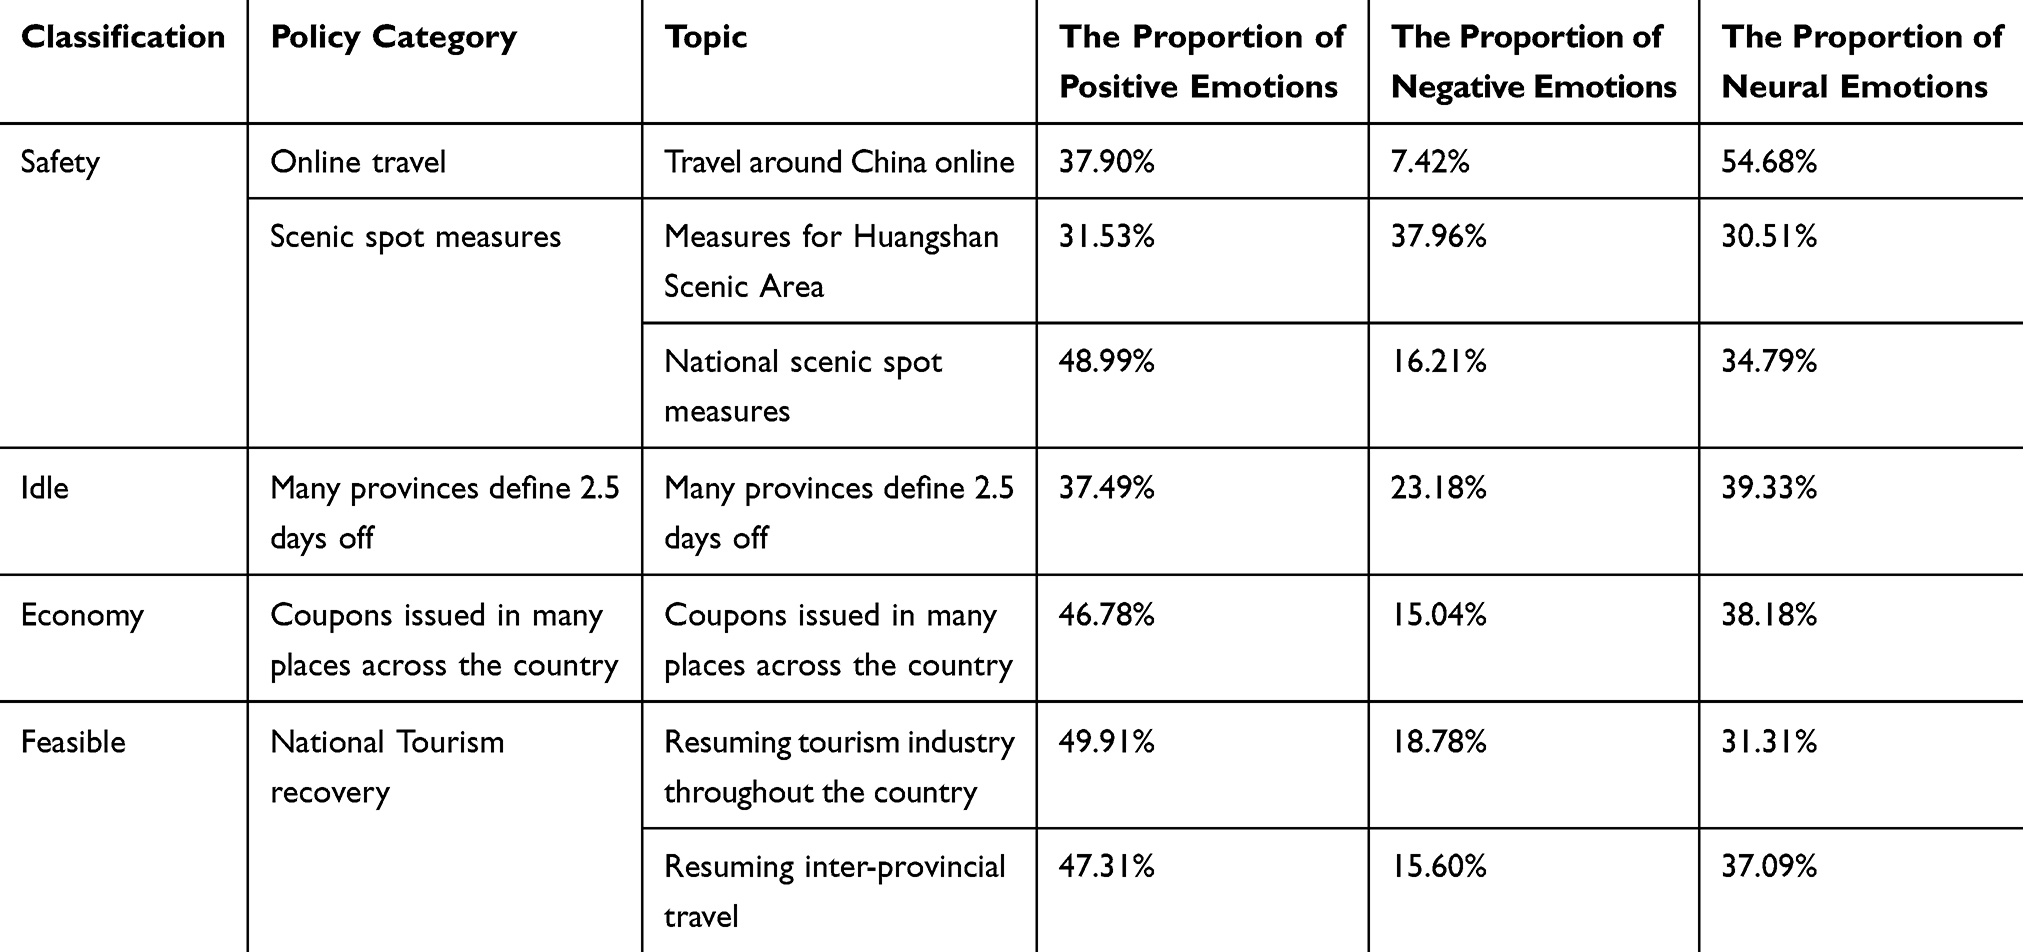 |
Table 5 Sentiment Analysis of Various Weibo Topics |
According to the proportion of positive, neutral, and negative comments in Table 5, 37.90% hold a positive attitude, 54.68% hold a neutral attitude, and only 7.42% hold a negative attitude towards the online tourism policy issued by the government, indicating that most netizens have a favorable impression and support this policy. For tourists to gather together after Huangshan scenic spot opened, although the government issued a series of measures to control the flow, 37.96% of the population held a negative mood for this event, which is more than the number of people with positive emotions. It indicates that government departments should prepare for emergency measures and security measures before opening a scenic spot, rather than wait and solve problems when they arise. Measures of the scenic spots in the country mainly include “online booking”, “flow restriction”, etc. Then, 48.99% of the people show positive emotions, which are far more than negative emotions, indicating that the implementation of scenic spot measures in various places has a significant effect, which can give people enough sense of safety during the trip. The negative comments on the “2.5 days off” policy reached 23.18%, when the positive comments reached 37.49%. Although the government called on every medium enterprise to extend rest time, under COVID-19, employees hope to recover economic loss as soon as possible, so more people heold a neutral attitude. Under the “economy” policy, 46.78% of netizens held a positive attitude, while only 15.06% hold a negative attitude, indicating that most netizens held a positive attitude in support of the policy. It can be seen from the “feasible” policy that the number of people holding positive emotions in this policy is much higher than the number of people holding negative emotions, by more than 30%, indicating that this policy is supported by the masses.
Visual Analysis Based on Semantic Network Under Different Policy Categories
According to ROST CM analysis of the proportion of positive and negative opinions in people’s online comments, those posts under the four categories of policies, namely “safety”, “idle”, “economy”, and “feasible”, are generally positive. Here, in order to obtain the major concerns of the public under each type of policy, semantic network visual analysis was adopted to analyze the online comment data of the four policies under the background of COVID-19. The semantic network is one of the representations of an artificial intelligence program, which expresses human knowledge construction in the form of a network. It consists of arcs between nodes, where nodes represent concepts (events or things), and arcs represent relationships between them. The semantic network diagram is used to represent the degree of association between words and reflect the most concerned words in user comments. The main purpose is to find the words that are mentioned most in netizens’ comments, so as to judge whether people perceive the content of the policy. By ROST CM5.8.0 analysis, a relevant semantic network diagram can be obtained. Figures 1–7 represent the semantic network diagram of user comment content under each travel topic, and represent the relationship between words in each user comment content.
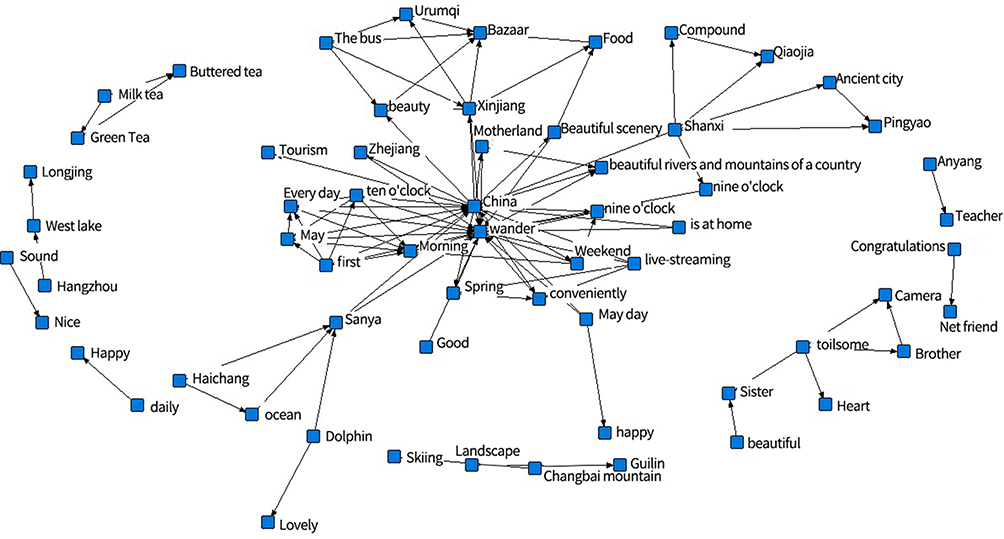 |
Figure 1 Semantic graph of #Travel around China Online#. |
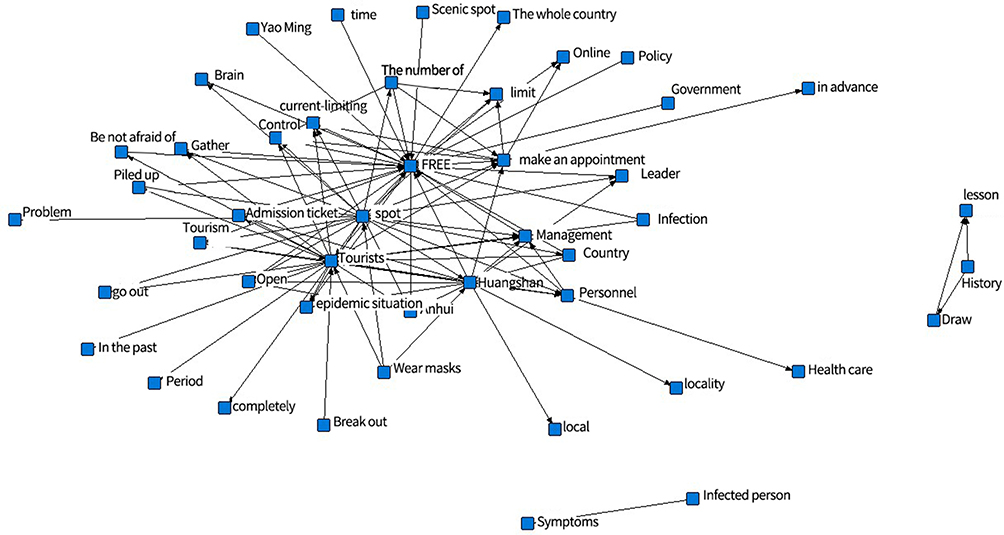 |
Figure 2 Semantic graph of #Huang shan Scenic Spot measures#. |
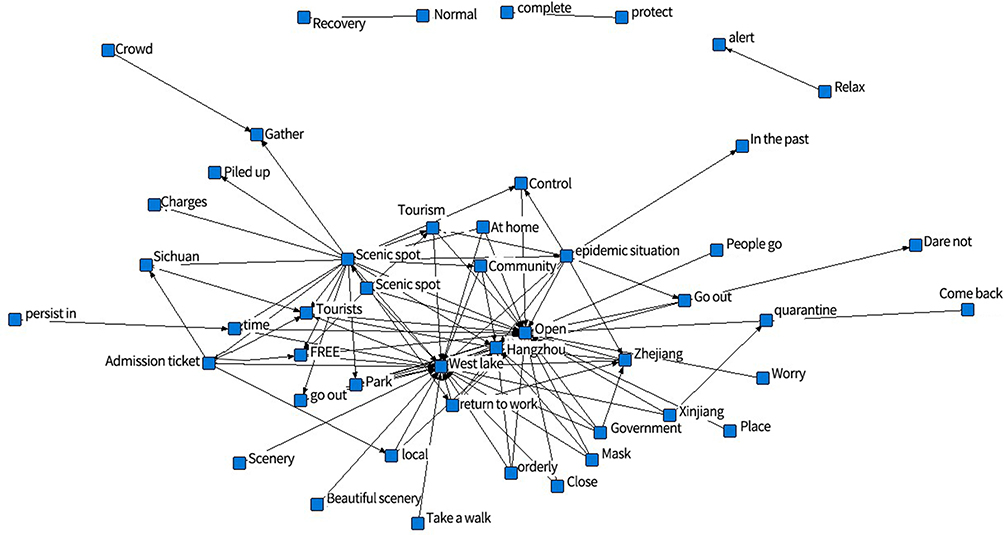 |
Figure 3 Semantic graph of #National Scenic spot measures#. |
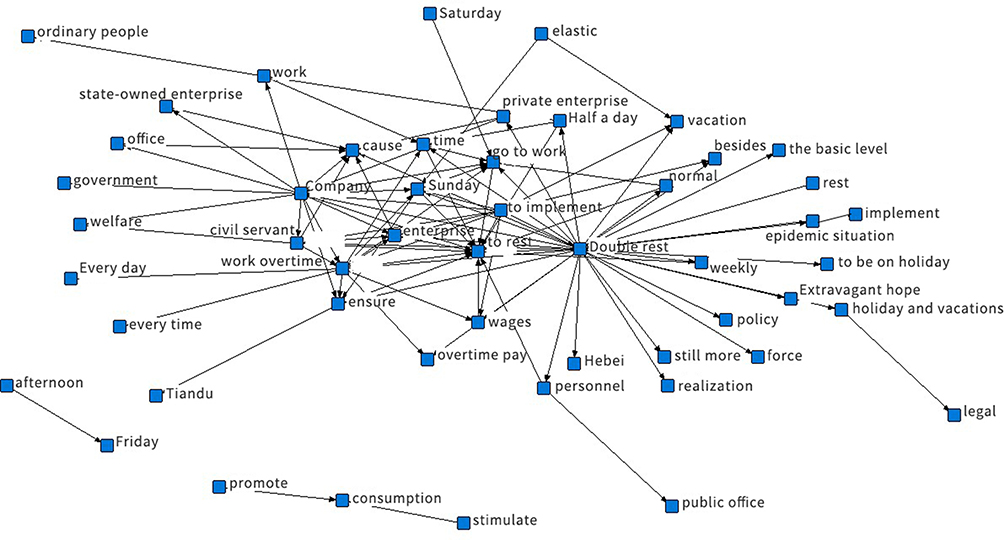 |
Figure 4 Semantic graph of #Many provinces define 2.5 days off#. |
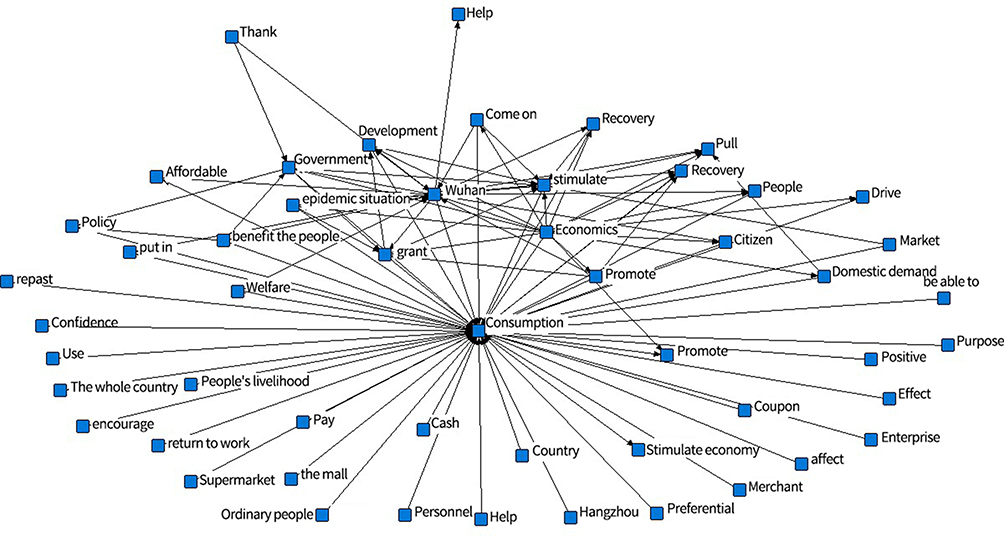 |
Figure 5 Semantic graph of #Coupons issued in many places across the country#. |
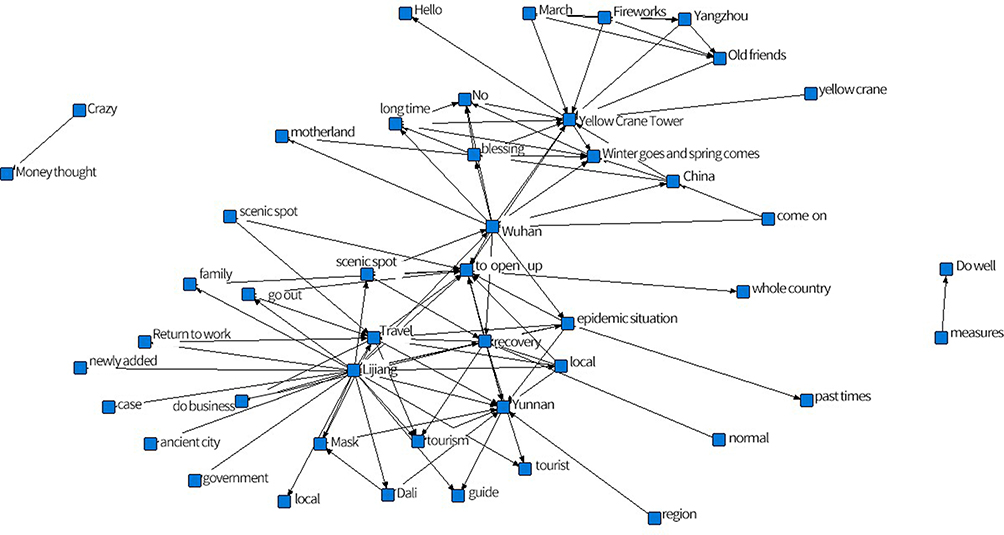 |
Figure 6 Semantic graph of #Resuming tourism industry throughout the country#. |
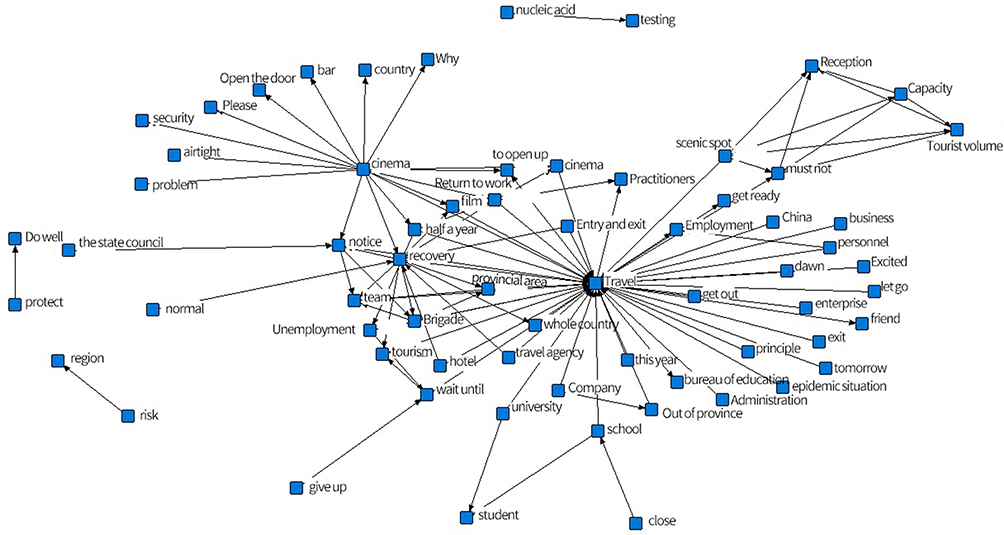 |
Figure 7 Semantic graph of #Resuming inter-provincial travel#. |
The semantic graph of the Internet is obtained by analyzing the comments made by netizens under the topic of #Travel around China Online#.
From Figure 1, netizen focus more on the reporters and anchors of online travel live-streaming. “Travel around China online” is broadcasted at a fixed time every day. Generally speaking, beautiful anchors or journalists attract more audience, especially web celebrity “Weiya”. Affected by the COVID-19 epidemic, people can neither travel abroad nor buy travel products. Through online mode, people can be personally involved and promote the consumption of tourism products in remote areas. According to Figures 3 and 4, Xinjiang, Sanya, Shanxi Pingyao, Changbai Mountain, Guilin, and other places have attracted more netizens’ attention. Through live streaming of local food and scenic spots, people want to travel in person, which accelerates the sales of tourism products.
In addition, the Internet semantic graph of Figures 2 and 3 is obtained by analyzing the comments made by netizens under the topics #Huangshan Scenic Spot measures# and #National Scenic spot measures# on Weibo.
Since announcing it was open, Huangshan Mountain scenic area has been crowded, indicating that, after stabilizing of the epidemic, the majority of people are chasing for tourism, but congestions cause certain difficulties for epidemic control. Huangshan Mountain scenic area started the emergency plan, stopped serving tourists, preventing a widespread infection epidemic. It can be seen from Figure 2 that Tomb-sweeping Day (the first holiday after the epidemic), has become the relaxation of travel for people all over the country after they have been “confined” for a long time, which also increases the difficulty for the government to prevent and control the epidemic. “Wear Mask” has become important and necessary. In Figure 3, the nodes of “Anhui”, “Huangshan”, and “local” indicate that most tourists to Huangshan scenic spot are residents of Anhui province. Many tourism enterprises, such as Ctrip and Feizhu, have launched local and provincial tours to narrow the traveling scope and make the public feel more assured. As can be seen from the “current-limiting”, “making an appointment”, “free”, and “time” nodes, the government has taken measures such as online booking, limiting the visiting number of scenic spots, offering free tickets, and extending the opening hours of scenic spots to provide people with a safe place to travel, and at the same time actively controlling the mass influx of people into scenic spots. Despite a series of measures to control flow, for the emergence measures taken by Huangshan, 37.96% of people hold a negative mood for this event, which is more than the number of positive emotions. It indicates while recovering tourism, government should consider unexpected circumstances, optimize emergency measures, and avoid crowding in advance.
The semantic graph is obtained by analyzing the comments made by netizens under five topics.
In order to stimulate the recovery of the tourism industry, the government proposed the “2.5 days off” policy. Hubei, Zhejiang, Jiangxi, Hunan, and other provinces responded positively. Figure 4 shows that around the “rest” node, most people mention “implement”, “work overtime”, “double rest”, “civil servants”, and “private enterprise”. It shows that most of the private personnel hope to implement 2.5 days off as early as possible, and guarantee their overtime pay. For state-owned enterprises, organizations and institutions, employees rarely work overtime compared with people from private sectors, so they do not extravagantly hope for 2.5 days off. It can be seen from the nodes “economy” and “development”, this policy is mainly aimed at stimulating people’s consumption in holidays and developing the economy. At present, most enterprises have responded positively to this policy by changing the former bonus payment into “complimentary travel products” or “company incentive group travel”, which promotes the recovery of the tourism industry. The sentiment analysis results of Table 5 show that negative emotions reached 23.18%, and the number of positive emotion accounts for about 10%. Some people paid hourly or daily encounter huge economic pressure, so they reduce the demand for tourism and extend working hours to afford their family expenses.
The semantic graph is obtained by analyzing the comments made by netizens under four sub-category topics.
In Figure 5, the above analysis result shows that the national policy of issuing coupons aims to “stimulate economy”, “benefit the people”, “provide public welfare”, and “stimulate the market”. The coupon platforms include “Alipay”, “Dianping”, and “Mafengwo”. As the most common application in the national people’s life, “Alipay” has spread to all industries. Hangzhou, the city where Alibaba is located, also responded positively to the government’s policies and issued 1.68 billion Yuan of consumption coupons. “Wuhan”, as an important node, is the city hit the hardest by the epidemic. For this reason, Wuhan issued 500 million Yuan of consumption coupons to stimulate Wuhan’s economy, encouraging small and middle enterprises to resume work and production, and increasing people’s welfare. According to the “Consumption” node in Figure 5, the government’s purpose of promoting tourism consumption by issuing consumption vouchers can be well accepted by the public. People can buy travel vouchers in advance, which can be used after the epidemic stabilizes, and it is also a kind of advance consumption. At the same time, the government also advocates daily consumption and issues a series of coupons. “Supermarket”, “the Mall”, and “Market” are all perceptions of the coupon policy. If the government wants to emphasize tourism vouchers, the content of the information should be clear when the policy is issued. The node “Positive” indicates that netizens are optimistic about the epidemic situation in China and are eager to travel after the epidemic stabilizes.
The semantic graph of the network is obtained by integrating and analyzing the comments of the netizens under three sub-categories of Weibo topics, as shown in Figures 6 and 7.
During April and the Tomb-Sweeping Day, that is, when the COVID-19 was gradually controlled, the tourism industry across the country resumed business one after another. Yunnan, as one of the major winter tourism destinations in China, relies mainly on the cultural tourism industry supported by the floating population economy. Cultural and tourism authorities at all levels are restoring confidence, optimizing the modern tourism governance system, and opening several scenic spots while strengthening of the epidemic prevention and control. In July, when the epidemic was controlled, the ministry of Cultural and Tourism announced the resumption of inter-provincial travel. At the same time, cinemas began operating. From the node “entry and exit”, “unemployment”, “half a year”, and so on, the issued policies for returning to work make the unemployed encouraged, ignite people’s inspiration to travel abroad, and solve the problems for employees with the need to leave the country for work or enterprises with foreign business. The node “nucleic acid”, “testing”, and “ protect” show that although the epidemic is in a stable state at present, the country has not taken the prevention and control of the epidemic carelessly.
The Social Effect Analysis of Tourism Policies Based on Binary Logistic Regression Model
The logistic regression model mainly studies the probability P of some phenomena and discusses the factors related to the probability P. In this article, studying whether people perceive the government policy belongs to the 0–1 binary classification variables. Therefore, by constructing a strictly monotone function Logistic (P) to study the model between P and the independent variables, this paper selects the binary logistic regression model.
Variable Selection and Data Definition
From the above analysis, various policies to revitalize tourism during COVID-19 arise people’s attention and discussion on the Internet. As the main channel of major government policy, the new media must consider the guiding force of influential people, who are represented by a large quantity of Weibo and fans. Combining the analysis of the emotional distribution and semantic network nodes after the visual characteristics of tourism revitalization policies under COVID-19, the netizen-related variables are selected from the perspective of netizens, including: total number of Microblogs, the timeliness of comments posted, the division of policy in the view of user, users’ emotional score (opinion tendency), thumb up number in netizens comments, the netizen comments, the gender of the netizens, the number of fans, the number of the followers, the degree of activity, and the level of development of COVID-19. These 11 variables obtained by the network data after the expansion of crawl can fully show the impact of netizens personal influence, individual opinion on the effects of the policy implementation. The meanings of 11 variables are shown in Table 6.
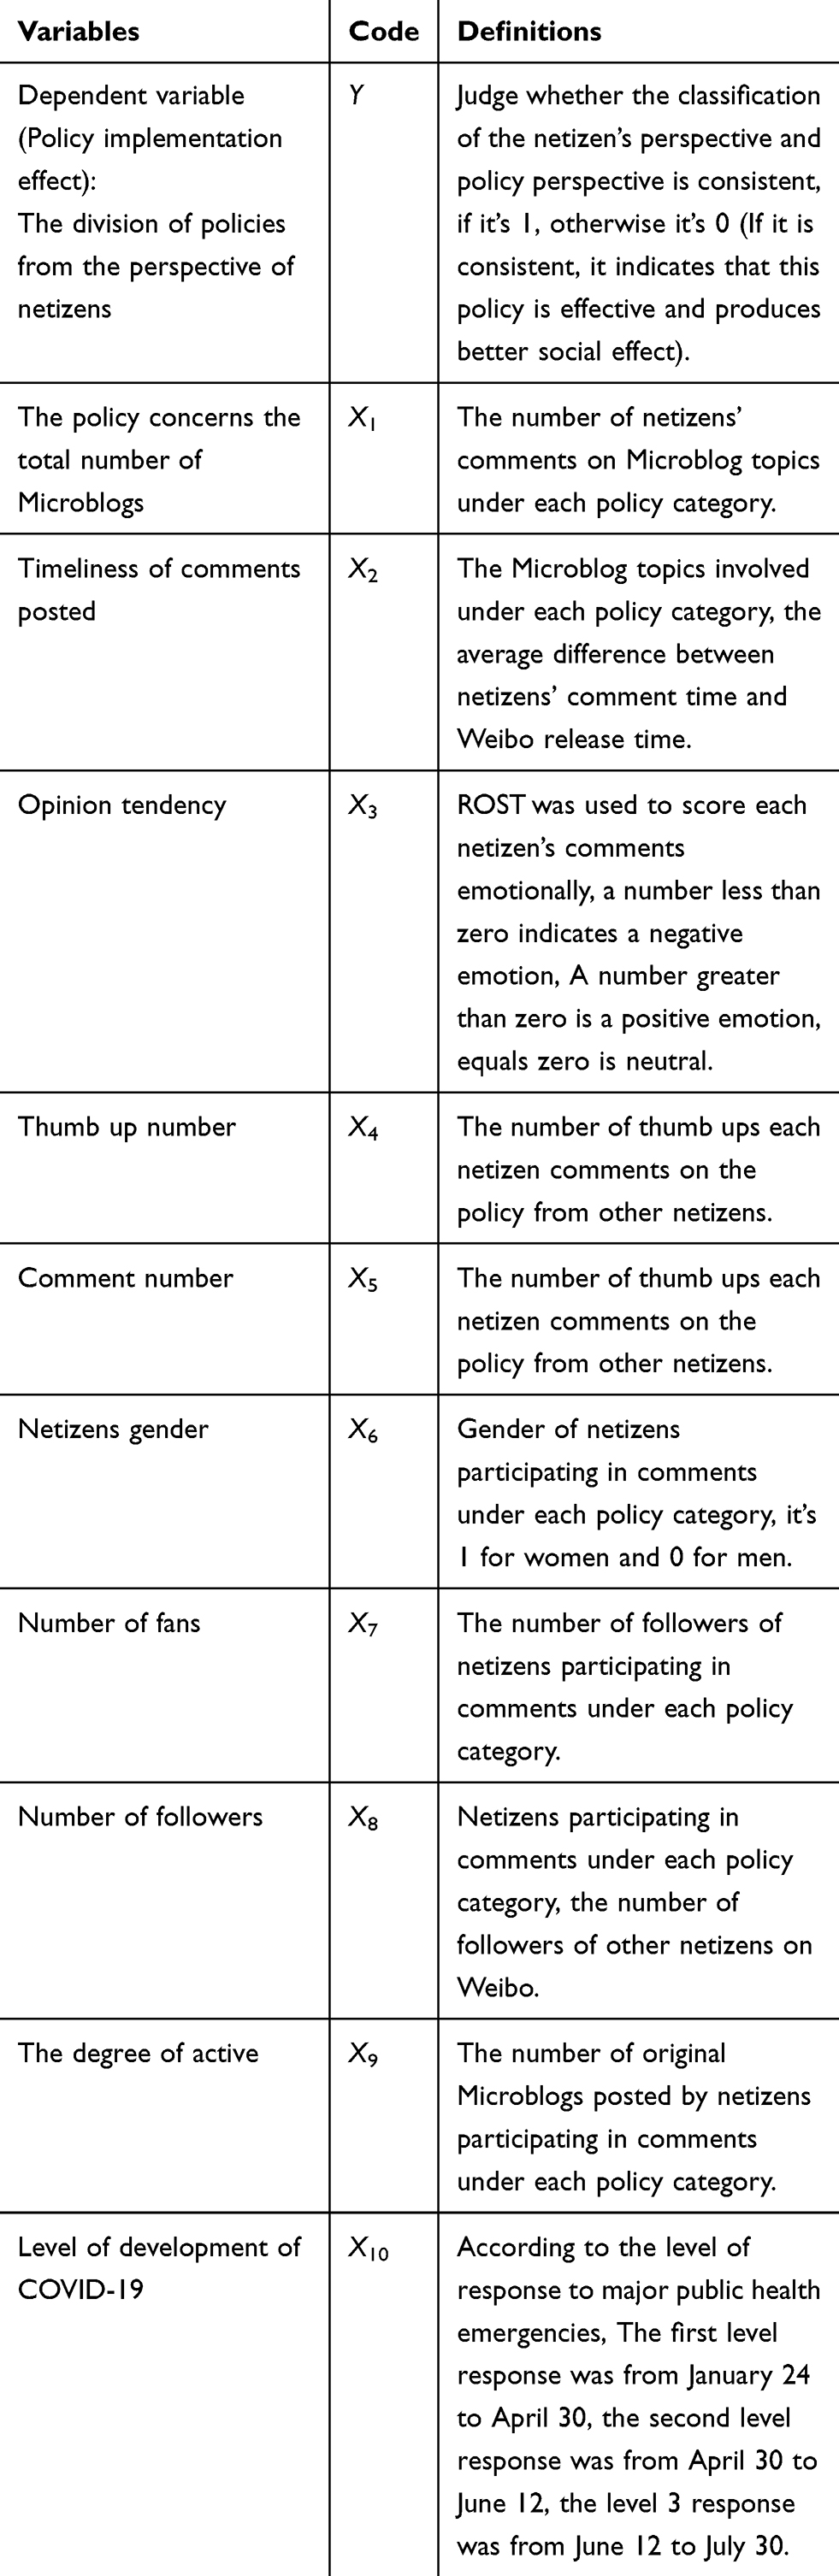 |
Table 6 Variables and Definitions |
The Construction of Binary Logistic Regression Model
The dependent variables set in this paper are binary classification variables (ie, the Boolean variables), therefore, the binary classification logical model (Binary Logistic Regression) is adopted to study the factors affecting netizens’ perception to policy, as well as set an optimal combination of policy and explain the influence of factors on perception effect. In the regression model, the independent variable is X1~X10, and the dependent variable Y represents whether the policy content is perceived from the perspective of Internet users.  is the error term, assuming that it is independent of other variables; βi is the regression coefficient in logistic regression;
  represents the logarithmic change value of the ratio for the probability of occurrence to non-occurrence when Xi changes a unit. By referring to the definition of logistic model in literature,32 the influencing factor model of netizens’ perceived effects on tourism policies is constructed, as shown in Equation (1).
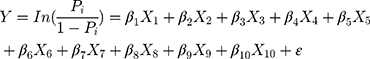
The combination of different types of policies cause diverse social effects, leading to different public perception of the degree as well as the influencing factors of netizens’ perception. In order to find the best combination of tourism promotion policy, by dividing tourism policy into four categories and combining them, 15 kinds of policy combinations can be acquired (economy, idle, feasible, safety, economy + safety, economy + feasible, economy + idle, idle + safety, idle + feasible, safety + feasible, economy + idle + feasible, economy + idle + feasible + safety). With regard to the policy combinations, the binary logistic regression model is set up. In the binary logistics regression model, how many independent variables are introduced needs to be studied. If fewer independent variables are introduced, the regression equation will not be able to explain the changes of dependent variables in an accurate manner, but it does not mean that more independent variables are absolutely better. Therefore, it is necessary to adopt some strategies to control the independent variables by introducing regression equations. The Stepwise Selection method is adopted here, that is, the introduction threshold of P-value is tested according to the significance of the set regression coefficient, independent variables are introduced into the model one by one, then P-values of all coefficients in the model are recalculated, and variables are screened according to the set elimination threshold. The Stepwise Selection method includes forward selection method and backward selection method. The forward selection method is relatively simple, but the biggest disadvantage is that if there is multicollinearity, the final model may be mixed with less important independent variables. The backward selection method is more conservative in terms of information. The backward selection method is chosen in this article. Data processing was conducted in SPSS25.0 software, and the significance level of entering the model was set at 0.05, and the significance level of removing or retaining variables was also set at 0.05.
The main steps of regression analysis are as follows: using LR Likelihood Method to select the independent variables with a significant relationship between public perception effect, conduct significance test for the variable regression coefficient and model to get binary logistics regression equation between each variable and dependent variable, and test the prediction accuracy of the overall model. The following is a detailed introduction to the regression analysis of the public perception effect under the “economy” tourism policy, and the regression analysis process of the remaining 13 tourism policy combinations can be similarly obtained.
The regression model construction process of the public perception effect under the “economy” tourism policy is illustrated as an example. Based on the comment data of “economy” policy obtained above, SPSS was used for binary logistics regression. After eliminating the independent variable X1 which could not be introduced, the independent variable could be selected and the results were shown in Table 7, the value of regression coefficient of each variable was shown in Table 8, and the model regression statistical results were shown in Tables 9 and 10.
- Generally speaking, the significance level is to estimate the probability of wrong parameter within a certain interval. When the original hypothesis is true and represented by α, the probability of rejecting the original hypothesis is usually 0.05. When the decision to accept the original hypothesis is made, the probability of its correctness is 95%. It can be seen from Table 7 that in the selection of independent variables, the significance level Sig.<0.05 is X2 for the timeliness of comment release, the number of attention is X8, and the development level of COVID-19 is X10. Therefore, there is a significant relationship between the public perception of “economy” policies and these three variables, so independent variables of the binary logistics model under such policies can be screened out.
- According to the selected independent variable, the coefficient of its independent variable is determined by the value of Exp(B) in Table 4. Exp(B) is also known as the preponderance ratio, which means that the preponderance ratio is twice that of the original Exp(B) when the other independent variables are fixed and unchanged.
- The regression equation of public perception under the “economy” policy can be obtained as follows:

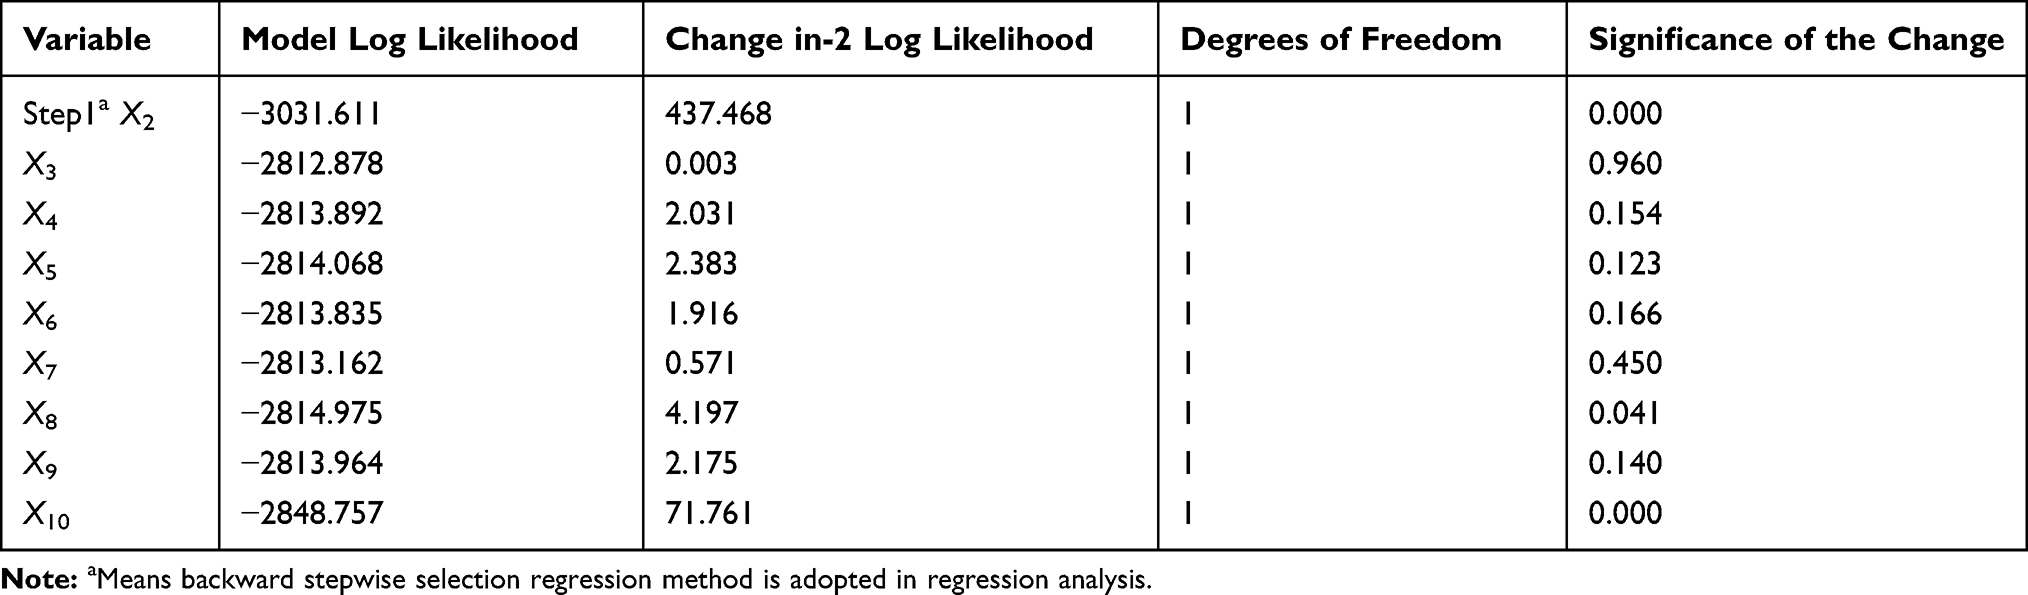 |
Table 7 Significance Test of Independent Variables Selected by “Economic” Policies |
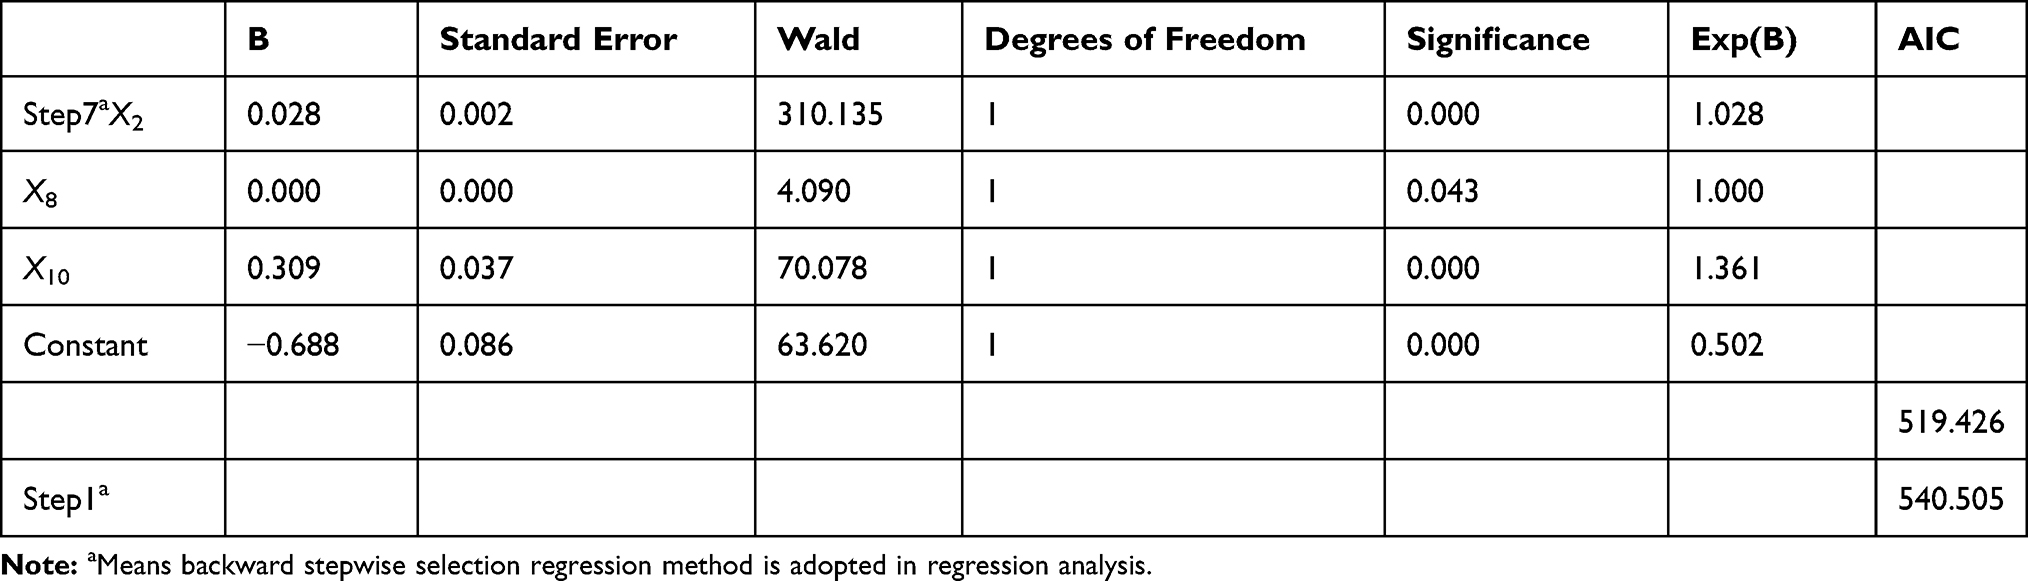 |
Table 8 The Variable Coefficients in the “Economic” Policy Equation |
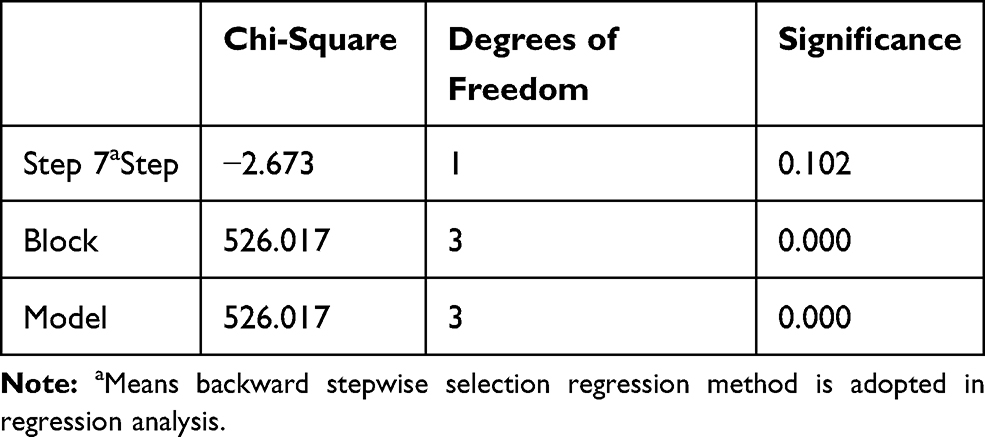 |
Table 9 Omnibus Tests of Model Coefficients Under the Policy of “Economic” |
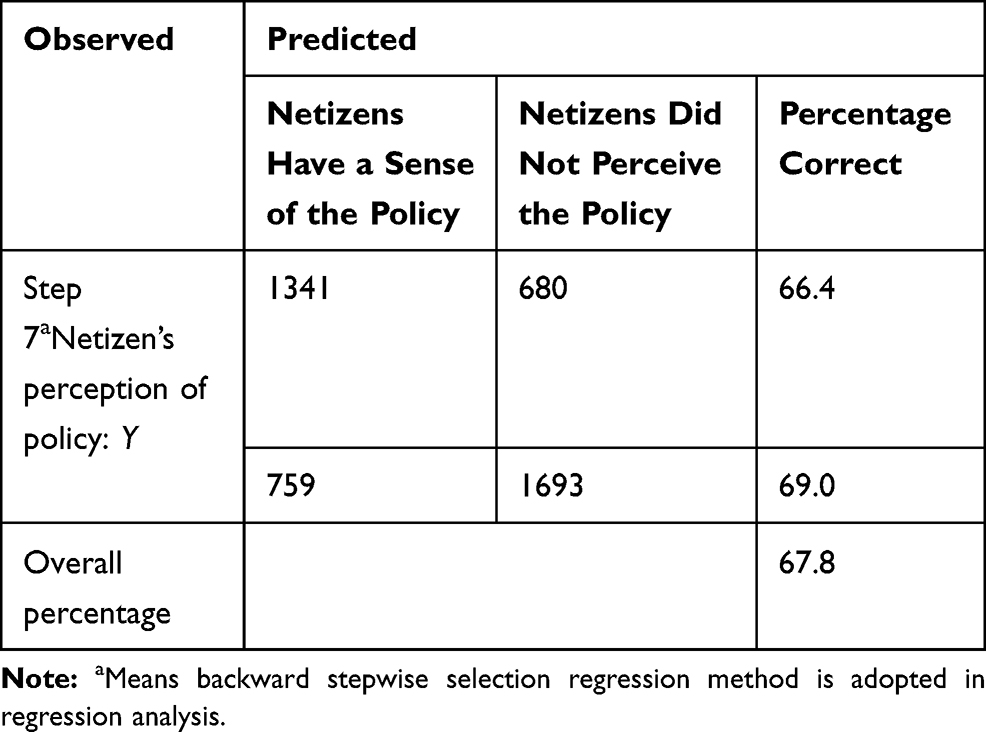 |
Table 10 The Final Model of “Economic” Policy Predicts Rates |
Due to the Sig. <0.05 in Table 9, it indicates that model is significant under 95% significance level, so the X2, X8, and X10 can be used as factors that influence the public perception of policies. According to the model prediction accuracy in Table 10, the probability of the model in formula (2) that can predict the public perception of policy is 67.8%.
Similarly, according to the above policy categories, the basic four kinds of policies are combined. When policy content contains one, two, three, or four kinds of information, 15 class policy combinations can be obtained. The construction of regression model under 15 combinations all meet the test of significance level. The results are shown in Table 11.
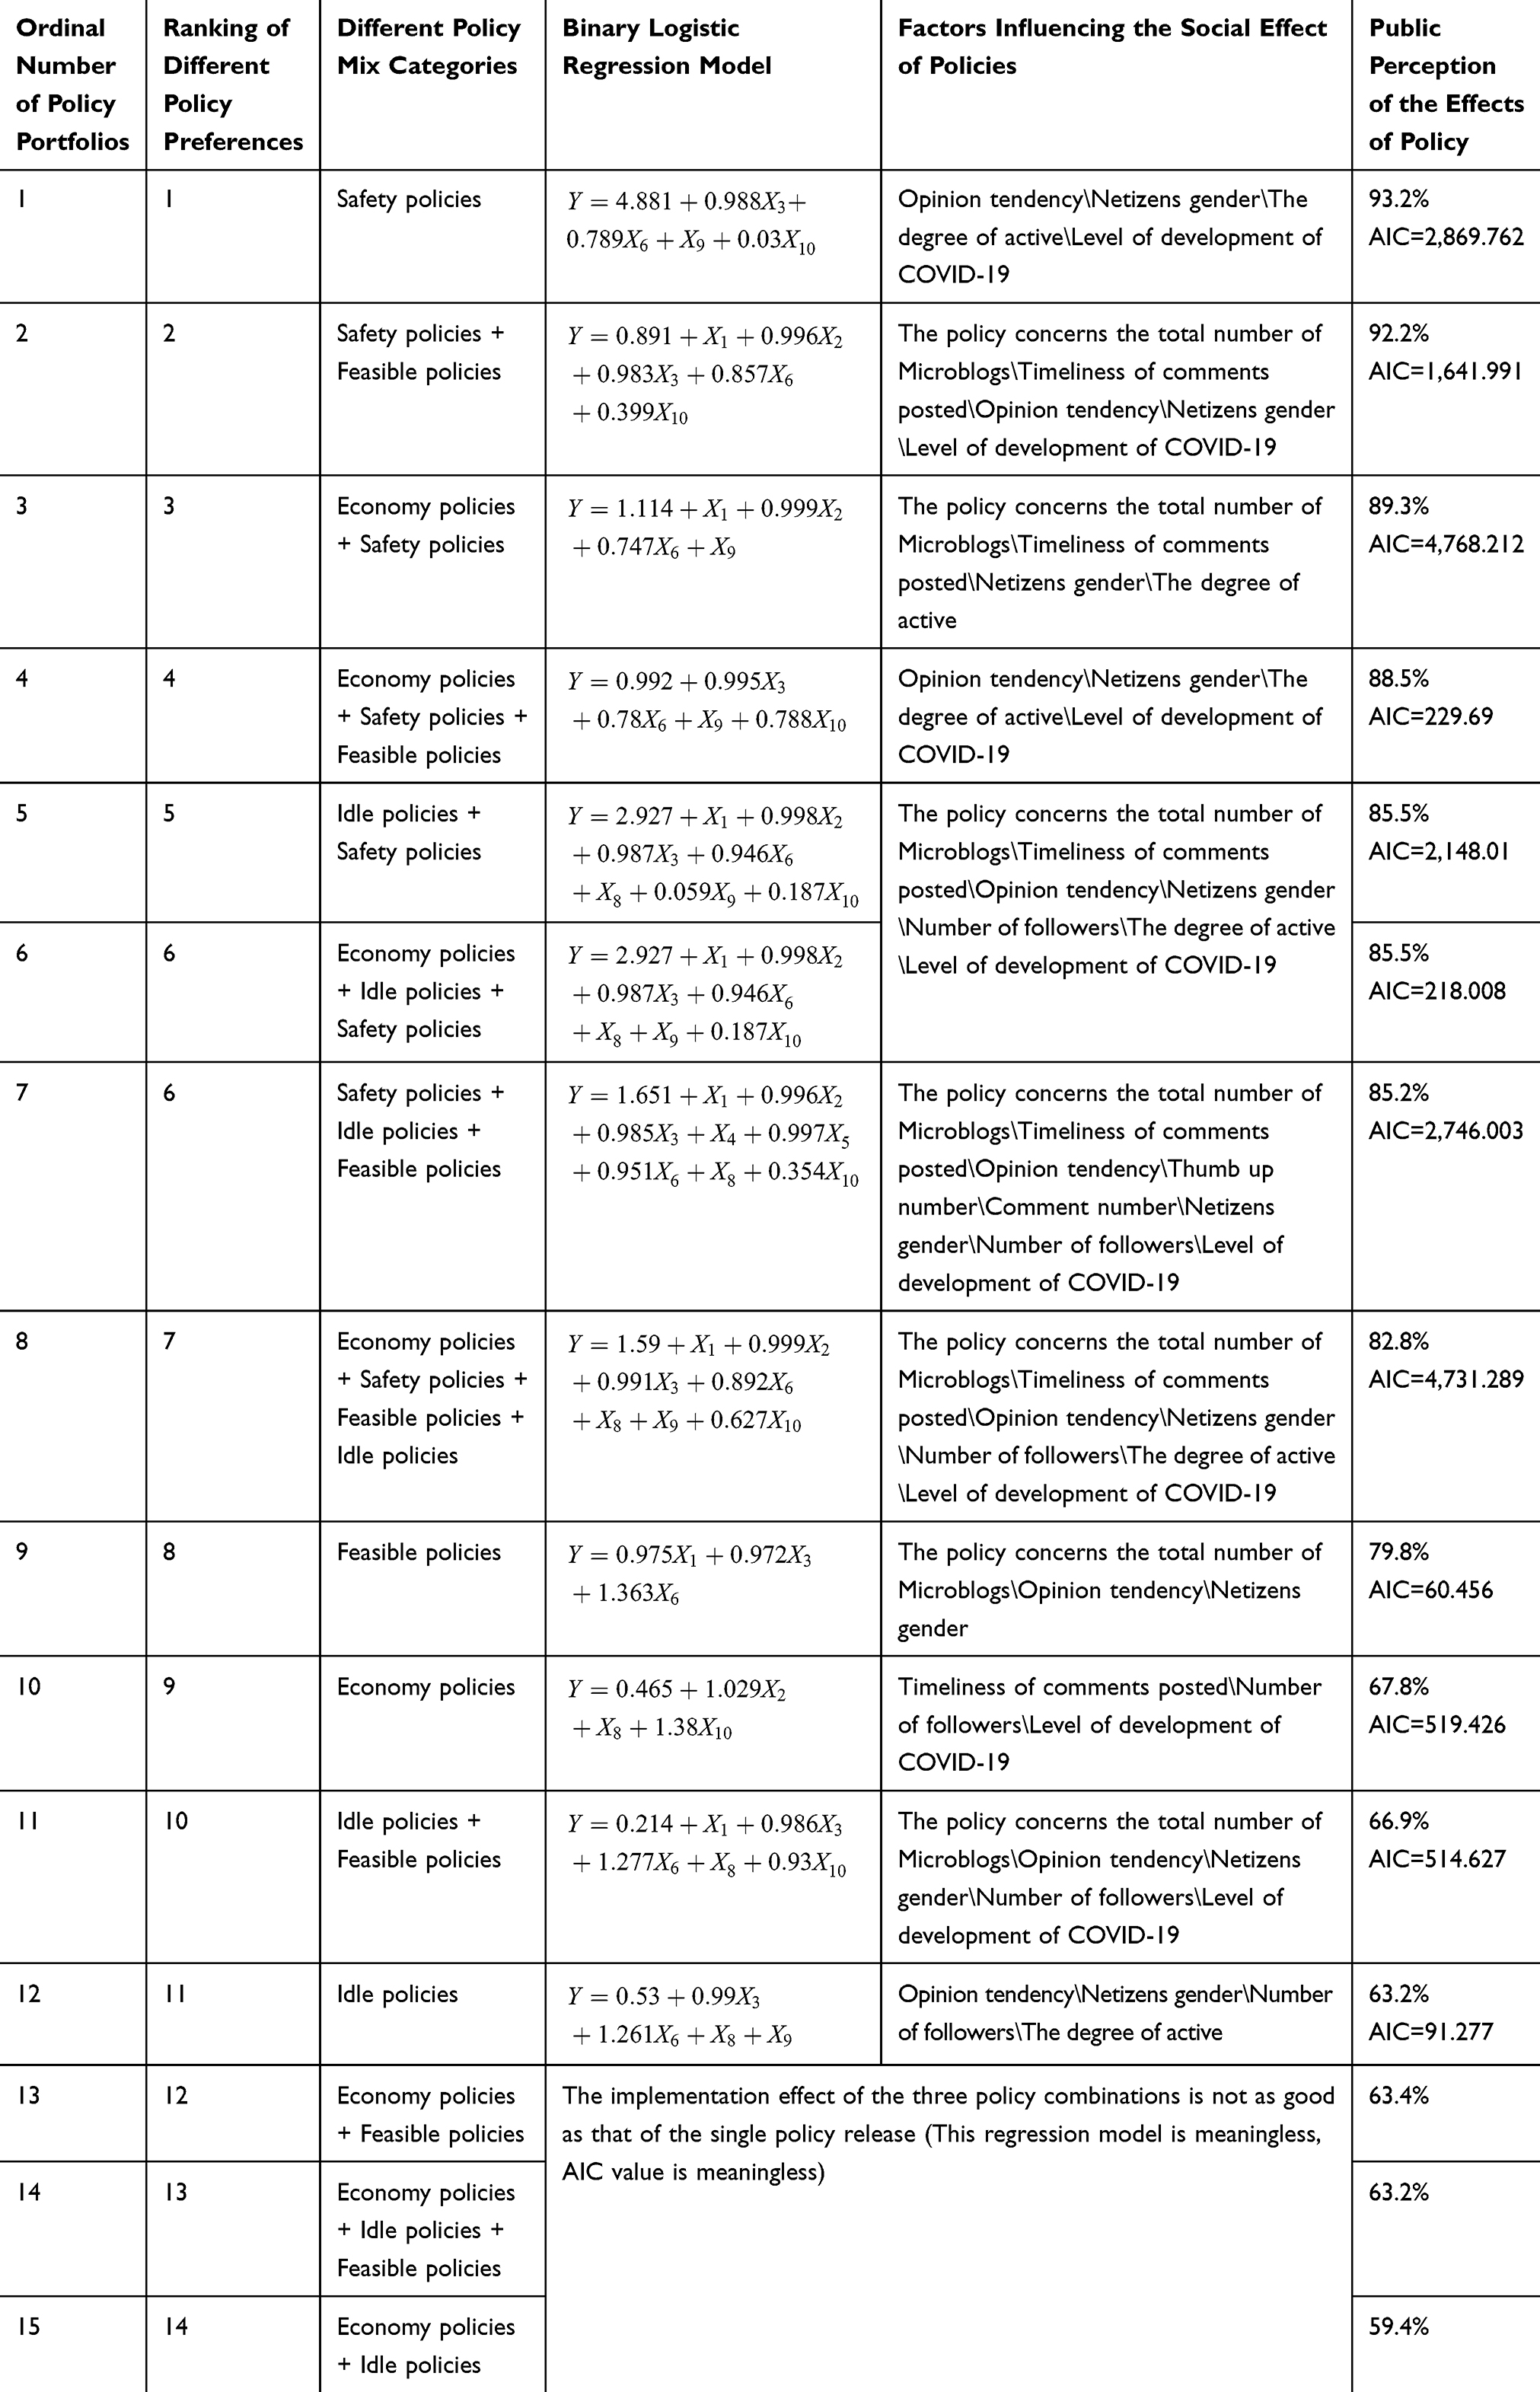 |
Table 11 Results of Binary Logistic Regression Model for 15 Policy Portfolios |
Analyzing the Implementation Effect of Tourism Policy
1) After the release of the 15 policy combinations, the binary logistic regression model was established based on public perception of policy. From Table 11, the conclusions can be made that the release of “safety” policy brings better social effect, whose social policy implementation effect is 93.2%. If the “safety policies + feasible policies” and “economy policies + safety policies” can be released together, people’s perceptions are 92.2%, 89.3%, followed by the “economy + safety + feasible policies”, which is 88.5%.
As can be seen from Table 5, the main topic of “safety” policy on Weibo is “Travel around China Online”. By means of online travel, people lower their travel frequency while keeping their enthusiasm for travel consumption after COVID-19. Moreover, during the epidemic period, the safety of the tourism environment is the most concerned and worried issue. The most fundamental problem for the revitalization of the tourism industry is to control the development of the domestic epidemic. After the security is guaranteed, the “economy” and “feasible” policies will be released at the same time, which can promote the revitalization of the tourism industry. As for the “economy” policy, it is mainly to issue tourism coupon, while the “feasible” policy is to open major tourist attractions or to resume inter-provincial travel. Only when the tourist attractions start to operate normally, can people use tourism coupon to recover the tourism industry through scenic spot consumption.
2) The combinations of “economy + feasible”, “economy + idle + feasible”, “economy + idle” bring poorer social effect than other policy combinations. This is because if the government does not release the information of epidemic development situation nor the safety measures for travel, people are not interested in traveling. Before safety is guaranteed, the effect of policy is poor. Based on this, it is suggested that the government should report the development of epidemic situation at home and abroad in real time, as well as the relevant safety measures taken in tourist attractions or the process of tourism in the content of the revitalization of tourism policy, so as to ensure more obvious social effects after the release of the policy.
3) From Table 11, the conclusions can be made that the netizens’ activeness X9 greatly impacts on public’s perception effect. In the top five optimized policy combinations, the greater the X9 of Internet users is, the stronger the perception about policy is, the greater the effect of policy implementation brings. The activeness of netizens is the original Weibo released by netizens. Generally speaking, the more active a netizen is on Weibo, the greater his personal influence will be, and the stronger the effect of network public opinion will be caused. For government departments, if they want to expand the social effects brought by the policies, they can forward the policies through “opinion leaders” on Weibo to let more people know the contents of the policies, promote tourism consumption, and drive the tourism economy.
4) From Table 11, except for the “idle + feasible”, “economy”, “economy + safety” policy, opinion tendency degree X3 impacts on the effect of different policy combination. X3 regression equation coefficient shows that each type of policy combination regression coefficients is above 0.9, indicating that X3 had a greater influence on the effect of the policy implementation. This is because after the release of policy, netizens hold positive, negative, or neutral attitudes, which affects the tendency of public opinion. If the policy is released, “opinion leaders” hold negative attitudes, which will not be conducive to policy implementation and cause rejection on the network platform. Therefore, after the release of policy, government should control trend of public opinion, timely stop bad happens so as to play the positive impact of policies.
Conclusions and Suggestions
This paper selects Weibo comments, comments time, gender, the original Weibo number, and other aspects from January 11, 2020 to July 24 on the revitalization of the tourism policy, and divides the revitalization of tourism policy into “economy”, “safety”, “idle”, “feasible” four major categories. From the perspective of users, by constructing binary logistic regression model, the combination of all kinds of policy is analyzed. Based on the above analysis, this paper provides the following suggestions for the government and scenic spots to cope with public health emergencies and improve the perceived effect of policies:
Tourism Policies Under the Epidemic Situation Should Highlight Safety Measures
The epidemic brings great challenge to China’s governance system and capacity. For the tourism industry, it is necessary to carry out the corresponding assessment, prevention, and treatment, and handle the tourism crisis properly, which not only requires scientific decision-making and precise measures by the government, but also requires the joint efforts of scenic spot practitioners. According to the analysis of this paper, the public’s perception of “safety” policies is the strongest. Only when tourists perceive that it is safe to travel can the cultural and tourism industry gradually resume work and production. Based on this, the government should timely issue a “safety” policy after the initial stability of the epidemic. For example, on February 25, the Ministry of Culture and Tourism issued a “Guide to Prevention and Control Measures for Reopening of Tourist Attractions”, which enables tourists to perceive that the government encourages the cultural and tourism industry to resume work and production, and it is relatively safe to travel in the current environment. In addition, the government can issue a series of advocacy policies, such as advocating industry associations to strengthen the safety and supervision of epidemic prevention and control, and guiding scenic spots to actively participate in relevant work; Secondly, the scenic spot should issue a series of effective and feasible prevention and control policies to ensure safety, such as implementing a series of policies in terms of limiting the capacity of tourists, keeping social distance between tourists, regularly disinfecting all scenic spots, and requiring tourists to wear face masks.
The Combination of Economic Policies and Security Policies Can Achieve Better Results
The most fundamental problem of reviving the tourism industry is to control the development of the epidemic. When safety is guaranteed, “economy” and “safety” policies will be issued at the same time, which will greatly accelerate the recovery of the tourism industry. The reality of the difficulties in view of the current tourism industry development, in addition to the policy of issuing coupons to attract tourists, governments at all levels can introduce more perfect tourism industry revitalization policy, especially the release and enforcement of fiscal policy, tax policy, credit policy, and social security policy for the troubled tourism-related businesses. Providing financial subsidies for tourism services and related enterprises to resume operation and production. For tourism enterprises that have special difficulties and fail to pay tax on time, tax payment shall be reduced or postponed appropriately. Tourist attractions can also release a series of “economy” policies to attract tourists, such as free tickets or appropriate discounts, multi-scenic joint ticket discounts and other marketing policies. In addition, “feasible” policies will be issued at the same time, such as enforcing the paid leave system for employees and 2.5 days off policy.
Play the Role of “Opinion Leaders” to Improve the Perceived Effect of Policies
Through analysis, this paper finds that “opinion leaders” have a significant impact on the perceived effect of the public after the release of policies. The greater the influence of “opinion leaders” is, the stronger the perception of policies will be, and the greater the social effect brought by the implementation of policies will be. Therefore, the government can advocate “opinion leaders” on Weibo to forward and expand the exposure of the policy, so as to improve the perceived effect of the policy, let more people know the content of the policy, boost tourism consumption and drive the tourism economy.
Use Big Data of Tourism to Improve the Effect of Policies
Since the outbreak of the COVID-19, big data of tourism has played an important role. However, in the face of the sudden outbreak, the release of policy information and monitoring of public perception is still lagging behind. In this regard, local governments and scenic spots can use the big data platform to accurately locate the spread path of the epidemic, quickly track the flow of tourists and their movements, and establish a tourist relationship map, so as to provide data protection for “safety” policies and reduce tourists’ concerns about safety. In addition, big data can be used to speed up the connectivity of all kinds of policy information and expand the exposure of policies, so as to increase the public’s perception of the effect of policies.
Funding
This research is supported by the National Social Science Foundation of China (Grant No. 20BTQ059), Hubei Key Laboratory of Mechanical Transmission and Manufacturing Engineering (MECOF2020B04), Contemporary Business and Trade Research Center and Center for Collaborative Innovation Studies of Modern Business of Zhejiang Gongshang University of China (Grant No. 14SMXY05YB), as well as First Class Discipline of Zhejiang-A (Zhejiang Gongshang University- Statistics).
Disclosure
The authors declare that they have no conflicts of interest for this work.
References
1. Dave K, Steve L, Pennock DM. Mining the peanut gallery: opinion extraction and semantic classification of product reviews.
2. Rossouw R, Saayman M. Assimilation of tourism satellite accounts and applied general equilibrium models to inform tourism policy analysis. Tour Econ. 2011;17(4):753–783. doi:10.5367/te.2011.0058
3. Miller S. Causal forest estimation of heterogeneous and time-varying environmental policy effects. J Environ Econ Manage. 2020;103:102337. doi:10.1016/j.jeem.2020.102337
4. Dong F, Liu Y. Policy evolution and effect evaluation of new-energy vehicle industry in China[J]. Resour Polic. 2020;67:101655. doi:10.1016/j.resourpol.2020.101655
5. Matousek R, Panopoulou E, Papachristopoulou A. Policy uncertainty and the capital shortfall of global financial firms. J Corp Finance. 2020;62:101558. doi:10.1016/j.jcorpfin.2020.101558
6. Livni J. Investigation of collapse of complex socio-political systems using classical stability theory. Physica A. 2019;524:553–562. doi:10.1016/j.physa.2019.04.167
7. Chen T, Shi J, Yang J, Cong G, Li G. Modeling public opinion polarization in group behavior by integrating SIRS-based information diffusion process. Complexity. 2020;2020:1–20. doi:10.1155/2020/4791527
8. Chen T, Wang Y, Yang J, Cong G. Modeling public opinion reversal process with the considerations of external intervention information and individual internal characteristics. Healthcare. 2020;8(2):160. doi:10.3390/healthcare8020160
9. Alexander A, Yusaku H. Has trump damaged the U.S. image abroad? Decomposing the effects of policy messages on foreign public opinion. Polit Behav. 2020;42(3):581–602. doi:10.1007/s11109-018-9511-3
10. Ho M. An analysis on the critical success factors of healing tourism policy by AHP. J Humanit Soc Sci. 2019;10(1):1473–1486.
11. Yin D. Citizen network participation: an analytical framework of the new political system theory. J Party School Tianjin Municipal Committee Communist Party China. 2010;2:44–52.
12. Rothwell R, Zegveld W. Reindusdalization and Technology. Logman Group Limited; 1985:83–104.
13. Kim A, Jeong SH, Choi HB, Kim HH. An analysis of effects of emergency fine dust reduction measures and national petition using regression analysis and text mining. KIPS Trans Software Data Eng. 2018;7(11):427–434.
14. Gunhee L, Sutherland I, Park S. A study of factors affecting tourists to Japan using text mining approach. J Tour Leis Res. 2017;29(11):181–199.
15. Chen T, Peng L, Yin X, Rong J, Yang J, Cong G. Analysis of user satisfaction with online education platforms in China during the COVID-19 pandemic. Healthcare. 2020;8(3):200. doi:10.3390/healthcare8030200
16. Chen T, Peng L, Jing B, Wu C, Yang J, Cong G. The Impact of the COVID-19 pandemic on user experience with online education platforms in China. Sustainability. 2020;12(18):7329. doi:10.3390/su12187329
17. Bucek J. Fiscal policy for the 21st century: does Barack Obama effect the real economic policy?
18. Qi Y, Peng W, Xiong N. The effects of fiscal and tax incentives on regional innovation capability: text extraction based on python. Mathematics. 2020;8(7):1193. doi:10.3390/math8071193
19. Sun PJ. XACML policy evaluation optimization research based on attribute weighted clustering and statistics reordering.
20. Pellesova P. Selected econometric methods of optimization of economic policy.
21. Dash GH, Kajiji N. On multiobjective combinatorial optimization and dynamic interim hedging of efficient portfolios. Int Trans Oper Res. 2014;21(6):899–918. doi:10.1111/itor.12067
22. Yang G, Zhang Y, Li X. Impact of gasoline upgrade policy on particulate matter pollution in China. J Clean Prod. 2020;262:121336. doi:10.1016/j.jclepro.2020.121336
23. Geng D, Saggi K. Optimal price regulations in international pharmaceutical markets with generic competition. J Health Econ. 2020;71:102315. doi:10.1016/j.jhealeco.2020.102315
24. Gupta M, Bolia NB. Efficiency measurement of Indian high courts using DEA: a policy perspective. J Policy Model. 2020.
25. Andrew Kelly J, Peter Clinch J, Kelleher L, Shahab S. Enabling a just transition: a composite indicator for assessing home-heating energy-poverty risk and the impact of environmental policy measures. Energy Policy. 2020;146:111791. doi:10.1016/j.enpol.2020.111791
26. Groh ED, Ziegler A. On self-interested preferences for burden sharing rules: an econometric analysis for the costs of energy policy measures. Energy Econ. 2018;74:417–426. doi:10.1016/j.eneco.2018.06.026
27. Valerio C, De Stefano L, Martínez-Muñoz G, Garrido A. A machine learning model to assess the ecosystem response to water policy measures in the Tagus River Basin (Spain). Sci Total Environ. 2021;750:141252. doi:10.1016/j.scitotenv.2020.141252
28. Dukhanina E, Massol O, Lévêque F. Policy measures targeting a more integrated gas market: impact of a merger of two trading zones on prices and arbitrage activity in France. Energy Policy. 2019;132:583–593. doi:10.1016/j.enpol.2019.05.044
29. Dong F, Liu Y. Policy evolution and effect evaluation of new-energy vehicle industry in China. Resour Polic. 2020;67:1–13.
30. Smith JD, Hasan M. Quantitative approaches for the evaluation of implementation research studies. Psychiatry Res. 2019;283:112521. doi:10.1016/j.psychres.2019.112521
31. Xu Y, You X, Wong Y. Evaluation of tourist satisfaction based on ROSTCM method: a case study of five domestic terrace scenic spot. Tour Forum. 2018;11(5):22–34.
32. Wang J, Guo Z. Logistic regression model: method and application. Beijing: Higher Education Press; 2001:13–26.
 © 2020 The Author(s). This work is published and licensed by Dove Medical Press Limited. The
full terms of this license are available at https://www.dovepress.com/terms
and incorporate the Creative Commons Attribution
- Non Commercial (unported, 3.0) License.
By accessing the work you hereby accept the Terms. Non-commercial uses of the work are permitted
without any further permission from Dove Medical Press Limited, provided the work is properly
attributed. For permission for commercial use of this work, please see paragraphs 4.2 and 5 of our Terms.
© 2020 The Author(s). This work is published and licensed by Dove Medical Press Limited. The
full terms of this license are available at https://www.dovepress.com/terms
and incorporate the Creative Commons Attribution
- Non Commercial (unported, 3.0) License.
By accessing the work you hereby accept the Terms. Non-commercial uses of the work are permitted
without any further permission from Dove Medical Press Limited, provided the work is properly
attributed. For permission for commercial use of this work, please see paragraphs 4.2 and 5 of our Terms.