Back to Journals » Clinical Epidemiology » Volume 10
A phenotyping algorithm to identify acute ischemic stroke accurately from a national biobank: the Million Veteran Program
Authors Imran TF, Posner D ![]() , Honerlaw J, Vassy JL, Song RJ, Ho YL
, Honerlaw J, Vassy JL, Song RJ, Ho YL ![]() , Kittner SJ, Liao KP, Cai T, O'Donnell CJ, Djousse L, Gagnon DR
, Kittner SJ, Liao KP, Cai T, O'Donnell CJ, Djousse L, Gagnon DR ![]() , Gaziano JM, Wilson PWF, Cho K
, Gaziano JM, Wilson PWF, Cho K
Received 24 December 2017
Accepted for publication 18 May 2018
Published 16 October 2018 Volume 2018:10 Pages 1509—1521
DOI https://doi.org/10.2147/CLEP.S160764
Checked for plagiarism Yes
Review by Single anonymous peer review
Peer reviewer comments 4
Editor who approved publication: Professor Henrik Toft Sørensen
Tasnim F Imran,1–3,* Daniel Posner,1,4,* Jacqueline Honerlaw,1 Jason L Vassy,1,2 Rebecca J Song,1 Yuk-Lam Ho,1 Steven J Kittner,5 Katherine P Liao,1,2 Tianxi Cai,1,6 Christopher J O’Donnell,1,2 Luc Djousse,1,2 David R Gagnon,1,4 J Michael Gaziano,1,2 Peter WF Wilson,7,8 Kelly Cho1,2
On behalf of the VA Million Veteran Program
1Massachusetts Veterans Epidemiology Research and Information Center (MAVERIC), VA Cooperative Studies Program, VA Boston Healthcare System, Boston, MA, USA; 2Department of Medicine, Division of Aging, Brigham and Women’s Hospital, Harvard Medical School, Boston, MA, USA; 3Department of Medicine, Cardiology Section, Boston Medical Center, Boston University School of Medicine, Boston, MA, USA; 4Department of Biostatistics, Boston University School of Public Health, Boston, MA, USA; 5Department of Neurology, Baltimore VA Medical Center and University of Maryland School of Medicine, Baltimore, MD, USA; 6Harvard T. H. Chan School of Public Health, Boston, MA, USA; 7Atlanta VA Medical Center, Decatur, GA, USA; 8Department of Medicine, Division of Cardiovascular Disease, Emory University School of Medicine, Atlanta, GA, USA
*These authors contributed equally to this work
Background: Large databases provide an efficient way to analyze patient data. A challenge with these databases is the inconsistency of ICD codes and a potential for inaccurate ascertainment of cases. The purpose of this study was to develop and validate a reliable protocol to identify cases of acute ischemic stroke (AIS) from a large national database.
Methods: Using the national Veterans Affairs electronic health-record system, Center for Medicare and Medicaid Services, and National Death Index data, we developed an algorithm to identify cases of AIS. Using a combination of inpatient and outpatient ICD9 codes, we selected cases of AIS and controls from 1992 to 2014. Diagnoses determined after medical-chart review were considered the gold standard. We used a machine-learning algorithm and a neural network approach to identify AIS from ICD9 codes and electronic health-record information and compared it with a previous rule-based stroke-classification algorithm.
Results: We reviewed administrative hospital data, ICD9 codes, and medical records of 268 patients in detail. Compared with the gold standard, this AIS algorithm had a sensitivity of 91%, specificity of 95%, and positive predictive value of 88%. A total of 80,508 highly likely cases of AIS were identified using the algorithm in the Veterans Affairs national cardiovascular disease-risk cohort (n=2,114,458).
Conclusion: Our algorithm had high specificity for identifying AIS in a nationwide electronic health-record system. This approach may be utilized in other electronic health databases to accurately identify patients with AIS.
Keywords: acute ischemic stroke, algorithm, large databases, big data, administrative health data, cerebrovascular accident
Introduction
Stroke is the second-most common cause of death worldwide and also a leading cause of significant morbidity.1 The major types of stroke – ischemic, intracerebral hemorrhage, and subarachnoid hemorrhage – differ in their risk factors and clinical presentation. Even within these major types of stroke, there are subtypes with different risk factors and prognosis.1 Therefore, studies with a large number of stroke cases are needed to examine associations with clinical outcomes and to characterize the phenotypes of these patients. Cohort studies have been used for such clinical research, but generally have relatively few outcome events and may lack the breadth of clinical data that is available in health-care databases.
The Veterans Health Administration (VHA) has one such health-care database, with over 15 years of electronic health records (EHRs) for millions of veterans. The records enable a multitude of observational research studies, but EHRs often lack the precise and uniform diagnoses required for health research. In practice, this means many risk factors and health events must be inferred from the records’ structured elements, such as standardized codes (ICD9-CM) and drug prescriptions, and unstructured elements, such as the narrative text contained in radiology and pathology reports. However, there are often inaccuracies in coding and limitations in the types of data elements available.2–6 This leads to challenges in reliably distinguishing among major subphenotypes of stroke based on ICD9-CM codes alone (specifically ischemic and hemorrhagic), which have very different risk factors and pathophysiologic mechanisms. As such, it is essential to develop algorithms to identify specific types of stroke accurately. Furthermore, highly accurate phenotyping algorithms are urgently needed in ongoing and future genomic and mechanistic studies in megabiobanks like the Million Veteran Program (MVP), the UK Biobank, and the All of Us Program.
In this paper, we present a machine-learning algorithm for identifying acute ischemic stroke (AIS) from structured elements of VHA patient records, ie, a “structured stroke algorithm”.1 The machine-learning algorithm can be used for both longitudinal and case–control studies to identify cases of AIS and to quantify uncertainty in stroke classification via predicted stroke probabilities. The predicted stroke probabilities are used to develop a specialized algorithm for case–control studies, and uncertain stroke cases are removed from the analysis. Finally, we provide suggestions for choosing among competing algorithms and demonstrate that using health-care databases to ascertain stroke cases is practical, low-cost, and high-yield.
Methods
Data sources
Using the national Veterans Affairs (VA) EHR system, Centers for Medicare and Medicaid Services, and National Death Index data, we put together a cohort of patients with AIS. The VHA system is the largest single-payer health-care entity in the US, containing over 144 hospitals and 1,221 outpatient centers.8 Local hospital and clinic data, including inpatient, outpatient, laboratory values, and vital signs, are stored in a central VHA corporate data warehouse. Our current study includes creation and validation of cases of AIS from the national VHA cohort. We also present stroke characteristics of the patient population in a cardiovascular disease (CVD)-risk cohort and the MVP cohort.
Cardiovascular disease and risk factors: the CVD in veterans study
The purpose of the CVD in veterans study is to determine risk for CVD, including heart disease and stroke, in veterans by examining existing EHR data. The VA CVD-risk cohort includes any veteran who has received care and had a cholesterol measurement at the VA from 2002 onwards. Prediction equations will be developed from the experience of the veterans who receive care across the US. The three specific aims of the CVD events in veterans study are to estimate risk for first CVD events in veterans, estimate risk for first CVD in veterans with diabetes mellitus, and estimate risk for recurrent CVD events in veterans who have already developed CVD. Implementation of this strategy should lead to veteran-specific health care that is individualized in terms of total CVD-risk management.
Million Veteran Program
The MVP was launched to establish a national, representative, and longitudinal study of veterans for genomic and nongenomic research that combines data from self-reported surveys, EHRs, and biospecimens. Details of this VA-based megabiobank have been published.9 Briefly, the VHA population consists of approximately 21 million veterans, of whom 8.9 million are users of the VHA. The MVP is an ongoing study that is recruiting at a steady state at approximately 50 VA medical facilities throughout the country. The source population consists of those who are active users of the VHA with a valid mailing address and able to provide informed consent (~6.9 million veterans). The target number of study participants for the MVP is at least 1 million veterans from the eligible pool. As of May 2017, 570,946 veterans have enrolled in MVP (359,149 with a baseline survey). Among those with genotyping data (352,708), 240,230 had a baseline survey with self-reported demographics. Of these, 92% are men with a mean age of 64.5±12.4 years, 57.9% are aged 50–69 years, 74.9% are White, and 19.1% African-American (based on self-reported race). Ultimately, the goal is to link clinical data in the VA EHR in the computerized patient-record system with MVP questionnaires and a MVP genome-wide association study (GWAS), to allow integration of genetic testing in the future, thus contributing to precision medicine. The Institutional Review Board at the VA Boston Healthcare System approved this study.
Selection of cases for review
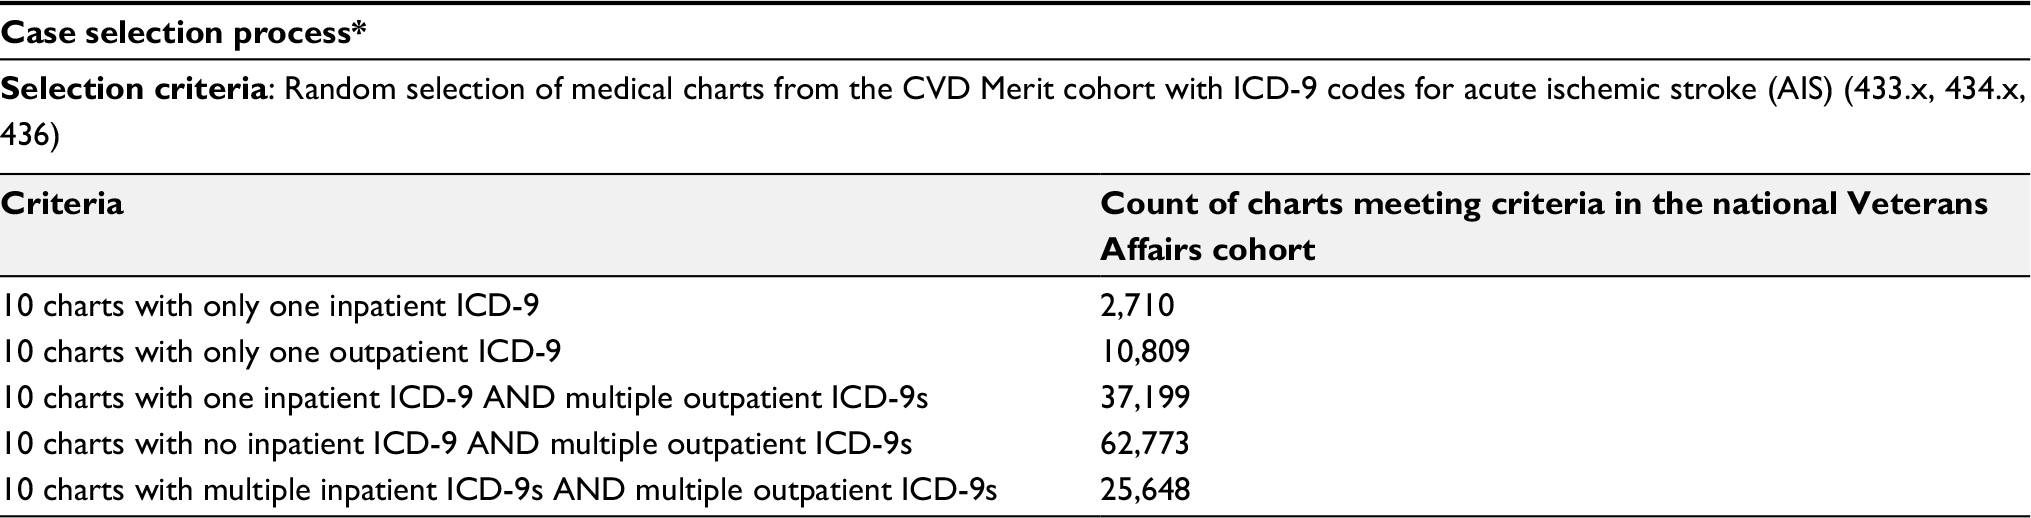
A total of 300 veterans were sampled from a random subset of 1 million veterans who came to the VA for an outpatient or inpatient visit (labeled “data mart” in Figure 1). The sample size was selected based on the average time per chart review and limit of 40 hours per chart reviewer (30 minutes/chart × 300 charts × two reviewers per chart/seven reviewers = 42 hours per reviewer). The data mart was used to reduce the computation and memory burden. The first 100 veterans were randomly sampled from the data mart. The 100 veterans had comparable demographics, comorbidity profiles, and visit histories compared to general VA users. Of these 100 veterans, chart reviewers found four veterans with AIS (cases) and 96 veterans without AIS or other strokes (controls). ICD9 codes 430 and 433–437 were completely absent in controls. To gather enough cases of AIS, we randomly selected 200 veterans from the data mart for stroke ICD9 codes 430 and 433–437 (labeled “stroke mart” in Figure 1), resulting in 81 controls (including two transient ischemic attacks [TIAs] and five hemorrhagic strokes), 87 definite AIS cases, and 32 possible AIS cases. We tried several selection criteria to yield the most AIS cases: an inpatient or outpatient ICD9 code, an inpatient ICD9 code and multiple outpatient codes, or other combinations thereof (Table S1). Each chart was reviewed by two of seven reviewers (six physicians and one nurse), with disagreements settled by a third reviewer when necessary. Because charts were sometimes reviewed by more than two reviewers, we assessed interrater reliability with the Fleiss–Cuzick (κ-like) measure of agreement,10 which is comparable to Cohen’s κ19 and measures interrater agreement in excess of agreement between completely random ratings. Fleiss’s κ was computed from three categories: non-AIS (including hemorrhagic strokes and TIAs), possible AIS, and definite AIS. Agreement was somewhat low (κ=0.612), due to missing primary data in possible AIS cases, ie, no documentation of initial presentation of stroke and/or imaging data available to be certain whether the patient had truly had a stroke.
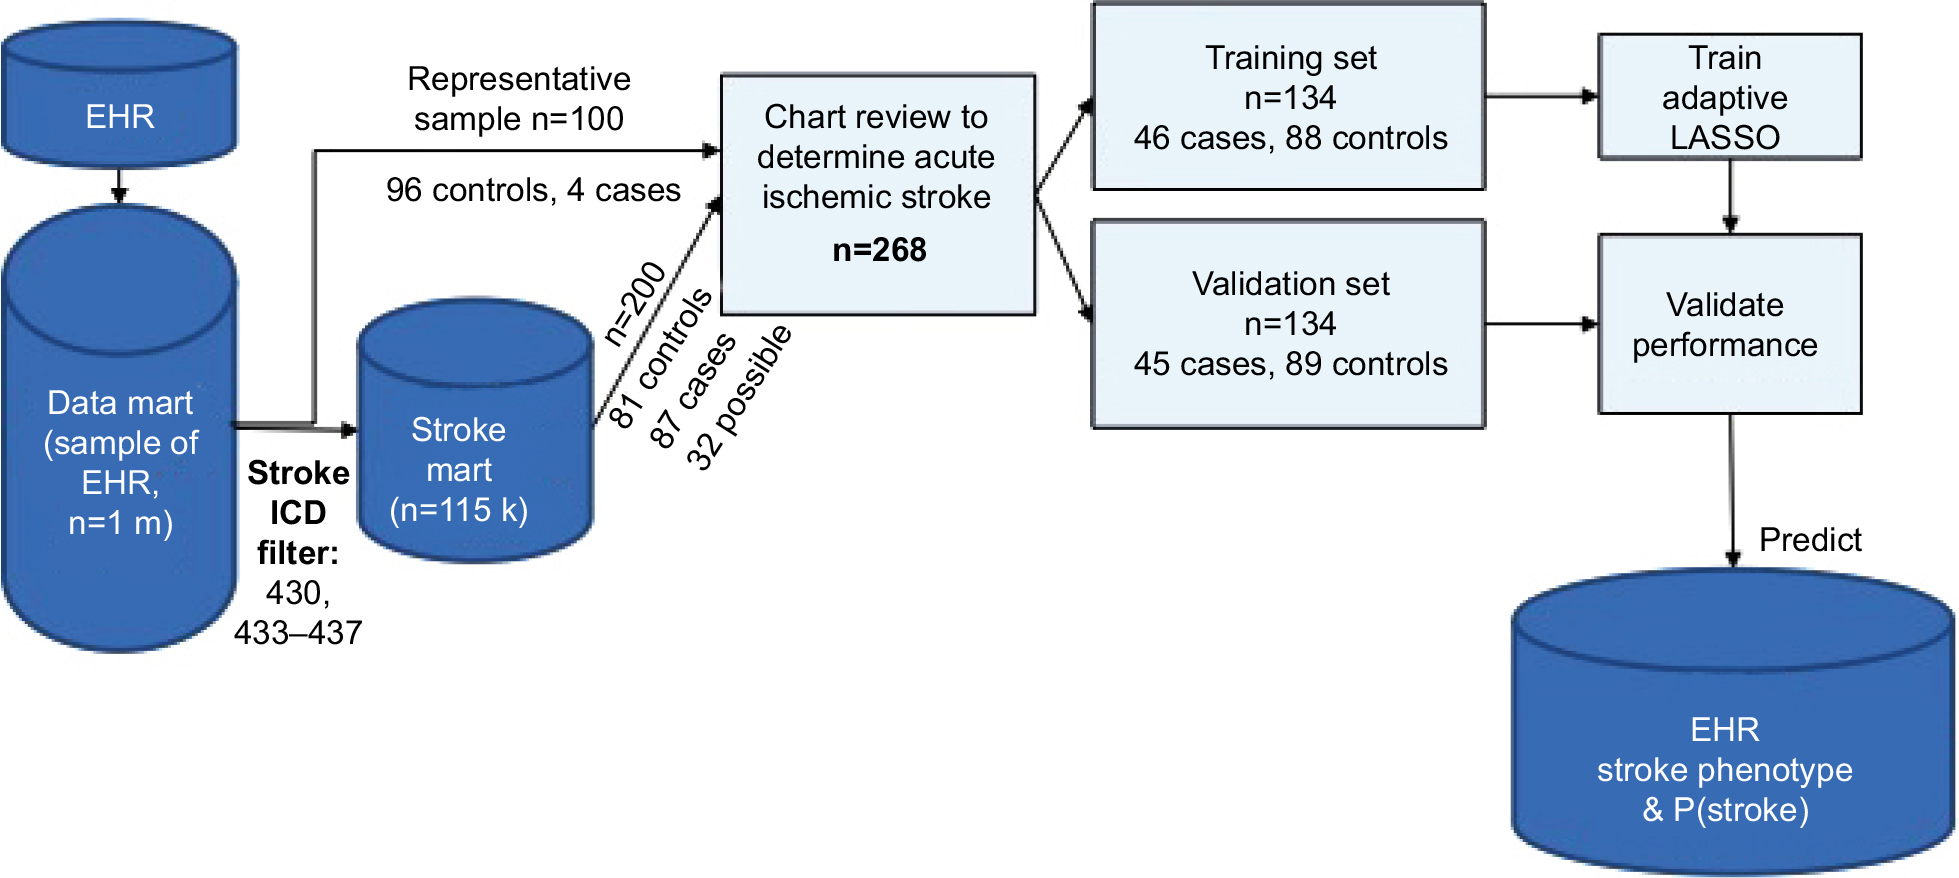 | Figure 1 Stroke-classification flowchart for chart reviews. Abbreviations: EHR, electronic health record; P(stroke), probability of stroke. |
Chart-review validation
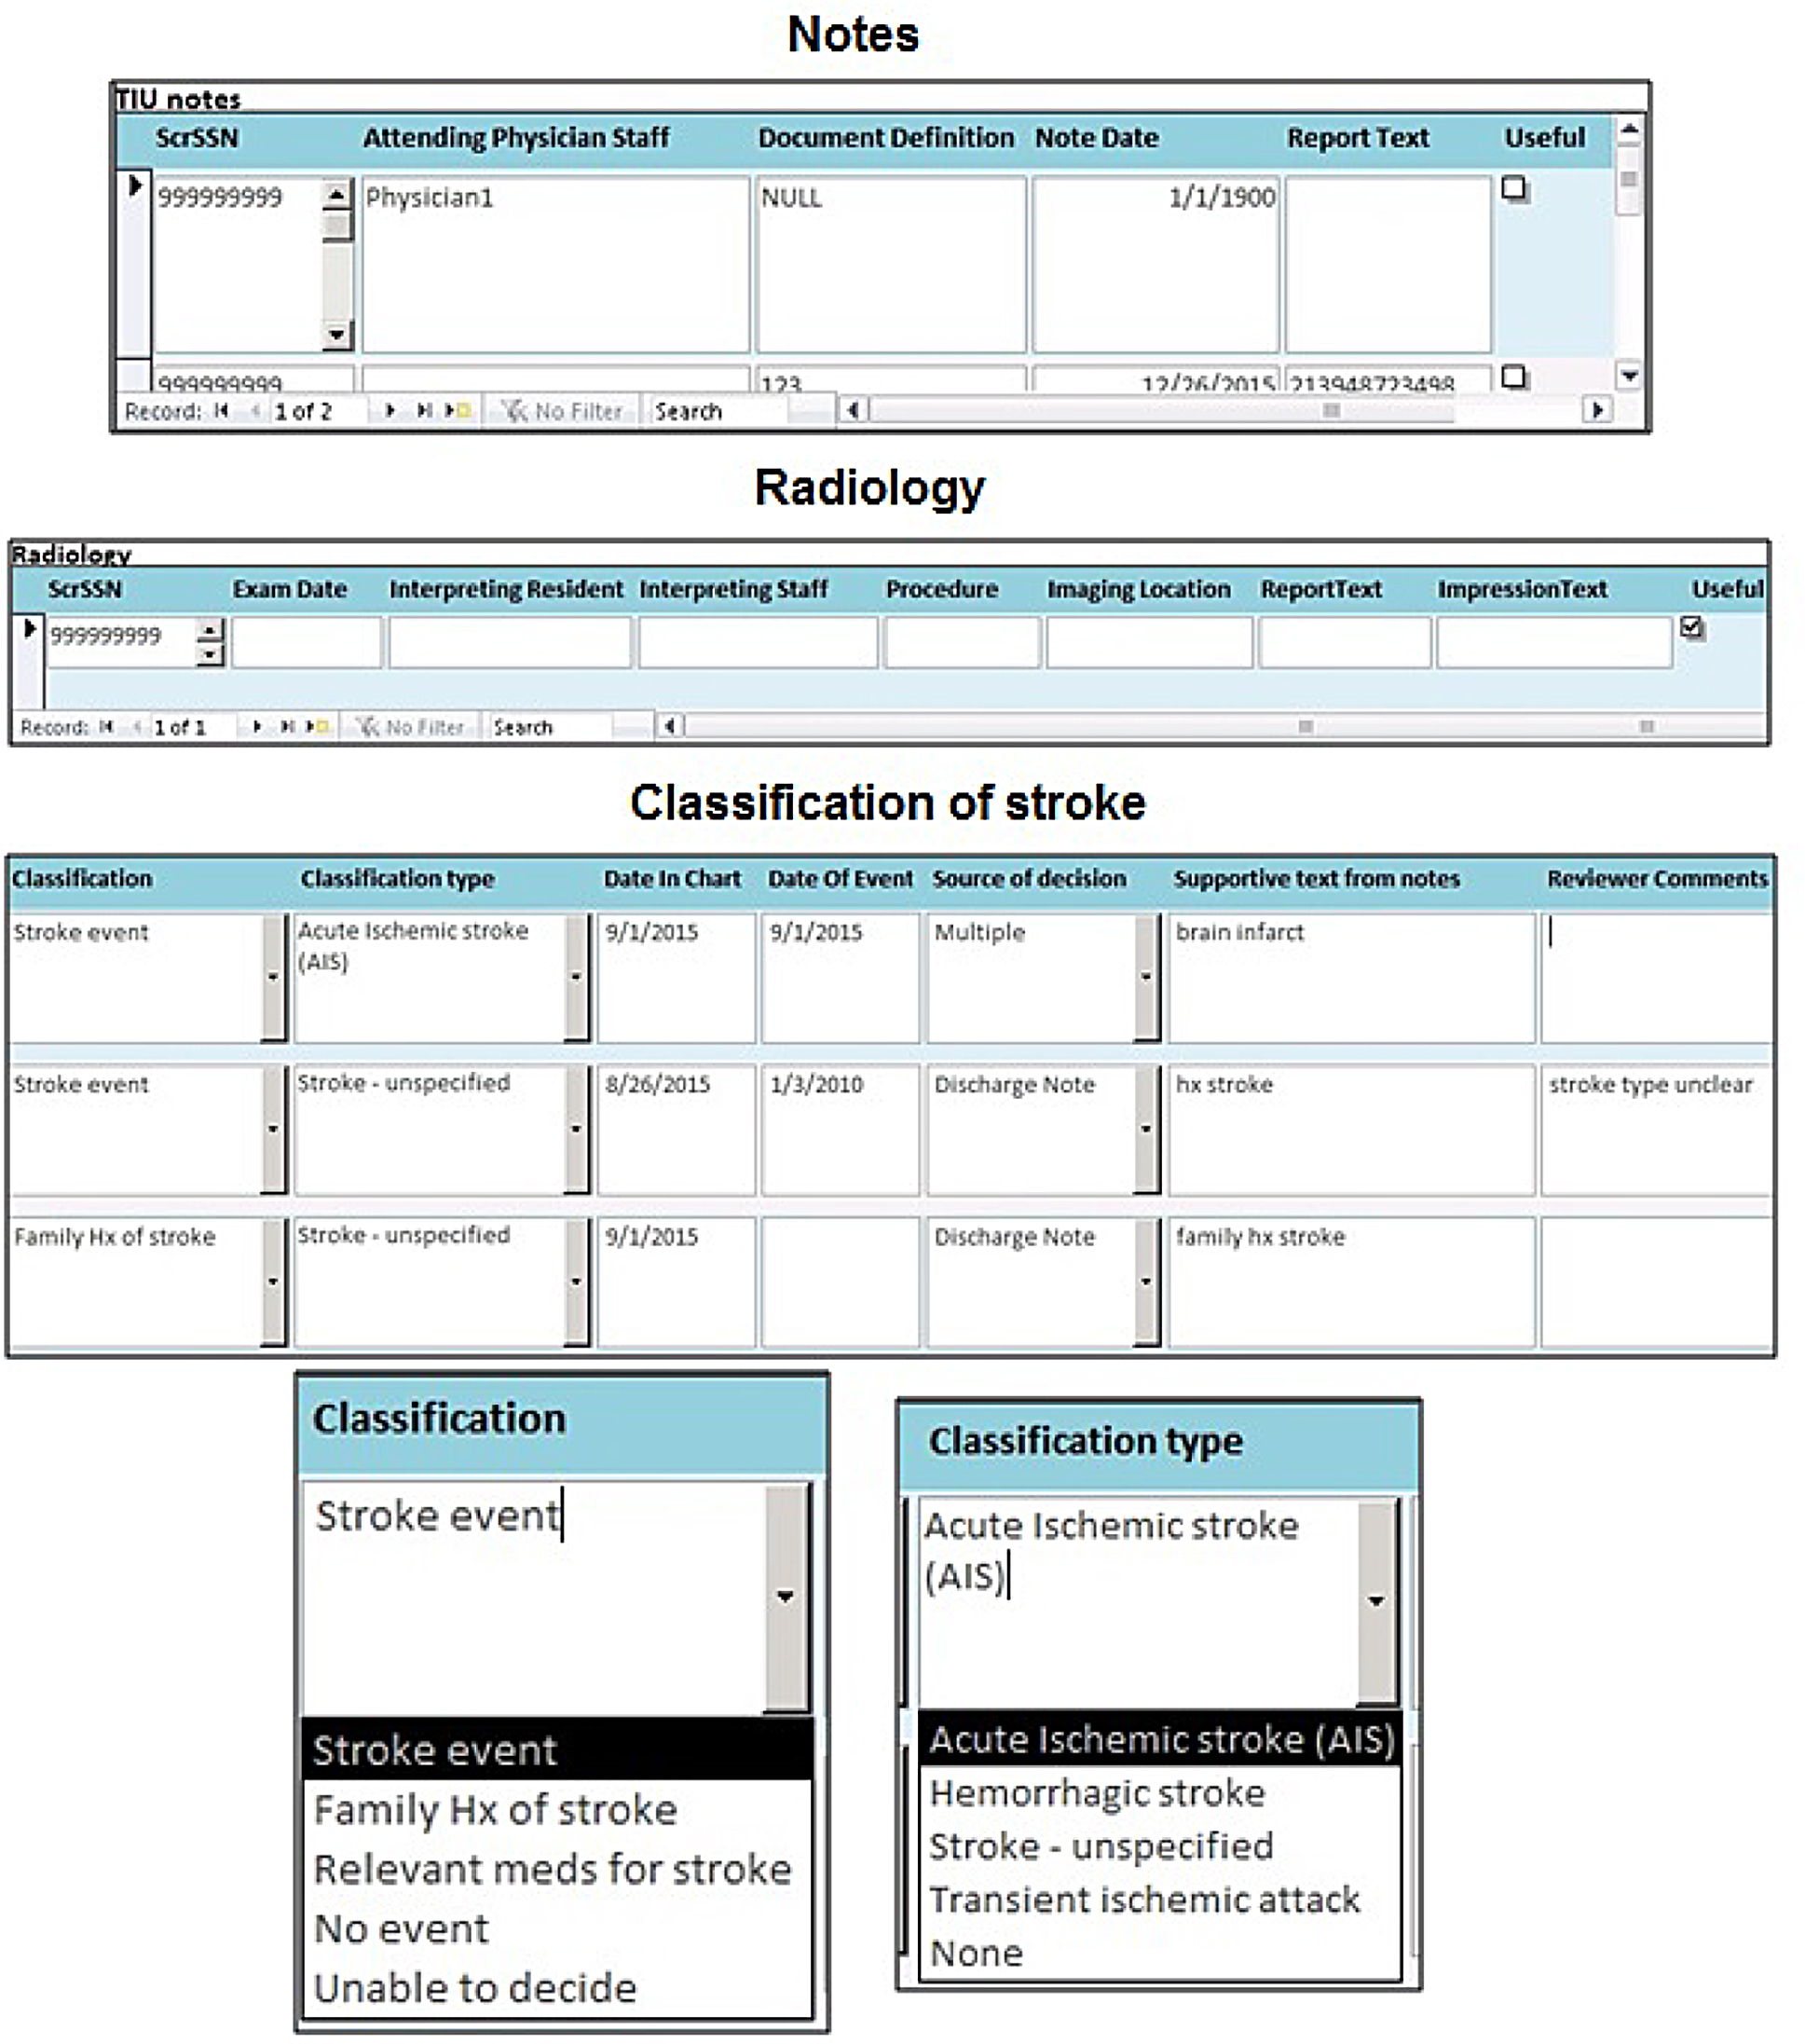
We used a Microsoft Access database on the Vinci platform to perform chart reviews. The records included both structured and unstructured elements. This database included a list of charts with patient demographics, including date of birth, date of death, sex, and race; ICD9 codes for stroke diagnosis, date of the ICD9 code, code description, and visit type (outpatient or inpatient); text-integration utility or unstructured notes or clinician notes extracted from the medical record (these included mainly admission notes, discharge summaries, notes by neurologists or cardiologists, and some progress notes), note title, and the number of notes in view; underlying cause of death from the National Death Index (data collected by the Centers for Disease Control from death certificates); ICD9 codes from Centers for Medicare and Medicaid Services billing records for non-VA providers; and radiology notes (which included radiology-procedure name and description of findings).
Figure 2 illustrates the flowchart of the chart-review process, and Figure S1 depicts the organization of the database platform. In addition to the ICD codes, chart review for AIS was validated using the American Heart Association/American Stroke Association definition of AIS. AIS is defined as an episode of neurological dysfunction that is due to a focal cerebral, spinal, or retinal infarction. This can be based on pathological evidence, radiographic evidence, or other objective evidence of focal ischemia in a vascular territory or clinical evidence of focal ischemic injury based on symptoms that last >24 hours, with other etiologies excluded. Silent stroke or “historical stroke” was defined as central nervous system infarction with imaging evidence of infarction, but without a clear history of acute neurological symptoms.20
 | Figure 2 Development of structured acute ischemic stroke algorithm. Abbreviations: CMS, Centers for Medicare and Medicaid Services; CVA, cerebrovascular accident; NDI, National Death Index; TIA, transient ischemic attack; VA, Veterans Affairs. |
Below these data elements, a reviewer’s comments section was provided. For instance, if it was not clear whether the patient had had a stroke from the data provided or if the patient was ruled out for a stroke, these comments would be listed in this section. The next section included classification (stroke event, historical stroke, family history of stroke, no event, relevant medication for stroke prevention, or “unable to decide” if it was not clear whether the patient had had an acute stroke from the data provided). If the chart reviewer selected stroke event, he/she would then be prompted to enter the classification type of the stroke event: AIS, hemorrhagic stroke, stroke unspecified, or TIA. In addition to stroke event, the reviewer was asked to specify the date of the event in the format of month, day, and year. If the date was unknown, this field was left blank. The reviewer also noted whether the stroke was a first or second event. Differing reviews for the same patient were resolved through discussion, which produced a single consensus label.
After the date, a field titled “source of decision” appeared, which prompted the reviewer to select which data sources were used from the aforementioned sources. Multiple sources could be selected here. In order to improve this database platform for subsequent chart reviews, the reviewer was asked to list supportive text or keywords that were helpful in making his/her decision.
Algorithm development and statistical analysis
The 300 charts were assigned a label of “no AIS” (n=177), “possible AIS” (n=32), or “definite AIS” (n=91), where “no AIS” included hemorrhagic strokes (n=5) and TIAs (n=2). Charts labeled “possible AIS” had insufficient evidence of AIS, ie, relevant physician notes were present, but primary imaging data or a clinical exam at diagnosis absent. We treated possible AIS charts as missing data, excluded them from training the algorithm, and later compared them against other stroke categories using algorithm-predicted stroke probabilities (Figure 3).
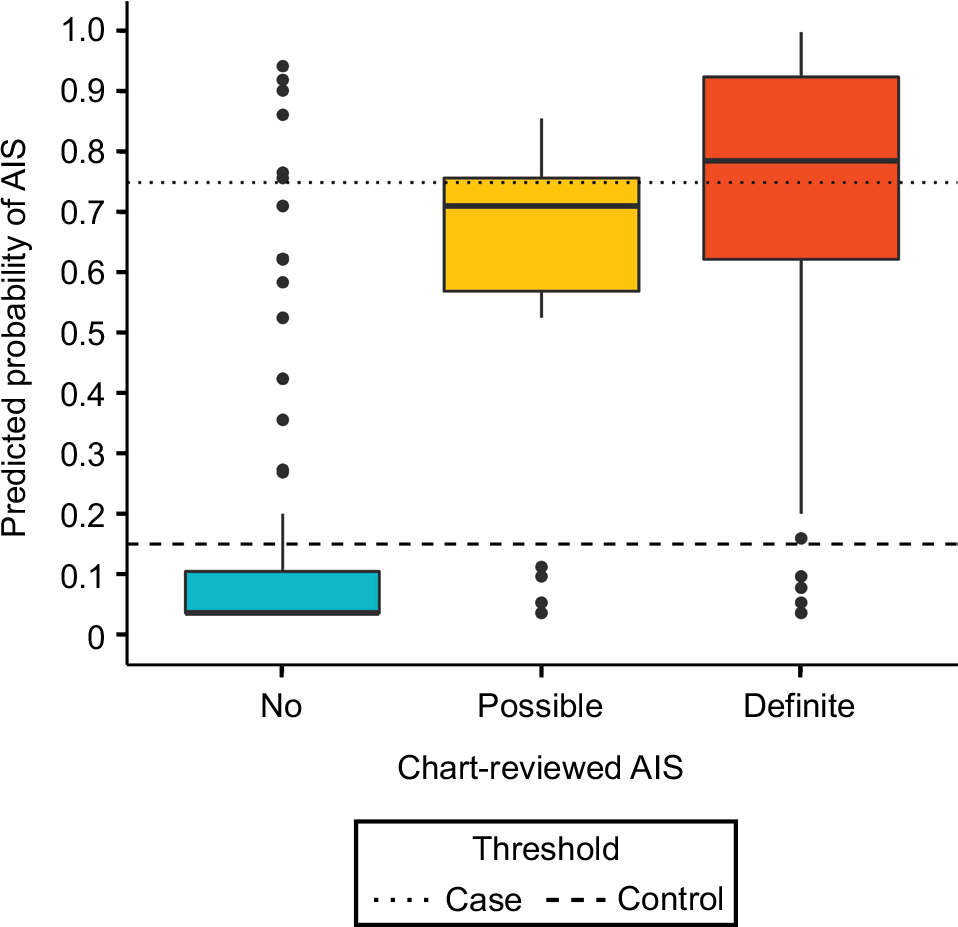 | Figure 3 Predicted probabilities of stroke based on charts reviewed. Notes: Thresholds optimized for largest n (excluding Pcontrol<P<Pcase) with Cohen’s k>0.9 between algorithm labels and review labels. Abbreviation: AIS, acute ischemic stroke. |
Covariates considered for the algorithm are presented in Table 1. Only stroke-specific (or CVD-related) procedure codes, medication, such clinical parameters as blood pressure, and cause of death were included. Categorical covariates, such as individual ICD9 codes, were summarized with counts (number of recorded codes) and indicators (0, absence; 1, presence of a comorbid condition). Each medication was coded as three covariates: indication of use, total dosage, and mean daily dosage. Maximum and mean systolic blood pressure (mmHg) were also included.
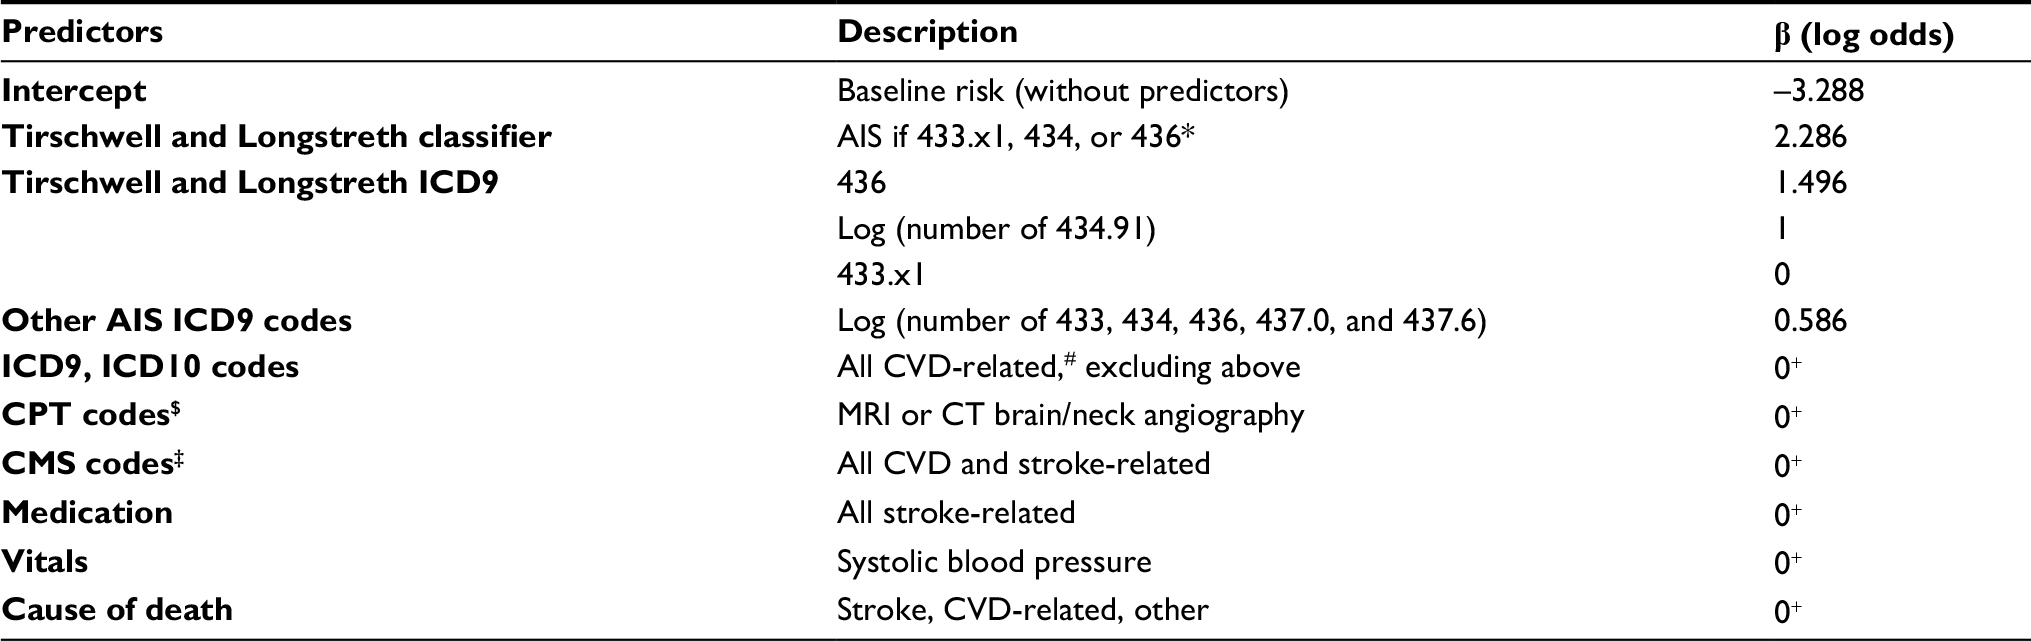 | Table 1 List of predictors and variable importance in the acute ischemic stroke algorithm Notes: *Excluding 434.x0, 430 (subarachnoid hemorrhage), and 431 (intracerebral hemorrhage). Counts of 433.x1 were unimportant after inclusion of the Tirschwell and Longstreth7 classifier. +Not included in the optimal predictor set or estimated 0 by adaptive LASSO. #Diabetes (250), CHD-related (410–415, 427), cerebrovascular disease (430-438), hypotension (458), syncope (780.2), TIA Hx (V12.54), fall Hx (V15.88), aortocoronary bypass (V45.81), coronary angioplasty (V45.82). $Current procedural terminology (CPT) codes are used in the VHA for reporting medical services and procedures. ‡Procedure codes used by the Centers for Medicare and Medicaid Services (CMS). Abbreviations: AIS, acute ischemic stroke; CVD, cardiovascular disease; MRI, magnetic resonance imaging; CT, computed tomography; LASSO, least absolute shrinkage and selection operator. |
Algorithm development is presented in Figure 1. First, the data (n=268) were randomly split into a training set (n=134, 46 cases and 88 controls) and validation set (n=134, 45 cases, 89 controls). Several adaptive least absolute shrinkage and selection operator (LASSO)11,12 models, ie, regularized logistic regressions, were trained over 50 repetitions of tenfold cross-validation, where regularization parameter λ and adaptive parameter γ (0.5, 1, or 2) were tuned to minimize cross-validated binomial deviance. Adaptive LASSO was chosen over other machine-learning algorithms because of its feature selection and transparency. Cross-validation was also used to choose the most informative set of predictors. In total, four sets of predictors were considered: the Tirschwell and Longstreth7 classifier and all accompanying ICD9 codes that occurred in at least ten training observations, two sets with additional variables added to the baseline set, and a final set with all predictors (Table 1). The algorithm with the lowest deviance was then used to predict the probability of AIS and no AIS in the validation data. R version 3.4.3 was used for all analyses.13
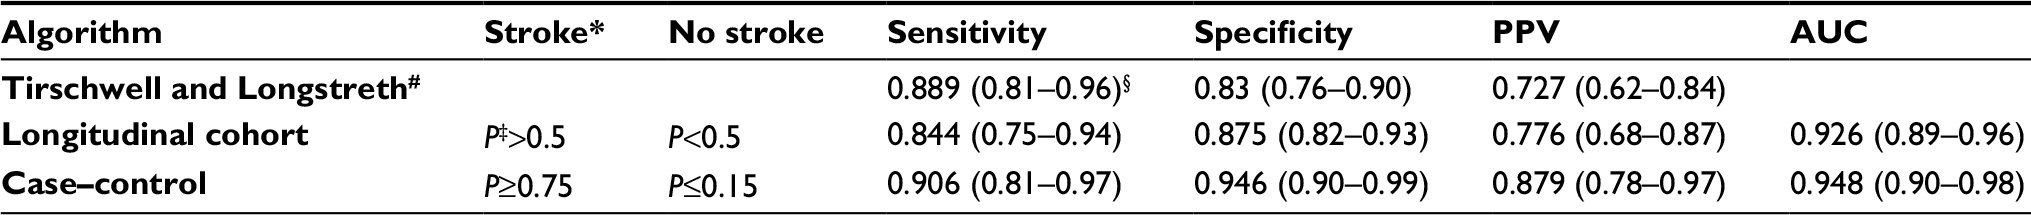
Classification metrics (sensitivity, specificity, positive predictive value [PPV], area under the curve) were evaluated on the validation set for three models: the Tirschwell and Longstreth rule-based algorithm,7 the best machine-learning model with default probability threshold (ie, longitudinal algorithm), and the best machine-learning model with optimal probability thresholds (ie, case–control algorithm). The default probability threshold assigned AIS to subjects with predicted probabilities >0.5 and no AIS to subjects with predicted probabilities <0.5. Optimal probability thresholds included a case threshold, above which subjects were predicted cases, and a control threshold, below which subjects were predicted controls. A subject between the case and control thresholds was considered “uncertain” and excluded when assessing the model’s classification performance. The case and control thresholds were optimized in the training data to yield the largest sample size (excluding “uncertain” cases), with high agreement between algorithm and reviewer labels (Cohen’s κ>0.9).
Clinical characteristics of patients with acute ischemic stroke in the nationwide VA cohort
Demographic characteristics
Age and race were extracted from the VHA electronic database, noted at the time of diagnosis of AIS. We categorized race according to standard categories already present in the VHA system: White, American Indian/Alaska native, Asian, Black/African-American, native Hawaiian or other Pacific Islander and other.
Cardiovascular risk factors and comorbid conditions
Smoking status was predicted from VHA lifestyle surveys and EHRs. Each subject was assigned one of three categories: current, past, or present smoker. To report smoking accurately, we used a probabilistic model to predict smoking status using structured data from the EHR, which included smoking-related health factors, diagnosis codes, medications, and outpatient-clinic specialty.9 The MVP’s self-reported smoking categories of never, former, and current from the baseline and lifestyle surveys were used as the gold standard. LASSO regression with tenfold cross validation was used to select the most meaningful predictors of smoking status and to apply a penalty to prevent overfitting. β-Coefficients were used to calculate the predicted probability of being a never, former, or current smoker. Subjects were assigned to the smoking group for which they had the highest predicted probability.
Body-mass index was calculated from weight in kilograms divided by height in meters squared, extracted from medical records at the time of AIS diagnosis. Hypertension, hyperlipidemia, diabetes mellitus, atrial fibrillation, COPD, coronary artery disease, peripheral vascular disease, congestive heart failure, chronic kidney disease, chronic liver disease, pulmonary embolism, and deep-vein thrombosis were extracted from the patients’ medical records using ICD9 codes (either one inpatient or two outpatient codes).
Clinical and laboratory values
Systolic and diastolic blood pressures are reported in mmHg. Total cholesterol, high-density-lipoprotein cholesterol, low-density-lipoprotein cholesterol, triglycerides, and hemoglobin A1c were extracted from medical visits after the diagnosis of AIS. Two clinicians adjudicated laboratory values for accuracy. Estimated glomerular filtration rate was calculated from serum creatinine using the Chronic Kidney Disease Epidemiology Collaboration equation.14
Medications
Aspirin, clopidogrel, warfarin, statins, β-blockers, angiotensin-converting-enzyme inhibitors, and angiotensin-receptor blockers were obtained from prescription codes within the VA healthcare system. Two independent clinician reviewers adjudicated these medications. Of note, many patients at the VA obtain aspirin as an over-the-counter medication instead of through a prescription, and thus the reported percentage of aspirin use in our table is likely an underestimation.
Results
The final 268 “no stroke” and “definite stroke” chart-reviewed labels, in addition to the EHR elements (Table 1), were used to train the machine-learning algorithms. The algorithm assigned a diagnosis of AIS when probability of “definite stroke” exceeded a specified threshold. Similarly, a diagnosis of no stroke was assigned when probability of “definite stroke” fell under another specified threshold (Table 2). Two algorithms were developed: one for longitudinal cohort studies and one for case–control studies. For longitudinal studies, in which a stroke phenotype was necessary for every patient, case and control thresholds at 0.5 were most accurate. For case–control studies, in which we were able to exclude uncertain stroke cases and controls, a case threshold of 0.75 and control threshold of 0.15 yielded the highest sensitivity and specificity, excluding uncertain patients (0.15≤P≤0.75).
 | Table 2 Classification performance in the validation set (n=134) Notes: *Decision rule for classifying acute ischemic stroke; #from Tirschwell and Longstreth;7 ‡predicted from classification model; §performance measure (bootstrapped 95% CI). Abbreviations: PPV, positive predictive value; AUC, area under the curve. |
The best-performing model was adaptive LASSO regression with hyperparameters λ=0.016 and γ=1 trained with the second predictor set. The final predictors selected by LASSO were the Tirschwell and Longstreth classifier (β1=2.29), indicator for ICD9 codes 436 (β2=1.50), natural log of number of ICD9 code 434.91 (β3=1.0), and log of number of ischemic stroke-related ICD9 codes 433, 434, 436, 437.0, and 437.6 (β4=0.59). The predicted probability for subjects with no predictors was 0.036, positive Tirschwell and Longstreth classifier 0.269, only Tirschwell and Longstreth classifier and one instance of ICD9 434.91 0.424, and only Tirschwell and Longstreth classifier and ICD9 436 0.621. Additional ICD9 codes (433, 434, 436, 437.0, and 437.6) conferred additional risk above these baseline risks.
Our case–control algorithm had sensitivity of 91%, specificity of 95%, and PPV of 88%. It was slightly more sensitive than Tirschwell and Longstreth’s algorithm (0.906 vs 0.889) and much more specific (0.946 vs 0.83), leading to a superior PPV (0.879 vs 0.727). The probability threshold improved on the Tirschwell and Longstreth algorithm by excluding subjects with uncertain stroke diagnoses (ie, predicted stroke probabilities between 0.15 and 0.75), but the exclusions led to fewer cases and controls. The longitudinal cohort algorithm had comparable classification performance to the Tirschwell and Longstreth algorithm, with lower sensitivity (0.844 vs 0.889), but higher specificity (0.875 vs 0.83) and PPV (0.776 vs 0.727).
Table 3 contains sample sizes and characteristics, including demographic, clinical variables, and comorbid conditions, when the case–control algorithm was applied to the VHA-wide cohort. Characteristics of patients with predicted AIS cases from the chart reviews (60 cases), the MVP (3,423 cases/323,122) and the VA-wide CVD-risk cohort (80,508 cases/2,114,458) are shown. For the VA-wide CVD-risk cohort, the mean age was 65±11 years, mean body-mass index 29 kg/m2, 98% of patients were men, and 81% were White. The prevalence of smoking (current or past) was 82%, hypertension was 76%, and hyperlipidemia was 61%. In contrast, the MVP cohort had a slightly lower cumulative incidence of AIS, tended to be younger, with a mean age of 56 years, and had lower smoking prevalence of 41%. From the year 2000 onwards, the CVD-risk cohort had an estimated crude 15-year cumulative incidence of 80.8 cases/1,000 persons using the Tirschwell and Longstreth algorithm and 75.8 cases/1,000 persons using the longitudinal cohort algorithm. From 2000, the MVP cohort had estimated crude 15-year cumulative incidence of 25.7 cases/1,000 persons and 21.1 cases/1,000 persons with the Tirschwell and Longstreth and longitudinal cohort algorithms, respectively. Tables S2 and S3 provide the incidence per year based on the rule-based algorithm7 and the longitudinal cohort algorithm in the national VA CVD-risk cohort and the MVP cohort.
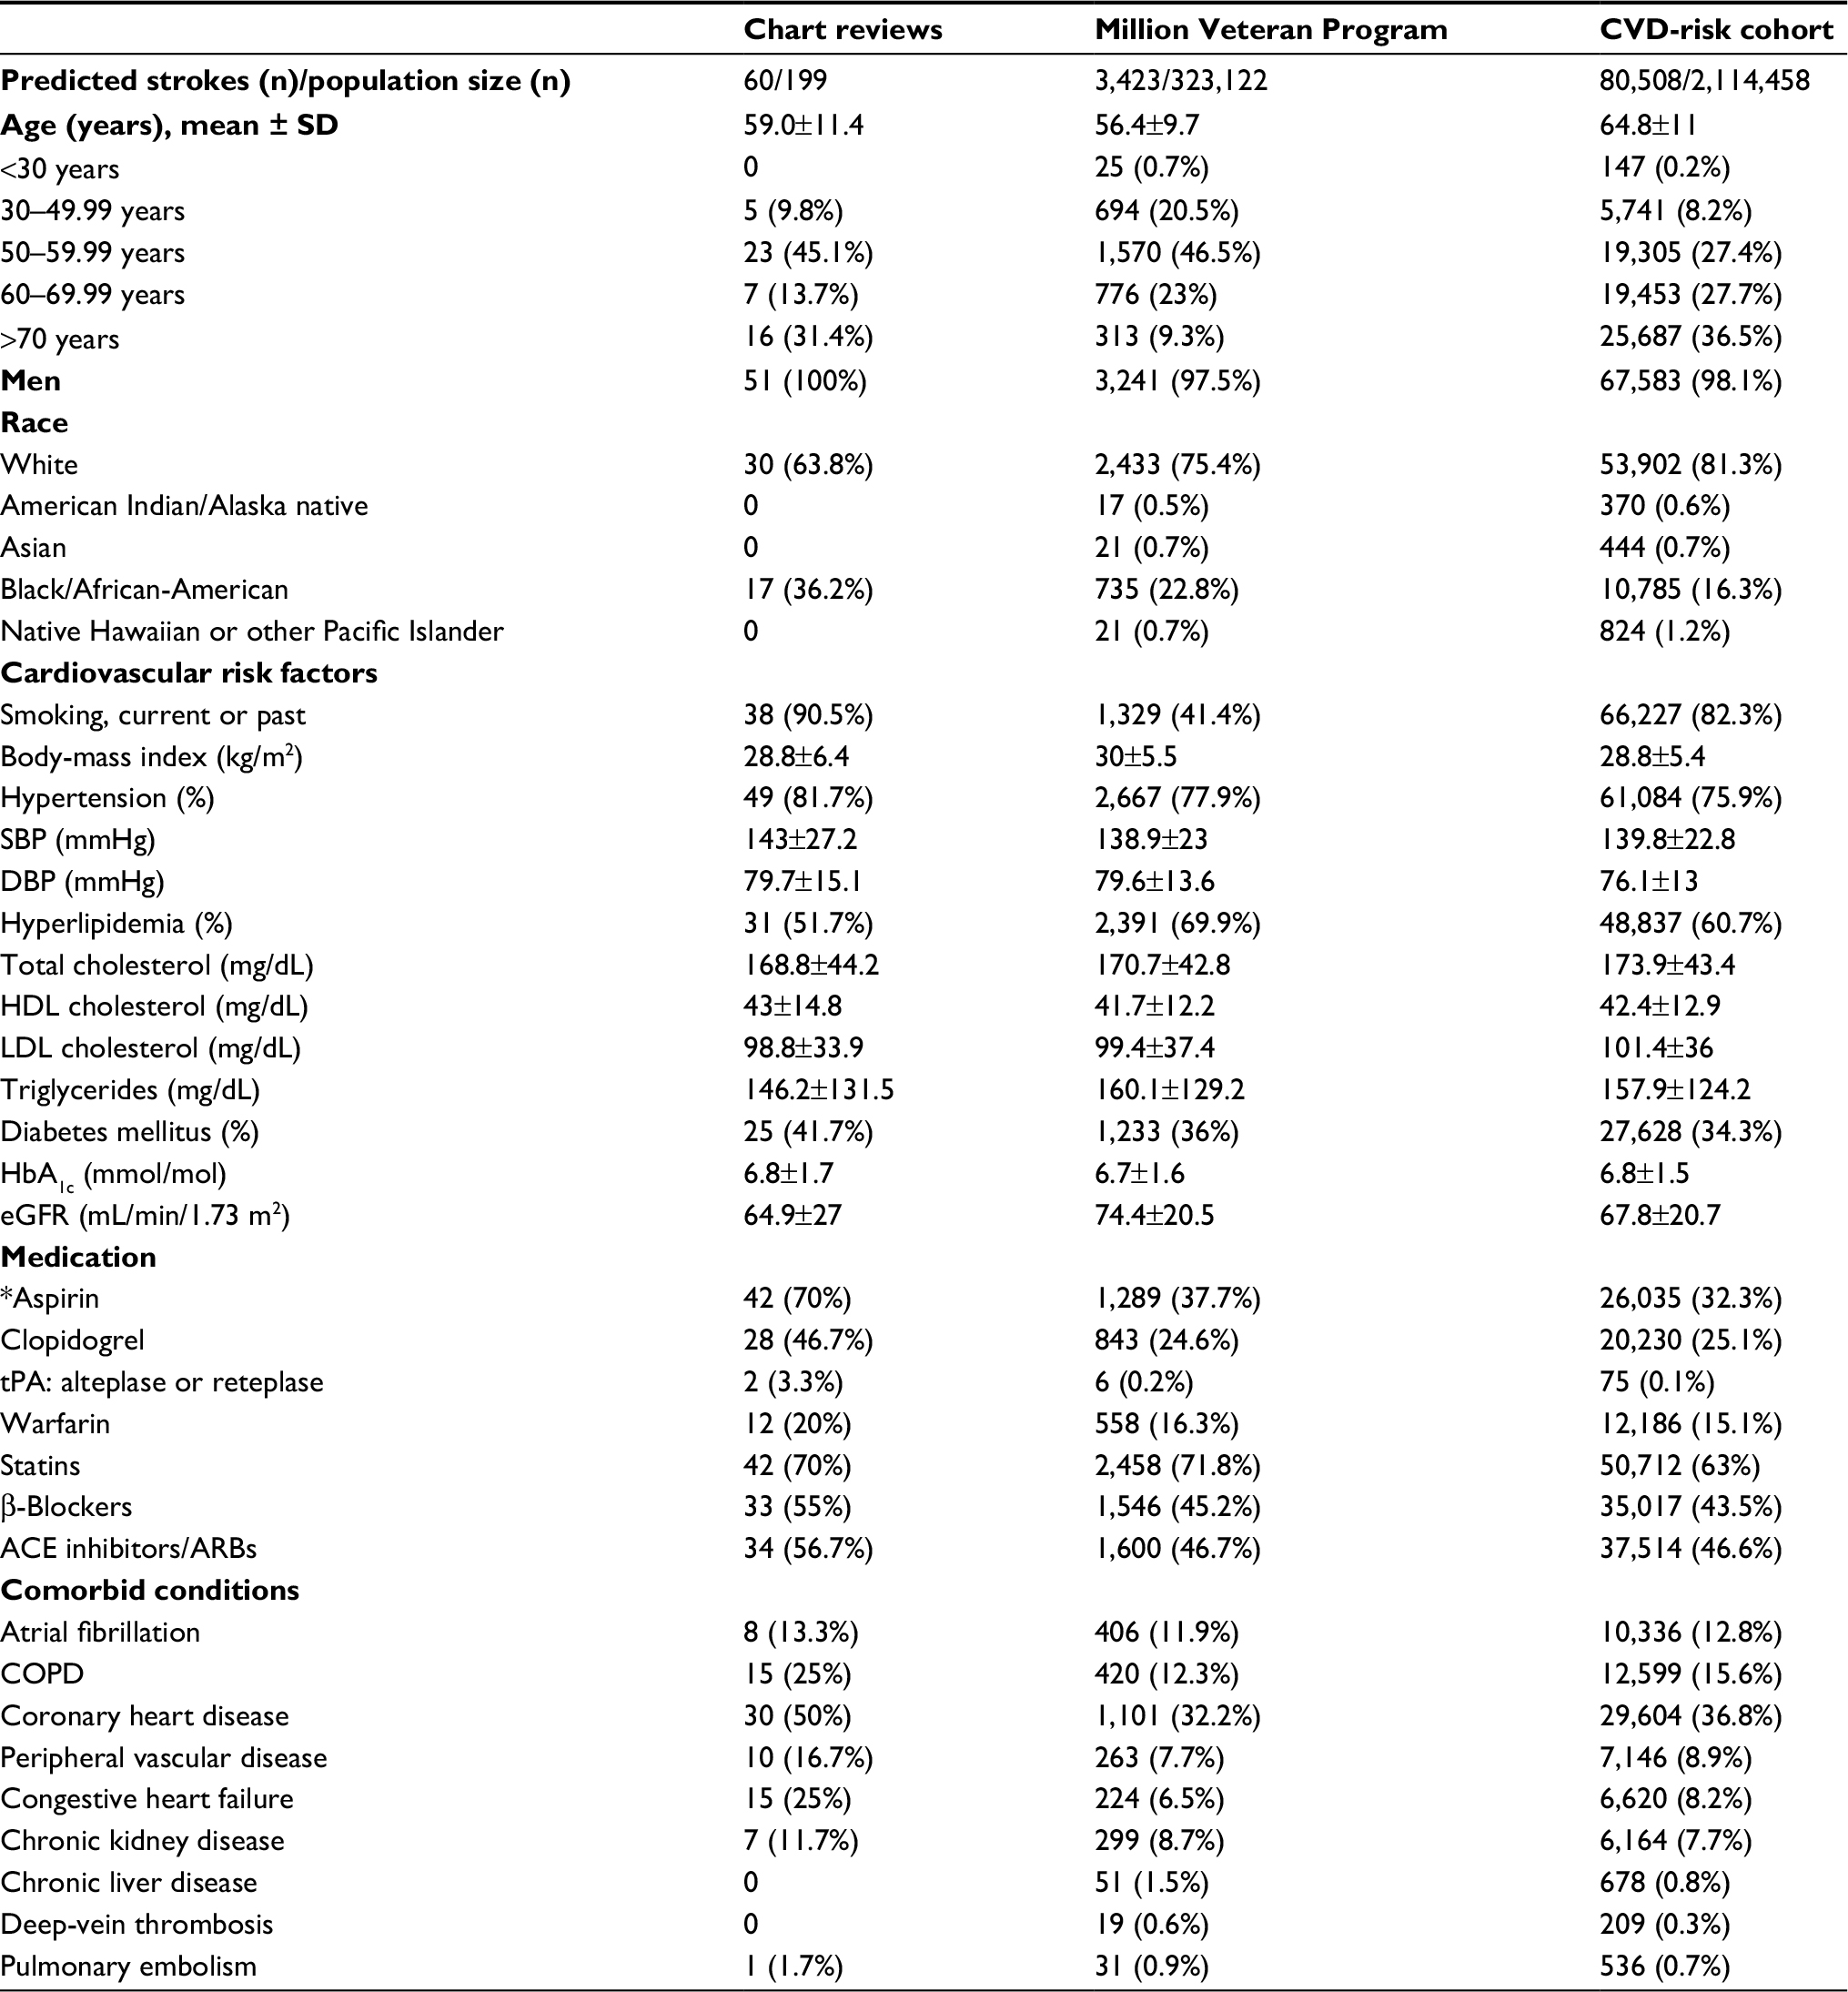 | Table 3 Baseline characteristics of populations with predicted acute ischemic stroke (strict algorithm) Notes: Ages computed at a baseline year of 2002. Descriptive statistics for continuous variables computed using first lab values within a year following the first stroke event. Dichotomous variables, such as medications, are positive if any records found within a year of first stroke event. *Aspirin is taken by many patients as an over the counter and/or non-VA medication instead of a prescription, and thus the reported percentage in this table is an underestimation of aspirin use. Abbreviations: ACE, angiotensin converting enzyme; ARBs, angiotensin-receptor blockers; CVD, cardiovascular disease; DBP, diastolic blood pressure; eGFR, estimated glomerular filtration rate; HDL, high-density lipoprotein; LDL, low-density lipoprotein; SBP, systolic blood pressure; tPA, tissue plasminogen activator. |
Discussion
Our algorithm demonstrates that patients with AIS can be identified with both high sensitivity and specificity in a large national database. We present three different approaches to this task: a rule-based algorithm,7 a machine-learning algorithm for longitudinal cohort studies, and a machine-learning algorithm for case–control studies that excludes patients with uncertain stroke diagnoses. The rule-based Tirschwell and Longstreth algorithm7 yields high sensitivity and sample size, while the longitudinal cohort algorithm has increased specificity and PPV. The case–control algorithm has the highest specificity and PPV, but produces no classification for patients with uncertain stroke diagnoses and cannot be applied to longitudinal cohorts. The machine-learning algorithm produces probabilities, which can be used to recalibrate the model for different (non-VA) populations.15
Ideally, power analyses should be run to choose among the three models and determine the optimal trade off of sensitivity and specificity for each study. If a power analysis is unavailable, we suggest applying strict probability thresholds with high specificity to populations where disease prevalence is low. Both false positives and false negatives will reduce the effect size of a risk factor, but false positives and algorithm specificity have a higher impact when stroke is less prevalent. Finding the appropriate balance of sensitivity and specificity is especially important when effect sizes are small, such as in GWASs. High specificity and sample size are essential for GWASs, due to most genetic variants having small effects on complex phenotypes, such as stroke. Misclassification of cases and controls would reduce the effect and require an exponentially larger sample size to maintain adequate power.
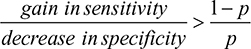
In the absence of a power analysis, we suggest the algorithm with the fewest false positives and false negatives overall for choosing between a more sensitive algorithm and a more specific algorithm. The more sensitive algorithm will have (sensitivity gain) × p × n fewer false negatives and (sensitivity decrease) × (1–p) × n more false positives than the more specific algorithm, where p is the prevalence and n the population size. In other words, use the more sensitive algorithm when:
|
If every patient needs a clear classification, such as when AIS is used to define another phenotype or is used in a longitudinal study, we recommend identifying stroke with simpler rule-based algorithms (such as Tirschwell and Longstreth)7 or our longitudinal cohort algorithm. Table 3 shows that the sensitivity:specificity ratio was 3.54 for the Tirschwell and Longstreth algorithm compared to the longitudinal cohort algorithm, so the rule-based Tirschwell and Longstreth algorithm7 would be preferred over our longitudinal cohort algorithm when stroke prevalence exceeds 22%.
A recent study that validated ICD9 codes for AIS in a national health-insurance claims database in Taiwan found a PPV of 88%, sensitivity of 97%, and false-positive rate of 11.6%. The Taiwanese cohort had a PPV comparable to that of our study (88% vs 88%),16 but a much higher false-positive rate (11.6% vs 5%).16 In contrast to the previous algorithm described by Tirschwell and Longstreth,7 which included an administrative database of discharge diagnoses for all patients hospitalized in Washington State (excluding the VA hospitals), our case–control algorithm had greater sensitivity (91% vs 89%) and much higher specificity (95% vs 83%). There are several plausible reasons that we may observe such differences. First, our case–control algorithm improves on specificity by excluding subjects with uncertain stroke diagnoses (those with predicted probabilities of 0.15–0.75). With the inclusion of only definite stroke cases, our specificity is increased. However, it yields a smaller number of cases compared to an algorithm that includes both probable and definite cases. For instance, some uncertain cases or cases of TIA may be coded as stroke and picked up in previous algorithms, but would not be classified as definite AIS in our algorithm. The population studied by Tirschwell and Longstreth7 differed from our study in that it included patients in one state in hospitals other than the VA, whereas our study includes veterans in a nationwide cohort. The mean patient age (68 years in the validation subset) was slightly higher in the Tirschwell and Longstreth cohort than in ours (65 years). The percentage of women in this cohort was 44% compared to 2% in the VA. However, the overall underlying pathophysiology would be the same for the two populations. Moreover, the Tirschwell and Longstreth study was conducted in 2002, whereas our study is more recent, and thus there are differences in clinical diagnosis, imaging techniques, and management of stroke over time that affect these findings. The American Heart Association/American Stroke Association guidelines for the prevention of stroke in patients with stroke and TIA have been updated over the years to reflect these changes, with the latest in 2014.17
Our study has limitations. Although we have provided (bootstrapped) 95% CIs (Table 2), our small sample, lack of independent test set, chart-sampling criteria based on administrative codes, and exclusion of uncertain cases may lead to optimistic sensitivity and specificity. Some patients had AIS events at non-VA hospitals, but returned to the VHA system afterwards. Physicians noted these events and stroke-related complications, but the VHA records often lack the primary stroke data (imaging and clinical exam) that were collected at other institutions. We excluded these “possible” strokes when assessing classification performance, and the case–control algorithm excluded them using probability thresholds (Figure 3). While the algorithm does not require primary stroke data and might misclassify these cases in the population, Figure 3 shows that there is a positive trend in algorithm-predicted probability across the chart reviewed “no”, “possible”, and “definite” stroke groups. The medical charts chosen for review were based on ICD9-CM codes with a high probability for stroke. Those with less definite ICD codes were likely missed, thus decreasing sensitivity. However, this is likely to occur across all categories. Also, the time frame of our study was 1992–2014, and thus may not generalize to other periods.
Our study also has several strengths. First, we present a highly specific algorithm to analyze cases of AIS from a large national cohort, which can easily be applied to other databases as well. Careful implementation of the algorithm, such as removing uncertain stroke cases, resolves several study limitations of administrative data. Each stroke case also has an associated probability of being a true case, which can be used as its own phenotype in β-regression.18 Consequently, researchers can utilize the large study population at little cost to quality and with minimal time and resources spent reviewing medical records. Also, in contrast to cohort studies commonly used in clinical research that may contain self-reported information or biomarker data, large clinical databases, such as the VHA database, have more detailed anthropometric, demographic, clinical, and biomarker data, often with large samples. Additionally, our gold-standard chart review incorporated brain-imaging data, which were lacking in many prior studies that developed stroke algorithms.4 Such efforts as this to produce an accurate algorithm for AIS may be further utilized when linked with GWASs, thus paving the way for precision medicine in the future. Future developments will analyze unstructured data elements, such as applying natural-language processing to free-form medical notes or using deep (machine) learning to differentiate between brain images of patients with and without stroke. Specifically, our group is working on developing a novel chart-review tool using natural-language processing for validating EHR-based phenotyping algorithms.
Acknowledgments
The views expressed in this article are those of the authors, and do not necessarily reflect the position or policy of the Department of Veterans Affairs. The authors thank the staff members at the Massachusetts Veterans Epidemiology Research and Information Center, members of this study, those who have contributed to the Million Veteran Program, and especially the veteran participants for their generous contributions. The Cardiovascular Health Study is funded under VA Merit Award I01-CX001025. The Million Veteran Program is funded by the Office of Research and Development, Department of Veterans Affairs, supported by grant CSPG002.
Disclosure
The authors report no conflicts of interest in this work.
References
Lozano R, Naghavi M, Foreman K, et al. Global and regional mortality from 235 causes of death for 20 age groups in 1990 and 2010: a systematic analysis for the Global Burden of Disease Study 2010. Lancet. 2012;380(9859):2095–2128. | ||
Béjot Y, Mehta Z, Giroud M, Rothwell PM. Impact of completeness of ascertainment of minor stroke on stroke incidence: implications for ideal study methods. Stroke. 2013;44(7):1796–1802. | ||
Manuel DG, Rosella LC, Stukel TA. Importance of accurately identifying disease in studies using electronic health records. BMJ. 2010;341:c4226–c4443. | ||
Andrade S, Harrold L, Tjia J, et al. A systematic review of validated methods for identifying cerebrovascular accident or transient ischemic attack using administrative data. Pharmacoepidemiol Drug Saf. 2012;21(2 Pt 1):100–128. | ||
Woodfield R, Grant I, Sudlow CL. Accuracy of electronic health record data for identifying stroke cases in large-scale epidemiological studies: a systematic review from the UK Biobank Stroke Outcomes Group. PLoS One. 2015;10(10):e0140533. | ||
Jones SA, Gottesman RF, Shahar E, Wruck L, Rosamond WD. Validity of hospital discharge diagnosis codes for stroke: the Atherosclerosis Risk in Communities Study. Stroke. 2014;45(11):3219–3225. | ||
Tirschwell DL, Longstreth WT. Validating administrative data in stroke research. Stroke. 2002;33(10):2465–2470. | ||
Department of Veterans Affairs. Department of Veterans Affairs: statistics at a glance. 2016. Available from: https://www.va.gov/vetdata/docs/Quickfacts/Homepage_slideshow_06_04_16.pdf. Accessed May 12, 2017. | ||
Gaziano JM, Concato J, Brophy M, et al. Million Veteran Program: a mega-biobank to study genetic influences on health and disease. J Clin Epidemiol. 2016;70:214–223. | ||
Fleiss JL, Cuzick J. The reliability of dichotomous judgments: unequal numbers of judges per subject. Appl Psychol Meas. 1979;3(4):537–542. | ||
Zou H. The adaptive LASSO and its oracle properties. J Am Stat Assoc. 2006;101(476):1418–1429. | ||
Huang J, Ma S, Zhang CH. Adaptive LASSO for sparse high-dimensional regression models. Stat Sin. 2008;18(4):1603–1618. | ||
R Core Team. R: a language and environment for statistical computing. 2016. Available from: https://www.R-project.org. Accessed August 2, 2018. | ||
Levey AS, Stevens LA, Schmid CH, et al. A new equation to estimate glomerular filtration rate. Ann Intern Med. 2009;150(9):604–612. | ||
Niculescu-Mizil A, Caruana R. Predicting good probabilities with supervised learning. Proceedings of the 22nd International Conference on Machine Learning. New York: Association for Computing Machinery; 2005:625–632. | ||
Hsieh CY, Chen CH, Li CY, Lai ML. Validating the diagnosis of acute ischemic stroke in a National Health Insurance claims database. J Formos Med Assoc. 2015;114(3):254–259. | ||
Kernan WN, Ovbiagele B, Black HR, et al. Guidelines for the prevention of stroke in patients with stroke and transient ischemic attack: a guideline for healthcare professionals from the American Heart Association/American Stroke Association. Stroke. 2014;45(7):2160–2236. | ||
Ferrari SL, Cribari-Neto F. Beta regression for modelling rates and proportions. J Appl Stat. 2004;31(7):799–815. | ||
Cohen J. A coefficient of agreement for nominal scales. Educ Psychol Meas. 1960;20(1):37–46. | ||
Sacco RL, Kasner SE, Broderick JP, et al. An updated definition of stroke for the 21st century: a statement for healthcare professionals from the American Heart Association/American Stroke Association. Stroke. 2013;44(7):2064–2089. |
Supplementary materials
 | Figure S1 Database platform for the chart review process. Note: In addition to what is presented in the above figure, the platform also included information on patient demographics, ICD-9 codes, and data from Centers for Medicare and Medicaid Services and the National Death Index. |
 | Table S1 Process of case selection for review (n=300 charts) Note: *This process was replicated for each chart reviewer. |
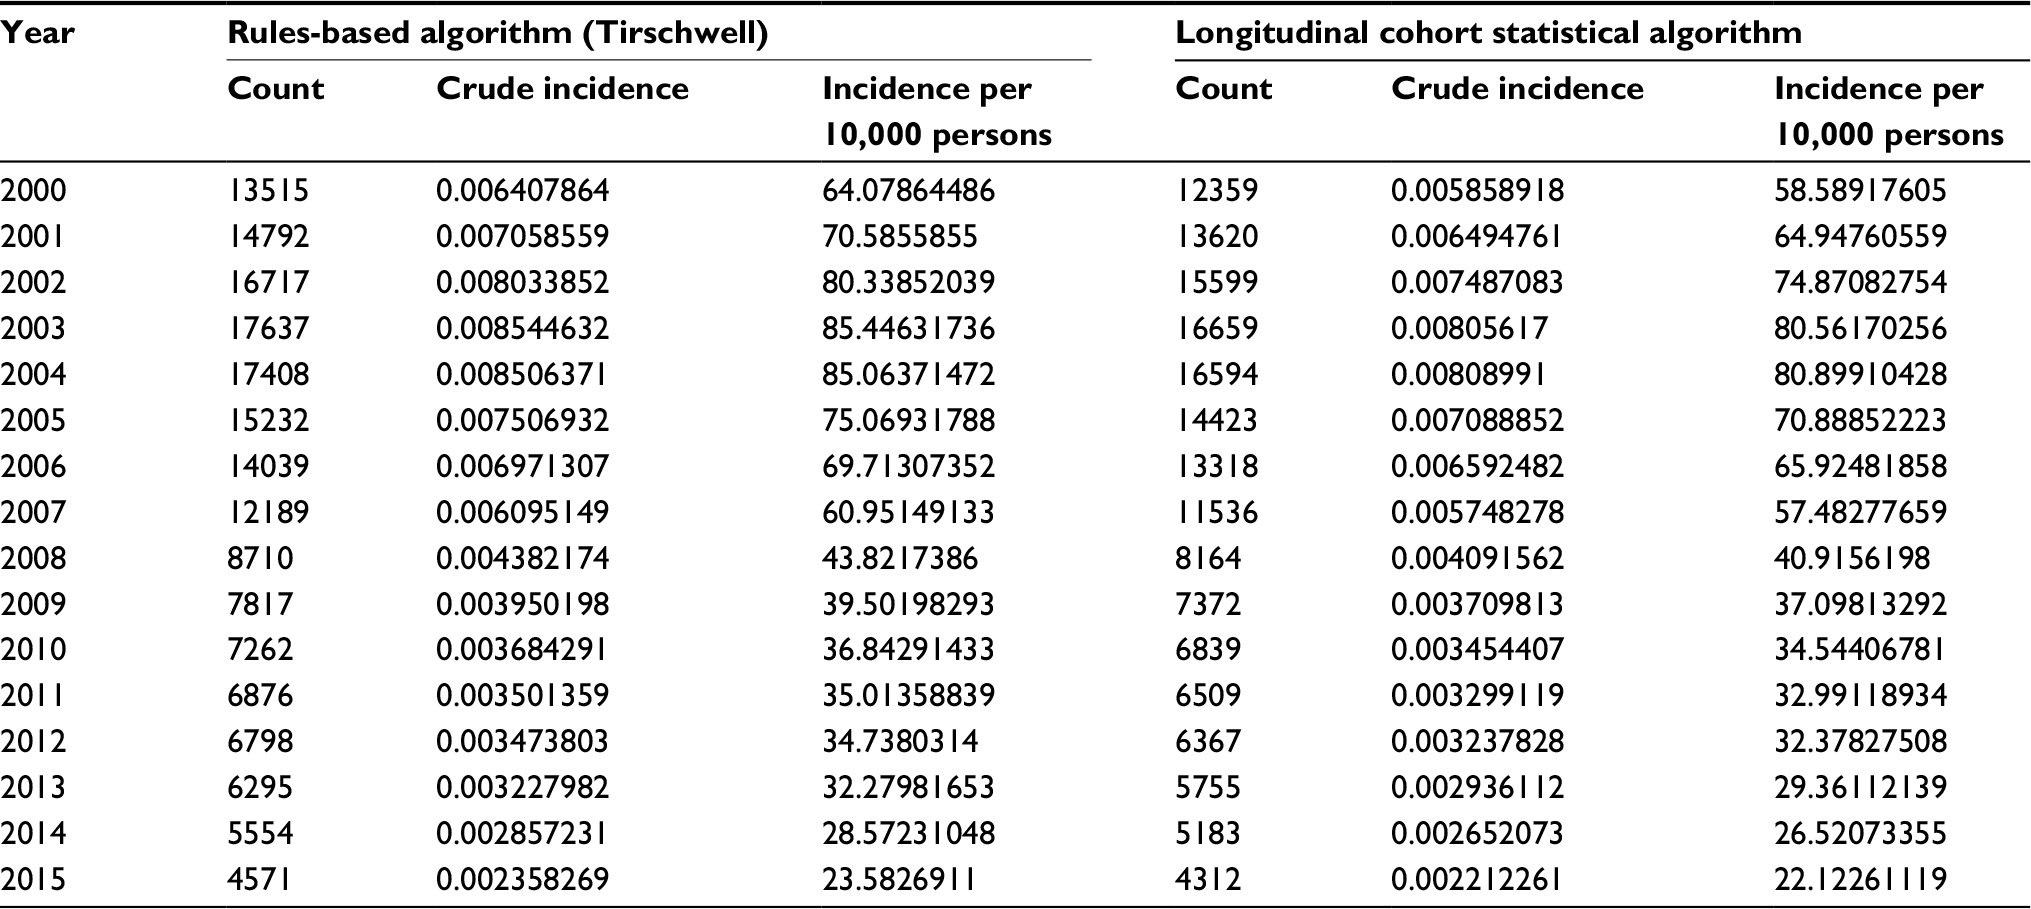 | Table S2 Cumulative incidence of acute ischemic stroke (derived from rules based and statistical algorithm) from 2000 to 2015 in the national Veterans Cardiovascular Disease risk cohort |
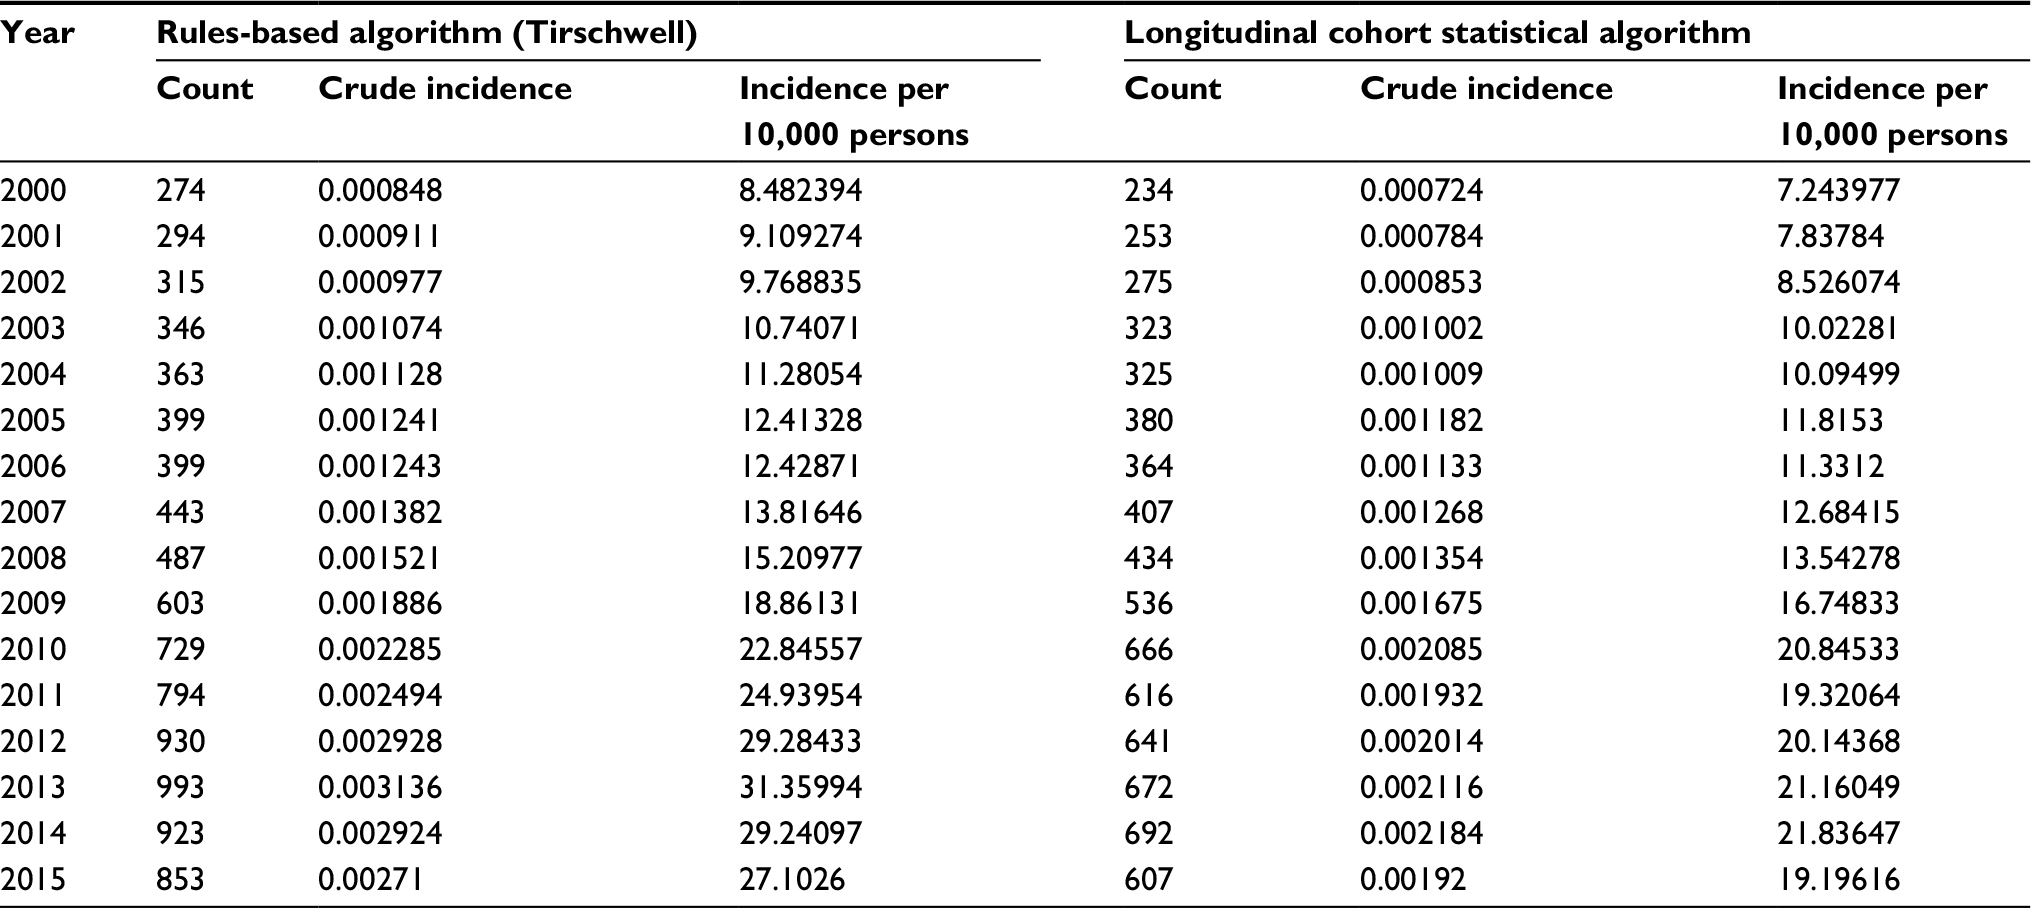 | Table S3 Cumulative incidence of acute ischemic stroke (derived from statistical algorithm) from 2000 to 2015 in the Million Veteran Program |
 | Table S4 Sensitivity and PPV of code-groups in chart-reviewed VA sample (N=300) Abbreviations: PPV, positive predictive value; VA, Veterans Affairs; AIS, acute ischemic stroke; ICH, intracranial hemorrhage; SAH, subarachnoid hemorrhage; TIA, transient ischemic attack; AHA/ASA, American Heart Association/American Stroke Association |
 © 2018 The Author(s). This work is published and licensed by Dove Medical Press Limited. The
full terms of this license are available at https://www.dovepress.com/terms
and incorporate the Creative Commons Attribution
- Non Commercial (unported, 3.0) License.
By accessing the work you hereby accept the Terms. Non-commercial uses of the work are permitted
without any further permission from Dove Medical Press Limited, provided the work is properly
attributed. For permission for commercial use of this work, please see paragraphs 4.2 and 5 of our Terms.
© 2018 The Author(s). This work is published and licensed by Dove Medical Press Limited. The
full terms of this license are available at https://www.dovepress.com/terms
and incorporate the Creative Commons Attribution
- Non Commercial (unported, 3.0) License.
By accessing the work you hereby accept the Terms. Non-commercial uses of the work are permitted
without any further permission from Dove Medical Press Limited, provided the work is properly
attributed. For permission for commercial use of this work, please see paragraphs 4.2 and 5 of our Terms.