Back to Journals » Clinical Ophthalmology » Volume 15
A One Year Longitudinal Comparative Analysis of Visual Outcomes Between Femtosecond Laser-Assisted Cataract Surgery and Standard Phacoemulsification Cataract Surgery
Authors Moshirfar M ![]() , Waite AJ
, Waite AJ ![]() , Ellis JH, Huynh R, Placide J, Barke MR
, Ellis JH, Huynh R, Placide J, Barke MR ![]() , McCabe SE
, McCabe SE ![]() , Ronquillo YC
, Ronquillo YC ![]() , Hoopes PC Jr, Bradley MJ, Hoopes PC
, Hoopes PC Jr, Bradley MJ, Hoopes PC ![]()
Received 27 August 2021
Accepted for publication 3 December 2021
Published 14 December 2021 Volume 2021:15 Pages 4667—4680
DOI https://doi.org/10.2147/OPTH.S336356
Checked for plagiarism Yes
Review by Single anonymous peer review
Peer reviewer comments 3
Editor who approved publication: Dr Scott Fraser
Majid Moshirfar,1– 3 Austin J Waite,4 James H Ellis,5 Rachel Huynh,5 John Placide,6 Matthew R Barke,6 Shannon E McCabe,1,7 Yasmyne C Ronquillo,1 Phillip C Hoopes Jr,1 Michael J Bradley,1 Phillip C Hoopes1
1Hoopes Vision Research Center, Hoopes Vision, Draper, UT, USA; 2Department of Ophthalmology and Visual Sciences, John A. Moran Eye Center, University of Utah, Salt Lake City, UT, USA; 3Utah Lions Eye Bank, Murray, UT, USA; 4A.T. Still University College of Osteopathic Medicine in Arizona, Mesa, AZ, USA; 5University of Utah School of Medicine, Salt Lake City, UT, USA; 6McGovern Medical School at the University of Texas Health Science Center, Houston, TX, USA; 7Mission Hills Eye Center, Pleasant Hill, CA, USA
Correspondence: Majid Moshirfar
Hoopes Vision Research Center, 11820 S. State Street Suite #200, Draper, UT, 84020, USA
Tel +1 801-568-0200
Fax +1 801-563-0200
Email [email protected]
Purpose: To assess visual outcomes over time of femtosecond laser-assisted cataract surgery compared to standard phacoemulsification cataract surgery.
Design: A retrospective, single-center comparative study.
Methods: Patient data including demographics, ocular biometry, pre- and postoperative visual acuity, postoperative complications, primary (uncorrected distance visual acuity over time) and secondary visual outcomes (uncorrected near visual acuity, best distance visual acuity, patient complaints, satisfaction, and postoperative surgery) were gathered and statistically analyzed. Demographic differences between patients receiving femtosecond-laser assisted cataract surgery (FLACS) versus standard phacoemulsification cataract surgery (PCS) were corrected for outcome comparison. Safety, efficacy, predictability, and stability were analyzed for each procedure and compared.
Results: A total of 155 eyes in PCS and 143 eyes in FLACS were analyzed at 1 week, 3 months, and 1 year using odds ratio. The odds ratio of being 20/20 or better and 20/40 or better at the specified time periods were similar and statistically insignificant at all time periods analyzed except 20/20 or better for uncorrected distance visual acuity (UDVA) at 1 year (p=0.0001) and uncorrected near visual acuity (UNVA) at 1 week (p=0.02). In both cases, the odds of being 20/20 or better favored FLACS. Mean UDVA, UNVA, and best distance visual acuity (BDVA) were all similar and statistically insignificant between the two groups. Postoperative patient complaints, safety, efficacy, predictability, and stability between the two groups showed no statistical significance.
Conclusion: Despite the odds ratio of being 20/20 or better favoring FLACS for UDVA at 1 year and UNVA at 1 week, the mean logMAR UDVA, BDVA, and UNVA were similar and statistically insignificant between the FLACS and PCS groups at 1 week, 3 months, and 1 year. Differences in visual acuity were likely due to differences other than surgical approaches. While both FLACS and PCS are appropriate approaches to cataract surgery, one does not appear to be superior when assessing longitudinal markers for visual acuity, safety, efficacy, predictability and stability.
Keywords: cataract surgery, cataracts, femtosecond-laser assisted cataract surgery, phacoemulsification cataract surgery, uncorrected distance visual acuity, best distance visual acuity, uncorrected near visual acuity
Introduction
Cataract surgery is heralded as one of the most effective surgeries in medicine, allowing for increased visual acuity and improved quality of life. A cataract is an opacification of the natural crystalline lens, usually caused by multifactorial processes during aging1 and from medication side effects, infections, family history, and metabolic syndromes such as galactosemia. Visual impairment is the leading cause of falls in adulthood, and the restoration of vision reduces the associated high morbidity and mortality.2 Moreover, cataracts are the leading cause of blindness worldwide, with estimates that 50 million people in the United States will have cataracts by 2050.3,4 This rising global prevalence of cataracts makes developing a widely accessible, effective, low-risk, and cost-effective treatment method vital.
The treatment of cataracts has evolved from couching in the fifth century BC, where the cataract was displaced from the visual pathway to today’s standard of care, standard phacoemulsification cataract surgery (PCS).5 Technological advancements have allowed for the use of femtosecond lasers in cataract removal, first in laser in-situ keratomileusis (LASIK) and later in cataract surgery in 2008. It was hypothesized that femtosecond lasers would have a lower energy discharge than phacoemulsification cataract surgery due to their short pulse times (10−15 s) with more precise cuts.5 However, femtosecond laser-assisted cataract surgery (FLACS) only automates the initial steps of cataract surgery like clear corneal incision, capsulotomy, and lens nucleus fragmentation.6 The ensuing steps of phacoemulsification and insertion of the lens are completed as in PCS.
With continued technological advancements in cataract surgery, risk and benefit assessments of these technologies are necessary to guide clinicians and patients when deciding on surgical options. Consequently, this study aimed to assess differences in patient outcomes between traditional PCS and FLACS over time and provide quantitative and clinically relevant guidance for clinicians and patients. Although numerous studies have reported the differences in outcome between these procedures, there remains a paucity of reporting on patient outcomes at different postoperative time intervals.
Methods
Study Design
A retrospective comparative study was performed using data collected from patient chart review at a single tertiary refractive surgical center. Data were collected from 350 patients (592 eyes) who underwent phacoemulsification cataract extraction by one of four experienced surgeons with or without femtosecond laser assistance between January 1, 2018 and January 1, 2021. A total of 294 eyes were excluded using Microsoft Excel (365) to ensure preoperative equivalence in ocular biometry, keratometry, and operative planning, including type of intraocular lens to be implanted, for both groups (Table 1). A total of 298 eyes (155 eyes in PCS, 143 eyes in FLACS) were subsequently analyzed. Exclusion criteria included age less than 25 years old, a history of retinal disease, corneal disease, glaucoma, eye trauma, cerebrovascular accidents affecting vision, degenerative eye disorders, amblyopia, refractive surgery, use of ocular medications affecting vision, and perioperative complications.
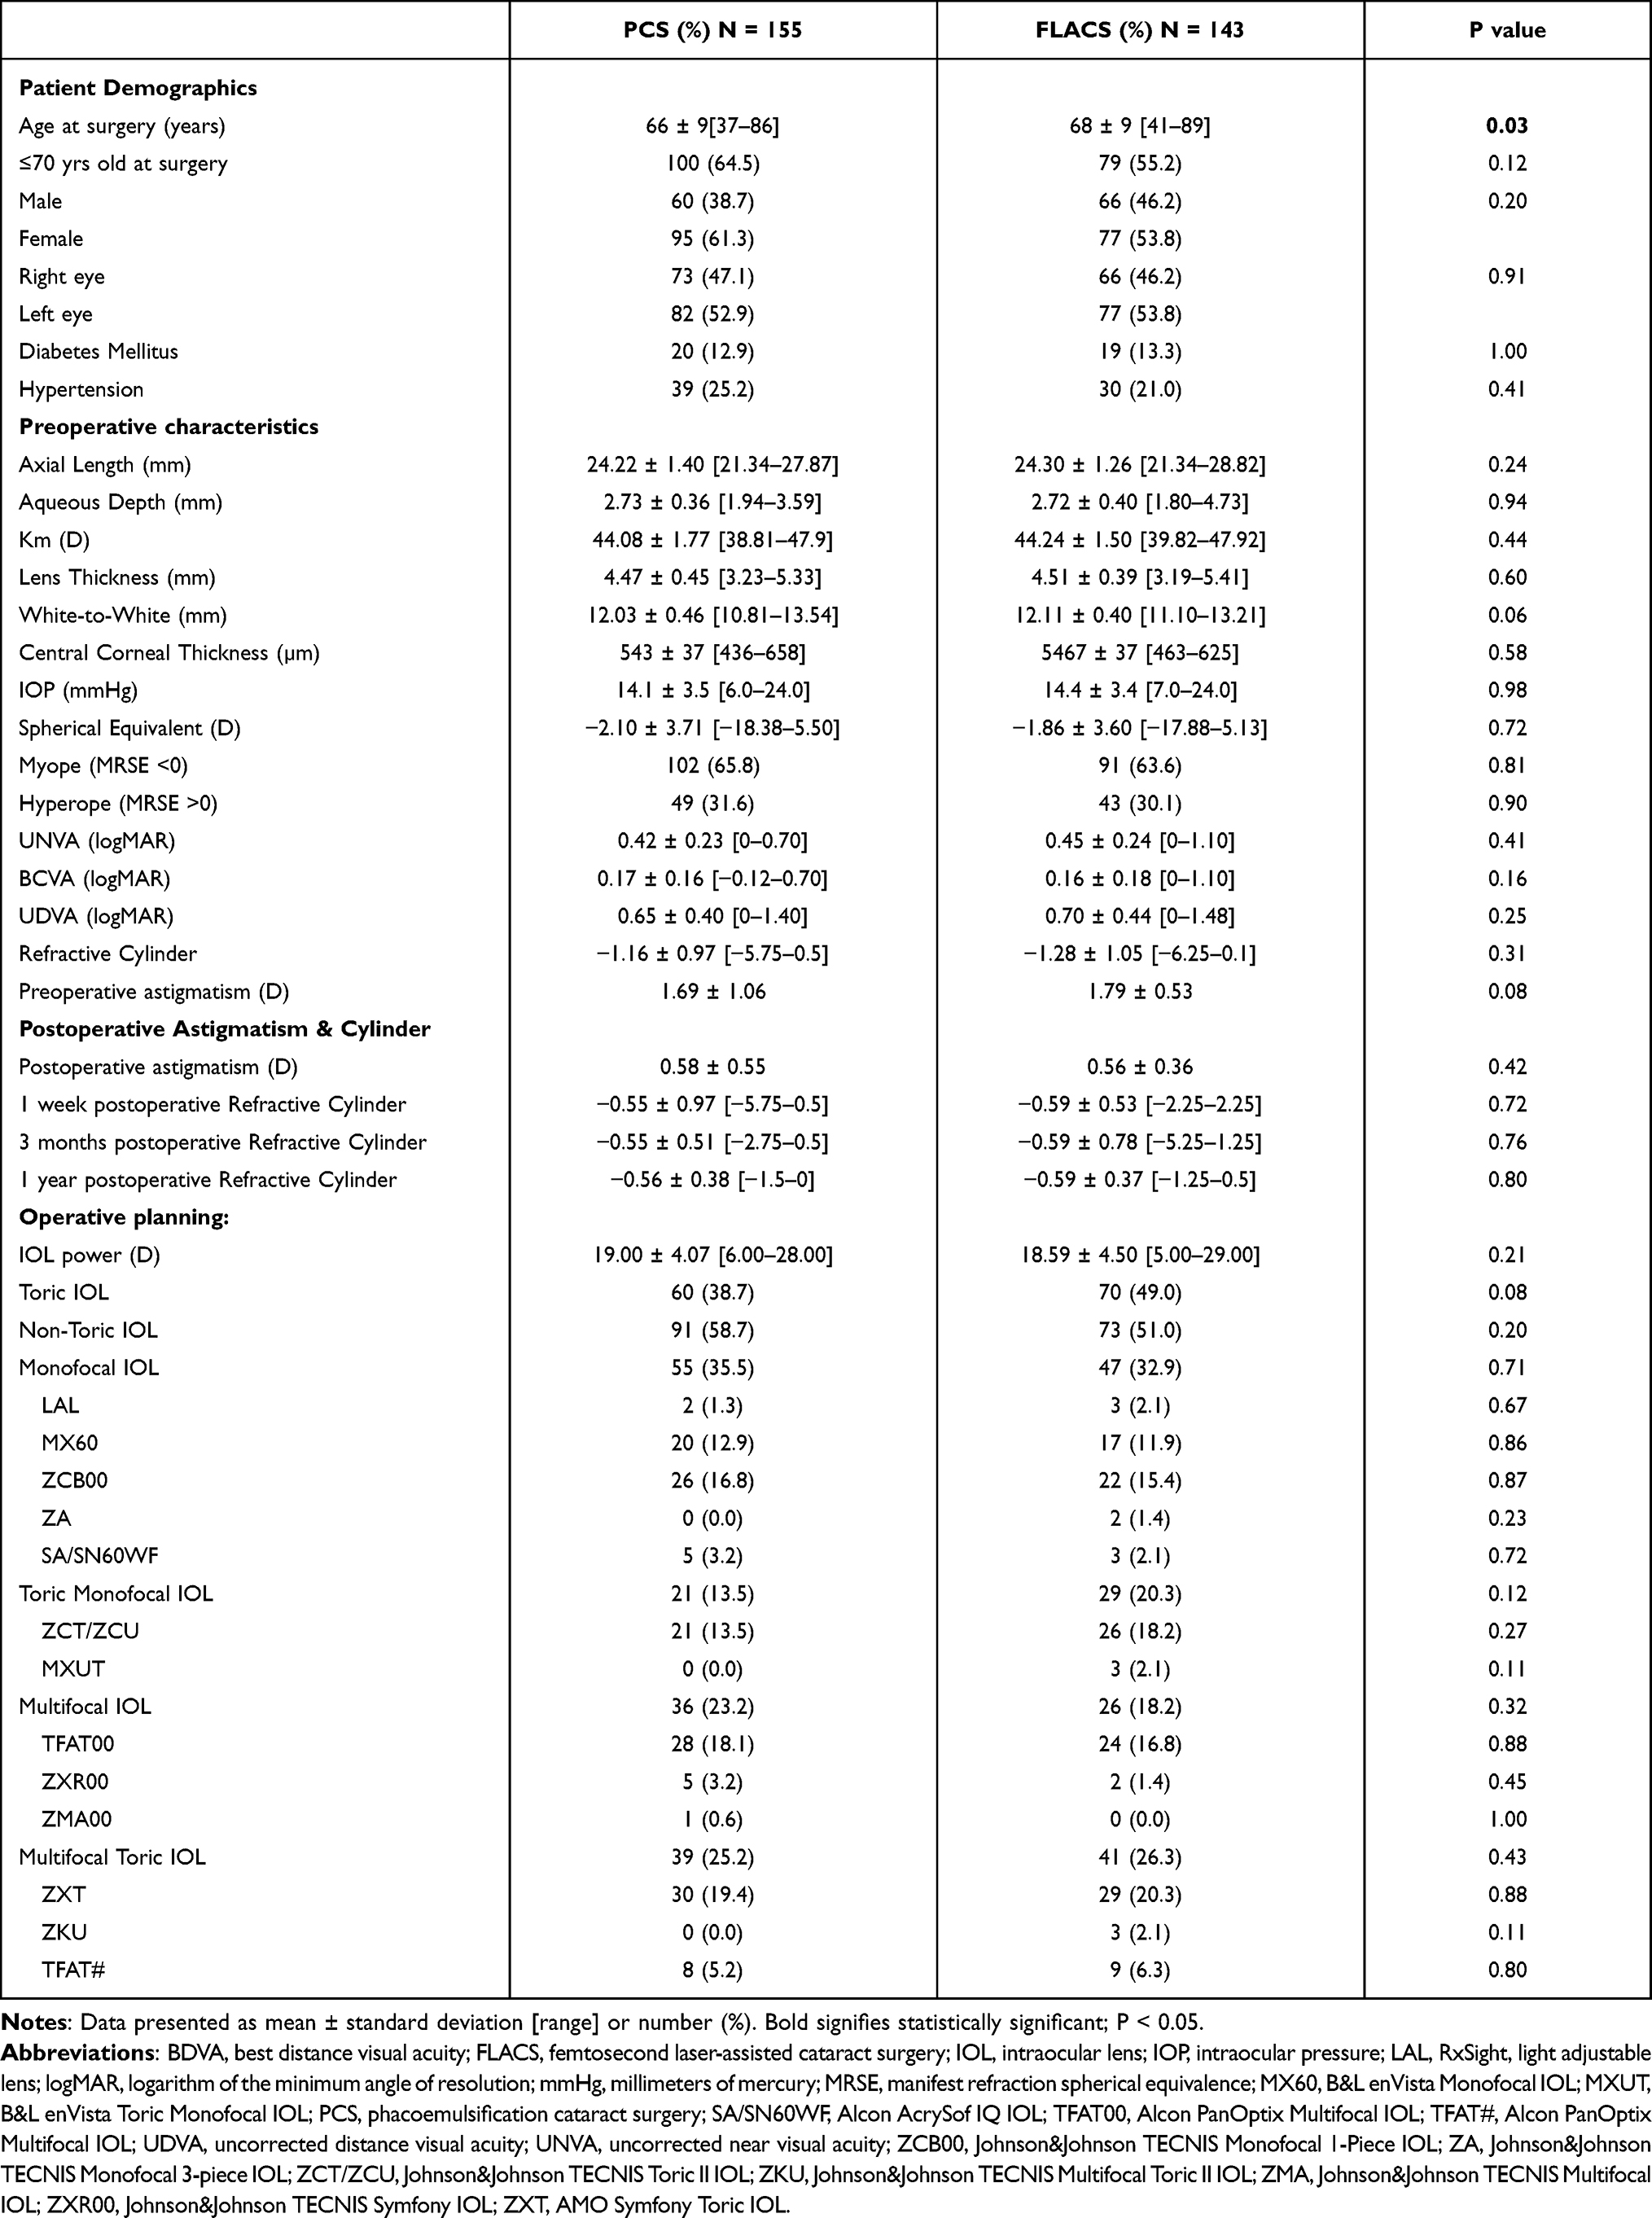 |
Table 1 Baseline Demographics |
The primary visual outcome was UDVA at 1 week, 3 months, and 1 year post-cataract surgery. The secondary visual outcomes include BDVA and UNVA also at 1 week, 3 months, and 1 year postoperatively, patient complaints, satisfaction, complications, and time in the operating room. Safety, efficacy, predictability, and stability were analyzed and compared between the two different approaches. We also collected patient demographics, ocular biometry and keratometry, and operative planning preoperatively and postoperatively at one day, one week, one month, three months, six months, one year, and two years. Biometry and keratometry were obtained from either Lenstar LS 900 (Haag-Streit AG, Koniz, Switzerland/Alcon Laboratories Inc., Ft. Worth, TX, USA) or IOLMaster 700 (Carl Zeiss Meditec USA, Inc., Dublin, CA, USA).
Surgical Procedure
The surgeons performed a manual 2.75 mm clear corneal incision at the 180 degrees meridian in the temporal area. A Surgical Induced Astigmatism (SIA) of 0.1 was used for all surgeons. Duovisc (Alcon) was the viscoelastic of choice. This was followed by a 5.0–5.5 mm continuous curvilinear capsulorhexis. Phacoemulsification was performed in a horizontal chop or divide-and-conquer fashion using the Infiniti Vision System (Alcon Laboratories, Inc. Fort Worth, TX). Manual clear corneal incisions were performed in both PCS and FLACS. All wounds were confirmed to be self-sealing, and no capsulotomy complications occurred in either FLACS or PCS.
After surgery, third- or fourth-generation fluoroquinolone antibiotic eye drops were used four times daily for one week. Patients were also started on a topical steroid four times daily and tapered weekly over one month. A topical NSAID eye drop was used twice daily for six weeks.
Patients undergoing FLACS were treated with the CATALYS femtosecond laser system (Precision Lens, Bloomington, MN). The femtosecond was used for capsulorhexis and nuclear fragmentation but not for the corneal incision. The corneal incision was made manually. The capsulotomy used 4.0 μJ of pulse energy. For fragmentation, anterior pulse energy was 8.0 μJ and posterior pulse energy was 10.0 μJ. A 5.0 mm capsulotomy centered on the scanned capsule was performed, followed by lens fragmentation into quadrants with or without softening. Arcuate keratotomy incisions on the steep axis of astigmatism were performed in patients with greater than 0.8 diopters (D) of astigmatism according to the Nichiman nomogram. Following the clear corneal incision, the anterior capsular tissue was removed with utrata forceps. Phacoemulsification was performed in a divide-and-conquer fashion using the WhiteStar Signature phacoemulsification system (Advanced Medical Optics Inc, Inc. Santa Ana, CA). The remainder of the procedure and postoperative care was the same as described for PCS above. No patients undergoing FLACS had capsulotomy complications.
For 0.75 D or less of Against-the-rule (ATR) astigmatism and 1.00 D or less of With-the-rule (WTR) astigmatism, we chose LRI with conventional IOL performing standard phaco or FLACS. LRI was based on the Nichiman nomogram. For 1.00 D or greater ATR and 1.25 D or greater WTR, we chose Toric IOL.
Patient Outcome Indicators
The primary visual outcomes studied were uncorrected distance visual acuity (UDVA), uncorrected near visual acuity (UNVA), and best distance visual acuity (BDVA) at 1 week, 3 months, and 1 year post-cataract surgery. All patients targeted for monovision were excluded from UNVA analysis, and anyone with a targeted distance correction less than −0.5 D was excluded from UDVA analysis. UNVA was measured at 40 cm using a standard vision chart and recorded on a Jaeger scale. All Jaeger data points were converted to Snellen units using a standard conversion chart, and visual data were converted to logMAR for statistical analysis using a conversion formula.7 Secondary visual outcomes included dysphotopsias, dry eyes, photophobia, night vision complaints, postoperative surgery due to complications, and patient satisfaction. Operating room time was also recorded and compared between the PCS and FLACS groups.
Vector Analysis
Vector analysis was performed on eyes with an implanted toric intraocular lens (IOL) and had refractive data at their 3-month postoperative visit (63 eyes). The indication for toric IOL placement was total corneal astigmatism of greater than 0.8 D on preoperative measurements. Incision location and IOL power were included in the data for analysis. Postoperative refraction was collected from patient charts at their one-month postoperative visit. IOL power was chosen to target the manufacturer’s recommended predicted postoperative spherical equivalent (Table 1).
All data required for the vector analysis was entered into the American Society of Cataract and Refractive Surgery astigmatism double-angle plot tool. Data was organized and presented according to the method proposed by Abulafia et al.8
Other analyses included predictability, stability, safety and efficacy indices. The Safety index was determined by dividing BDVA before treatment by BDVA after treatment. The efficacy index was defined as UDVA after treatment divided by BDVA before treatment. Stability was determined by comparison of pre- and postoperative spherical equivalent. Predictability was defined as the number of patients within 0.5 D and 1.0 D of the target spherical equivalence.
Statistical Analysis
Statistical analyses were performed using Microsoft Excel (365) and R (R version 4.1.0, Vienna, Austria). The Shapiro–Wilk test was used to check for normality of the sample distribution. A t-test was performed for normally distributed data points, while a nonparametric Wilcoxon test was used for non-normal data distribution. When appropriate, the Chi-squared or Fischer’s exact test was used for categorical variables. An odds ratio with a 95% confidence interval was applied in applicable comparisons between the two groups.
Results
Our study population included a total of 155 and 143 eyes that underwent cataract extraction via PCS and FLACS, respectively. Patient demographics (except for age at surgery), ocular biometry and keratometry, and implanted lens type were similar preoperatively between the two treatment groups (PCS and FLACS) (Table 1).
Visual Acuity
Postoperative outcomes in terms of mean UDVA, BDVA, and UNVA at the corresponding time intervals were comparable between the two treatment groups (Table 2).
 |
Table 2 Postoperative Mean UDVA (logMAR) |
The percentage of patients with 20/20 or better UDVA peaked at 3 months with 42% for PCS, while the FLACS group peaked at 1 year with 43%. Patients with UDVA of 20/40 or better ranged from 88–91% for PCS, whereas the FLACS group ranged from 92–96% over the period studied (Figure 1A and B).
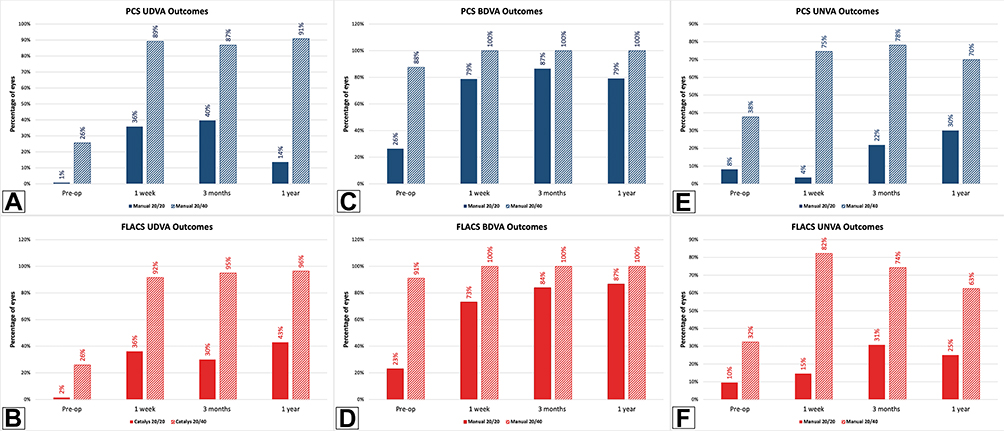 |
Figure 1 Patients 20/20 or better and 20/40 or better at 1 week, 3 months, and 1 year postoperatively. (A and B) Uncorrected distance visual acuity (UDVA) of 20/20 or better and 20/40 or better for PCS (A) and FLACS (B) patients preoperatively, 1 week, 3 months, and 1 year. Patients with target refractions not set to 0 D were removed. C-D: Best distance visual acuity (BDVA) of 20/20 or better and 20/40 or better for PCS (C) and FLACS (D) patients preoperatively, 1 week, 3 months, and 1 year. E-F: Uncorrected near visual acuity (UNVA) of 20/20 or better and 20/40 or better for PCS (E) and FLACS (F) patients preoperatively, 1 week, 3 months, and 1 year. All patients receiving monovision were excluded. |
Patients in the PCS group with UNVA 20/20 or better postoperatively increased with time from 4% at 1 week to 30% at 1 year. Patients undergoing FLACS rose from 15% to 31% from 1 week to 3 months, then decreased to 25% at 1 year (Figure 1C and D).
Patients with BDVA of 20/20 or better peaked at 3 months for the PCS group (87%), while the FLACS group peaked at 1 year (87%). Both groups had 100% of patients reporting with BDVA of 20/40 or better postoperatively (Figure 1E and F).
The odds ratio of having 20/40 or better UDVA at 1-year post-cataract surgery was greater in FLACS with a p-value of 0.0001, which was statistically significant. The odds ratio of having 20/20 or better UNVA at 1 week was found to be greater in FLACS with a p-value of 0.03, which was also statistically significant. All other odds ratios were nonsignificant and comparable between PCS and FLACS in UDVA, BDVA, and UNVA (Table 3).
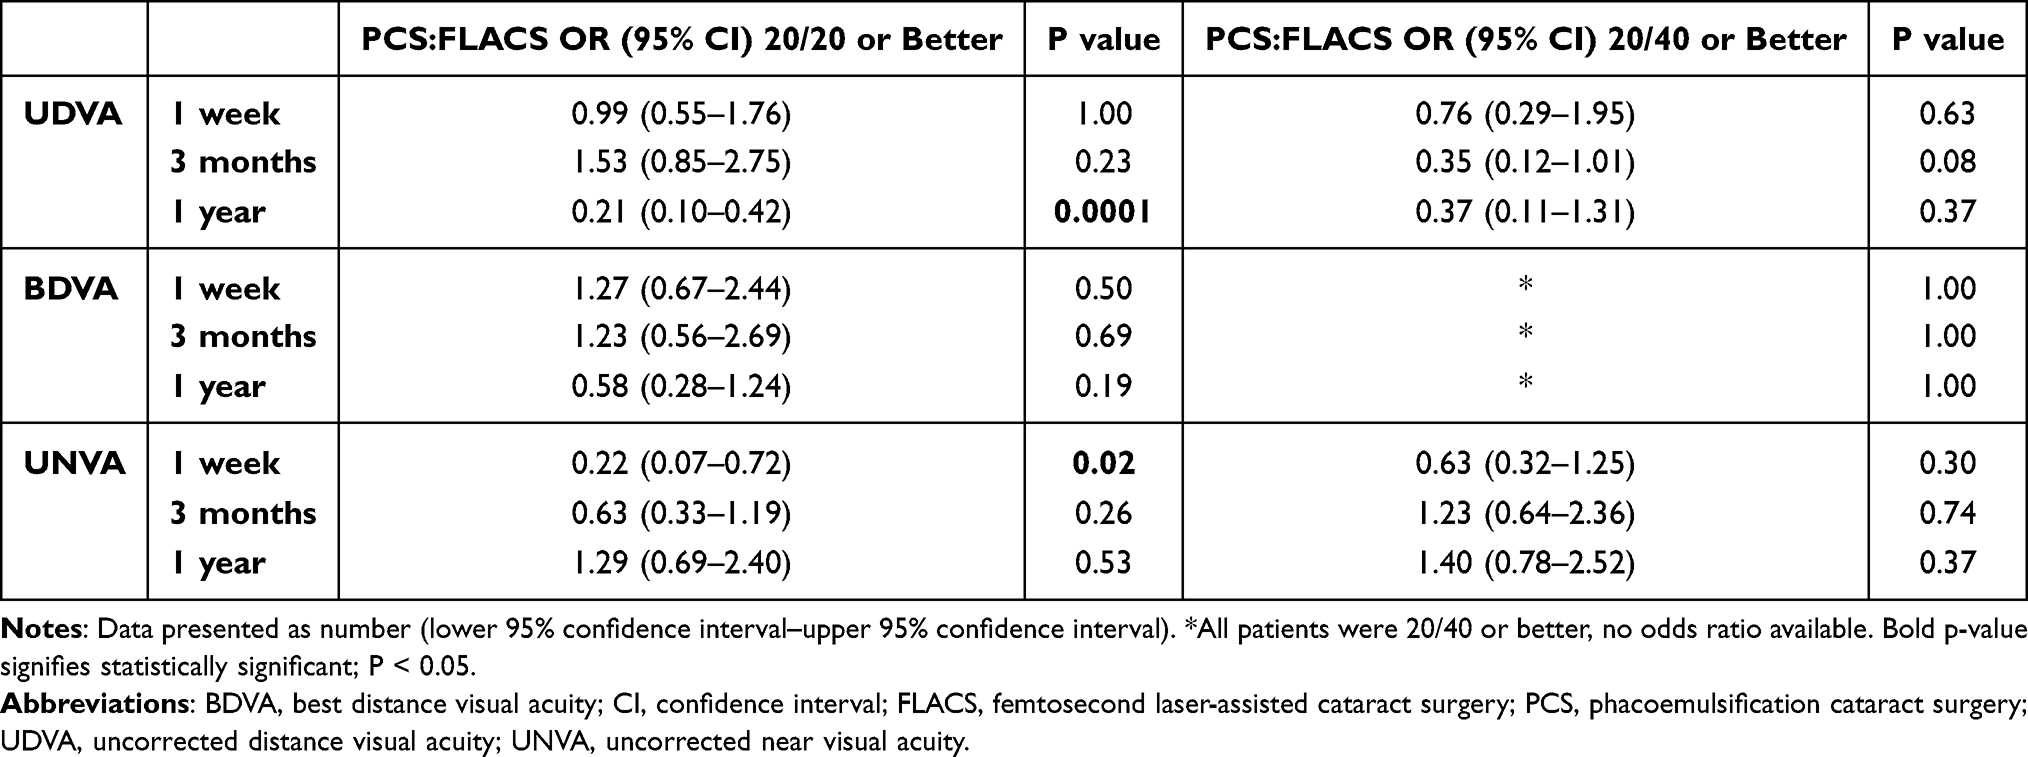 |
Table 3 Odds Ratio of UDVA |
The mean operating room time for PCS patients was 21 minutes ± 10 minutes with a range of 10–77 minutes, while the mean operating room time for FLACS patients was 17 minutes ± 6 minutes with a range of 8–55 minutes, excluding time spent at the CATALYS Femtosecond Laser system, with a p-value of 0.004.
UDVA and Efficacy Index
At three months postoperatively, 21 eyes (40%) of the PCS group and 19 eyes (32%) of the FLACS group achieved UDVA of 20/20 or better (p=0.49). Additionally, the Efficacy Index was 0.89 and 1.15 for PCS and FLACS groups, respectively (Figure 2).
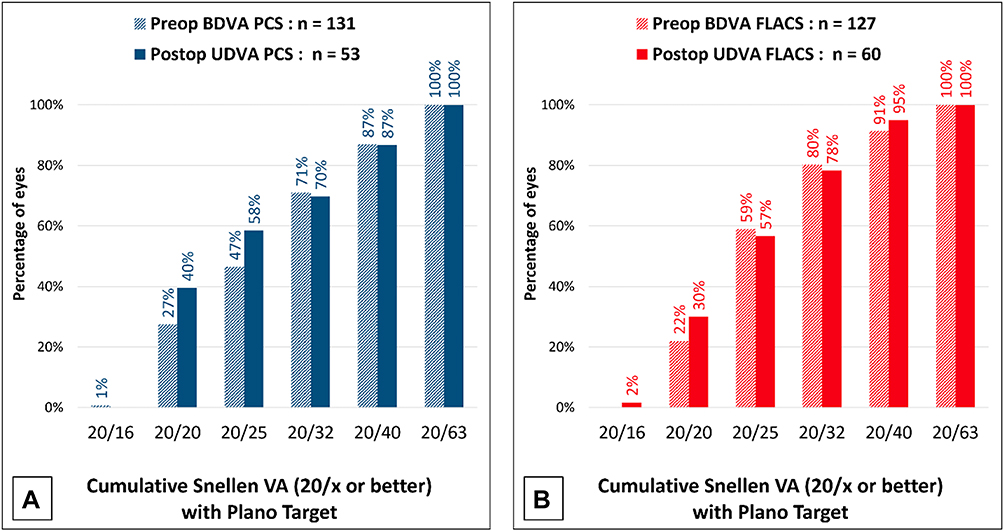 |
Figure 2 Percentage of patients with BDVA and UDVA of specific visual acuity at 3 months postoperative. (A) Comparison of PCS patients with preoperative BDVA and postoperative UDVA showing the percentage of patients presenting with 20/x visual acuity. All patients with target refractions not set to 0 D were removed from UDVA. (B) Comparison of FLACS patients with preoperative BDVA and postoperative UDVA showing the percentage of patients presenting with 20/x visual acuity. All patients' target refractions not set to 0 D were removed from UDVA. |
BDVA and Safety Index
The UDVA was the same or better than the preoperative BDVA in 37 (70%) eyes in the PCS group and 34 (57%) eyes in the FLACS group at three months (Figure 3A). One or two lines of BDVA were gained postoperatively in 37 (71%) eyes in the PCS group and 33 (64%) eyes in the FLACS group (p=0.21), though 28 (54%) eyes in the PCS group postoperatively improved their BDVA by two lines compared to 13 (25%) eyes in the FLACS group and was significantly different (p=0.001) (Figure 3B). The PCS and FLACS groups were not statistically different in the number of eyes with BDVA decreased by one line, with 5 (10%) and 1 (2%) eyes, respectively (p=0.16) (Figure 3B). The Safety Index for the PCS group was 0.11, while the 6.5 mm group had a Safety Index of 0.04 over the same postoperative timeframe.
 |
Figure 3 Comparison of Visual Outcomes including Safety, Stability, and Predictability. Comparison of visual acuity in 3 months postoperative UDVA with preoperative BDVA (A). All patients with target refractions not set to 0 D were removed from UDVA. Comparison of postoperative BDVA change in PCS versus FLACS patients (B). Comparison of spherical equivalent refraction accuracy in PCS versus FLACS patients at 3 months postoperative organized by accuracy to the intended target (C). Comparison of stability of spherical refraction in PCS versus FLACS patients at 3 months postoperative (D). |
Stability and Predictability
The PCS and FLACS groups showed predictable visual outcomes, demonstrated by UDVA at three months. The slopes of attempted versus achieved manifest refractive spherical equivalent (MRSE) were 1.06 and 0.98 for PCS and FLACS groups, respectively. At three months, PCS and FLACS had 32 (60%) and 38 (75%) eyes within 0.5 D of target MRSE (p=0.18), respectively, and 47 (89%) and 48 (94%) of eyes within 1.00 D of target MRSE (p=0.52), respectively (Figure 3C). Stability is demonstrated in Figure 3D, with 17% of eyes experiencing a change in MRSE > 0.5 D in the PCS group and 8% in the FLACS group.
Figure 4A–D show the preoperative and postoperative refractive astigmatism results for the PCS and FLACS groups. At three months, there was a prediction error ≤ 1.00 D in 50 (93%) and 50 (89%) of eyes for PCS and FLACS (p=0.78), respectively, and a prediction error ≤ 0.50 D in 34 (63%) and 36 (64%) of eyes for PCS and FLACS (p=1), respectively. The TIA and SIA at 3 months were 1.35 and 1.46 for PCS and 1.12 and 1.11 for FLACS (Figure 4C). The angle of error within 15° was 28% for the PCS group and 34% for the FLACS group (p=0.46) (Figure 4D).
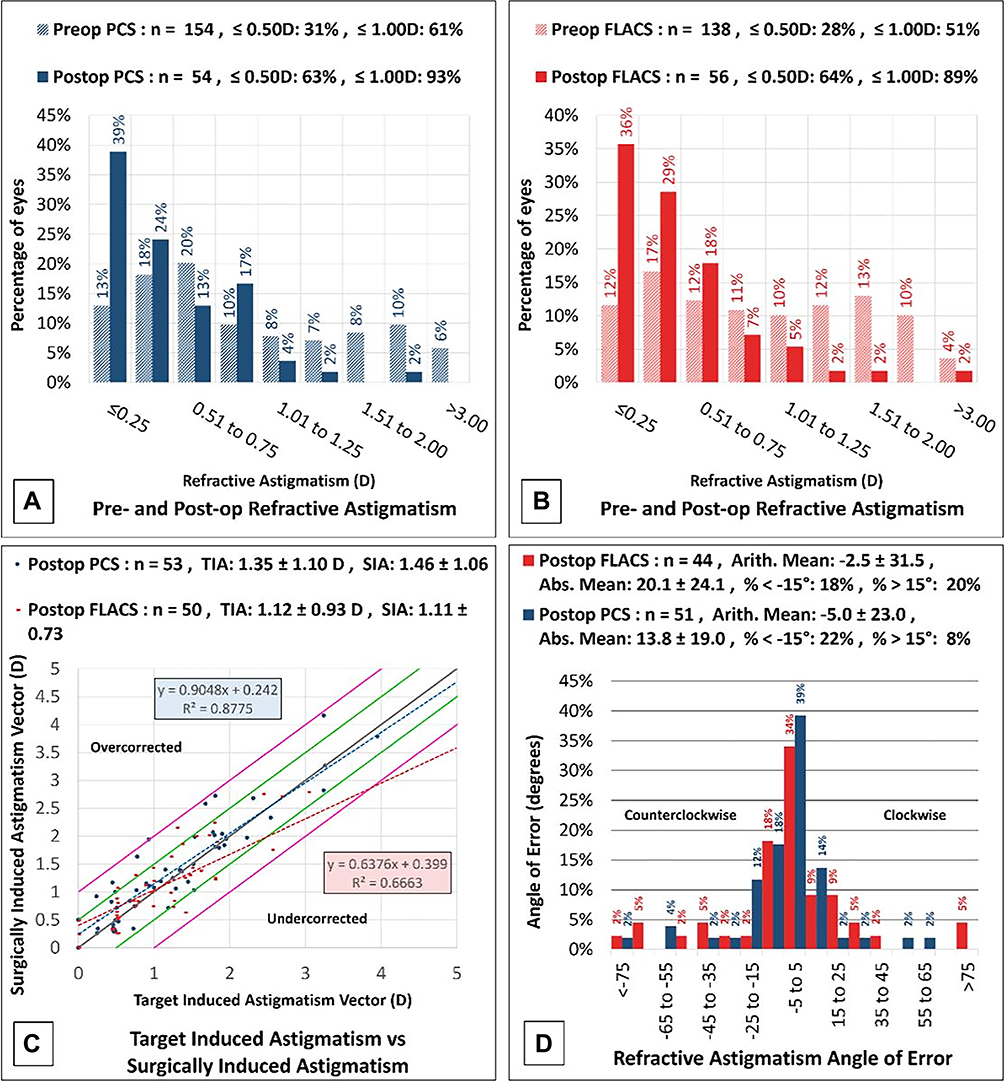 |
Figure 4 Astigmatic comparison. (A and B) Comparison of pre- and postoperative (3 months) refractive astigmatism in PCS patients (A) and FLACS patients (B). (C) Plot of target versus actual astigmatism in PCS versus FLACS patients at 3 months postoperatively. (D) Comparison of the astigmatic angle of error in PCS versus FLACS patients at 3 months postoperative. |
Vector Analysis
Figure 5 summarizes the preoperative and postoperative refractive astigmatism at 3 months in the PCS and FLACS groups. Patients with postoperative corneal astigmatism within 0.50 D was 68% and 56% with 81% and 88% within 1.0 D for PCS and FLACS respectively.
 |
Figure 5 Postoperative Refractive Astigmatism. Pre- and postoperative comparison of refractive astigmatism with the percentage of eyes in PCS (A) and FLACS (B). |
In the PCS group, the preoperative corneal astigmatism centroid was 0.68 D at 91 degrees ± 2.16 D. The centroid of postoperative refractive astigmatism was 0.19 D at 123 degrees ± 0.79 D (Figure 6A). The centroid represents the mean vector of astigmatism, and the ellipse represents one standard deviation around the centroid. Each ring on the graph represents 1.00 D. The ellipse decreased from ~4.00 D to ~1.00 D in both the postoperative corneal spectacle plane and corneal plane, indicating an improvement in astigmatism following surgery.
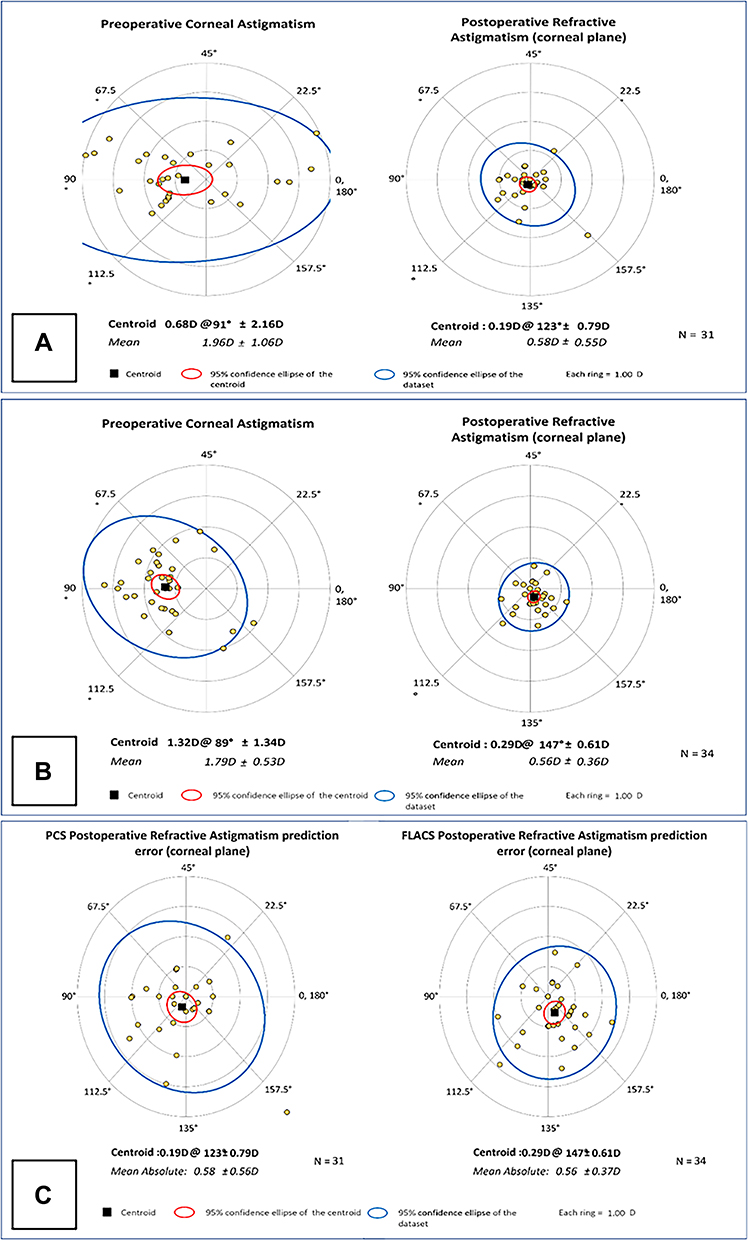 |
Figure 6 Vector Analysis and Prediction Error of Postoperative Refractive Astigmatism. Comparison of mean pre- and postoperative astigmatism in patients undergoing PCS (A) and FLACS (B) showing 95% confidence ellipse of dataset and centroid with an N value of 31. Comparison of postoperative refractive astigmatism prediction error in PCS and FLACS patients (C). |
In the FLACS group, the preoperative corneal astigmatism centroid was 1.32 D at 89 degrees ± 1.34 D. The centroid of postoperative refractive astigmatism was 0.29 D at 147 degrees ± 0.61 D (Figure 6B). The postoperative ellipse decreased in the postoperative corneal plane compared to the ellipse from the preoperative refractive astigmatism. The ellipse decreased from ~3.00 D to ~1.00 D. These findings indicate an improvement in astigmatism following surgery. The FLACS group had a predictive error ≤ 1.00 D in 88% of patients evaluated, while the PCS group had a predictive error ≤ 1.00 D in 81% of patients (Figure 6C).
Subjective Outcomes
In PCS and FLACS, 17 and 6 patients complained of photophobia preoperatively, respectively, with a p-value of 0.03; however, there was no significant difference postoperatively. There was no statistical difference between the number of patients undergoing Neodymium Yag (Nd:YAG) laser capsulotomy within 3 months and 1 year of cataract surgery. Patients undergoing limbal relaxing incision (LRI) were 0 and 6 (PCS and FLACS) with a p-value of 0.01.
At 1 month, 11% of the PCS and 10% of the FLACS patients expressed satisfaction with their vision (p=0.68). At 3 months, there were 12% and 6% respectively (p=0.38); and at 1 year 15% and 12% (p=1.00) expressed satisfaction (Table 4).
 |
Table 4 Postoperative Patient Complaints and Complications |
Discussion
Improved visual acuity is the main objective of cataract surgery. Other studies in the literature focused on determining if visual acuity outcomes are different in phacoemulsification versus femtosecond laser-assisted cataract surgery. In an analysis of 1838 eyes, Berk et al found no statistical significance in visual outcomes between the two groups at 3 weeks post-cataract surgery.9 Another study of 1476 eyes analyzed BDVA at 3 months postoperatively with similar results.10 To our knowledge, no studies have compared postoperative visual acuity at multiple time intervals in patients undergoing FLACS versus PCS. Although our study had a smaller sample size than other similar studies, our study ensured that all patients in both groups were preoperatively similar in ocular biometry, keratometry, operative planning and implanted lens, which many other studies did not consider. The analysis included visual acuity at 1 week, 3 months, and 1 year postoperatively, with a particular emphasis on 3 months.
Similar to other studies analyzing visual acuity at one point in time,9,10 our results showed mean UDVA, UNVA, and BDVA at 1 week, 3 months, and 1 year were statistically similar. However, our study also found the odds ratio of 20/20 or better UNVA and UDVA at 1 week and 1 year, respectively, was greater in FLACS. The p-value for UDVA at 1 year had a value of 0.0001, with an odds ratio of 0.21 (PCS versus FLACS), favoring FLACS (Table 3). The mean UDVA at the same period (1 year postoperatively) was 0.19 ± 0.14 logMAR for PCS and 0.12 ± 0.12 for FLACS with a p-value of 0.09. It should be noted that the sample size at 1 year significantly dropped from 53 and 60 (PCS and FLACS) at 3 months to 22 and 28. Patients lost to follow-up can create bias in the data, and this should be taken into consideration. The difference in patients with UNVA 20/20 or better at 1 week had a p-value of 0.02 and an odds ratio of 0.22 (PCS versus FLACS), also favoring the FLACS group (Table 3). Despite this significant value, the mean UNVA for PCS and FLACS was 0.25 ± 0.18 and 0.26 ± 0.18 logMAR, respectively, with an insignificant p-value of 0.72. Additionally, the number of patients presenting with 20/20 or better UNVA at 1 week for the two groups was 2 out of 55 in PCS and 9 out of 62 in FLACS.
The efficacy and safety indices were comparable between the two groups with good predictability. While the p-values of stability were insignificant, the FLACS group did have fewer patients with MRSE > 0.5 D than the patients undergoing PCS (8% versus 17% respectively). Comparing preoperative to postoperative BDVA at 3 months demonstrated a significant difference in the improvement of 2 lines on the Snellen chart, favoring patients in the PCS group (p=0.001). As discussed earlier, it has been hypothesized that FLACS may cause decreased damage to the eye in general due to lower energy discharge,5 which may lead to a difference in healing times. With such small numbers, it is difficult to draw any conclusions with certainty. Additionally, distance is more commonly used as a standard of visual acuity, and more studies should be done with a larger sample size to confirm or reject these findings.
The femtosecond laser automated the four initial manual steps performed in cataract surgery.6 It was postulated that lasers would augment nuclear fragmentation while reducing the energy needed in PCS. In particular, PCS using thermal energy for nuclear fragmentation can cause injury to the surrounding structures, such as the corneal endothelium.11,12 Although the theoretical benefit of reducing the phacoemulsification energy to surrounding structures indicates reduced cellular damage, multiple studies have found conflicting results regarding the effectiveness of FLACS in this aspect.13–15 Some studies have found reduced cellular damage in FLACS compared to non-assisted PCS, whereas other studies have found no differences.13–15 FLACS has shown promising results when utilized in complex cataracts such as subluxated cataracts.16 Our study found no statistical difference between the PCS and FLACS groups in the numbers of patients undergoing surgery following their initial cataract surgery, except for those undergoing limbal relaxing incision (LRI). LRI is a surgical procedure in which incisions are made in the cornea to correct for astigmatism. The other option for astigmatism correction is the implantation of a toric lens. One study found differences in outcomes between the use of LRI versus toric lens. However, they concluded that it was probably clinically insignificant.17 Although the p-value was statistically insignificant, the FLACS group had more patients receiving toric lenses (70 versus 60 in the PCS group; see Table 1). Patients undergoing FLACS may be more likely to pay for astigmatism correction than those undergoing PCS; it cannot be concluded with any degree of certainty that the greater number of LRI surgeries in the FLACS group is linked to cataract surgery via PCS versus FLACS.
The adoption of FLACS in clinical practice is based on its equivalence or superiority to the traditional PCS and the financial opportunities associated with the use of cutting-edge technology.6,18 Although the implementation of FLACS has economic benefits and marketing opportunities, clinicians should also consider the disrupted flow of the surgical process and increased procedure time.19–21 The economics of cataract surgery are highly dependent on case volume and reduction in efficiency renders the adoption of FLACS a precarious decision. Our study found the safety index (0.11 for PCS and 0.04 for FLACS) and the efficacy index (0.89 for PCS and 1.15 for FLACS) to be similar between the two groups, making it difficult to justify additional expenses for certain patient populations. Although we found that the average time spent in the operating room for PCS patients was 4 minutes longer than FLACS (p=0.005), this did not include the time spent at the femtosecond laser. This finding is consistent with previous studies that found reduced operation duration for FLACS compared to PCS.22,23 We must note that in our clinical practice, the total time for cataract surgery is higher in the FLACS group, consistent with previous studies.22,23 Moreover, operating room time is subject to differences in surgeon preferences, available staff, and other outside factors that can influence the surgery’s flow and duration.
There are limitations in this report. Retrospective studies, in general, can be subject to selection bias and may not necessarily represent the general population, and our study is no exception. This was a single site study with a relatively small sample size. Larger sample sizes from multiple sites could lead to more precise results. Although the mean age at surgery, standard deviation, and range of the two groups was very similar, it had a p-value of 0.03. Our study also included patients operated on by four surgeons, two of whom used the Infiniti Vision System (using either horizontal chop or divide-and-conquer approach) while the other two used the WhiteStar Signature (using a divide-and-conquer method) for phacoemulsification. Although all are experienced and highly skilled, differences in technique and systems can play a role in outcomes, both subjective and objective. Roberts et al noted higher rupture rates of the posterior capsule in PCS patients however, the factors of centration and size of the capsulotomies were not compared because data was incomplete.14 These factors may spell a difference, especially for beginning surgeons. Furthermore, although we tried to make sure that both groups’ astigmatism were corrected to the best possible extent, there could be a confounding bias for the FLACS group because of the higher patient and doctor expectations from the use of the FLACS procedure.
The patient background of the PCS and FLACS groups also plays a role in the subjective findings, such as patient complaints and satisfaction. Patient satisfaction was also not explicitly asked for each patient and was documented if the patient expressed unprompted satisfaction to the technician. Patients of a certain socioeconomic status may be more or less likely to elect for surgery via FLACS over PCS, which may have subsequently influenced whether patients voiced notable improvement, complaints of continued visual limitations, or satisfaction. Ideally, all patients included in the study would be preoperatively screened on a demographic, socioeconomic, and operative planning level, randomly divided equally among the surgeons, and followed at the 1 week, 3 months, and 1-year periods with patient satisfaction surveys distributed.
In conclusion, mean visual acuity outcomes were similar between the two groups at 1 week, 3 months, and 1 year postoperatively, with slightly greater chances—but statistically insignificant differences—of 20/20 or better vision in PCS versus FLACS patients depending on the time period. The FLACS group resulted in more patients with 20/20 or better UNVA at 1 week and UDVA at 1 year, despite having statistically insignificant differences between mean UNVA and UDVA over these intervals. Safety, efficacy, stability, and predictability were all comparable between the two groups and statistically insignificant. BDVA improvement by two lines was greater in PCS compared to FLACS, and was statistically significant. These findings may have been due to a small sample size, loss of patients to follow-up, or other factors. Notwithstanding, this trend found in our study may warrant further investigation with larger sample sizes. Our study supports the findings of numerous other studies, adding the knowledge that the visual acuity over time remained similar between the two groups.
Consent
This retrospective study using de-identified data has been approved by the Hoopes Vision Ethics Board and BRANY IRB #20-12-547-823 (New York). The study conforms with the Helsinki Declaration of 1964, as revised in 2013, concerning human and animal rights. The patients signed informed consent.
Acknowledgment
We thank Dr. Michael Bradley of Hoopes Vision Research Center for his patients’ surgical and outcomes data.
Author Contributions
All authors made a significant contribution to the work reported, whether that is in the conception, study design, execution, acquisition of data, analysis and interpretation, or in all these areas; took part in drafting, revising or critically reviewing the article; gave final approval of the version to be published; have agreed on the journal to which the article has been submitted; and agree to be accountable for all aspects of the work.
Funding
This study was funded by an unrestricted grant from Research to Prevent Blindness (RPB), 360 Lexington Avenue, 22nd Floor New York, NY 10017. No support was received for the publication of this article.
Disclosure
Dr Phillip C Hoopes Jr reports Medical Advisory Board for RxSight, outside the submitted work. The authors report no other conflicts of interest in this work.
References
1. Petrash JM. Aging and age-related diseases of the ocular lens and vitreous body. Invest Ophthalmol Vis Sci. 2013;54(14). doi:10.1167/IOVS.13-12940
2. Crandall M, Duncan T, Mallat A, et al. Prevention of fall-related injuries in the elderly: an Eastern Association for the surgery of trauma practice management guideline. J Trauma Acute Care Surg. 2016;81(1):196–206. doi:10.1097/TA.0000000000001025
3. Cataract Data and Statistics. National Eye Institute. Available from: https://www.nei.nih.gov/learn-about-eye-health/resources-for-health-educators/eye-health-data-and-statistics/cataract-data-and-statistics.
4. Common Eye Disorders and Diseases. CDC. Available from: https://www.cdc.gov/visionhealth/basics/ced/index.html.
5. Davis G. The evolution of cataract surgery. Mo Med. 2016;113(1):58–62. doi:10.1097/apo.0b013e31829df4bf
6. Roberts HW, Day AC, O’Brart DPS. Femtosecond laser–assisted cataract surgery: a review. Eur J Ophthalmol. 2020;30(3):417–429. doi:10.1177/1120672119893291
7. Holladay JT. Proper method for calculating average visual acuity. J Refract Surg. 1997;13(4):388–391. doi:10.3928/1081-597X-19970701-16
8. Abulafia A, Barrett GD, Koch DD, Wang L, Assia EI. Protocols for studies of intraocular lens formula accuracy. Am J Ophthalmol. 2016;164:149–150. doi:10.1016/j.ajo.2016.01.010
9. Berk TA, Schlenker MB, Campos-Möller X, Pereira AM, Ahmed IIK. Visual and refractive outcomes in manual versus femtosecond laser–assisted cataract surgery: a single-center retrospective cohort analysis of 1838 eyes. Ophthalmology. 2018;125(8):1172–1180. doi:10.1016/j.ophtha.2018.01.028
10. Schweitzer C, Brezin A, Cochener B, et al. Femtosecond laser-assisted versus phacoemulsification cataract surgery (FEMCAT): a multicentre participant-masked randomised superiority and cost-effectiveness trial. Lancet. 2020;395(10219):212–224. doi:10.1016/S0140-6736(19)32481-X
11. Murano N, Ishizaki M, Sato S, Fukuda Y, Takahashi H. Corneal endothelial cell damage by free radicals associated with ultrasound oscillation. Arch Ophthalmol (Chicago, Ill 1960). 2008;126(6):816–821. doi:10.1001/ARCHOPHT.126.6.816
12. Shin YJ, Nishi Y, Engler C, et al. The effect of phacoemulsification energy on the redox state of cultured human corneal endothelial cells. Arch Ophthalmol (Chicago, Ill 1960). 2009;127(4):435–441. doi:10.1001/ARCHOPHTHALMOL.2009.39
13. Dzhaber D, Mustafa O, Alsaleh F, Mihailovic A, Daoud YJ. Comparison of changes in corneal endothelial cell density and central corneal thickness between conventional and femtosecond laser-assisted cataract surgery: a randomised, controlled clinical trial. Br J Ophthalmol. 2020;104(2):225–229. doi:10.1136/BJOPHTHALMOL-2018-313723
14. Roberts HW, Wagh VK, Sullivan DL, et al. A randomized controlled trial comparing femtosecond laser–assisted cataract surgery versus conventional phacoemulsification surgery. J Cataract Refract Surg. 2019;45(1):11–20. doi:10.1016/j.jcrs.2018.08.033
15. Hida WT, Tzelikis PF, Vilar C. Outcomes study between femtosecond laser-assisted cataract surgery and conventional phacoemulsification surgery using an active fluidics system. Clin Ophthalmol. 2017;11:1735–1739. doi:10.2147/OPTH.S136136
16. Chee S-P, Wong MHY, Jap A. Management of severely subluxated cataracts using femtosecond laser-assisted cataract surgery. Am J Ophthalmol. 2017;173:7–15. doi:10.1016/J.AJO.2016.09.021
17. Lake JC, Victor G, Clare G, Porfírio GJ, Kernohan A, Evans JR. Toric intraocular lens versus limbal relaxing incisions for corneal astigmatism after phacoemulsification. Cochrane Database Syst Rev. 2019;12(12). doi:10.1002/14651858.CD012801.PUB2
18. Bartlett JD, Miller KM. The economics of femtosecond laser-assisted cataract surgery. Curr Opin Ophthalmol. 2016;27(1):76–81. doi:10.1097/ICU.0000000000000219
19. Abell RG, Vote BJ. Cost-effectiveness of femtosecond laser-assisted cataract surgery versus phacoemulsification cataract surgery. Ophthalmology. 2014;121(1):10–16. doi:10.1016/J.OPHTHA.2013.07.056
20. Lubahn JG, Donaldson KE, Culbertson WW, Yoo SH. Operating times of experienced cataract surgeons beginning femtosecond laser-assisted cataract surgery. J Cataract Refract Surg. 2014;40(11):1773–1776. doi:10.1016/J.JCRS.2014.03.024
21. Grewal DS, Dalal RR, Jun S, Chou J, Basti S. Impact of the learning curve on intraoperative surgical time in femtosecond laser-assisted cataract surgery. J Refract Surg. 2016;32(5):311–317. doi:10.3928/1081597X-20160217-02
22. Roberts HW, Ni MZ, O’Brart DP. Financial modelling of femtosecond laser-assisted cataract surgery within the National Health Service using a “hub and spoke” model for the delivery of high-volume cataract surgery. BMJ Open. 2017;7(3). doi:10.1136/BMJOPEN-2016-013616
23. Roberts HW, Wagh VK, Mullens IJM, Borsci S, Ni MZ, O’Brart DPS. Evaluation of a hub-and-spoke model for the delivery of femtosecond laser-assisted cataract surgery within the context of a large randomised controlled trial. Br J Ophthalmol. 2018;102(11):1556–1563. doi:10.1136/BJOPHTHALMOL-2017-311319
 © 2021 The Author(s). This work is published and licensed by Dove Medical Press Limited. The
full terms of this license are available at https://www.dovepress.com/terms
and incorporate the Creative Commons Attribution
- Non Commercial (unported, 3.0) License.
By accessing the work you hereby accept the Terms. Non-commercial uses of the work are permitted
without any further permission from Dove Medical Press Limited, provided the work is properly
attributed. For permission for commercial use of this work, please see paragraphs 4.2 and 5 of our Terms.
© 2021 The Author(s). This work is published and licensed by Dove Medical Press Limited. The
full terms of this license are available at https://www.dovepress.com/terms
and incorporate the Creative Commons Attribution
- Non Commercial (unported, 3.0) License.
By accessing the work you hereby accept the Terms. Non-commercial uses of the work are permitted
without any further permission from Dove Medical Press Limited, provided the work is properly
attributed. For permission for commercial use of this work, please see paragraphs 4.2 and 5 of our Terms.