Back to Journals » International Journal of General Medicine » Volume 14
A Novel Tool for the Risk Assessment and Personalized Chemo-/Immunotherapy Response Prediction of Adenocarcinoma and Squamous Cell Carcinoma Lung Cancer
Authors Chen H , Xu X , Ge T, Hua C, Zhu X, Wang Q, Yu Z, Zhang R
Received 7 July 2021
Accepted for publication 24 August 2021
Published 16 September 2021 Volume 2021:14 Pages 5771—5785
DOI https://doi.org/10.2147/IJGM.S327641
Checked for plagiarism Yes
Review by Single anonymous peer review
Peer reviewer comments 2
Editor who approved publication: Dr Scott Fraser
Hai Chen,1,2 Xianquan Xu,2 Tengfei Ge,3 Congshu Hua,4 Xiaodong Zhu,2 Qikui Wang,2 Zaicheng Yu,1 Renquan Zhang1
1Department of Thoracic Surgery, The First Affiliated Hospital of Anhui Medical University, Hefei, People’s Republic of China; 2Department of Cardiothoracic Surgery, Anhui Chest Hospital, Hefei, People’s Republic of China; 3The Third Department of Thoracic Surgery, Anhui Chest Hospital, Hefei, People’s Republic of China; 4The First Department of Thoracic Surgery, Anhui Chest Hospital, Hefei, People’s Republic of China
Correspondence: Hai Chen; Renquan Zhang
Department of Thoracic Surgery, The First Affiliated Hospital of Anhui Medical University, 218th Jixi Road;, Department of Cardiothoracic Surgery, AnhuiChest Hospital, 397th Jixi Road, Hefei, 230022, Anhui, People’s Republic of China
Tel +8613515642451
; +8613705699600
Email [email protected]; [email protected]
Background: The prevalence and cancer-specific death rate of lung cancer (LC) have risen in recent decades. A universally applicable prognostic signature for both adenocarcinoma LC (LUAD) and squamous cell carcinoma LC (LUSC) is still lacking.
Methods: A total of 453 patients from The Cancer Genome Atlas (TCGA)-LUAD cohort and 452 patients from TCGA-LUSC cohort were enrolled, and a prognostic model was constructed using least absolute shrinkage and selection operator (LASSO) regression analysis based on the consensus prognostic genes in both cohorts. The newly defined pan-lung cancer risk count (PLCRC) of each patient was calculated via the summation formula.
Results: A total of 23 genes were selected for the calculation of the PLCRC. The PLCRC showed a moderate prognostic value in the entire (p < 0.001, HR: 2.75, AUC: 0.643), LUAD (p < 0.001, HR: 2.51, AUC: 0.636) and LUSC (p < 0.001, HR: 2.89, AUC: 0.656) cohorts. The PLCRC was an independent prognostic factor after adjusting the clinical features. The PLCRC was also effective in nine external validation cohorts and in patients with different clinical features. Activation of extracellular matrix pathways and infiltration of immunocytes promoted the tumorigenesis and development of both LUAD and LUSC. We generated a universally applicable prognostic signature, the PLCRC, which could dichotomize patients with significantly different clinical outcomes and guide the clinical treatment of LC patients. Chemotherapy is more suitable for patients with a low PLCRC, while anti-cytotoxic T-lymphocyte-associated protein 4 immunotherapy is more suitable for patients with a high PLCRC.
Conclusion: We established and validated a newly defined prognostic signature, the PLCRC, for both LUAD and LUSC patients and provided clinical strategies for patients from different risk subgroups.
Keywords: lung cancer, prognostic signature, LASSO analysis, personalized treatment, immunotherapy
Introduction
The prevalence and cancer-specific death rate of lung cancer (LC) have risen in recent decades. According to the data from GLOBOCAN, approximately 2.09 million patients were newly diagnosed with LC in 2018, and approximately 1.76 million patients died of LC in 2018.1 The prevalence of LC is increasing in developing regions, as expected, and is mostly associated with an increasing number of smokers.2 The 5-year survival of LC patients is as low as 10% to 20% around the world, despite the development of clinical treatments, including surgery, chemotherapy, and immunotherapy.3 From the perspective of histology, non-small-cell LC (NSCLC) and small-cell LC (SCLC) are the two major subtypes. Moreover, two important typical subtypes are separated because of the heterogeneous background of NSCLC: Adenocarcinoma LC (LUAD) and squamous cell carcinoma LC (LUSC).
The molecular characteristics of LUAD and LUSC have been well described. Comprehensive molecular profiling of LUAD was performed by the Cancer Genome Atlas Research Network and revealed three main subtypes: Terminal respiratory unit (TRU), proximal proliferative (PP), and proximal inflammatory (PI). The TRU subtype of LUAD is characterized by the features of EGFR mutation and has a preferable prognosis. The PP subtype is characterized by enrichment of KRAS mutations, while PI subtype patients are characterized by commutation of both the TP53 and NF1 genes.4 Four molecular subtypes were also defined in LUSC patients: Primitive, classical, basal, and secretory. The primitive subtype has the activated function of cellular proliferation, the classical subtype exhibits the distinctive functional theme of xenobiotic metabolism, the secretory subtype contains the major distinctive function of the immune response, and the basal subtype is characterized by the adhesion function.5 Immune infiltration in the tumour microenvironment (TME) has been reported to be closely associated with tumorigenesis and prognosis in several tumours. Recently, a series of studies reported an immune molecular subtype among tumours, including LC. Patients with an activated immune environment showed the best clinical outcome, while the immunosuppressed subgroup presented the worst clinical outcome.6–9
Several studies have also tried to construct the prognostic signature of LC. Li et al10 reported a 25 immune gene pair-based prognostic signature based on 2414 NSCLC patients, with a predicted C-index value of 0.64. Liu et al11 generated two signatures based on autophagy-associated genes to separately predict the prognosis of LUAD and LUSC, but these signatures lacked universal applicability for both LUAD and LUSC patients. In the current study, we explored the consensus prognostic genes in both LUAD and LUSC and established a universally applicable prognostic signature for most LC patients.
Methods and Materials
Patients Summary and mRNA Expression Profile
A total of 453 patients from The Cancer Genome Atlas (TCGA)-LUAD and 452 patients from TCGA-LUSC cohorts were first enrolled for the analysis. All patients had gene expression profiles and matched clinical information. All these data were downloaded by the R package “TCGAbiolinks”.12 Importantly, patients with an overall survival (OS) time of less than one month were excluded to avoid potential bias. For the gene expression profile, genes with zero values in more than 10% of samples were also excluded. The count data were transformed to transcripts per kilobase million values (TPM) and then with the final form after log2 (TPM+1) transformation for subsequent analysis.13 For the clinical information, we separated patients into nonsmokers who had never smoked, ever smokers, who had smoked in the past, and smokers, who currently smoked.
Construction the Prognostic Signature
Univariate Cox analysis was applied to explore the prognostic genes in the LUAD and LUSC cohorts. Then, a Venn plot was selected and displayed the consensus prognostic genes for subsequent analysis. The least absolute shrinkage and selection operator (LASSO) regression analysis was conducted by the “glmnet” package14 and was employed to select and regularize all the input factors to generate a statistical model with high prediction accuracy and interpretability. As a kind of regularization method, LASSO can avoid overfitting, can more effectively perform feature selection and optimize the form of the regression model than other common ordinary least-squares subset selection methods and is especially suited for situations where there are numerous potential predictors but where we think only a few are likely relevant. These genes selected via LASSO analysis were used to calculate the risk score of each patient with the gene expression value and the coefficient.
where Ci is the coefficient of the gene, and Ei is the expression value of the corresponding gene.
Validation of the Prognostic Value of the Signature
To validate the prognostic value of the established signature in external lung cancer cohorts, we used online tools. In SurvExpress,15 the gene symbols of 23 genes pointed out from the LASSO analysis were input for the analysis, the risk score was calculated automatically, and the deficiency of no more than five genes was allowed. Another online website, Kaplan–Meier Plotter,16 was also used. A total of 1144 lung cancer patients, including both LUAD and LUSC patients, and the clinical information on sex, smoking status and tumour stage were also recorded. The risk score for the analysis in Kaplan–Meier Plotter was calculated along with the index of the 23 selected genes.
Gene Set Enrichment Analysis
To investigate the mechanism of tumorigenesis of lung cancer, we used gene set enrichment analysis (GSEA) to explore the activated signalling pathways in high-risk and low-risk patients in both the LUAD and LUSC cohorts.17 The 186 Kyoto Encyclopedia of Genes and Genomes (KEGG) pathways were downloaded from MSigDB (https://www.gsea-msigdb.org/gsea/msigdb/genesets.jsp?collection=CP:KEGG). Enrichment analysis is a means to characterize biological attributes in the given KEGG gene sets. We calculated an enrichment score (ES) for each gene set by walking down the rank list and finding the maximum deviation from zero of a running-sum, weighted Kolmogorov–Smirnov-like statistic. Next, the normalized enrichment score (NES) was calculated by dividing positive and negative ES by the mean of positive or negative pES, respectively. Finally, to estimate the false discovery rate (FDR), a null distribution of NES values is generated using a list of background gene sets.18
Immune Infiltration Evaluation
The infiltration of 28 types of immunocytes into tumours was evaluated via single-sample gene set enrichment analysis (ssGSEA).19 For each patient, the ssGSEA gives a score representing the infiltration of each type of immunocyte. Then, the correlation between the risk score and infiltration of 28 types of immunocytes was evaluated and displayed by a lollipop plot, and only the cell type with a P value less than 0.05 was displayed.
Personalized Treatment Prediction
Based on the drug sensitivity and phenotype data from GDSC 2016 (https://www.cancerrxgene.org/), we employed the R package “pRRophetic” to predict the chemotherapeutic sensitivity for each LC patient.20 The estimated IC50 (lower IC50 indicates increased sensitivity to treatment) of each sample treated with a specific chemotherapy drug was obtained by ridge regression,21 and prediction accuracy was measured through 10-fold cross-validation.22 For immunotherapy, we harnessed subclass mapping to predict the clinical response to immune checkpoint blockade.13 In this manner, we retrieved a published dataset containing 47 patients with melanoma who responded to immunotherapies.23
Results
Selection of the Prognostic Genes
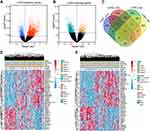
First, we used univariate Cox regression analysis to select prognostic genes. In LUAD, we identified 1822 genes associated with poor prognosis and 752 genes linked with favourable prognosis (Figure 1A). For LUSC, a total of 308 genes were reported to promote tumorigenesis, while another 1039 genes acted as protectors (Figure 1B). To construct a prognostic model that was suitable for both LUAD and LUSC, we combined oncogenes and suppressor genes in both groups. Finally, 18 oncogenes and 29 suppressor genes were chosen for LASSO analysis (Figure 1C). The expression of these 47 genes and their association with clinical features are shown in Figure 1D–E.
Construction of the Prognostic Signature
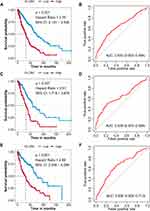
To construct the prognostic signature based on the 47 genes, we conducted LASSO analysis. Twenty-three genes were retained in the formula, and the index was also calculated by LASSO (Figure S1A and B). The pan-lung cancer risk score (PLCRC) of each patient was calculated via the following formula: PLCRC = 0.00542 * ELK3 + 0.26072 * EMC6 + 0.03244 * BCAR1 + 0.06126 * TBC1D1 + 0.00671 * SNAI1 + 0.09366 * FLNC + 0.07842 * RAB27B + 0.0395 * FSTL3 + 0.05682 * ID1 + 0.02545 * FAM83A - 0.03249 * ANKRD65 - 0.03771 * MYLIP - 0.12505 * NRTN - 0.01225 * SNHG10 - 0.03846 * RFXAP - 0.02943 * ZNF57 - 0.20389 * MRPL54 - 0.20496 * INAFM2 - 0.01993 * TMEM60 - 0.06058 * PHKG2 - 0.02463 * C3ORF62 - 0.19104 * ZNF394 - 0.03237 * NPRL2. In the entire cohort, patients were separated into high-risk and low-risk groups via the median PLCRC value. We observed that patients in the high-risk subgroup suffered from extremely pejorative OS compared with the low-risk subgroup (p < 0.001, HR: 2.75, 95% CI: 2.131–3.546, Figure 2A), and the prognostic value of the PLCRC in all 905 patients was assessed by ROC curve analysis and showed a moderate prognostic value (AUC: 0.643, 95% CI: 0.603–0.684, Figure 2B). In addition, we evaluated the prognostic value of the PLCRC in LUAD and LUSC patients separately. In the LUAD patients, the PLCRC also presented a relatively good application (AUC: 0.636, 95% CI: 0.573–0.699, Figure 2D), and patients in the high-risk subgroup showed a 2.51-fold-change risk of poor prognosis compared with the low-risk subgroup (p < 0.001, HR: 2.51, 95% CI: 1.719–3.676, Figure 2C). For LUSC patients, the OS outcome in the two risk groups also separated significantly (p < 0.001, HR: 2.89, 95% CI: 2.038–4.088, Figure 2E), with a preferred prognostic value (AUC: 0.656, 95% CI: 0.602–0.710, Figure 2F).
PLCRC is Independent Prognostic Factor for LC Patients
To further evaluate the clinical application value of the PLCRC, we performed multivariate Cox regression analysis of the PLCRC and clinical features. In the entire cohort, we revealed that the PLCRC value was an independent prognostic factor (p < 0.001, HR: 2.281, 95% CI: 2.161–3.684, Figure 3A, Table 1) after adjusting for the impact of age, sex, smoking status, and tumour stage. We also found that age higher than 70 years old and advanced tumour stage were factors impacting OS in the entire cohort. Moreover, to improve the prognostic value, we newly defined a combined model that enrolled the PLCRC and all four other clinical features. The combined model showed the best prognostic value assessed via ROC curve analysis (combined, AUC: 0.724, 95% CI: 0.670–0.778; PLCRC, AUC: 0.712, 95% CI: 0.657–0.767; sex: AUC: 0.484, 95% CI: 0.432–0.535; age, AUC: 0.527, 95% CI: 0.474–0.580; smoking, AUC: 0.490, 95% CI: 0.442–0.538; stage, AUC: 0.619, 95% CI: 0.563–0.674, Figure 3B). Subsequently, we conducted multivariate Cox regression analysis on the LUAD and LUSC subgroups. The PLCRC acted as an independent prognostic factor in LUAD patients as well (p < 0.001, HR: 2.06, 95% CI: 1.35–3.10, Figure 3C, Table 1). The combined model of the PLCRC plus clinical features showed a prognostic AUC value as high as 0.793 (95% CI: 0.708–0.877, Figure 3D), which was better than that in the entire cohort. For LUSC patients, the PLCRC identified the patients with high risk better, and patients in the high-risk group had an increased risk fold-change of 3.22 compared with those in the low-risk group (p < 0.001, HR: 3.22, 95% CI: 2.23–4.60, Figure 3E, Table 1); however, the overall combined model did not increase the prognostic value compared with the PLCRC alone (combined, AUC: 0.660, 95% CI: 0.585–734; PLCRC, AUC: 0.671, 95% CI: 0.597–0.746; Figure 3F).
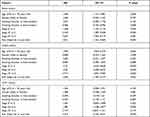 |
Table 1 The Independent Prognostic Value of Risk Score in Entire, LUAD and LUSC Cohort |
Validation the Prognostic Value of the PLCRC in SurvExpress
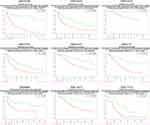
To validate the prognostic value of the PLCRC, we input the 23 genes in SurvExpress and obtained the K-M plot from high- and low-risk score groups in different databases. The modified PLCRC in nine GEO databases was calculated automatically by SurvExpress, and we separated the patients into high- and low-risk groups by the median value of the modified PLCRC to confirm that the patient number in each group was consistent. Notably, the deficiency of no more than five genes among the 23 input genes was allowed. The stable prognostic value of the PLCRC was confirmed, and patients in the modified PLCRC-defined high-risk group all showed significantly poorer clinical outcomes than those in the low-risk group in all nine GEO databases (all p < 0.001, Figure 4). The HR value in different GEO databases ranged from 2.41 to 8.91, the highest HR belonged to GSE31210, there are only 4 patients dead among the 113 patients in the low-risk group, while another 31 patients among the 113 patients in the high-risk group met the dead end during the follow-up (p < 0.001, HR: 8.91, 95% CI: 3.14–25.25, Figure 4).
Validation of the Prognostic Value of the PLCRC in Kaplan–Meier Plotter
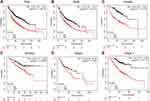
We also evaluated the prognostic value of the PLCRC in clinical subgroups via Kaplan–Meier Plotter. A total of 1144 patients were recorded in the Kaplan–Meier Plotter, with gene expression of 23 genes and clinical information. The PLCRC of each patient was calculated along with the index and expression of the 23 LASSO analysis identified genes. We found that the PLCRC-defined high-risk group showed a significantly severe clinical outcome (p < 0.001, HR: 1.96, 95% CI: 1.65–2.32, Figure 5A). The opposite two risk groups were identified by the PLCRC in both the male (p < 0.001, HR: 1.57, 95% CI: 1.28–1.92, Figure 5B) and female (p < 0.001, HR: 2.96, 95% CI: 2.05–4.28, Figure 5C) subgroups, demonstrating its stable prognostic value. For smoking status, we revealed that the prognostic value was useful for smokers but not nonsmokers (n=300, p < 0.001, HR: 2.21, 95% CI: 1.44–3.39, Figure 5D). Regarding tumour stage, PLCRC showed a better prognostic value in advanced stage (stage I: p = 0.094, HR: 1.48, 95% CI: 0.93–2.34, Figure 5E; stage II: p < 0.001, HR: 3.47, 95% CI: 2.43–4.95, Figure 5E).
Pathways Derives the Prognosis of LC
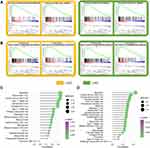
To identify the pivotal signalling pathways impacting and promoting the tumorigenesis and clinical outcome of LC patients, we employed GSEA to identify the most significant pathways in LUAD and LUSC patients. We revealed that the extracellular matrix pathway and focal adhesion pathways activated in the PLCRC defined high-risk groups in LUAD and LUSC (Figure 6A). In addition, we also observed activated immune-associated signalling pathways in high-risk patients, and the cytokine and receptor interaction pathway and leukocyte transendothelial migration pathway were all significantly activated in both LUAD and LUSC high-risk patients (Figure 6B). More details of the activated signatures are listed in Table 2.
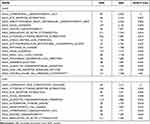 |
Table 2 Activated Signaling Pathways in High-Risk Patients of LUAD and LUSC |
To further understand the mechanism of how the tumour immune microenvironment impacts the tumorigenesis of LC, we compared the correlation between 28 types of immunocytes and the PLCRC value. Interestingly, we found that the PLCRC was positively associated with the infiltration of numerous immunocytes, especially neutrophils, central memory CD8 T cells, and natural killer T cells (Figure 6C and D).
Identify the Personalized Treatment for LC Patients
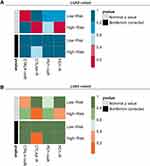
Because we revealed the different activated signalling pathways and discrepant infiltration of immunocytes in the high-PLCRC and low-PLCRC subgroups, we tried to search for personalized therapy for LC patients. With the help of 138 recorded drugs in the R package “pRRophetic”,20 we revealed that ten drugs were more suitable for patients with a low PLCRC than for those with a high PLCRC in both LUAD (all P < 0.05, Figure 7A) and LUSC (all P < 0.05, Figure 7B) patients. We were excited to find that patients with a high PLCRC could benefit more from anti-cytotoxic T lymphocyte-associated protein 4 (CTLA4) immunotherapy, and that this was true for both LUAD (Figure 8A) and LUSC (Figure 8B) patients.
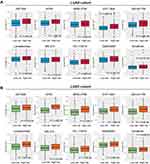 |
Figure 7 Precision chemotherapy drugs for LC. (A) Personalized therapeutic drugs for LUAD patients with low PLCRC; (B) Personalized therapeutic drugs for LUSC patients with low PLCRC. |
Discussion
LC is still the most malignant tumour, with a poor 5-year survival rate of only 19%.24 For the early stage of NSCLC, in which the tumour stage remains at stage I or stage II, surgery is the most frequently recommended clinical treatment.25 The 5-year survival rate of stage IA patients after surgery rises to 77–92%, the survival rate of stage IB patients is 68%, and the survival rate of stage II NSCLC patients is almost 60%.26 For advanced NSCLC, the clinical treatment paradigm has improved, mostly owing to the new findings of molecular targeted therapies.27 Epidermal growth factor receptor (EGFR) mutations are present in approximately one-fifth of NSCLC patients, mostly in LUAD patients.28 Tyrosine kinase inhibitors (TKIs) are effective for the clinical treatment of LUAD patients with EGFR mutations, with an improvement in progression-free survival compared to chemotherapy; however, the toxic effects are nonnegligible.29 Moreover, secondary mutations, activation of bypass pathways, alternative activation of other pathways and histological transformation can lead to resistance to TKI treatment in LUAD patients.30,31 In addition to EGFR mutations, researchers have also revealed genetic alterations and developed targeted drugs, including ALK gene rearrangements,32 ROS1 gene rearrangements,33 RET fusions,34 MET mutations,35 BRAF mutations,36 and KRAS mutations.37 Although anti-PD1/PD-L1 therapy is applied for the treatment of advanced NSCLC, only 14–20% of patients have rapid and durable responses.38–40 Therefore, it is urgent to construct a prognostic signature to identify LC patients with a high risk of poor OS survival at the early stage and choose the appropriate therapy.
For the early diagnosis of LC, the National Lung Screening Trial (NLST) provides the clinical recommendation for low-dose computed tomography of the chest (LDCT) screening. Participants were randomly assigned to radiography or LDCT and screened at baseline with two annual follow-up scans. Within the maximum follow-up time of 7 years, the LDCT group had a 20% decrease in mortality and a 6.7% reduction in all-cause mortality.41 Weiss et al42 reported that methylation of SHOX2 and PTGER4 in plasma DNA is more effective in identifying LC than in identifying nonmalignant lung diseases. Chen et al43 constructed a five-gene signature to calculate the risk score based on the expression of DUSP6, MMD, STAT1, ERBB3 and LCK detected by RT-PCR.
In the current study, we first collected data from 453 LUAD patients and 452 LUSC patients from the TCGA database after removing patients lacking clinical records or those with OS times less than one month. The oncogenes and suppressive genes of both LUAD and LUSC were selected as the input genes for LASSO Cox regression analysis. A total of 23 genes remained for the construction of the PLCRC signature, which was calculated by the index generated from LASSO analysis and the log2 transformed TMP value of each gene. The moderate prognostic value of the PLCRC was observed in the entire cohort, LUAD cohort and LUSC cohort, and the PLCRC can dichotomize patients with significantly different OS. To assess the application of the PLCRC in patients with different backgrounds, we further performed multivariate Cox regression analysis. The most exciting finding was that the PLCRC was an independent prognostic factor of both LUAD and LUSC patients after adjusting for age, sex, smoking status, and tumour stage. Moreover, personalized therapy is necessary for patients. We revealed that the PLCRC can also act as a guideline for clinical therapy for both LUAD and LUSC. Chemotherapy was more suitable for patients with a low PLCRC, while patients with a high PLCRC can benefit more from anti-CTAL4 therapy.
The clinical application of a prognostic signature is validated in multiple external cohorts. With the help of SurvExpress, we successfully validated the prognostic value of the PLCRC in 1342 LC patients, recorded in GSE19118, GSE30219, GSE31210, GSE37745, GSE42127, GSE3141, GSE8894, GSE13213, and GSE17710. The prognostic value of the PLCRC in clinical subgroups was also validated by Kaplan–Meier Plotter. The PLCRC could dichotomize patients with significantly different OS in males, females, smokers, and especially stage II patients. We also studied the potential mechanism of tumorigenesis in LUAD and LUSC patients and linked the poor prognosis of LC patients to the abundant infiltration of immunocytes.
Conclusion
We established and validated a newly defined prognostic signature, the PLCRC, for LC patients, and this signature is universally useful and stable for the prognosis of both LUAD and LUSC patients. Patients with a low PLCRC benefit more from chemotherapy, while patients with a high PLCRC benefit more from anti-CTLA4 immunotherapy.
Consent for Publication
All authors have read the final manuscript and approve of the publication of its content in entirety.
Ethics Statement
The public database mentioned in this study is publicly available for re-analyzing, and no ethical approval was required by the local ethics committees, so that this study does not require the ethics approval.
Author Contributions
All authors made a significant contribution to the work reported, whether that is in the conception, study design, execution, acquisition of data, analysis and interpretation, or in all these areas; took part in drafting, revising or critically reviewing the article; gave final approval of the version to be published; have agreed on the journal to which the article has been submitted; and agree to be accountable for all aspects of the work.
Funding
The authors declare that there are no sources of funding to be acknowledged.
Disclosure
The authors have declared that no conflict of interest exists.
References
1. Bray F, Ferlay J, Soerjomataram I, Siegel RL, Torre LA, Jemal A. Global cancer statistics 2018: GLOBOCAN estimates of incidence and mortality worldwide for 36 cancers in 185 countries. CA Cancer J Clin. 2018;68(6):394–424. doi:10.3322/caac.21492
2. Torre LA, Siegel RL, Jemal A. Lung Cancer Statistics. Adv Exp Med Biol. 2016;893:1–19. doi:10.1007/978-3-319-24223-1_1
3. Miller KD, Nogueira L, Mariotto AB, et al. Cancer treatment and survivorship statistics, 2019. CA Cancer J Clin. 2019;69(5):363–385. doi:10.3322/caac.21565
4. Cancer Genome Atlas Research N. Comprehensive molecular profiling of lung adenocarcinoma. Nature. 2014;511(7511):543–550. doi: 10.1038/nature13385.
5. Wilkerson MD, Yin X, Hoadley KA, et al. Lung squamous cell carcinoma mRNA expression subtypes are reproducible, clinically important, and correspond to normal cell types. Clin Cancer Res. 2010;16(19):4864–4875. doi:10.1158/1078-0432.CCR-10-0199
6. Meng J, Zhou Y, Lu X, et al. Immune response drives outcomes in prostate cancer: implications for immunotherapy. Mol Oncol. 2020;15:1358–1375. doi:10.1002/1878-0261.12887
7. Chen YP, Wang YQ, Lv JW, et al. Identification and validation of novel microenvironment-based immune molecular subgroups of head and neck squamous cell carcinoma: implications for immunotherapy. Ann Oncol. 2019;30(1):68–75. doi:10.1093/annonc/mdy470
8. Tan Q, Huang Y, Deng K, et al. Identification immunophenotyping of lung adenocarcinomas based on the tumor microenvironment. J Cell Biochem. 2020;121(11):4569–4579. doi:10.1002/jcb.29675
9. Jialin meng J, Lu X, Zhou Y, et al. Tumor immune microenvironment-based classifications of bladder cancer for enhancing the response rate of immunotherapy. Molecular Therapy - Oncolytics. 2021;20(2021):410–421. doi:10.1016/j.omto.2021.02.001
10. Li B, Cui Y, Diehn M, Li R. Development and Validation of an Individualized Immune Prognostic Signature in Early-Stage Nonsquamous Non-Small Cell Lung Cancer. JAMA Oncol. 2017;3(11):1529–1537. doi:10.1001/jamaoncol.2017.1609
11. Liu Y, Wu L, Ao H, et al. Prognostic implications of autophagy-associated gene signatures in non-small cell lung cancer. Aging (Albany NY). 2019;11(23):11440–11462. doi:10.18632/aging.102544
12. Colaprico A, Silva TC, Olsen C, et al. TCGAbiolinks: an R/Bioconductor package for integrative analysis of TCGA data. Nucleic Acids Res. 2016;44(8):e71. doi:10.1093/nar/gkv1507
13. Lu X, Jiang L, Zhang L, et al. Immune Signature-Based Subtypes of Cervical Squamous Cell Carcinoma Tightly Associated with Human Papillomavirus Type 16 Expression, Molecular Features, and Clinical Outcome. Neoplasia. 2019;21(6):591–601. doi:10.1016/j.neo.2019.04.003
14. Friedman J, Hastie T, Tibshirani R. Regularization Paths for Generalized Linear Models via Coordinate Descent. J Stat Softw. 2010;33(1):1–22. doi:10.18637/jss.v033.i01
15. Aguirre-Gamboa R, Gomez-Rueda H, Martinez-Ledesma E, et al. SurvExpress: an online biomarker validation tool and database for cancer gene expression data using survival analysis. PLoS One. 2013;8(9):e74250. doi:10.1371/journal.pone.0074250
16. Győrffy B. Survival analysis across the entire transcriptome identifies biomarkers with the highest prognostic power in breast cancer. Comput Struct Biotechnol J. 2021;19:4101–4109. doi:10.1016/j.csbj.2021.07.014
17. Mootha VK, Lindgren CM, Eriksson KF, et al. PGC-1alpha-responsive genes involved in oxidative phosphorylation are coordinately downregulated in human diabetes. Nat Genet. 2003;34(3):267–273. doi:10.1038/ng1180
18. Barbie DA, Tamayo P, Boehm JS, et al. Systematic RNA interference reveals that oncogenic KRAS-driven cancers require TBK1. Nature. 2009;462(7269):108–112. doi:10.1038/nature08460
19. Yoshihara K, Shahmoradgoli M, Martínez E, et al. Inferring tumour purity and stromal and immune cell admixture from expression data. Nat Commun. 2013;4:2612. doi:10.1038/ncomms3612
20. Geeleher P, Cox N, Huang RS. pRRophetic: an R package for prediction of clinical chemotherapeutic response from tumor gene expression levels. PLoS One. 2014;9(9):e107468. doi:10.1371/journal.pone.0107468
21. Arthur E, Hoerl RWK. Ridge regression: biased estimation for nonorthogonal problems. Technometrics. 2000;42(1):80–86. doi:10.2307/1271436
22. Geeleher P, Cox NJ, Huang RS. Clinical drug response can be predicted using baseline gene expression levels and in vitro drug sensitivity in cell lines. Genome Biol. 2014;15(3):R47. doi:10.1186/gb-2014-15-3-r47
23. McGranahan N, Furness AJ, Rosenthal R, et al. Clonal neoantigens elicit T cell immunoreactivity and sensitivity to immune checkpoint blockade. Science. 2016;351(6280):1463–1469. doi:10.1126/science.aaf1490
24. Siegel RL, Miller KD, Jemal A. Cancer statistics, 2019. CA Cancer J Clin. 2019;69(1):7–34. doi:10.3322/caac.21551
25. Vansteenkiste J, Crino L, Dooms C, et al. 2nd ESMO Consensus Conference on Lung Cancer: early-stage non-small-cell lung cancer consensus on diagnosis, treatment and follow-up. Ann Oncol. 2014;25(8):1462–1474. doi:10.1093/annonc/mdu089
26. Goldstraw P, Chansky K, Crowley J, et al. The IASLC Lung Cancer Staging Project: proposals for Revision of the TNM Stage Groupings in the Forthcoming (Eighth) Edition of the TNM Classification for Lung Cancer. J Thorac Oncol. 2016;11(1):39–51. doi:10.1016/j.jtho.2015.09.009
27. Tsao AS, Scagliotti GV, Bunn PA
28. Shigematsu H, Lin L, Takahashi T, et al. Clinical and biological features associated with epidermal growth factor receptor gene mutations in lung cancers. J Natl Cancer Inst. 2005;97(5):339–346. doi:10.1093/jnci/dji055
29. Park K, Tan EH, O’Byrne K, et al. Afatinib versus gefitinib as first-line treatment of patients with EGFR mutation-positive non-small-cell lung cancer (LUX-Lung 7): a Phase 2B, open-label, randomised controlled trial. Lancet Oncol. 2016;17(5):577–589. doi:10.1016/S1470-2045(16)30033-X
30. Sequist LV, Waltman BA, Dias-Santagata D, et al. Genotypic and histological evolution of lung cancers acquiring resistance to EGFR inhibitors. Sci Transl Med. 2011;3(75):75ra26. doi:10.1126/scitranslmed.3002003
31. Piotrowska Z, Niederst MJ, Karlovich CA, et al. Heterogeneity Underlies the Emergence of EGFRT790 Wild-Type Clones Following Treatment of T790M-Positive Cancers with a Third-Generation EGFR Inhibitor. Cancer Discov. 2015;5(7):713–722. doi:10.1158/2159-8290.CD-15-0399
32. Soda M, Choi YL, Enomoto M, et al. Identification of the transforming EML4-ALK fusion gene in non-small-cell lung cancer. Nature. 2007;448(7153):561–566. doi:10.1038/nature05945
33. Bergethon K, Shaw AT, Ou SH, et al. ROS1 rearrangements define a unique molecular class of lung cancers. J Clin Oncol. 2012;30(8):863–870. doi:10.1200/JCO.2011.35.6345
34. Wang R, Hu H, Pan Y, et al. RET fusions define a unique molecular and clinicopathologic subtype of non-small-cell lung cancer. J Clin Oncol. 2012;30(35):4352–4359. doi:10.1200/JCO.2012.44.1477
35. Sadiq AA, Salgia R. MET as a possible target for non-small-cell lung cancer. J Clin Oncol. 2013;31(8):1089–1096. doi:10.1200/JCO.2012.43.9422
36. Marchetti A, Felicioni L, Malatesta S, et al. Clinical features and outcome of patients with non-small-cell lung cancer harboring BRAF mutations. J Clin Oncol. 2011;29(26):3574–3579. doi:10.1200/JCO.2011.35.9638
37. Janne PA, Shaw AT, Pereira JR, et al. Selumetinib plus docetaxel for KRAS-mutant advanced non-small-cell lung cancer: a randomised, multicentre, placebo-controlled, phase 2 study. Lancet Oncol. 2013;14(1):38–47. doi:10.1016/S1470-2045(12)70489-8
38. Fehrenbacher L, Spira A, Ballinger M, et al. Atezolizumab versus docetaxel for patients with previously treated non-small-cell lung cancer (POPLAR): a multicentre, open-label, phase 2 randomised controlled trial. Lancet. 2016;387(10030):1837–1846. doi:10.1016/S0140-6736(16)00587-0
39. Gettinger SN, Horn L, Gandhi L, et al. Overall Survival and Long-Term Safety of Nivolumab (Anti-Programmed Death 1 Antibody, BMS-936558, ONO-4538) in Patients With Previously Treated Advanced Non-Small-Cell Lung Cancer. J Clin Oncol. 2015;33(18):2004–2012. doi:10.1200/JCO.2014.58.3708
40. Garon EB, Rizvi NA, Hui R, et al. Pembrolizumab for the treatment of non-small-cell lung cancer. N Engl J Med. 2015;372(21):2018–2028. doi:10.1056/NEJMoa1501824
41. Aberle DR, Adams AM; National Lung Screening Trial Research T. Reduced lung-cancer mortality with low-dose computed tomographic screening. N Engl J Med. 2011;365(5):395–409. doi:10.1056/NEJMoa1102873.
42. Weiss G, Schlegel A, Kottwitz D, Konig T, Tetzner R. Validation of the SHOX2/PTGER4 DNA Methylation Marker Panel for Plasma-Based Discrimination between Patients with Malignant and Nonmalignant Lung Disease. J Thorac Oncol. 2017;12(1):77–84. doi:10.1016/j.jtho.2016.08.123
43. Chen HY, Yu SL, Chen CH, et al. A five-gene signature and clinical outcome in non-small-cell lung cancer. N Engl J Med. 2007;356(1):11–20. doi:10.1056/NEJMoa060096
 © 2021 The Author(s). This work is published and licensed by Dove Medical Press Limited. The full terms of this license are available at https://www.dovepress.com/terms.php and incorporate the Creative Commons Attribution - Non Commercial (unported, v3.0) License.
By accessing the work you hereby accept the Terms. Non-commercial uses of the work are permitted without any further permission from Dove Medical Press Limited, provided the work is properly attributed. For permission for commercial use of this work, please see paragraphs 4.2 and 5 of our Terms.


