")
Back to Journals » International Journal of Nanomedicine » Volume 13
A novel sol-gel-derived calcium silicate cement with short setting time for application in endodontic repair of perforations
Authors Lee BS, Lin HP, Chan JCC , Wang WC, Hung PH , Tsai YH, Lee YL
Received 28 August 2017
Accepted for publication 24 October 2017
Published 8 January 2018 Volume 2018:13 Pages 261—271
DOI https://doi.org/10.2147/IJN.S150198
Checked for plagiarism Yes
Review by Single anonymous peer review
Peer reviewer comments 3
Editor who approved publication: Dr Linlin Sun
Bor-Shiunn Lee,1,2 Hong-Ping Lin,3 Jerry Chun-Chung Chan,4 Wei-Chuan Wang,2 Ping-Hsuan Hung,2 Yu-Hsin Tsai,4 Yuan-Ling Lee1,2
1Graduate Institute of Oral Biology, 2Graduate Institute of Clinical Dentistry, School of Dentistry, National Taiwan University and Hospital, Taipei, 3Department of Chemistry, National Cheng Kung University, Tainan, 4Department of Chemistry, National Taiwan University, Taipei, Taiwan, Republic of China
Abstract: Mineral trioxide aggregate (MTA) is the most frequently used repair material in endodontics, but the long setting time and reduced mechanical strength in acidic environments are major shortcomings. In this study, a novel sol-gel-derived calcium silicate cement (sCSC) was developed using an initial Ca/Si molar ratio of 3, with the most effective mixing orders of reactants and optimal HNO3 catalyst volumes. A Fourier transform infrared spectrometer, scanning electron microscope with energy-dispersive X-ray spectroscopy, and X-ray powder diffractometer were used for material characterization. The setting time, compressive strength, and microhardness of sCSC after hydration in neutral and pH 5 environments were compared with that of MTA. Results showed that sCSC demonstrated porous microstructures with a setting time of ~30 min, and the major components of sCSC were tricalcium silicate, dicalcium silicate, and calcium oxide. The optimal formula of sCSC was sn200, which exhibited significantly higher compressive strength and microhardness than MTA, irrespective of neutral or pH 5 environments. In addition, both sn200 and MTA demonstrated good biocompatibility because cell viability was similar to that of the control. These findings suggest that sn200 merits further clinical study for potential application in endodontic repair of perforations.
Keywords: acidic environment, compressive strength, mesoporous, mineral trioxide aggregate, mixing order, sol-gel reaction
Introduction
Mineral trioxide aggregate (MTA), with tricalcium silicate (C3S) and dicalcium silicate (C2S) as major components, has been considered the most effective endodontic repair material because of its good sealing ability, biocompatibility and bioactivity, and promising outcomes when used in clinical treatment.1–6 However, the properties of MTA during hydration can be affected by environmental factors, such as acidic pH,5,7 because it requires ~3–4 h for initial setting, which may cause treatment failure in clinical applications.8
The sol-gel process is a chemical synthesis method for the preparation of glass-based materials.9 Through the sol-gel process, the desired chemical and physical properties of a product can be obtained by tailoring different precursors, catalysts, catalyst concentrations, H2O/Si molar ratios, and precursor Ca/Si molar ratios.9,10 When the Ca/Si molar ratio is ≤1, the properties of the synthesized calcium silicate resemble those of glass.11 By contrast, the properties of calcium silicate are similar to a self-setting cement when the Ca/Si molar ratio is ≥2 (such as C2S or C3S).12
The sol-gel process has been used to synthesize CaO·SiO2 binary bioactive glass and ceramics with tetraethoxysilane (TEOS) and calcium nitrate tetrahydrate (Ca(NO3)2·4H2O) as precursors, at a Ca/Si molar ratio of ≤1.11,13 Several protocols with different mixing orders of reactants and catalysts have been reported to synthesize mesoporous calcium silicate bioglass successfully, and the mole fraction of Ca content was found to significantly affect the physical properties of products.9,11,13 However, the influences of those factors on the properties of calcium silicate cement with a Ca/Si molar ratio of ≥2 were rarely reported. Zhao and Chang developed a self-setting pure C3S as bone cement with good biocompatibility and surface bioactivity.14,15 This C3S cement presented a porous structure with high surface energy for chemical reaction,15 which may enhance the hydration reaction and be less affected by environmental interference, such as acidic conditions, when used in endodontic repair. However, the low compressive strength of the C3S cement is a great concern for its application in endodontics.14 Therefore, the purpose of this study was to investigate factors that influence the properties of sol-gel-derived calcium silicate cement (sCSC) during sol-gel reaction and develop a novel sCSC for endodontic repair application with reduced setting time, compatible strength, and greater resistance to acidic environments when compared to commercial MTAs.
Materials and methods
Preparation of sCSC
Calcium silicate cement powders were synthesized through the sol-gel process by using Ca(NO3)2·4H2O (Acros Organics™, Steinheim, Germany) and Si(OC2H5)4 (TEOS, 98%, Acros Organics™) as precursors, and with nitric acid (65%, Acros Organics™) as a catalyst. The Ca/Si molar ratio of the precursors was set at 3. The effects of different mixing orders of reactants on the properties of sCSC were investigated first. Protocol A was modified from the sol-gel bioglass process reported by Meiszterics and Sinkó.13 First, 26.57 g Ca(NO3)2·4H2O was added to 15 mL deionized water, and, then, 8.48 mL TEOS was added to the solution. After stirring for 5 min, 65% nitric acid (400 μL) was added as a catalyst to produce the sCSC – named so400. Protocol B was modified from the method reported by Saravanapavan and Hench.11 First, 65% nitric acid (400, 300, 200, and 100 μL) was added to distilled water (15 mL) to catalyze the hydrolysis of TEOS, with stirring for 30 min, and then Ca(NO3)2·4H2O was added to the solution to produce the sCSC – named sn400, sn300, sn200, and sn100, respectively. After stirring for 1 h, solutions obtained from the two protocols were treated with the same procedures for gelation, drying, and calcination, as illustrated in Figure 1.
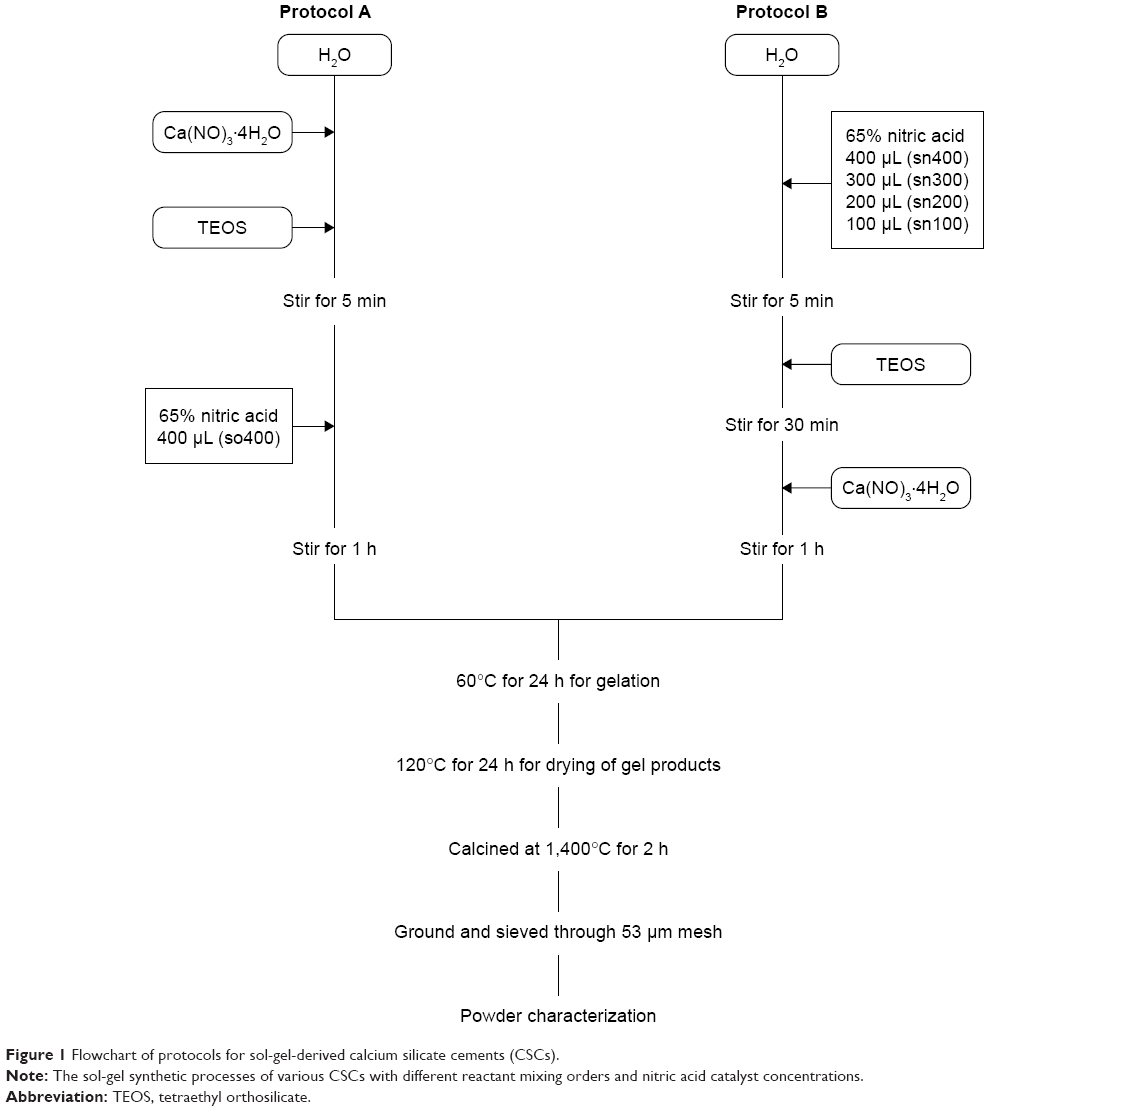 | Figure 1 Flowchart of protocols for sol-gel-derived calcium silicate cements (CSCs). |
Conventional calcium silicate cement (cCSC) synthesized via a sintering process by mixing CaO and SiO2 (Nacalai Tesque, Kyoto, Japan) at a molar ratio of 3:1 and then heating at 1,400°C for 2 h was also investigated in this study as a control material.16
Characterization of gel products
After drying at 120°C for 24 h, gel products from both protocols were mounted, sputter-coated with gold using a Sputter Coater (BIO-RED SC 502; Fisons Plc Registered Office, Ipswich, UK), and then submitted for energy-dispersive X-ray spectroscopy (EDS) analysis to determine the Ca/Si ratio of the gel by using a JEOL-JSM-7600F field emission scanning electron microscope (FE-SEM; JEOL, Tokyo, Japan) equipped with EDS accessories. Characteristics of molecular bonding and functional groups were examined using a Fourier transform infrared (FTIR) spectrometer (JASCO FT/IR-410S spectrometer, Easton, MD, USA). The spectra were recorded from 400 to 4,000 cm−1 with 4 cm−1 resolution, and 32 scans were recorded each time.
Characterization of sCSC and cCSC powders
The particle size and morphology of sCSC and cCSC powders were examined, and the Ca/Si ratio of the powders was determined using SEM-EDS. Crystalline phases of sCSC and cCSC powders were determined using a Rigaku X-ray powder diffractometer (XRD, Geigerflex; Rigaku, Tokyo, Japan) with Ni filter and CuKα radiation (λ=0.154 nm), which was generated at 30 kV and 20 mA. Samples were scanned at a range of 10°–60°, and all data were collected in a continuous scan mode at a scanning rate of 4°/min. Crystalline formations were identified by a computer auto-matched system with a standard data file of the Joint Committee on Powder Diffraction Standards.
Preparation and characterization of hydrated products of sCSC
The sCSC powder was mixed with distilled water at a powder-to-liquid ratio of 2.5:1, and the mixture was placed into a cylinder mold. The specimens were then stored at 37°C with 100% humidity for hydration. Specimens were removed at 1 and 7 days and dried using an FDU-1200 freeze-dryer (EMELA, Tokyo, Japan) for 24 h to stop hydration.17 Subsequently, sCSC was prepared for SEM and XRD analyses.
Two commercial calcium silicate cements – gray MTA (GMTA) and white MTA (WMTA; ProRoot MTA, Dentsply/Tulsa, OK, USA) – were used for comparison. The powder-to-liquid ratio of GMTA and WMTA was 3:1, in accordance with the manufacturer’s instructions, and the hydrated products were prepared following the same procedures for sCSC.
Setting time measurement
The setting time of test materials was determined according to the method recommended by the International Organization for Standardization (ISO 6876).18 Five discs of each test material (d=10 mm, h=2 mm) were prepared. After 10 min of mixing, the prepared specimens were indented vertically using Gilmore needles, with a diameter of 2 mm at the flat end and a weight of 100 g, for 3 s. This procedure was repeated every 2 min until the needle failed to make the indentation, and the time was calculated from the start of mixing as the setting time of the test materials.
Compressive strength test
After hydration for 7 days, specimens were prepared for compressive strength testing according to the method recommended by ISO 9917-1.19 Six specimen cylinders of the test materials (d=4 mm, h=6 mm) were prepared. The compressive strength of each specimen was measured using a universal testing machine (Instron 5566, Canton, MA, USA) at a loading speed of 0.5 mm/min. The maximum compressive load before failure of the test material was recorded, and the compressive strength was calculated as follows:
|
|

where σ is the compressive strength (MPa); F, the maximum load force before failure (N); and D, the diameter of specimen (mm).
Microhardness test
After hydration for 4 and 24 h, 10 specimen cylinders (d=2 mm, h=2 mm) for each test material and each hydration time were prepared for microhardness testing using a microhardness tester (HMV-2; Shimadzu Corporation, Tokyo, Japan). Surfaces of these specimens were polished using serial 600-, 800-, and 1,000-grit SiC papers before the microhardness test. The Vicker hardness test was undertaken using a diamond indenter with a load of 98.07 mN and a dwell time of 6 s. Five measurements were made on the surfaces of each specimen, and the average value represented the hardness of the specimen.
Effects of the acid environment on compressive strength and microhardness
The compressive strength and microhardness of sn200, GMTA, and WMTA were measured in a pH 5 environment. After 10 min of mixing, the specimens were stored at 37°C in pH 5 environment for hydration. Following the methods described in the previous section, after hydration for 24 h, the specimens were prepared for microhardness testing (n=10), and, after hydration for 7 days, the specimens were prepared for compressive strength testing (n=6).
Cytotoxicity
The cytotoxicity of sCSC and MTAs was evaluated using an indirect contact model described previously.20 The test materials (n=6) were prepared and packed into the bottom of culture inserts (Costar Transwell #3422, Corning, NY, USA). After 24 h, the inserts were transferred to the wells with mineralizing rat pulpal cells (MRPC-1 cell line, a gift kindly provided by Prof Ritchie),21 which were seeded on a 24-well culture plate at a density of 1×10⁵ cells/well and cultured overnight. The materials and cells were co-cultured for 3 days, and the culture medium was changed daily to minimize the increase in pH caused by the test material. Cell viability was determined using a 3-(4,5-dimethyl-thiazol-2-yl)-2,5-diphenyltetrazolium bromide (MTT) assay. Cells were cultured with fresh medium, with MTT solution at a final concentration of 0.5 mg/mL, for 3 h. The medium was discarded, and 1 mL dimethyl sulfoxide (DMSO) was added to dissolve the insoluble formazan product. Optical densities were measured at a wavelength of 570 nm with a spectrophotometer (Amersham Place, Buckinghamshire, UK). Cells without material treatment were used as a control, and cells with amalgam (Tytin FC®, Kerr Co., CA, USA) treatment were tested as a reference for toxic material. Cell viability of the test materials was calculated as a percentage using the formula: cell viability (%) = (OD of test material/OD of control) ×100.
Statistical analysis
The normality of data in each test was first confirmed using the Kolmogorov–Smirnov test. Statistical significance was assumed in advance at a probability level of 0.05. If the data distribution was normal, including the means of surface microhardness and compressive strength, a one-way analysis of variance was used to test between-group differences. If the data distribution was not normal, including the means of setting time and cell viability, the Kruskal–Wallis test was used to assess differences among the groups. When differences were found, Tukey’s and Dunn’s multiple comparison tests were used to isolate the statistically significant subgroup at the 95% confidence level for those data with normal and non-normal distribution, respectively.
Results
Characterization of gel products and CSC powders
Because an unstable yield rate of gel products was found using Protocol A, the effects of different catalyst volumes on the properties of sCSC were only investigated in Protocol B. All gel products obtained from so400, sn400, sn300, sn200, and sn100 presented a semitransparent appearance, but a significantly smaller amount of gel products formed in the gelation step was noted in so400 compared with those products obtained using Protocol B. During the drying process, the gels transformed from semitransparent to opaque. The so400 gel was light yellow in color. By contrast, the sn400, sn300, sn200, and sn100 gels were white in color. The EDS results revealed that the so400 gel exhibited a much lower Ca/Si molar ratio (Ca/Si =1.47) compared with the gel products obtained using Protocol B (Ca/Si =16.42–18.57).
Figure 2A presents the FTIR spectra of the gel products of so400, sn400, and sn200 after drying. Because sn300 and sn100 exhibited similar spectra to sn400 and sn200, respectively, they are not shown in Figure 2. The broad absorption band was observed at ~466–588 cm−1, belonging to the O-Si-O/Si-O-Si bending mode;22 however, sn400 and sn200 exhibited a more prominent band than so400. All gel products presented sharp bands corresponding to the O-Si-O stretching band (823 cm−1), Si-O-Ca vibration band (971 cm−1),13 Si-O-Si stretching band (1,047 cm−1, 1,103 cm−1), ionic NO3− vibration band (1,384 cm−1), and −OH vibration band (1,633 cm−1) of H2O,11 but with different intensities. The peak intensity corresponding to O-Si-O and Si-O-Si stretching modes and Si-O-Ca vibration mode was slightly higher in sn400 and sn200 as compared with that of so400. In addition, sn400 and sn200 exhibited weaker intensity of the bands corresponding to ionic NO3 vibration and stronger intensity of the bands corresponding to −OH vibration than so400. Figure 2B presents the FTIR spectra of sCSC powders. Compared with gel products (Figure 2A), sCSC powders after calcination presented much stronger bands corresponding to the Si-O-Ca stretching mode (997, 937, and 885 cm−1), O-Si-O stretching mode (813 cm−1), and O-Si-O/Si-O-Si bending mode (524 and 447 cm−1).22 In addition, bands corresponding to ionic NO3 vibration and −OH vibration disappeared after drying and calcination.
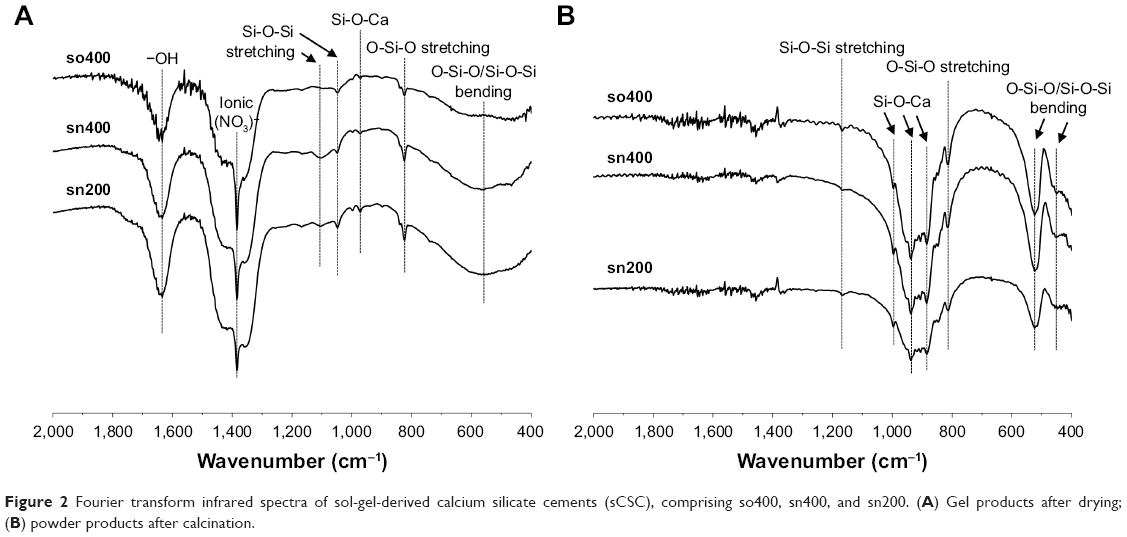 | Figure 2 Fourier transform infrared spectra of sol-gel-derived calcium silicate cements (sCSC), comprising so400, sn400, and sn200. (A) Gel products after drying; (B) powder products after calcination. |
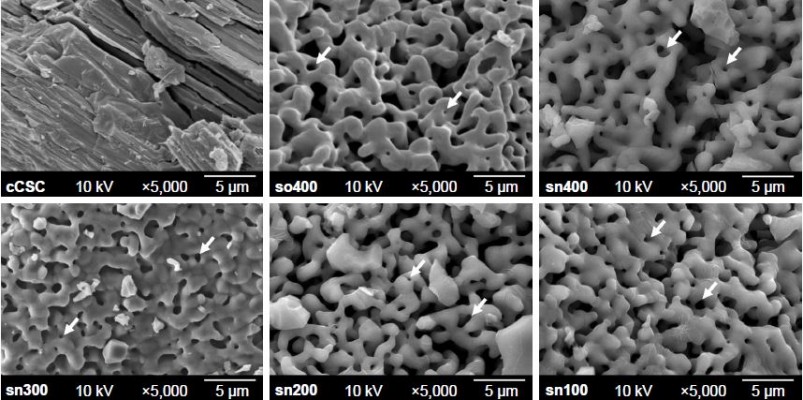
A SEM examination showed that the particle size of cCSC was ~5–20 μm and sCSC demonstrated smaller particles with a size range of 1–10 μm (data not shown). Unlike the flat surface with sharp edges found in the particles of cCSC powders, sCSC powders demonstrated similar porous structures with a pore size in the range of 500 nm to 5 μm (Figure 3). The EDS results revealed that the Ca/Si molar ratios of so400, sn400, and sn200 powders were 3.30, 2.64, and 3.59, respectively.
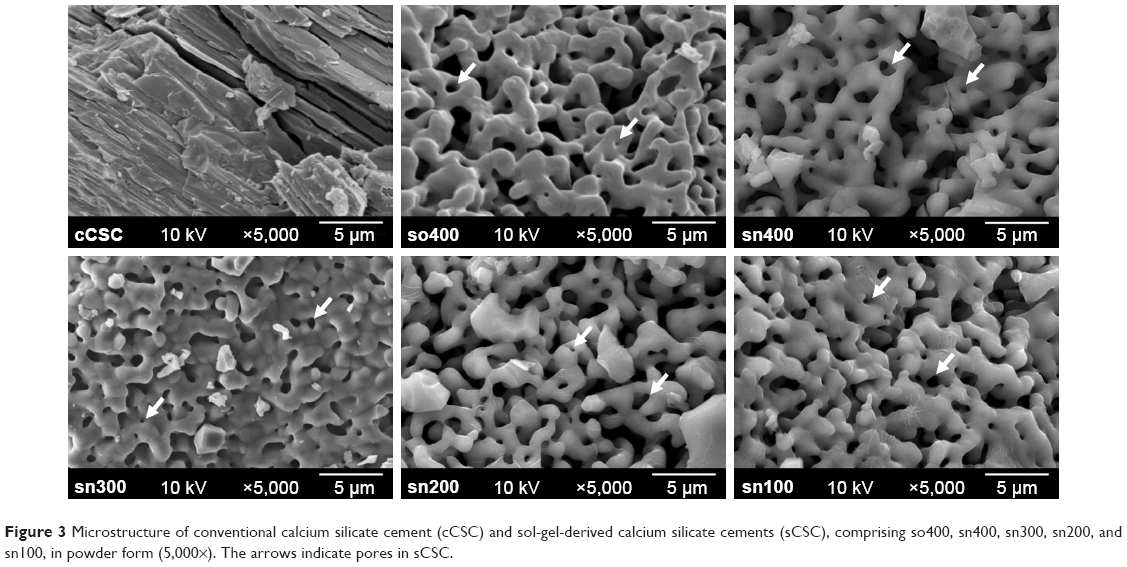 | Figure 3 Microstructure of conventional calcium silicate cement (cCSC) and sol-gel-derived calcium silicate cements (sCSC), comprising so400, sn400, sn300, sn200, and sn100, in powder form (5,000×). The arrows indicate pores in sCSC. |
Figure 4A shows XRD patterns of CSC powders. All of the CSCs presented several identical peaks related to C3S (ICDD 31-0301, 2θ=29.3°, 32.1°, 34.3°, 41.2°, 51.8°), C2S (ICDD 09-0351, 2θ=32°, 34.3°, 41.2°, 45.8°), and calcium oxide (CaO, ICDD 37-1497, 2θ=37.3°, 53.8°). Intensities of the peaks related to C3S and C2S were similar among all materials, but peak intensity related to residual CaO at 2θ=37.3° was significantly lower in all sCSCs compared with that of cCSC. Moreover, the volume of nitric acid used in the sol-gel process affected the peak intensity of CaO. The peak intensity was similar in so400, sn400, and sn300, but decreased significantly in sn200 and sn100.
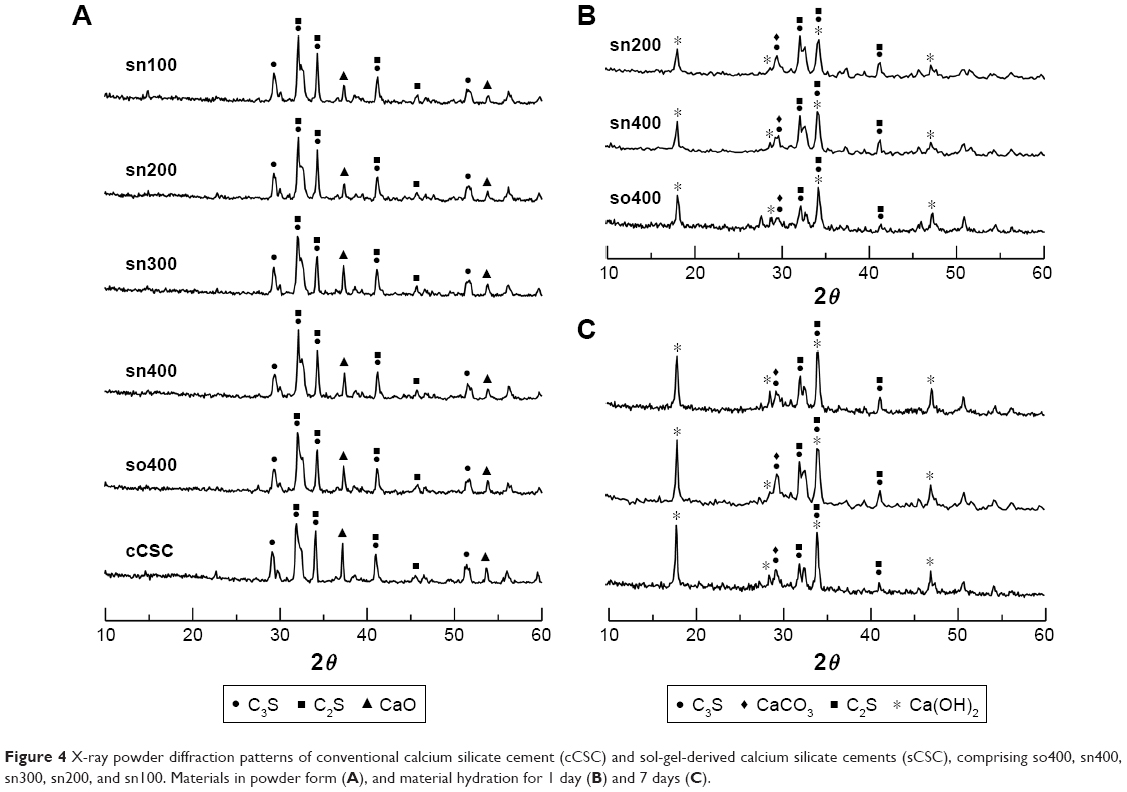 | Figure 4 X-ray powder diffraction patterns of conventional calcium silicate cement (cCSC) and sol-gel-derived calcium silicate cements (sCSC), comprising so400, sn400, sn300, sn200, and sn100. Materials in powder form (A), and material hydration for 1 day (B) and 7 days (C). |
Characterization of hydrated calcium silicate cements
Figure 4B and C shows XRD patterns of calcium silicate cements after hydration for 1 and 7 days, respectively. The hydrated sCSC presented a similar XRD pattern, and no significant differences in peak locations were observed among these materials. In the hydrated materials, the major peak intensity (2θ=32.1°) of C3S and C2S was noticeably reduced in the 7-day hydrated specimens compared with that of the 1-day hydrated specimens. In addition, several new peaks at 2θ=18°, 28.6°, 34.3°, and 47.1°, related to calcium hydroxide (portlandite, ICDD 44-1481), were found in the hydrated materials, and their intensities were noticeably increased in the 7-day hydrated specimens compared with those of the 1-day hydrated specimens. Furthermore, a peak at 2θ=29.4°, related to CaCO3 formation (calcite, ICDD 05-0586), slightly increased in intensity in the 7-day hydrated specimens compared with that of the 1-day hydrated specimens.
Figure 5 shows SEM micrographs of the fracture surfaces of the hydrated sCSC. After hydration for 1 day, so400, sn400, and sn200 all presented a similar microstructure comprising a granular mass with acicular features and multiple intergranular spaces (Figure 5A–C). For hydration from 1 to 7 days, the microstructures of so400 changed to a packed layer-like structure with some interstitial spaces covered by acicular crystals (Figure 5D). Unlike that of so400, microstructures of sn400 and sn200 were composed of well-crystalized masses with a few small pores (<1 μm) and some small acicular crystals forming a firm and packed structure (Figure 5E and F).
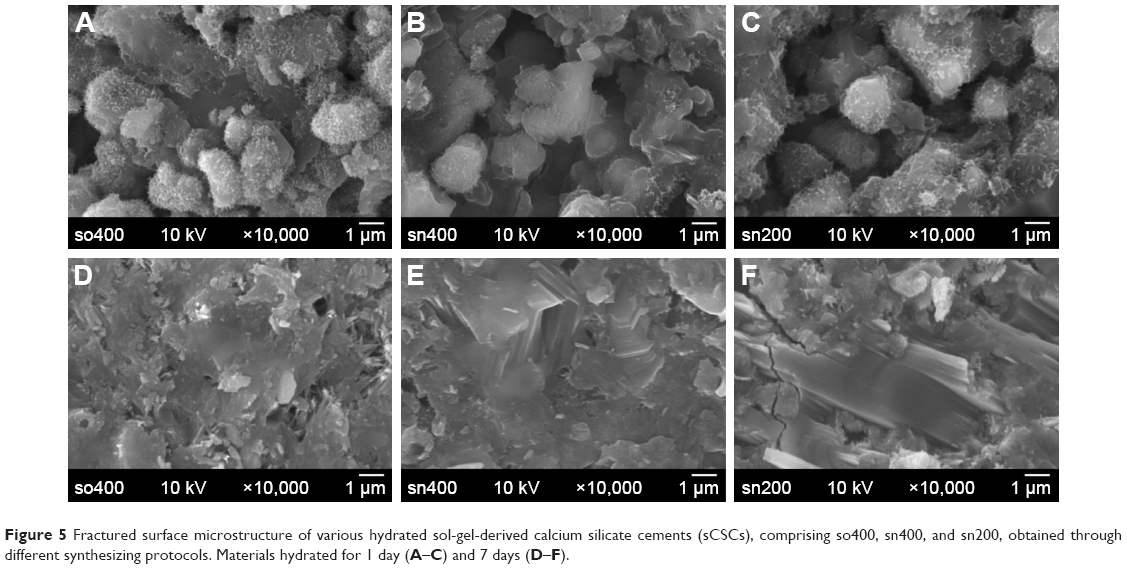 | Figure 5 Fractured surface microstructure of various hydrated sol-gel-derived calcium silicate cements (sCSCs), comprising so400, sn400, and sn200, obtained through different synthesizing protocols. Materials hydrated for 1 day (A–C) and 7 days (D–F). |
Setting time, compressive strength, and microhardness tests
Figure 6A shows the setting time of sCSC and the two commercial MTAs. Compared with the long setting time of GMTA (114.00±5.48 min) and WMTA (172.00±8.37 min), a significantly reduced setting time (p<0.05) for sCSC was found in so400 (37.00±5.61 min), sn400 (28.60±5.13 min), and sn200 (33.40±2.41 min). There was no significant difference in setting times among so400, sn400, and sn200 (p>0.05).
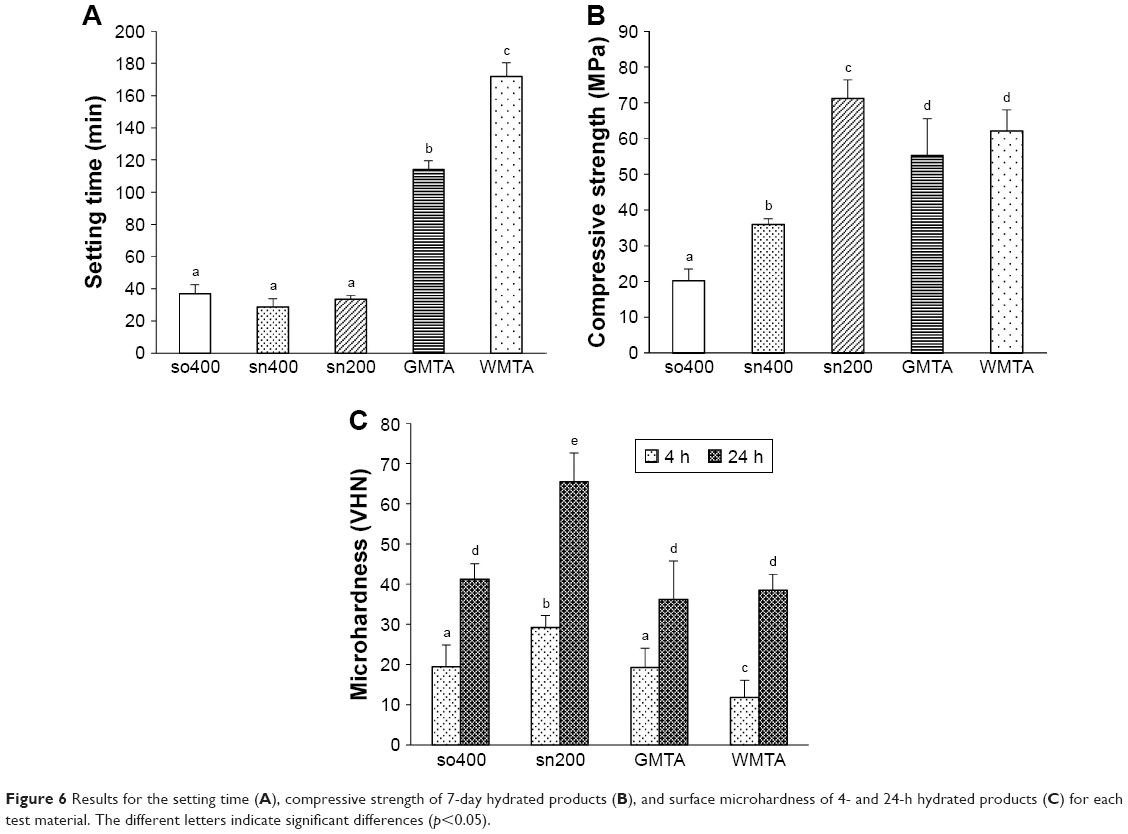 | Figure 6 Results for the setting time (A), compressive strength of 7-day hydrated products (B), and surface microhardness of 4- and 24-h hydrated products (C) for each test material. The different letters indicate significant differences (p<0.05). |
Figure 6B shows the compressive strengths of sCSC and MTAs after hydration for 7 days. The lowest compressive strength was found in so400 (20.21±3.26 MPa), which was significantly lower (p<0.001) than those of sn400, sn200, and the two commercial MTAs. The highest compressive strength was found in sn200 (71.22±5.11 MPa), which was significantly higher (p<0.05) than those of GMTA (55.25±10.33 MPa) and WMTA (62.04±5.95 MPa). No significant difference was observed between GMTA and WMTA (p=0.204).
Figure 6C shows the microhardnesses of sCSC and MTAs after hydration for 4 and 24 h. Compared with so400 and the two commercial MTAs, sn200 presented the highest microhardness values with a significant difference (p<0.001), in both the 4-h (29.19±2.99 Vicker hardness number [VHN]) and 24-h (65.47±7.12 VHN) hydrated specimens. In the 4-h hydrated specimens, WMTA (11.84±4.20 VHN) presented the lowest microhardness with a significant difference (p<0.05) compared with those of GMTA (19.28±4.76 VHN) and so400 (19.44±5.40 VHN). In the 24-h hydrated specimens, the microhardness of so400 (41.20±3.93 VHN) was slightly higher than those of WMTA (38.51±3.91 VHN) and GMTA (36.19±9.57 VHN) without a significant difference (p>0.05).
Effects of the acidic environment on compressive strength and microhardness of cements
Figure 7A shows the compressive strengths of sn200, GMTA, and WMTA hydrated in a pH 5 environment for 7 days. sn200 (72.74±9.30 MPa) presented the highest compressive strength, with a significant difference (p<0.001) compared with those of GMTA (54.62±8.82 MPa) and WMTA (52.30±13.51 MPa). The compressive strengths of sn200 and GMTA hydrated under neutral conditions were similar to those of sn200 and GMTA hydrated under pH 5 conditions. However, WMTA hydrated under pH 5 conditions presented a lower compressive strength compared with hydration under neutral conditions. The compressive strengths of these three materials did not differ significantly between the two hydration conditions (p>0.812).
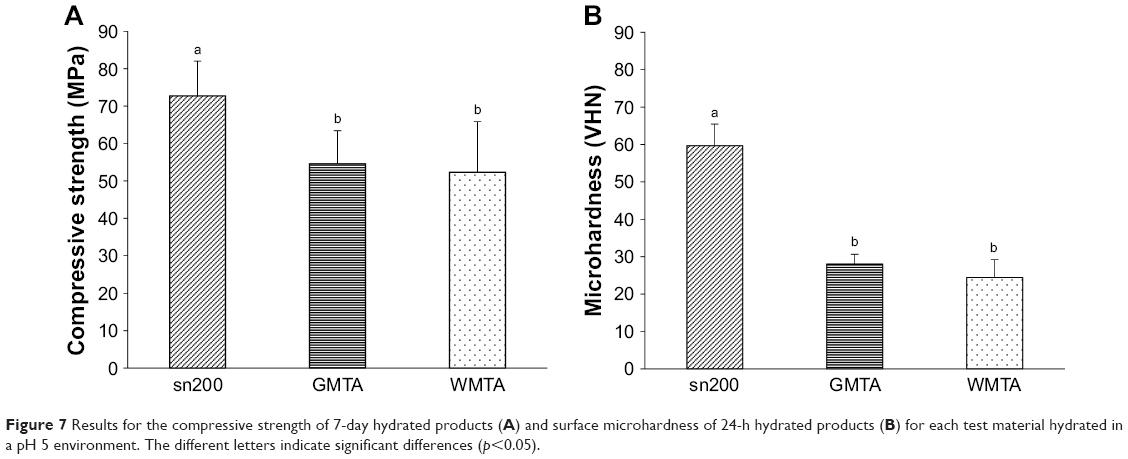 | Figure 7 Results for the compressive strength of 7-day hydrated products (A) and surface microhardness of 24-h hydrated products (B) for each test material hydrated in a pH 5 environment. The different letters indicate significant differences (p<0.05). |
Figure 7B shows the microhardnesses of sn200, GMTA, and WMTA hydrated in a pH 5 environment for 24 h. sn200 (59.69±5.76 VHN) presented the highest microhardness value with a significant difference (p<0.001) compared with GMTA (28.05±2.62 VHN) and WMTA (24.47±4.75 VHN). Unlike similar microhardness values (p=0.788) found in sn200 hydrated under neutral or pH 5 conditions, the pH 5 environment significantly reduced the microhardness of GMTA (p=0.02) and WMTA (p<0.001).
Cytotoxicity
Figure 8 shows the cytotoxicity results of the test materials. Cell viabilities of so400 (98.83%±3.96%), sn200 (98.75%±2.72%), and GMTA (96.42%±5.44%) exhibited similar biocompatibility to that of the control group (p>0.05). WMTA presented a slightly lower cell viability (90.87%±5.81%) with a significant difference to that of the control group (p=0.02), which did not differ significantly from that of GMTA, so400, or sn200 (p>0.05). Amalgam, used as a reference for toxic materials, presented a much lower cell viability (31.79%±6.59%) than the other groups (p<0.05).
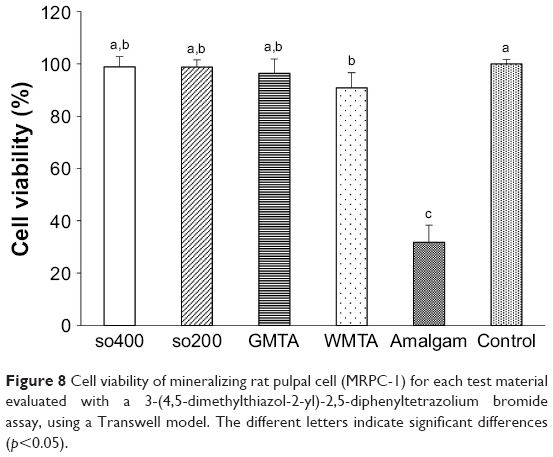 | Figure 8 Cell viability of mineralizing rat pulpal cell (MRPC-1) for each test material evaluated with a 3-(4,5-dimethylthiazol-2-yl)-2,5-diphenyltetrazolium bromide assay, using a Transwell model. The different letters indicate significant differences (p<0.05). |
Discussion
The sol-gel process can improve surface characteristics and chemical homogeneity. Further, the results of this study demonstrated that sCSC had smaller particles and a more porous microstructure than cCSC (Figure 3). In addition, sCSC contained a smaller amount of CaO than cCSC (Figure 4A), indicating that sCSC exhibited higher surface energy and was more homogeneous than cCSC. The sol-gel process is well known as involving hydrolysis and condensation of reactants followed by gelation. The mixing order of reactants and catalyst volumes plays a major role in this process. However, their effects on the properties of sCSC are yet to be investigated.
Because TEOS is a hydrophobic silica precursor, hydrolysis was required to transform the hydrophobic TEOS to a water-soluble silicate species for reacting with Ca2+ ions to form a homogeneous calcium silicate. In Protocol A, the hydrophobic TEOS was mixed with Ca(NO3)2·4H2O before the addition of nitric acid. Because of the high concentration of the Ca(NO3)2·4H2O aqueous solution, the salting-out effect of the Ca(NO3)2 solution would enhance the phase separation of the TEOS and water, and thus hinder the hydrolysis reaction of the hydrophobic TEOS.23 By contrast, the addition of nitric acid with a salting-in effect to react with TEOS prior to the addition of Ca(NO3)2·4H2O, as used in Protocol B, could enhance TEOS hydrolysis. In Protocol B, the TEOS was pre-hydrolyzed in the nitric acid, and the resultant water-soluble silicate species could co-condense with the calcium ion to form homogeneous calcium silicate. Owing to the slow hydrolysis of the TEOS, the yield of the prepared calcium silicate from Protocol A was only about half of that from Protocol B. In addition, EDS data revealed that the so400 sample exhibited a higher Ca/Si molar ratio (3.30), compared with that of the sn400 sample from Protocol B (2.64). Moreover, FTIR spectra demonstrated that the O-Si-O/Si-O-Si bending mode, O-Si-O and Si-O-Si stretching modes, and Si-O-Ca vibration mode were more prominent in sn400 and sn200 than in so400. The EDS results, furthermore, showed that the Ca/Si molar ratios increased with the decrease in the volume of the nitric acid. The increase in the volume of nitric acid could have caused faster TEOS hydrolysis, with more silicate involved in the gel formation with calcium ions. Consequently, sn400 exhibited a slightly lower Ca/Si molar ratio (2.64) than the sn200 sample (3.59). In addition, the self-condensation rate of silica may have accelerated with the increase of [H+] concentration.9
The mixing order of reactants did not affect the porous characteristics of sCSC (Figure 3). The structure of the product derived from the sol-gel process was related to the pH value and the presence of flocculating salts during the polymerization process.9 The silica-condensation process was divided into three pH domains: <pH 2, pH 2–7, and >pH 7.24 The isoelectric point of the silica was in the range of pH 1–3. The solubility of silica below pH 2 was rather low, and the silicate species were not highly ionized at pH 0–2. Small-sized particles formed and aggregated into three-dimensional porous gel networks.24 In this study, the pH values of the solution were measured using a pH meter, and the pH values of all solutions, irrespective of using Protocol A or B, were <1, except the solution of sn100, which was 1.06. Therefore, both protocols produced sCSC with a porous structure (Figure 3).
The setting time of sCSC was significantly shorter than those of GMTA and WMTA (Figure 6A). Several factors affected the setting time, but the decisive factors in this study were the particle size and particle structure. The sCSC particles were not only much smaller than GMTA and WMTA, but the porous characteristics of sCSC also provided a large surface area for chemical reaction, which contributed to fast dissolution and recrystallization during hydration. Therefore, all sCSCs presented a significantly reduced setting time compared to the commercial MTAs.
The fast setting did not accordingly result in high compressive strength (Figure 6B). Lower compressive strength was found in so400 and sn400 compared to the MTAs with longer setting times. The MTAs contained not only C3S/C2S but also other components, such as tricalcium aluminate, calcium aluminoferrate, and a small amount of mineral oxides, that are conducive to solidification and high compressive strength.12,25 Therefore, the MTAs exhibited significantly higher compressive strength than so400 and sn400 – in which the major components were C3S and C2S, with a small amount of CaO (Figure 4A). Nevertheless, the microhardness of so400 was not lower than that of the MTAs (Figure 6C). Because the microhardness was measured at 4 and 24 h after hydration, the small particle size and porous structure of so400 contributed to the rapid formation of calcium silicate hydrates, which could have caused greater microhardness, comparable to that of the MTAs. To meet the requirement of minimum radiopacity of materials for dental applications, 20% bismuth oxide was added to the MTAs, which may have lowered the mechanical strength of hydrated MTAs. Although a higher compressive strength was found in sn200 compared to the MTAs in this study, detrimental effects of radiopaque fillers on the mechanical properties of the sCSC system for clinical applications should be considered.
The hydration reaction of the calcium silicate cements began from the dissolution of C3S/C2S in water, followed by the precipitation of Ca+2, silicate gel, and OH− ions from the solution to form calcium silicate hydrates (C-S-H) and portlandite as the major products.12,26 Moreover, C-S-H were mostly amorphous and presented variability in their structure and composition, which was influenced by the Ca/Si of C3S or C2S and the solution [Ca+2] and [H+] in hydration.12,27 Compared with so400 and sn400, sn200 contained higher purity of C3S/C2S, with a smaller amount of CaO as a by-product (Figure 4A). The higher purity of C3S/C2S in sn200 contributed to a slightly higher Ca/Si ratio (3.59) and may have altered the composition of C-S-H to form a more compact microstructure in comparison with that of so400 and sn400 with a Ca/Si of 2.64–3.30. Therefore, sn200 exhibited significantly higher compressive strength and microhardness than so400 and sn400.
One of the major drawbacks of MTA is a long setting time, and many commercial products have been developed to overcome this problem. For example, Biodentine is frequently used to replace MTA by using CaCl2 as an accelerator. The setting time, compressive strength, and Vickers hardness of Biodentine were 45 min, 67.18 MPa, and 48.4 VHN, respectively.28 The corresponding values of sn200 were 33.40 min, 71.22 MPa, and 69.01 VHN, respectively, indicating that sn200 exhibited a shorter setting time and higher mechanical strength than Biodentine.
Root or furcation perforations often accompany tissue inflammation and may lower the tissue pH near the involved root to ~5.5, which affects the physicochemical properties of MTA.29,30 To simulate the clinical acidic environment, a pH 5 solution was prepared to evaluate the effect of this environment on the compressive strength and microhardness of sn200 and MTAs.7 Because sn200 exhibited the advantage of a short setting time that could reduce the impact of the H+ attack,31 the acidic environment did not influence compressive strength and microhardness (Figure 7). In addition, a significantly higher compressive strength and microhardness of sn200 compared with the MTAs in the acidic condition indicated that sn200 is potentially superior to MTAs in the case of furcation perforations because occlusal forces can be directly transmitted to the applied cement.32 The microhardness of the MTAs decreased significantly in an acidic environment owing to their long setting time. However, the compressive strength of the MTAs was not significantly influenced. The compressive strength was related to the whole material structure, whereas microhardness only measured surface strength. The acidic environment influenced the surface crystal formation of the MTAs, but crystal growth in the interior was not affected. Therefore, the microhardness of the MTAs decreased prominently, but compressive strength was less affected.
Cell viability results revealed no significant differences among so400, sn200, GMTA, and the control groups (Figure 8). sn200 is a biocompatible material and has characteristics of a short setting time and high compressive strength and hardness. In addition, the compressive strength and hardness were only slightly affected by an acidic environment, indicating that sn200 can potentially be applied in endodontic repair of perforations. Additional studies are required to evaluate whether sn200 has the same ability as MTA to induce apatite precipitation on surfaces, and clinical trials are necessary to validate its clinical efficacy.
Conclusion
In this study, a novel sCSC called sn200 was developed for endodontic repair application with an initial Ca/Si molar ratio of 3, the most effective mixing order of reactants, and optimal HNO3 catalyst volume. The sCSC demonstrated porous microstructures with setting times of ~30 min. In addition, it exhibited significantly higher compressive strength and microhardness than MTA, irrespective of a neutral or pH 5 environment. In addition, both sn200 and MTA demonstrated good biocompatibility because the cell viability was similar to the control. These findings suggest that sn200 merits further clinical study for potential application in endodontic repair of perforations.
Acknowledgments
The authors thank the Eighth Core Laboratory of the Department of Medical Research, National Taiwan University Hospital, for technical support. This research was supported by the Ministry of Science and Technology, Republic of China (grant nos MOST104-2314-B-002-141-MY2 and MOST103-2314-B-002-098). The authors thank Prof Helena H Ritchie for the kind gift of MRPC-1 cells.
Disclosure
The authors report no conflicts of interest in this work.
References
Hilton TJ, Ferracane JL, Mancl L; Northwest Practice-based Research Collaborative in Evidence-based Dentistry (NWP). Comparison of CaOH with MTA for direct pulp capping: a PBRN randomized clinical trial. J Dent Res. 2013;92(7 Suppl):16S–22S. | ||
Mente J, Hage N, Pfefferle T, et al. Treatment outcome of mineral trioxide aggregate: repair of root perforations. J Endod. 2010;36(2):208–213. | ||
Tang Y, Li X, Yin S. Outcomes of MTA as root-end filling in endodontic surgery: a systematic review. Quintessence Int. 2010;41(7):557–566. | ||
Torabinejad M, Parirokh M. Mineral trioxide aggregate: a comprehensive literature review – part II: leakage and biocompatibility investigations. J Endod. 2010;36(2):190–202. | ||
Parirokh M, Torabinejad M. Mineral trioxide aggregate: a comprehensive literature review – part I: chemical, physical, and antibacterial properties. J Endod. 2010;36(1):16–27. | ||
Camilleri J, Sorrentino F, Damidot D. Investigation of the hydration and bioactivity of radiopacified tricalcium silicate cement, Biodentine and MTA Angelus. Dent Mater. 2013;29(5):580–593. | ||
Lee YL, Lee BS, Lin FH, Yun Lin A, Lan WH, Lin CP. Effects of physiological environments on the hydration behavior of mineral trioxide aggregate. Biomaterials. 2004;25(5):787–793. | ||
Krupp C, Bargholz C, Brüsehaber M, Hülsmann M. Treatment outcome after repair of root perforations with mineral trioxide aggregate: a retrospective evaluation of 90 teeth. J Endod. 2013;39(11):1364–1368. | ||
Brinker CJ, Scherer GW. Sol-Gel Science: the Physics and Chemistry of Sol-Gel Processing. Boston: Academic Press; 1990. | ||
Gvishi R. Monolithic sol–gel materials. In: Levy D, Zayat M, editors. The Sol-Gel Handbook – Synthesis, Characterization, and Applications: Synthesis, Characterization and Applications. Weinheim, Germany: Wiley-VCH; 2015:317–344. | ||
Saravanapavan P, Hench LL. Mesoporous calcium silicate glasses. I. Synthesis. J Non-Cryst Solids. 2003;318(1–2):1–13. | ||
Bye GC. Portland Cement: Composition, Production, and Properties. Oxford Oxfordshire; New York: Pergamon Press; 1983. | ||
Meiszterics A, Sinkó K. Sol–gel derived calcium silicate ceramics. Colloids Surf A. 2008;319(1–3):143–148. | ||
Zhao W, Wang J, Zhai W, Wang Z, Chang J. The self-setting properties and in vitro bioactivity of tricalcium silicate. Biomaterials. 2005;26(31):6113–6121. | ||
Zhao W, Chang J. Sol–gel synthesis and in vitro bioactivity of tricalcium silicate powders. Mater Lett. 2004;58(19):2350–2353. | ||
Lin FH, Wang WH, Lin CP. Transition element contained partial-stabilized cement (PSC) as a dental retrograde-filling material. Biomaterials. 2003;24(2):219–233. | ||
Makar JM, Sato T. The effect of drying method on ordinary Portland cement surfaces during the early stages of hydration. Mater Struct. 2013;46(1):1–12. | ||
International Organization for Standardization. ISO-6876: Dental Root Canal Sealing Materials. Geneva: International Organization for Standardization; 2001. | ||
International Organization for Standardization. ISO-9917-1: Dentistry-Water-Based Cements – Part 1: Powder/Liquid Acid-Base Cements. Geneva: International Organization for Standardization; 2007. | ||
Lan WH, Lan WC, Wang TM, et al. Cytotoxicity of conventional and modified glass ionomer cements. Oper Dent. 2003;28(3):251–259. | ||
Lundquist P, Ritchie HH, Moore K, Lundgren T, Linde A. Phosphate and calcium uptake by rat odontoblast-like MRPC-1 cells concomitant with mineralization. J Bone Miner Res. 2002;17(10):1801–1813. | ||
Lippincott ER, Van Valkenburg A, Weir CE, Bunting EN. Infrared studies on polymorphs of silicon dioxide and germanium dioxide. J Res Nat Bur Stand. 1958;61(1):61–70. | ||
Ebrahimi N, Sadeghi R. Salting-out effect in polypropylene glycol-amino acid aqueous solutions revealed by vapor pressure osmometry. Fluid Phase Equilibr. 2016;425:237–243. | ||
Iler RK. The Chemistry of Silica: Solubility, Polymerization, Colloid and Surface Properties, and Biochemistry. New York: John Wiley & Sons; 1979. | ||
Torabinejad M, White DJ, inventors; Loma Linda University, assignee. Tooth filling material and method of use. United States patent US 5769638 A. 1998 Jun 23. | ||
Setbon HM, Devaux J, Iserentant A, Leloup G, Leprince JG. Influence of composition on setting kinetics of new injectable and/or fast setting tricalcium silicate cements. Dent Mater. 2014;30(12):1291–1303. | ||
Cong X, Kirkpatrick RJ. 29Si MAS NMR study of the structure of calcium silicate hydrate. Adv Cem Based Mater. 1996;3(3–4):144–156. | ||
Grech L, Mallia B, Camilleri J. Investigation of the physical properties of tricalcium silicate cement-based root-end filling materials. Dent Mater. 2013;29(2):e20–e28. | ||
Malamed SF. Local anesthetic considerations in dental specialities. In: Malamed SF, editor. Handbook of Local Anesthesia. St. Louis, MI Mosby and Elsevier; 2013. | ||
Elnaghy AM. Influence of acidic environment on properties of biodentine and white mineral trioxide aggregate: a comparative study. J Endod. 2014;40(7):953–957. | ||
Gandolfi MG, Iacono F, Agee K, et al. Setting time and expansion in different soaking media of experimental accelerated calcium-silicate cements and ProRoot MTA. Oral Surg Oral Med Oral Pathol Oral Radiol Endod. 2009;108(6):e39–e45. | ||
Hashem AA, Wanees Amin SA. The effect of acidity on dislodgment resistance of mineral trioxide aggregate and bioaggregate in furcation perforations: an in vitro comparative study. J Endod. 2012;38(2):245–249. |
 © 2018 The Author(s). This work is published and licensed by Dove Medical Press Limited. The full terms of this license are available at https://www.dovepress.com/terms.php and incorporate the Creative Commons Attribution - Non Commercial (unported, v3.0) License.
By accessing the work you hereby accept the Terms. Non-commercial uses of the work are permitted without any further permission from Dove Medical Press Limited, provided the work is properly attributed. For permission for commercial use of this work, please see paragraphs 4.2 and 5 of our Terms.
© 2018 The Author(s). This work is published and licensed by Dove Medical Press Limited. The full terms of this license are available at https://www.dovepress.com/terms.php and incorporate the Creative Commons Attribution - Non Commercial (unported, v3.0) License.
By accessing the work you hereby accept the Terms. Non-commercial uses of the work are permitted without any further permission from Dove Medical Press Limited, provided the work is properly attributed. For permission for commercial use of this work, please see paragraphs 4.2 and 5 of our Terms.