Back to Journals » International Journal of General Medicine » Volume 15
A Novel Pyroptosis-Related Prognostic Signature for Cervical Squamous Cell Carcinoma
Authors Ou T, Wei Y, Long Y, Pan X, Yao D ![]()
Received 20 December 2021
Accepted for publication 11 February 2022
Published 24 February 2022 Volume 2022:15 Pages 2057—2073
DOI https://doi.org/10.2147/IJGM.S353576
Checked for plagiarism Yes
Review by Single anonymous peer review
Peer reviewer comments 3
Editor who approved publication: Dr Scott Fraser
Tingyu Ou,1,2 Yousheng Wei,1 Ying Long,1 Xinbin Pan,3 Desheng Yao1
1Department of Gynecologic Oncology, Guangxi Medical University Cancer Hospital, Nanning, Guangxi, People’s Republic of China; 2Department of Gynecology, The Third Affiliated Hospital of Guangxi Medical University, Nanning, Guangxi, People’s Republic of China; 3Department of Radiation Oncology, Guangxi Medical University Cancer Hospital, Nanning, Guangxi, People’s Republic of China
Correspondence: Desheng Yao, Email [email protected]
Purpose: Pyroptosis has vital roles in tumorigenesis and cancer development; however, its relationship with cervical squamous cell cancer (CSCC) remains unexplored. In this study, we aimed to develop a CSCC prediction signature related to pyroptosis.
Patients and Methods: Consensus clustering analysis was conducted to detect pyroptosis-related subclusters for CSCC. Next, differentially expressed genes (DEGs) between subclusters were identified. Univariate, least absolute shrinkage and selection operator, and stepwise multivariate Cox regression analyses were applied to establish a prognostic model and a nomogram drawn. Additionally, functional enrichment analysis, tumor mutation burden, and immune characteristics associated with this signature were investigated.
Results: We constructed a seven-gene signature that functions as an independent predictor of prognosis in CSCC using data from The Cancer Genome Atlas. Patients with CSCC were divided into two groups based on median risk score, and patients in the low-risk group had significantly longer survival time than those in the high-risk group. Our findings were validated using Gene Expression Omnibus cohort data. We also established a nomogram, to expand the clinical applicability of our findings. The seven gene signature was associated with various molecular pathways, tumor mutation status, and immune microenvironment.
Conclusion: The pyroptosis-related risk signature consisting of seven genes developed here represents a potential robust biomarker for predicting prognosis and immunotherapy response in patients with CSCC.
Keywords: pyroptosis, cervical squamous cell carcinoma, prognosis, immune microenvironment, nomogram
Introduction
Cervical cancer (CC) is the fourth most frequently diagnosed cancer and the fourth leading cause of cancer death in women, representing a major global health concern. Despite the promotion of human papillomavirus (HPV) vaccination and screening programs, there were an estimated 604,000 new cases and 342,000 deaths from CC worldwide in 2020, most of which occurred in developing and underdeveloped countries.1 Persistent infection with high-risk HPV is a major pathogenic factor in development of CC.2 Squamous cell carcinoma accounts for 80% of all CC tumors.3 The main treatments for CC consist of surgery, chemotherapy, and radiotherapy. Although patients with early-stage tumors usually can be successfully managed using modern therapies, their condition can deteriorate because of recurrent or metastatic disease, which continue have poor prognosis.4 Given the lack of precise diagnostic markers and the limited treatment options, novel prognostic models or innovative biomarkers are urgently required to guide targeted therapies and improve the clinical outcomes of patients with CC.
Cell death plays critical roles in regulating cell proliferation, maintaining cellular homeostasis, and tumor progression. Pyroptosis is a newly-discovered form of lytic programmed cell death triggered by inflammasomes, and is distinct from autophagy and apoptosis.5 Pyroptotic cell death results in cell swelling with ballooning bubbles, plasma membrane perforation, chromatin fragmentation, and efflux of intracellular active compounds, accompanied by immune cell infiltration and inflammatory responses.6,7 Recent studies have identified caspases as executors and gasdermins (GSDMs) as key effectors during the pyroptosis process.8,9 The caspase-1-dependent canonical pathway is mediated by inflammasome assembly, along with GSDMD cleavage and IL-1β and IL-18 release. Inflammasomes and their related cytokines are thought to participate in oncogenesis.10,11 In the non-canonical pathway, human caspase-4/5 (mouse ortholog, caspase-11) can be activated by directly binding to intracellular lipopolysaccharide through the N-terminal caspase recruitment domain.12 Furthermore, other alternative pathways involving caspase-3/GSDME, caspase-8/GSDMC, granzyme-B/GSDME, and granzyme-A/GSDMB have been confirmed to induce pyroptosis.13–16 The relationship between pyroptosis and cancer is complex, and the effects of pyroptosis on cancer vary in different tissues and genetic backgrounds. Pyroptosis can inhibit the occurrence and development of tumors, but it can also form a suitable microenvironment for promoting tumor development.17 To date, some pyroptosis-related signatures for predicting prognosis have been developed in different tumor types, including ovarian cancer,18 gastric cancer,19 lung adenocarcinoma,20 and head and neck squamous cell carcinoma;21 however, the role of pyroptosis in cervical squamous cell carcinoma (CSCC) requires further study.
In the current study, we developed a novel prognostic signature, based on differentially expressed genes (DEGs) between pyroptosis-related subclusters, and investigated its relationship with clinicopathological features and overall survival (OS) of patients with CSCC. In addition, signaling pathways, tumor immune microenvironment (TIME), tumor mutation burden (TMB), and immunotherapy response associated with the signature in CSCC, were explored. This study provides better understanding of the mechanism underlying pyroptosis and more precise prognostic targets for patients with CSCC.
Materials and Methods
Data Acquisition
RNA sequence transcriptome data, somatic mutation data, and relevant clinical information from 255 patients with CSCC and 2 normal adjacent tissue samples were obtained from The Cancer Genome Atlas (TCGA) database (https://portal.gdc.cancer.gov/). For external validation, RNA sequencing data and clinical information from 37 patients with CSCC were downloaded from the GEO database (https://www.ncbi.nlm.nih.gov/geo/, GSE30759). Only patients with pathologically confirmed CSCC were included in this study; all other pathologic types were excluded. R (version 4.1.2) package “sva” was used to normalized gene expression data for further analyses.
Identification of Differentially Expressed Pyroptosis-Related Genes
Based on the findings of previous studies,17,22–24 52 pyroptosis-related genes (PRGs) were extracted and their mRNA expression levels compared between CSCC and normal adjacent tissue samples in TCGA cohort. Differentially expressed PRGs were identified using the “limma” package, with P < 0.05 as the significance threshold, and presented as a heatmap. A protein-protein interaction (PPI) network of pyroptosis-related DEGs was constructed using Search Tool for the Retrieval of Interacting Genes (STRING), version 11.5 (https://string-db.org/). In addition, a correlation network of pyroptosis-related DEGs was constructed (interaction score cutoff = 0.2).
Consensus Clustering
The “ConsensuClusterPlus” R package (parameters: clustering algorithm, k-means; distance, Euclidean) was applied, with 1000 iterations.25 The optimal k value was confirmed, according to cumulative distribution function and delta area values, and patients with CSCC then classified into different clusters, based on differentially expressed PRGs.
Identification of Differentially Expressed Genes Between Clusters
The “limma” R package was used to identify DEGs between different pyroptosis-related clusters, with a threshold of |log2FC| ≥ 1 and P < 0.05. Intersecting DEGs were assembled in both TCGA and GEO cohorts.
Development and Validation of Prognostic Signature
Combined with survival information, PRGs in TCGA cohort data were initially screened using univariate Cox regression (P < 0.01). Next, the R package “glmnet” was used to conduct Least absolute shrinkage and selection operator (LASSO) Cox regression, to minimize overfitting.26 Finally, stepwise multivariate Cox regression was performed to converge variables and build a risk signature based on these optimal genes. Risk scores for each patient were calculated according to the following formula:
Risk score = ∑Coefgene × Expgenes
where Coefgene represents the coefficient of each prognostic gene and Expgenes represents the expression level of each gene. Patients were assigned to low- and high-risk groups according to the cutoff median risk score.
Principal component analysis (PCA) was performed for effective dimensionality reduction, model recognition, and grouping visualization of overall expression profiles.
Kaplan–Meier curves were constructed using the “survival” R package. In addition, area under the receiver operating characteristic (ROC) curve (AUC) values were calculated using the R package “survivalROC”, to assess the prognostic value of the pyroptosis-related signature. Data from the GSE30759 GEO cohort were integrated and analyzed according to the formula and risk scores, as an external validation dataset.
Establishment and Evaluation of a Predictive Nomogram
Univariate and multivariate Cox proportional hazard regression analyses were conducted to test whether prognosis was influenced by independent variables, including clinicopathologic characteristics (age, grade, clinical stage) and risk scores in both TCGA and GEO cohorts. Independent prognostic factors were selected to construct a nomogram27 using TCGA dataset, to evaluate the 1-, 3-, and 5-year survival probability. Subsequently, a calibration curve was generated using the “rms” R package, to illustrate the consistency between actual outcomes and model predictions. Concordance (C)-index values were calculated using the “Hmisc” R package to validate the predictive ability of the signature.28 Further, Decision Curve Analysis (DCA) was applied to evaluate the reliability of the model.
Functional Enrichment Analysis
Gene set variation analysis (GSVA) was conducted using the “GSVA” R package to explore potential molecular mechanisms that differed among pyroptosis-related clusters. The Hallmark gene set “c2.cp.kegg.v7.4.symbols.gmt”, retrieved from the MSigDB database (http://www.gsea-msigdb.org), was applied in GSVA. All CSCC samples were stratified into two subgroups. DEGs between high- and low-risk groups were filtered based on a threshold of |log2FC| ≥ 1 and P < 0.05, and subjected to gene ontology (GO) and Kyoto Encyclopedia of Genes and Genomes (KEGG) analyses using the “clusterProfiler” R package.
Mutation Analysis
Somatic variant data from TCGA CSCC patients were stored in Mutation Annotation Format and analyzed and summarized using maftools.29 Mutation data included the total number of genetic coding errors, base substitutions, and gene insertions or deletions. For each sample, the total number of mutations identified in the exome content were used to compute the TMB per megabase via Perl (version 5.34.0, https://www.perl.org/).
Estimation of Infiltrating Immune Cells and Immune Microenvironment Characteristics
To estimate immune cell infiltrating status, single sample gene set enrichment analysis (ssGSEA) was conducted to calculate infiltrating immune cell scores and immune-related pathway activity using the “GSVA” R package.
Estimation of STromal and Immune cells in MAlignant Tumor tissues using Expression data (ESTIMATE) is an approach used to deduce the proportion of non-tumor constituents in tumor samples.30 To investigate relationships with the risk signature, TIME, stromal score, immune-score, tumor-purity, and ESTIMATE-scores were calculated from CSCC data using ESTIMATE.
Immunophenoscore (IPS) values can be derived without bias using machine learning, based on the expression of the four major determinants: major histocompatibility complex (MHC) molecules, effector cells (EC), immune checkpoints (CP), and immunosuppressive cells (SC). Higher scores are associated with increased immunogenicity.31 The IPS values of patients with CSCC were retrieved from The Cancer Immunome Atlas (https://tcia.at/home) and compared between the high- and low-risk groups.
Results
Identification of Pyroptosis-Related DEGs Between Normal and CSCC Tissues
Fifty-two PRGs were identified (Supplementary Table 1), based on published data, and their RNA expression levels compared in TCGA data from 255 CSCC and 2 normal adjacent tissue samples. We identified 20 differentially expressed PRGs, using a threshold of P < 0.05, of which 18 (BAK1, BAX, CASP3, CHMP4C, CYCS, GZMB, IL18, TP53, TP63, AIM2, CASP6, CASP8, GSDMB, GSDMC, NLRP7, NOD2, PYCARD, and TNF) were upregulated and 2 (CHMP6 and ELANE) were downregulated in tumor tissues (Figure 1A). A PPI network was constructed using a minimum confidence value of 0.7 (high confidence), and CASP8, TP53, CASP3, CYCS, TNF were identified as the top 5 hub molecules (Figure 1B). A correlation network containing all PRGs is presented in Figure 1C (interaction score cutoff = 0.2).
 |
Figure 1 Expressions of the 20 pytoptosis-related genes and the interactions among them. (A) The heatmap showed the 20 pytoptosis-related genes in tumor and normal adjacent tissues. P values were showed as: *P < 0.05. (B) PPI network indicated the interactions of the pyroptosis-related genes. (C) The correlation network of the pyroptosis-related genes (red: positive correlations; blue: negative correlations). |
Consensus Clustering Based on Pyroptosis-Related DEGs
To explore the relationships between CSCC subtypes and expression of the 20 pyroptosis-related DEGs, consensus clustering analysis was performed to classify tumors according to expression levels of pyroptosis-related DEGs. Clustering variable (k) values from 2 to 9 were applied; when k = 2, intragroup correlations were low. Hence, patients with CSCC could be divided into two different subtypes, including 206 cases in cluster 1 and 47 cases in cluster 2 (Figure 2A), and there was a significant difference in OS time between the two groups (P = 0.025) (Figure 2B). Further, we conducted GSVA KEGG enrichment analysis to investigate the biological characteristics of the distinct clusters (Figure 2C). Cluster 2 showed enrichment for pathways in cancer, including bladder, thyroid, and small cell lung cancers.
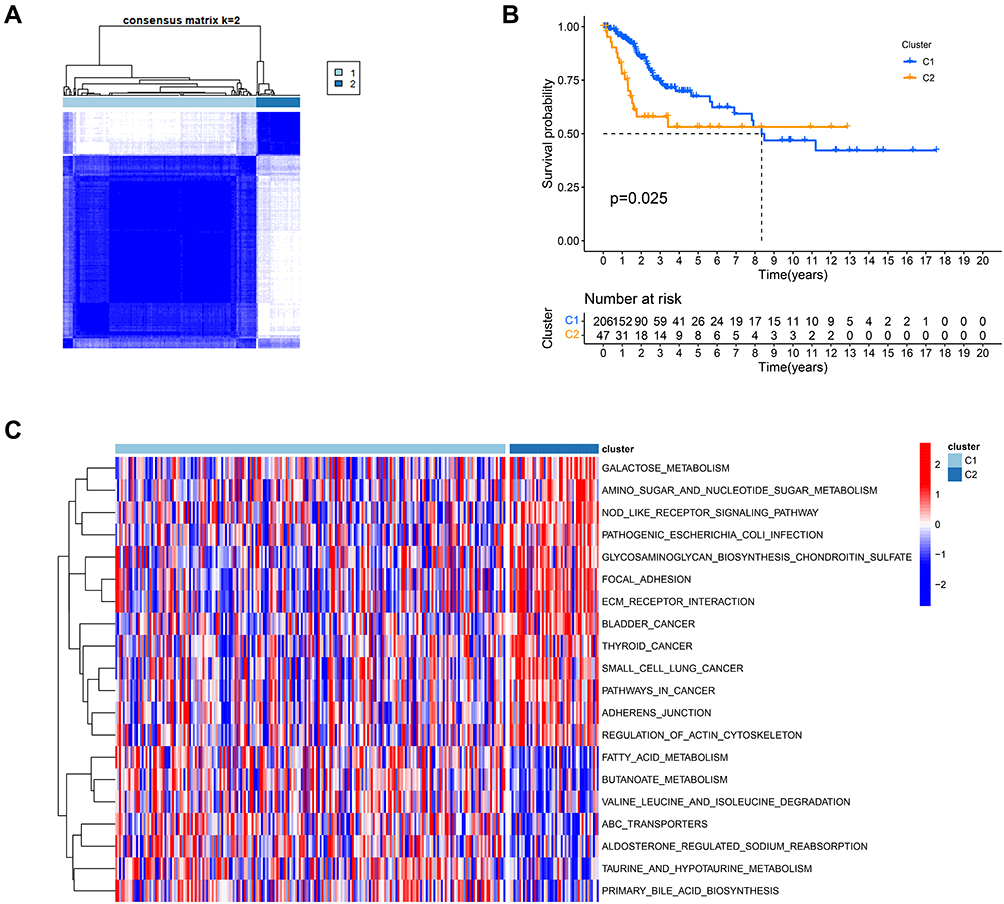 |
Figure 2 Tumor subclusters based on the pyroptosis-related DEGs. (A). Consensus clustering matrix for k = 2. (B) Kaplan–Meier curves of OS in two clusters. (C) The heatmap of KEGG pathways between two distinct clusters analyzed by GSVA. |
Establishment of a Gene Signature Based on Pyroptosis-Related Clusters
First, 727 DEGs (|log2FC| ≥ 1, P < 0.05) were identified based on the pyroptosis-related clusters and survival information for 253 patients with CSCC retrieved. Next, we screened for prognostic genes in TCGA cohort data by univariate Cox regression analysis. Expression levels of 84 genes were significantly correlated with OS (P < 0.01) (Figure 3A). Following LASSO analysis to minimize overfitting, 17 genes were identified (Figure 3B and C). Then, multivariate analysis was conducted to explore genes with independent prognostic value (Figure 3D). Finally, 7 genes (CST7, EPHB6, CCL17, ANGPTL4, CCL20, TMEM100, and FAM3B) were selected to construct a prognostic signature associated with pyroptosis. The risk score formula was defined as follows:
 |
Figure 3 Establishment of the pyroptosis-related signature in the TCGA dataset. (A) Univariate cox regression analysis screened prognostic genes from DEGs based on pyroptosis-related clusters (P < 0.01). (B) LASSO regression of the 84 prognostic genes. (C) Cross-validation for tuning the parameter selection in the LASSO regression. (D) Stepwise multivariate cox regression analysis showed 7 independent prognostic genes. |
Risk Score = (-0.293× CST7 exp.) + (-0.228× EPHB6 exp.) + (-0.499× CCL17 exp.) + (0.304× ANGPTL4 exp.) + (0.132× CCL20 exp.) + (0.821× TMEM100 exp.) + (-0.251× FAM3B exp.)
Using this signature, patients were further categorized into equal high- and low-risk groups, based on the median risk value (Figure 4A). As illustrated in the scatter diagram in Figure 4B, individuals in the high-risk score group had worse outcomes than those in the low-risk group.
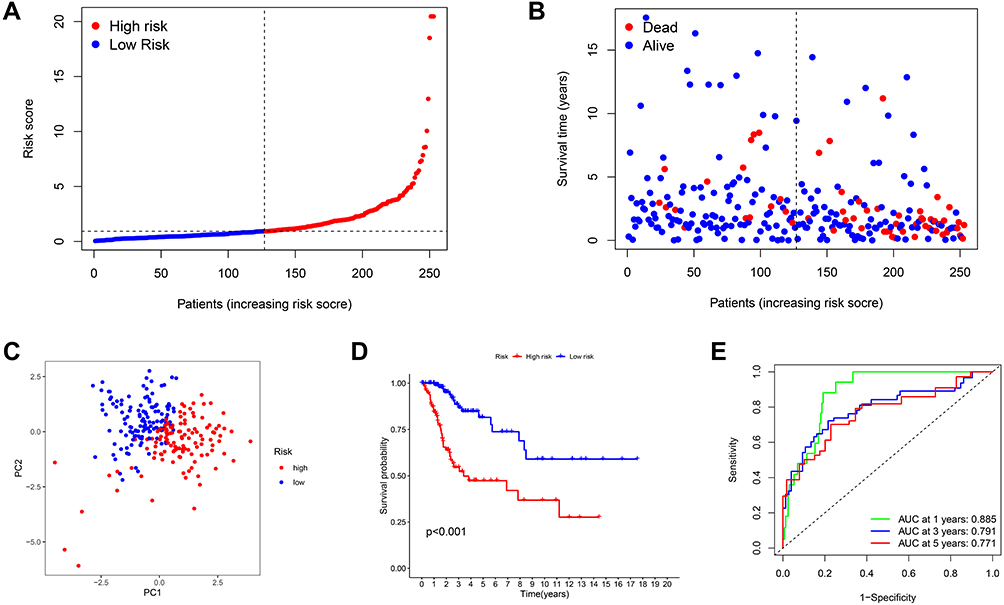 |
Figure 4 Prognostic value of the risk patterns of the signature in the TCGA dataset. (A) Distribution of risk score, (B) survival status plot and survival time, (C) PCA analysis, (D) Kaplan-Meier analysis of OS, (E) ROC curves analysis between high- and low-risk groups. |
Next, we conducted PCA to verify the ability of the model to group patients in the entire set. We observed that patients in different groups were dispersed in two directions (Figure 4C). In addition, a significant difference in OS time was detected between the two groups by Kaplan-Meier analysis (P < 0.001) (Figure 4D). ROC curve analysis was conducted to evaluate the sensitivity and specificity of the prognostic model, resulting in AUC values of the models for predicting 1-, 3- and 5-year OS of 0.885, 0.791, and 0.771, respectively (Figure 4E).
External Validation of the Seven-Gene Signature
To assess the prognostic power of the model built using TCGA dataset, data from 37 patients with CSCC in the GEO cohort, GSE30759, were used as a validation set. Gene expression data from the two datasets were normalized. According to the uniform formula, risk scores were calculated and patients divided into different risk groups. Based on the median risk score, 18 patients in the GEO cohort were classified into the high-risk group, while the remaining 19 patients were classified into the low-risk group (Figure 5A). Similar to the results using TGCA data, patients in the high-risk group had shorter survival time and higher mortality compared with those in the low-risk group (Figure 5B). PCA revealed satisfactory separation between the two groups (Figure 5C). Further, Kaplan–Meier analysis generated results comparable to those derived from TCGA cohort data. The OS of high-risk patients was lower than that of low-risk patients (Figure 5D). ROC curve analysis of the validation set showed that our model has excellent predictive power, with AUC values for 1-, 3-, and 5-year OS of 0.882, 0.868, and 0.754, respectively (Figure 5E).
 |
Figure 5 Validation of the risk model in the GEO cohort. (A) Distribution of risk score, (B) survival status plot and survival time, (C) PCA analysis, (D) Kaplan-Meier analysis of OS, (E) ROC curves analysis between high- and low-risk groups. |
Independent Predictive Value of the Risk Model
Both univariate and multivariate cox regression analyses were applied to determine independent prognostic factors in patients with CSCC. First, we carried out univariate Cox regression analysis to define potential risk factors. Risk score and stage were associated with prognosis in TCGA cohort (Figure 6A), and risk score, stage, and grade were prognostic factors in the GEO cohort (Figure 6C). Additionally, risk score (hazard ratio (HR) = 1.141, 95% confidence interval (CI): 1.095–1.189, P < 0.001), stage (HR = 1.650, 95% CI: 1.293–2.105, P < 0.001), and age (HR = 1.020, 95% CI: 1.001–1.039, P = 0.036) were confirmed as prognostic factors in a combined data from TCGA and GEO (Figure 6E). Subsequently, independent predictors were selected via multivariate Cox regression analysis. The results showed that risk score and stage remained significant predictors in TCGA cohort data (Figure 6B); however, no significant predictor was detected after accounting for confounding factors in the GEO cohort (Figure 6D). Finally, risk score (HR = 1.141, 95% CI: 1.095–1.189, P < 0.001) and stage (HR = 1.650, 95% CI: 1.293–2.105, P < 0.001) were independent predictors in analysis of data from both cohorts combined (Figure 6F). Furthermore, we drew a heatmap of clinicopathologic features for the combined cohort, and found that clinical stage differed significantly between the high- and low-risk groups (P < 0.05), while age and grade did not differ significantly (Figure 6G).
 |
Figure 6 Independent predictive value of the risk scores. (A) Univariate analysis for TCGA cohort. (B) Multivariate analysis for TCGA cohort. (C) Univariate analysis for GEO cohort. (D) Multivariate analysis for GEO cohort. (E) Univariate analysis for the combined cohort. (F) Multivariate analysis for the combined cohort. (G) The heatmap (blue: low expression; red: high expression) for the connections between clinicopathologic features and the risk groups. |
Construction and Validation of a Prognostic Nomogram
Using the results of univariate and multivariate Cox analyses, stage and risk categories based on the seven gene signature were integrated to create a nomogram for TCGA cohort data, to expand the clinical applicability and use of the signature (Figure 7A). The nomogram could be helpful for accurate prediction of 1-, 3-, and 5-year OS. Individual patients were given total point values, generated by combining the points corresponding to each prognostic variable. High overall point score indicated poor clinical outcome. The calibration curve for the nomogram indicated good consistency between predicted survival and actual observations (Figure 7B). The C-index value for the nomogram was 0.837, indicating that it exhibits high predictive consistency. In addition, we used DCA to assess the reliability of the model, and observed that the nomogram including clinical stage and risk subtype was better at predicting 5-year OS than individual indicators (Figure 7C).
 |
Figure 7 Construction and evaluation of the prognostic nomogram in the TCGA cohort. (A) The nomogram was built based on two independent prognostic factors for predicting the probability of the 1-, 3-, and 5-year OS. (B) The calibration plot for evaluating the predictive ability of the nomogram at 1-, 3-, and 5-year. (C) DCA of the Nomogram model. |
Functional Enrichment Analysis of Genes Included in the Risk Model
To further investigate the potential biological processes and pathways correlated with patient risk categories, we extracted 35 DEGs between the high- and low-risk groups in TCGA cohort by applying the threshold, |log2FC| ≥ 1 and P < 0.05, via the “limma” R package (Supplementary Table 2); however, no DEGs were identified in GEO cohort data using the same criteria. According to analysis of TCGA data, 24 genes were downregulated in the high-risk group, while the remaining 11 genes were upregulated. GO and KEGG enrichment analyses were performed using these DEGs, and the results demonstrated that DEGs were primarily associated with immune response, inflammatory chemotaxis activity, and viral protein interaction (Figure 8).
 |
Figure 8 Functional enrichment analysis based on DEGs between high- and low-risk groups in the TCGA cohort. (A) Bar plot for GO enrichment. (B) Bubble graph for KEGG pathways. |
Risk Signature and Mutation Profile
Gene mutation is a major driver of tumorigenesis and cancer development. Patient mutation profiles were analyzed and summarized using the “maftools” R package (Figure 9A). The top two mutated genes in both the low- and high-risk groups were TTN and PIK3CA. Next, we calculated TMB scores based on TGCA somatic mutation data. TMB scores were markedly higher in the high-risk group than those in the low-risk group (P = 0.041) (Figure 9B). Further, although no significant difference in OS time was detected between the low- and high-TMB groups (P = 0.117), patients with high-TMB had a trend toward longer survival time than those with low-TMB (Figure 9C). Interestingly, patients with high- or low-TMB in the low-risk group had superior OS to those in the high-risk group. Additionally, in the low-risk group, survival time of patients with high-TMB was longer than that of patients with low-TMB, and a similar result was observed in the high-risk group (Figure 9D). These findings indicate that the risk model may have greater prognostic significance than mutation status.
 |
Figure 9 The mutation profile and TMB analysis. (A) Mutation profile of CSCC patients in high- and low-risk groups. (B) The relationship between the risk signature and TMB. (C) The association between TMB and OS. (D) Kaplan-Meier curves of OS is shown for patients classified according to the TMB status and risk model. |
Association of the Prognostic Model with the Immune Microenvironment
Based on the results of functional enrichment analyses, we conducted further investigation of the immune characteristics of the risk signature in TCGA cohort data. The enrichment scores of 16 types of immune cells and the activity of 13 immune-related pathways were compared using ssGSEA. The high-risk group generally had lower levels of 14 infiltrating immune cells than the low-risk group, particularly activated dendritic cells, B cells, CD8+ T cells, dendritic cells, induced dendritic cells, macrophages, mast cells, neutrophils, plasmacytoid dendritic cells, T helper cells, Follicular helper T cells, Th2 cells, tumor-infiltrating lymphocytes, and regulatory T cells (Tregs) (Figure 10A). There was higher activity of immune-related pathways in the low-risk group than in the high-risk group, including APC co-inhibition, checkpoint, cytolytic activity, human leukocyte antigen (HLA), inflammation-promotion, MHC class I, T cell co-inhibition, T cell co-stimulation, and type I IFN (interferon) response (Figure 10B). Other immune cell and immune-related pathway scores did not differ significantly; however, there was a similar trend in differences between the two groups, except for type II IFN response. We also determined immune and ESTIMATE scores using the ESTIMATE algorithm, to evaluate the relationship between the risk model and the immune microenvironment. As expected, all scores (stromal, immune, and ESTIMATE) differed significantly between the two groups (P < 0.01), with scores of the low-risk group higher than those of the high-risk group (Figure 10C). These results indicate that the immune systems of patients in the low-risk group were more active.
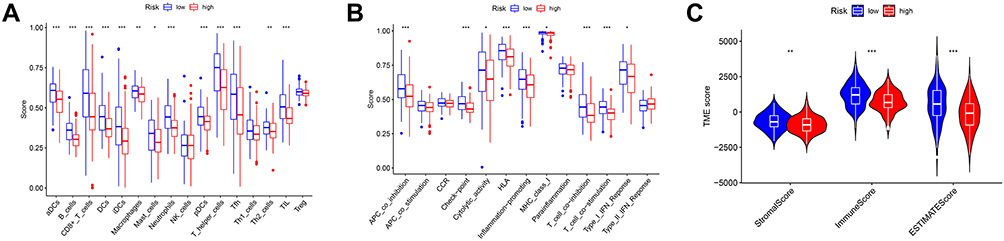 |
Figure 10 Comparison of TIME between high- and low-risk groups in the TCGA cohort. (A) Comparison of the ssGSEA scores of 16 types of immune cells. (B) Comparison of the ssGSEA scores of 13 immune-related pathways. (C) Comparison of stromal, immune, and ESTIMATE scores. P values were showed as: *P < 0.05, **P < 0.01, ***P < 0.001. |
Given the difference in checkpoint pathway activity between two groups, we conducted a detailed exploration of the expression levels of four classical immune checkpoint proteins, and found that those of PDCD1 (PD-1) (P < 0.001), CD274 (PD-L1) (P < 0.05), CTLA4 (P < 0.001), and LAG3 (P < 0.001) were remarkedly upregulated in the low-risk group (Figure 11A). Therefore, low-risk patients may be more likely to respond to checkpoint inhibitor therapy. Furthermore, we calculated IPS values for each sample, based on MHC, EC, CP, and SC. The IPS values of the low-risk group were significantly higher than those of the high-risk group when both PD-1 and CTLA4 were positively expressed (Figure 11B), whereas there was no difference in IPS values between the two risk groups in samples negative for PD-1 and CTLA4, or single PD-1-positive or CTLA4-positive samples (Figure 11C–E). These results suggest that low-risk patients may obtain more benefit from combined anti-PD-1 and anti-CTLA4 immunotherapy.
 |
Figure 11 Comparison of immunotherapy response between high- and low-risk groups in the TCGA cohort. (A) The expression levels of 4 classical immune checkpoint genes. (B) IPS analysis with both PD-1 positive and CTLA4 positive, (C) PD-1 negative and CTLA4 negative, (D) PD-1 positive and CTLA4 negative, (E) PD-1 negative and CTLA4 positive. P values were showed as: *P < 0.05, ***P < 0.001. |
Discussion
CC represents the most common gynecological tumor in low- and middle-income countries. With the development of innovative treatments, the curability of early stage CC has improved. Nevertheless, approximately 30% of patients with CC die due to recurrent disease or metastasis.32 Current diagnostic and prognostic indicators for CC, including tumor size, depth of invasion, lymph node metastasis, and pathological classification, have limited ability to predict therapeutic response and clinical outcomes. Squamous cell carcinoma is the major histological type of CC; therefore, development of a prognostic model suitable for patients with CSCC is urgently required.
Pyroptosis is a type of lytic and inflammatory programmed cell death that depends on inflammatory caspases and members of the GSDM protein family. Compared with other forms of cell death, pyroptosis occurs more rapidly and invokes a robust inflammatory response, which is closely linked to immune regulation. For tumors, dual promotion and inhibition may occur simultaneously during oncogenesis and tumor development. Additionally, induction of tumor cell pyroptosis is a potential new therapeutic target.33 The specific mechanisms underlying pyroptosis differ in various cancers. In particular, the relationships of tumors with upstream and downstream pyroptosis-related signaling pathways remain unclear. Therefore, pyroptosis regulators warrant extensive further investigation.
Human cervical carcinoma (HeLa) cells that overexpress GSDMB exhibit clear features of pyroptosis.16 The prognostic signature for CC depending on eight pyroptosis-related genes suggests that pyroptosis may have a crucial role in tumor development and therapeutic outcomes.34 How pyroptosis-related regulators interact in CCSC and whether they are related to patient survival time remains unknown. Our study reveals two distinct pyroptotic tumor clusters, based on the expression of 20 PRGs in TCGA cohort data and prognosis of patients in these two clusters differed significantly. Patients in cluster 2 had worse outcomes and showed enrichment in pathways in cancer, galactose metabolism, and NOD-like receptor signaling, while those in cluster 1 were enriched for fatty acid metabolism, butanoate metabolism, and ABC transporters.
According to differences between the two clusters, we generated a signature featuring seven genes (CST7, EPHB6, CCL17, ANGPTL4, CCL20, TMEM100, and FAM3B) to explore the links between pyroptosis and clinical prognosis in CSCC. Among these genes, CCL17, ANGPTL4, and CCL20 have previously been reported as associated with CC.
As a member of the chemokine (C-C motif) ligand family, CCL17 plays important roles in Th2-type immune responses. CCL17 is highly expressed in CC and influences cell proliferation via the JNK and STAT5 signaling pathways. Additionally, CCL17 may reconstruct the TIME by recruiting Tregs and eosinophils to local cancer lesions.35 Notably, CCL17 was downregulated in the high-risk group with immunosuppression status in our model.
ANGPTL4 (angiopoietin-like protein 4), a secreted glycoprotein, regulates glucolipid metabolism, angiogenesis, and wound healing. Upregulation of ANGPTL4 is strongly associated with tumor stage, depth of stromal invasion, lymph node metastasis, and lymphovascular space invasion, which lead to decreased OS and disease-free survival.36 Moreover, ANGPTL4 is upregulated due to Cremophor EL, which promotes aerobic glycolysis and triggers proinflammatory gene expression and caspase/gasdermin E-dependent pyroptosis.37
CCL20, also known as macrophage inflammatory protein-3α and liver activation regulated chemokine, is involved in tissue inflammation and homeostasis, and has a specific receptor, CCR6. CCL20 is predominantly over-expressed in the stroma of CC tissue, and correlates with advanced clinical stage and an inflammatory microenvironment comprising T-helper-17 cells, a T-cell subset with pro-tumorigenic properties.38 Consistently, in our model, CCL20 was upregulated in the high-risk group with poor prognosis.
Conversely, CST7, EPHB6, TMEM100, and FAM3B have not previously been studied in the context of CC. CST7, also known as Cystatin F, is a key subunit of family 2 cystatins and is remarkedly downregulated in hepatocellular carcinoma (HCC). High expression levels of CST7 were strongly associated with increased recurrence-free survival and OS in patients with hepatitis B virus-related HCC, as well as showing enrichment in tumor evasion, tolerogenicity, and cancer progenitors.39 Similarly, CST7 served as a protective factor in our risk model. EPHB6, a kinase-defective Eph receptor, belongs to the human receptor tyrosine kinase family and appears to function as a malignancy-suppressing factor and inhibitor of metastasis, which regulates cell adhesion and migration.40,41 Additionally, EPHB6 mutation promotes cancer cell proliferation and migration/invasion and induces cell adhesion-mediated drug resistance (CAM-DR), such as paclitaxel-resistance.42 The TMEM100 (Transmembrane protein 100) gene maps to chromosome 17q32 and encodes a 134-amino acid protein predicted to have two transmembrane domains. In hepatic stellate cells, TMEM100 overexpression leads to down-regulation of IL-1β and IL-6 secretion.43 TMEM100 may serve as a tumor suppressor in non‑small cell lung cancer and promote autophagy and apoptosis;44 however, the role of TMEM100 in pyroptosis requires clarification. FAM3B, a member of the Family with sequence similarity 3 group of proteins, has different expression levels in various tumor types. High FAM3B expression has been identified by immunogenome analysis and confirmed as associated with specific prolongation of survival in patients with papillary thyroid carcinoma and bladder cancer.45,46
Here, we separated patients with CSCC into high- and low-risk groups based on their median risk score, calculated using the developed risk signature. Kaplan–Meier survival curves showed that the OS of patients in the high-risk group was markedly lower than those in the low-risk group. Calculation of AUC values revealed that the risk signature was efficient in predicting survival prognosis and this was externally validated using data from the GEO database. Univariate and multivariate Cox regression analyses indicated that the risk score was an independent risk factor for prognosis in both TCGA and the combined cohort; however, DEGs were not screened in the GEO cohort for further validation. Functional enrichment analyses demonstrated that immune-related processes were significantly associated with DEGs between the different risk groups in TCGA cohort. Therefore, we speculate that pyroptosis may influence the TIME. The results of ssGSEA analysis indicated that patients with high-risk scores were in an immunologically active state, including infiltrating immune cells and immune activities, and these results were supported by ESTIMATE algorithm analysis. Infiltrations of stromal and immune cells were significantly higher in the low-risk group. The release of GzmB by immune cells cleaves GSDME and promotes HeLa cell pyroptosis.47 These findings support the interaction between pyroptosis and the immune system.
TMB generates neoantigens, resulting in the enrichment of immune cells in tumors and can predict survival in diverse cancers. In this study, we found that the low-risk group showed lower TMB. Surprisingly, the predictive power of our risk score was stronger than that of TMB according to survival analysis. Recently, there has been considerable progress in the development of immunotherapy for CC;48 however, biomarkers that distinguish patients likely to benefit from immunotherapy are limited. Pyroptosis-induced inflammation can trigger robust antitumor immunity and synergize with checkpoint blockade.49 Therefore, we explored the responses of common immune checkpoints inhibitors and found that the expression levels of PD-1, PD-L1, CTLA4, and LAG3 were significantly increased in the low-risk group, suggesting that low-risk patients may respond better to treatment with immune checkpoints inhibitors. Moreover, the results of IPS analysis indicated that combined treatment with CTLA-4 and PD-1 blockers may significantly enhance therapeutic efficacy in low-risk group patients. Combination treatment has been approved for use in patients with metastatic melanoma and advanced renal cell carcinoma.50
This study has some limitations. First, our data were extracted from public repositories and were not generated in-house. Second, to reduce the influence of confounding factors in different databases, we identified pyroptosis-related DEGs from 255 CSCC and 2 normal adjacent tissue samples only in TCGA CSCC database. Thus, further research using a larger sample size of normal control tissues should be conducted to verify the pyroptosis-related DEGs between tumor and normal tissues. Third, the results of our functional enrichment and TIME analyses could not be validated using GEO data. Validation with additional samples would be beneficial. Finally, our findings will be more persuasive if they can be validated by additional independent experiments.
Conclusion
In summary, our study provides a useful tool for predicting the prognosis of patients with CSCC and may be helpful for exploring the functions of PRGs. In addition, our data highlight that pyroptosis and combined targeted therapies warrant further study.
Abbreviations
AUC, area under the curve; CC, cervical cancer; CSCC, cervical squamous cell cancer; DCA, decision Curve Analysis; DEG, differentially expressed gene; ESTIMATE, Estimation of STromal and Immune cells in MAlignant Tumor tissues using Expression data; FC, fold change; GEO, Gene Expression Omnibus; GO, gene ontology; GSDM, gasdermin; GSVA, gene set variation analysis; IPS, immunophenoscore; KEGG, Kyoto Encyclopedia of Genes and Genomes; LASSO, least absolute shrinkage and selection operator; OS, overall survival; PCA, principal component analysis; PPI, protein-protein interaction; PRG, pyroptosis-related gene; ROC, receiver operating characteristic; ssGSEA, single sample gene set enrichment analysis; STRING, Search Tool for the Retrieval of Interacting Genes; TCGA, The Cancer Genome Atlas; TCIA, The Cancer Immunome Atlas; TIME, tumor immune microenvironment; TMB, tumor mutation burden.
Data Sharing Statement
The data in this study could be download at (https://portal.gdc.cancer.gov/ and https://www.ncbi.nlm.nih.gov/geo/).
Ethics Approval and Consent to Participate
The protocol of this study was approved by Guangxi Medical University Cancer Hospital Ethical Review Committee, Nanning, Guangxi Province, China.
Acknowledgments
We appreciate the TCGA and GEO database for providing their platforms and contributors for their valuable data sets.
Author Contributions
All authors made a significant contribution to the work reported, whether that is in the conception, study design, execution, acquisition of data, analysis and interpretation, or in all these areas; took part in drafting, revising or critically reviewing the article; gave final approval of the version to be published; have agreed on the journal to which the article has been submitted; and agree to be accountable for all aspects of the work.
Funding
This work was supported in part by the National Natural Science Foundation of China (grant 81760466).
Disclosure
The authors declare no conflicts of interest in this work.
References
1. Sung H, Ferlay J, Siegel RL, et al. Global Cancer Statistics 2020: GLOBOCAN Estimates of Incidence and Mortality Worldwide for 36 Cancers in 185 Countries. CA Cancer J Clin. 2021;71(3):209–249. doi:10.3322/caac.21660
2. Crosbie EJ, Einstein MH, Franceschi S, Kitchener HC. Human papillomavirus and cervical cancer. Lancet. 2013;382(9895):889–899. doi:10.1016/S0140-6736(13)60022-7
3. Marth C, Landoni F, Mahner S, et al. Cervical cancer: ESMO Clinical Practice Guidelines for diagnosis, treatment and follow-up. Ann Oncol. 2017;28(suppl_4):iv72–iv83. doi:10.1093/annonc/mdx220
4. Cohen PA, Jhingran A, Oaknin A, Denny L. Cervical cancer. Lancet. 2019;393(10167):169–182. doi:10.1016/S0140-6736(18)32470-X
5. Vande Walle L, Lamkanfi M. Pyroptosis. Curr Biol. 2016;26(13):R568–R572. doi:10.1016/j.cub.2016.02.019
6. Liu X, Zhang Z, Ruan J, et al. Inflammasome-activated gasdermin D causes pyroptosis by forming membrane pores. Nature. 2016;535(7610):153–158.
7. Frank D, Vince JE. Pyroptosis versus necroptosis: similarities, differences, and crosstalk. Cell Death Differ. 2019;26(1):99–114. doi:10.1038/s41418-018-0212-6
8. Kovacs SB, Miao EA. Gasdermins: effectors of Pyroptosis. Trends Cell Biol. 2017;27(9):673–684. doi:10.1016/j.tcb.2017.05.005
9. Kesavardhana S, Malireddi RKS, Kanneganti TD. Caspases in Cell Death, Inflammation, and Pyroptosis. Annu Rev Immunol. 2020;38:567–595. doi:10.1146/annurev-immunol-073119-095439
10. Moossavi M, Parsamanesh N, Bahrami A, Atkin SL, Sahebkar A. Role of the NLRP3 inflammasome in cancer. Mol Cancer. 2018;17(1):158. doi:10.1186/s12943-018-0900-3
11. Massague J, Obenauf AC. Metastatic colonization by circulating tumour cells. Nature. 2016;529(7586):298–306. doi:10.1038/nature17038
12. Shi J, Zhao Y, Wang Y, et al. Inflammatory caspases are innate immune receptors for intracellular LPS. Nature. 2014;514(7521):187–192. doi:10.1038/nature13683
13. Wang Y, Gao W, Shi X, et al. Chemotherapy drugs induce pyroptosis through caspase-3 cleavage of a gasdermin. Nature. 2017;547(7661):99–103. doi:10.1038/nature22393
14. Orning P, Weng D, Starheim K, et al. Pathogen blockade of TAK1 triggers caspase-8-dependent cleavage of gasdermin D and cell death. Science. 2018;362(6418):1064–1069. doi:10.1126/science.aau2818
15. Liu Y, Fang Y, Chen X, et al. Gasdermin E-mediated target cell pyroptosis by CAR T cells triggers cytokine release syndrome. Sci Immunol. 2020;5:43. doi:10.1126/sciimmunol.aax7969
16. Zhou Z, He H, Wang K, et al. Granzyme A from cytotoxic lymphocytes cleaves GSDMB to trigger pyroptosis in target cells. Science. 2020;368:6494. doi:10.1126/science.aaz7548
17. Xia X, Wang X, Cheng Z, et al. The role of pyroptosis in cancer: pro-cancer or pro-”host”? Cell Death Dis. 2019;10(9):650. doi:10.1038/s41419-019-1883-8
18. Ye Y, Dai Q, Qi H. A novel defined pyroptosis-related gene signature for predicting the prognosis of ovarian cancer. Cell Death Discov. 2021;7(1):71. doi:10.1038/s41420-021-00451-x
19. Shao W, Yang Z, Fu Y, et al. The Pyroptosis-Related Signature Predicts Prognosis and Indicates Immune Microenvironment Infiltration in Gastric Cancer. Front Cell Dev Biol. 2021;9:676485. doi:10.3389/fcell.2021.676485
20. Dong Z, Bian L, Wang M, Wang L, Wang Y. Identification of a Pyroptosis-Related Gene Signature for Prediction of Overall Survival in Lung Adenocarcinoma. J Oncol. 2021;2021:6365459. doi:10.1155/2021/6365459
21. Zhu W, Ye Z, Chen L, Liang H, Cai Q. A pyroptosis-related lncRNA signature predicts prognosis and immune microenvironment in head and neck squamous cell carcinoma. Int Immunopharmacol. 2021;101(Pt B):108268. doi:10.1016/j.intimp.2021.108268
22. Karki R, Kanneganti TD. Diverging inflammasome signals in tumorigenesis and potential targeting. Nat Rev Cancer. 2019;19(4):197–214. doi:10.1038/s41568-019-0123-y
23. Man SM, Kanneganti TD. Regulation of inflammasome activation. Immunol Rev. 2015;265(1):6–21. doi:10.1111/imr.12296
24. Wang B, Yin Q. AIM2 inflammasome activation and regulation: a structural perspective. J Struct Biol. 2017;200(3):279–282. doi:10.1016/j.jsb.2017.08.001
25. Wilkerson MD, Hayes DN. ConsensusClusterPlus: a class discovery tool with confidence assessments and item tracking. Bioinformatics. 2010;26(12):1572–1573. doi:10.1093/bioinformatics/btq170
26. Wang H, Lengerich BJ, Aragam B, Xing EP. Precision Lasso: accounting for correlations and linear dependencies in high-dimensional genomic data. Bioinformatics. 2019;35(7):1181–1187. doi:10.1093/bioinformatics/bty750
27. Balachandran VP, Gonen M, Smith JJ, DeMatteo RP. Nomograms in Oncology: more than meets the eye. Lancet Oncol. 2015;16(4):e173–180. doi:10.1016/S1470-2045(14)71116-7
28. Uno H, Cai T, Pencina MJ, D’Agostino RB, Wei LJ. On the C-statistics for evaluating overall adequacy of risk prediction procedures with censored survival data. Stat Med. 2011;30(10):1105–1117. doi:10.1002/sim.4154
29. Mayakonda A, Lin DC, Assenov Y, Plass C, Koeffler HP. Maftools: efficient and comprehensive analysis of somatic variants in cancer. Genome Res. 2018;28(11):1747–1756. doi:10.1101/gr.239244.118
30. Yoshihara K, Shahmoradgoli M, Martinez E, et al. Inferring tumour purity and stromal and immune cell admixture from expression data. Nat Commun. 2013;4:2612. doi:10.1038/ncomms3612
31. Charoentong P, Finotello F, Angelova M, et al. Pan-cancer Immunogenomic Analyses Reveal Genotype-Immunophenotype Relationships and Predictors of Response to Checkpoint Blockade. Cell Rep. 2017;18(1):248–262. doi:10.1016/j.celrep.2016.12.019
32. Adiga D, Eswaran S, Pandey D, Sharan K, Kabekkodu SP. Molecular landscape of recurrent cervical cancer. Crit Rev Oncol Hematol. 2021;157:103178. doi:10.1016/j.critrevonc.2020.103178
33. Loveless R, Bloomquist R, Teng Y. Pyroptosis at the forefront of anticancer immunity. J Exp Clin Cancer Res. 2021;40(1):264. doi:10.1186/s13046-021-02065-8
34. Zhou C, Li C, Zheng Y, Liu X. Identification of pyroptosis-related signature for cervical cancer predicting prognosis. Aging. 2021;13(22):24795–24814. doi:10.18632/aging.203716
35. Liu LB, Xie F, Chang KK, et al. Chemokine CCL17 induced by hypoxia promotes the proliferation of cervical cancer cell. Am J Cancer Res. 2015;5(10):3072–3084.
36. Nie D, Zheng Q, Liu L, Mao X, Li Z. Up-regulated of Angiopoietin-Like Protein 4 Predicts Poor Prognosis in Cervical Cancer. J Cancer. 2019;10(8):1896–1901. doi:10.7150/jca.29916
37. Dai Q, Liu X, He T, et al. Excipient of paclitaxel induces metabolic dysregulation and unfolded protein response. iScience. 2021;24(10):103170. doi:10.1016/j.isci.2021.103170
38. Walch-Ruckheim B, Mavrova R, Henning M, et al. Stromal Fibroblasts Induce CCL20 through IL6/C/EBPbeta to Support the Recruitment of Th17 Cells during Cervical Cancer Progression. Cancer Res. 2015;75(24):5248–5259. doi:10.1158/0008-5472.CAN-15-0732
39. Zhou X, Wang X, Huang K, et al. Investigation of the clinical significance and prospective molecular mechanisms of cystatin genes in patients with hepatitis B virus-related hepatocellular carcinoma. Oncol Rep. 2019;42(1):189–201. doi:10.3892/or.2019.7154
40. Liu J, Xu B, Xu G, Zhang X, Yang X, Wang J. Reduced EphB6 protein in gastric carcinoma and associated lymph nodes suggests EphB6 as a gastric tumor and metastasis inhibitor. Cancer Biomark. 2017;19(3):241–248. doi:10.3233/CBM-160256
41. Gu Y, Li F, Qian N, Chen X, Wang H, Wang J. Expression of EphB6 in ovarian serous carcinoma is associated with grade, TNM stage and survival. J Clin Pathol. 2016;69(5):448–453. doi:10.1136/jclinpath-2015-203160
42. Yoon S, Choi JH, Kim SJ, et al. EPHB6 mutation induces cell adhesion-mediated paclitaxel resistance via EPHA2 and CDH11 expression. Exp Mol Med. 2019;51(6):1–12. doi:10.1038/s12276-019-0323-2
43. Pan LX, Li LY, Zhou H, et al. TMEM100 mediates inflammatory cytokines secretion in hepatic stellate cells and its mechanism research. Toxicol Lett. 2019;317:82–91. doi:10.1016/j.toxlet.2018.12.010
44. He Q, Dong Y, Zhu Y, et al. TMEM100 induces cell death in non-small cell lung cancer via the activation of autophagy and apoptosis. Oncol Rep. 2021;45(5). doi:10.3892/or.2021.8014.
45. Lin P, Guo YN, Shi L, et al. Development of a prognostic index based on an immunogenomic landscape analysis of papillary thyroid cancer. Aging. 2019;11(2):480–500. doi:10.18632/aging.101754
46. Tian Z, Meng L, Long X, et al. Identification and validation of an immune-related gene-based prognostic index for bladder cancer. Am J Transl Res. 2020;12(9):5188–5204.
47. Zhang Z, Zhang Y, Xia S, et al. Gasdermin E suppresses tumour growth by activating anti-tumour immunity. Nature. 2020;579(7799):415–420. doi:10.1038/s41586-020-2071-9
48. Colombo N, Dubot C, Lorusso D, et al. Pembrolizumab for Persistent, Recurrent, or Metastatic Cervical Cancer. N Engl J Med. 2021;385(20):1856–1867. doi:10.1056/NEJMoa2112435
49. Wang Q, Wang Y, Ding J, et al. A bioorthogonal system reveals antitumour immune function of pyroptosis. Nature. 2020;579(7799):421–426. doi:10.1038/s41586-020-2079-1
50. Rotte A. Combination of CTLA-4 and PD-1 blockers for treatment of cancer. J Exp Clin Cancer Res. 2019;38(1):255. doi:10.1186/s13046-019-1259-z
 © 2022 The Author(s). This work is published and licensed by Dove Medical Press Limited. The
full terms of this license are available at https://www.dovepress.com/terms
and incorporate the Creative Commons Attribution
- Non Commercial (unported, 3.0) License.
By accessing the work you hereby accept the Terms. Non-commercial uses of the work are permitted
without any further permission from Dove Medical Press Limited, provided the work is properly
attributed. For permission for commercial use of this work, please see paragraphs 4.2 and 5 of our Terms.
© 2022 The Author(s). This work is published and licensed by Dove Medical Press Limited. The
full terms of this license are available at https://www.dovepress.com/terms
and incorporate the Creative Commons Attribution
- Non Commercial (unported, 3.0) License.
By accessing the work you hereby accept the Terms. Non-commercial uses of the work are permitted
without any further permission from Dove Medical Press Limited, provided the work is properly
attributed. For permission for commercial use of this work, please see paragraphs 4.2 and 5 of our Terms.