Back to Journals » Clinical Ophthalmology » Volume 14
A Novel Method of Visual Field Assessment for Patients with Unilateral Severely Limited Central Vision: A Pilot Study
Authors Stern B, Parnasa E, Forer Y, Tessler I ![]() , Kruger JM
, Kruger JM ![]()
Received 23 April 2020
Accepted for publication 8 June 2020
Published 29 June 2020 Volume 2020:14 Pages 1799—1804
DOI https://doi.org/10.2147/OPTH.S258949
Checked for plagiarism Yes
Review by Single anonymous peer review
Peer reviewer comments 3
Editor who approved publication: Dr Scott Fraser
Video abstract presented by Joshua Kruger.
Views: 2051
Benjamin Stern,1 Elhanan Parnasa,2 Yaara Forer,2 Idit Tessler,2 Joshua M Kruger1
1Department of Ophthalmology, Hadassah Medical Center, Kiryat Hadassah, Jerusalem 91120, Israel; 2Hebrew University-Hadassah School of Medicine, Jerusalem 91120, Israel
Correspondence: Joshua M Kruger Tel +972508946493
Email [email protected]
Purpose: Reliable visual field testing requires the tested eye to be fixated on a central target. This poses a major obstacle for eyes with severe central vision loss. This pilot study assesses whether it may be feasible to examine such patients with a modified method.
Methods: A green filter was placed over the fellow eye. A FASTPAC algorithm was used with a red stimulus. The green filter prevented transmission of the red stimuli but allowed visualization of the yellow fixation light. Subjects were tested by both the conventional and the novel method, performed in a randomized order. We compared the reliability indices and also the precision of the two methods.
Results: We present results from six patients. The novel method was associated with an 85% reduction in fixation losses (P=0.028) and a 58% reduction in eye motion on gaze tracking (P=0.007). Further, specialized testing in one of the volunteers demonstrated that the novel technique could more precisely define a small zone of preserved peripheral vision (P=0.008).
Conclusion: The results of this pilot study suggest that the novel method described may be a feasible strategy for visual field testing in patients with unilateral severe central vision loss.
Keywords: automated visual fields, static perimetry, Humphrey visual field analyzer, colored filter
Introduction
In order to accurately assess an individual’s peripheral vision, the tested eye must fixate on a central target throughout the examination. This poses a tremendous problem for an eye that has lost its central vision. Sometimes, monitoring the status of this remaining peripheral vision is important, particularly when the underlying disease is potentially still active.
The Humphrey visual field analyzer has a number of fixation targets, some of them developed for patients with limited central vision. However, in extreme cases, the central vision is so limited that no target can be discerned by the eye.
We explored a new strategy for performing a visual field test on an eye that cannot fixate on a target due to the loss of central vision. The technique involves keeping the tested eye immobilized by allowing the non-tested eye to view the fixation target without allowing the non-tested eye to see any of the test stimuli. Red-green glasses are used for techniques including the duochrome test, the Lancaster red-green test, the TNO-test, and the Worth-4-dot test.1,2 The glasses dissociate the eyes between red and green stimuli. Since the Humphrey perimeter can administer a visual field test with a red stimulus, an eye looking through a green filter will be insensitive to test stimuli yet will be able to perceive the yellow fixation target light. We hypothesized that application of a green filter over the non-tested eye could aid to stabilize the tested eye and thereby improve the test reliability.
Methods
Description of the Novel Testing Strategy
Rather than covering the non-tested eye with a typical occluder or patch, we cover it with a transparent green filter (such as the one used in red-green 3D glasses). The test is then administered with a red stimulus (available on standard Humphrey analyzers). While the light from the central fixation target is transmitted through the filter, the light from the red test stimuli are completely filtered out, and are therefore invisible to the non-tested eye. Thus, the non-tested eye is able to fixate on the central target, while only the tested eye can appreciate the test stimuli. Since the non-tested eye is immobilized because it is fixating on the central target, the tested eye will also be immobilized throughout the study.
The strength of the green filter was verified by confirming that a normal eye could not appreciate any test stimuli and yet could appreciate the fixation light.
Study Participants
The study was conducted in a prospective manner with the approval of the local institutional review board. Study subjects were patients who presented to the ophthalmology clinic at Hadassah Medical Center. The inclusion criteria were adult patients with visual acuity of less than finger counting at one meter in one eye regardless of the etiology, and 6/60 or better in the other eye. Intake nurses were asked to alert J.M.K. when a patient met the inclusion criteria. The patient was provided an explanation of the study, and offered the opportunity to participate with signed informed consent. Patients were excluded from participation if they were deemed unable to sufficiently cooperate with a standard automated visual field test.
Comparison of Conventional Testing versus Green-Filter Strategy via Assessment of Gaze Tracking
Participants underwent automated visual field testing of their impaired eye by either conventional testing, with an opaque patch placed over the nonimpaired eye, or with the green-colored filter placed over the nonimpaired eye. The order of the testing was randomized. A FASTPAC 24–2 algorithm was used in both cases (the SITA algorithm can only be administered with a white stimulus). Participants were first given a demonstration of the test and a short trial run with both eyes open. In both cases, the participant was instructed to fixate as best as they could on the central target throughout the test duration.
We quantified the amount of overall eye movement using the upper part of the gaze tracking plot (the lower part of the plot demonstrates periods during which the perimeter cannot detect the eye position, such as during a blink). High-quality printouts were scanned and imported for image processing using ImageJ software (NIH). We calculated both the overall area occupied by the tracing and the total potential area that could have been occupied. The ratio of the two values was considered to be the measurement of deviation of the eye from the fixation target.
The two testing strategies were compared using a paired t-test (GraphPad).
Assessment of Precision
Patient number four was suitable for extensive and repetitive visual field testing. Confrontational testing demonstrated the presence of a small island of preserved vision in the far temporal peripheral zone, well beyond the range of a 24–2 or 30–2 test. We designed a custom test on the Humphrey analyzer to target this area. The tested area extended from the vertical midline to 90 degrees temporally and extended superiorly and inferiorly by 30 degrees. The test included 59 points that were separated horizontally and vertically by 10 degrees. A screening suprathreshold algorithm was used with a near maximal intensity red stimulus of size V of 10 dB.
In random order, we performed this custom test three times in the conventional manner and three times using our novel strategy. A patient response (click) was classified as reproducible if there was at least one other response for that given location in one of the other two tests. A response was classified as non-reproducible if there was no response for that given location in the other two tests. We compared the number of reproducible responses against non-reproducible responses for both the conventional and novel method using Fisher’s exact test (GraphPad).
Results
Study Participants
Eight patients were recruited for the study. One patient was disqualified due to a marked head tremor that prevented stable placement of the head on the chin rest. In the case of another patient, the visual field analyzer malfunctioned during testing and could not be repaired on that day, necessitating withdrawal from the study. The details of the six patients that completed the study are summarized in Table 1. The ages ranged from 25 to 86 years (average 60.8 years). Three were females and three were males. The etiology of the diseases in the impaired eyes were age-related macular degeneration (n=2), compressive optic neuropathy (n=2), retinal detachment (n=1), and central retinal vein occlusion (n=1). The visual acuities in the impaired eye ranged from bare light perception to finger counting at 30 centimeters. The visual acuities in the nonimpaired eye ranged from 6/60 to 6/6.
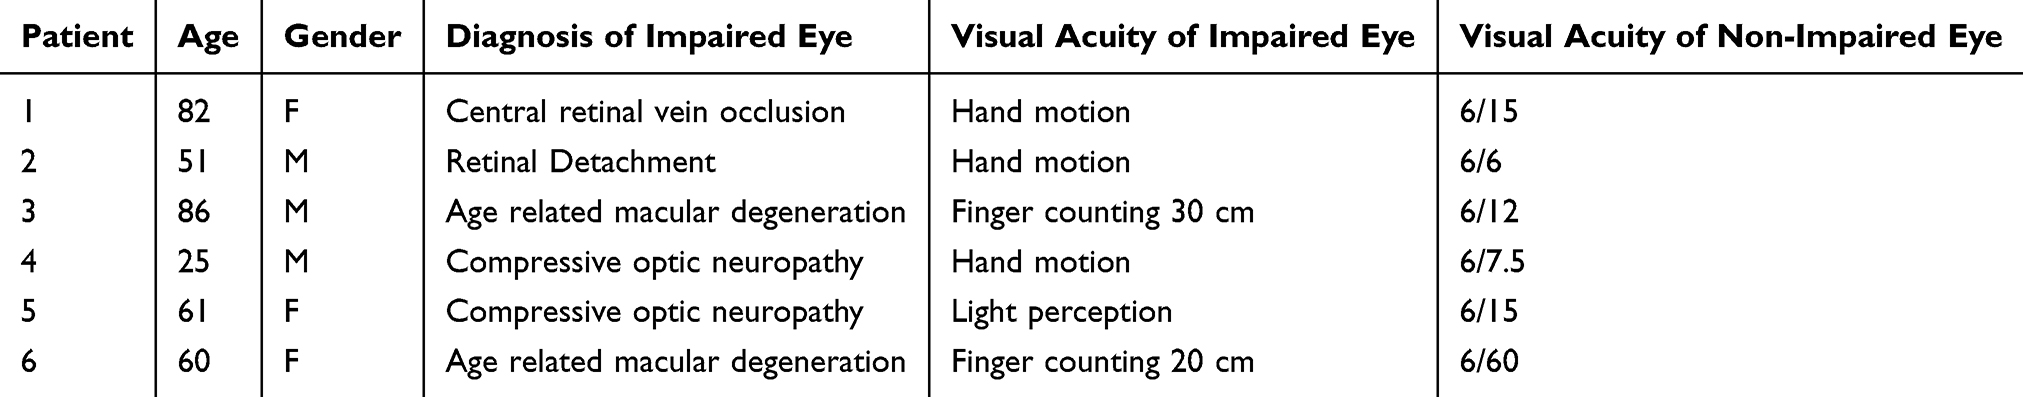 |
Table 1 Characteristics of the Patients Who Completed Participation in the Study |
Patterns of Visual Field Defects
Five of the six patients had marked generalized reductions in sensitivity encompassing the entire 24–2 zone when tested with both the conventional and the novel method. One patient (#6) had and inferiorly displaced central scotoma in the testing of both methods. There was no significant difference in the overall threshold measurements between the two methods.
Assessment of Reliability Indices
The reliability indices of the visual field tests are demonstrated in Table 2. The novel method had significantly lower fixation losses (6.3%, SD 7.9) relative to the conventional method (41.0%, SD 24.1, P=0.028 in a paired t-test). The average test duration of the novel method was shorter than the conventional method (421.5 seconds, SD 92.4 versus 466.7 seconds, SD 94.6), but the difference did not reach statistical significance (paired t-test P value of 0.43). There was no difference for the false positive or false negative rates.
 |
Table 2 Details of Reliability Indices and Test Duration for Testing with the Conventional and Novel Method |
Figure 1 demonstrates the gaze tracking plots for each of the six patients. In each case there was improved stability with the novel method. The mean scores were 40.5%, SD 11.4 for the conventional method and 17.2%, SD 3.9 for the novel method, corresponding to a marked statistically significant reduction in the eye movement with the novel method (P=0.007, paired t-test).
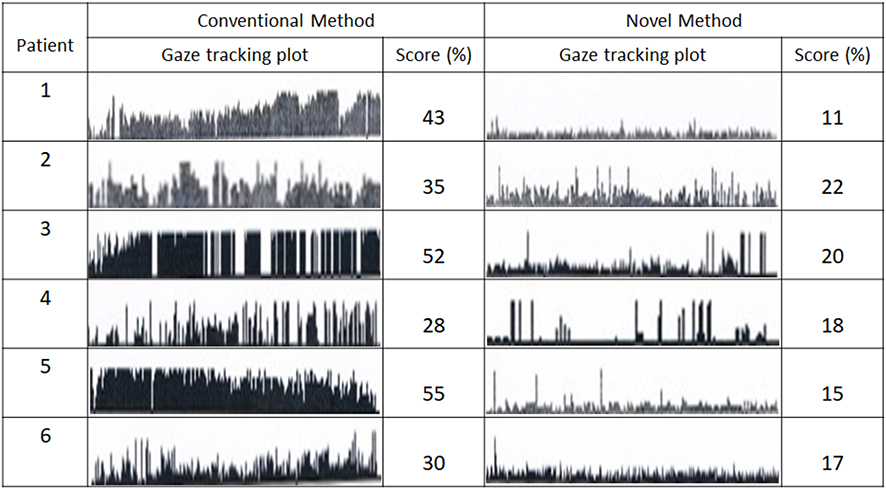 |
Figure 1 Comparison of gaze tracking in conventional versus novel method. The score is a percentage corresponding to the ratio of the area occupied by the gaze tracking plot relative to the total potential area available for the gaze tracking plot. |
Subjectively, a number of patients spontaneously reported feeling less anxious with the novel method.
Assessment of Precision
During the three times that the test was administered with the conventional method, 4 of the patient’s responses were reproducible and 10 were non-reproducible. With the novel method, 18 of the patient’s responses were reproducible and 6 were non-reproducible. The novel method was associated with a statistically significant improvement over the conventional method (Fisher’s exact test two-tailed P-value 0.008).
Discussion
In cases of extreme central vision loss, it is not possible to obtain a reliable automated visual field study because the eye cannot fixate and immobilize on a target. This is a major issue in cases of optic neuropathies, where disease progression can sometimes not otherwise be appreciated on the clinical ophthalmology assessment. Examples include retrobulbar optic neuritis and compressive optic neuropathy where changes in the visual field may precede changes in the OCT and fundus findings.3–5
We have assessed a new strategy for such situations in which the non-tested eye is allowed to fixate on the central target thereby minimizing motion of the tested eye. The test is administered with a colored stimulus which is blocked from the non-tested eye’s visual field using a complimentary colored filter.
The results of this pilot study are very encouraging. They demonstrate that the novel technique can be used to achieve a major reduction in the mobility of the tested eye during visual field assessment (85% reduction in fixation losses and a 58% reduction in eye motion on gaze tracking). Test duration is correlated with test reliability.6 In our study the average test duration was shorter for the novel method, but the difference did not reach statistical significance, perhaps due to the small sample size.
The patient population relevant to this study have extremely limited vision in the tested eye. When the non-tested eye is completely occluded, they experience extreme visual deprivation. A number of our patients spontaneously reported feeling less anxious when tested with the novel method. Since anxiety compromises visual field testing reliability,7 it is possible that our novel technique may improve patient test performance in part due to reduced psychological stress.Most of the patients had visual field defects that encompassed the entire 24–2 zone. We believe that further development of our method should employ testing strategies that cover a much wider zone. A modified Goldmann visual field test may be a good candidate. Another possibility is the development of customized algorithms with the Humprey analyzer. Such an attempt with one of our patients indeed suggested that the novel technique could more precisely define zones of preserved peripheral vision.
There are a number of other issues to consider:
- Our method uses a red stimulus. It is possible that the mapping of a visual field with a colored stimulus will yield different results than with a white stimulus. There is such a concern, for example, when screening for toxicity to hydroxychloroquine.8 Since our novel strategy cannot be used with a white stimulus, this is a limitation that we must accept. We do plan in the future to compare the effectiveness of a blue versus red stimulus (both are available on standard Humphrey analyzers), and a colored versus yellow background.
- We sought in this study to first validate our technique as a possible alternative to using conventional testing with the standard fixation target. We did not compare our method to conventional testing using the alternative targets provided in the Humphrey analyzer, such as the small or big diamonds. The diamond is composed of 4 lights and the patient is asked to fixate on an imagined center. These alternative targets are suitable in a patient where the central vision loss is confined to a small zone in the macula and there is sufficient paramacular vision to visualize the targets. We suspect that none of our patients would have had sufficient vision for these target arrays. We plan to compare our novel method with these alternative fixation targets in future studies.
- While our technique minimizes motion of the tested eye, it does not control the resting direction of the eye. If the eyes have a parallel orientation, then the tested eye will be fixated on a location slightly beside the central fixation target. If the patient has an underlying strabismus, then this becomes even more of an issue. Furthermore, patients with severe vision loss are at risk to develop a sensory strabismus. Thus, the accuracy of the test is somewhat compromised since the location of the mapped areas of the visual field are likely displaced somewhat from their actual location. Despite this limitation, we still believe that our method may have great value. If the alignment between the eyes remains constant between examinations, then the location of the mapped vision should also remain consistent. Even if the location somewhat varies between examinations, the size of a preserved island of vision would remain constant. Thus, the technique can still be useful in monitoring the status of a patients remaining zone of peripheral vision. One option to improve the alignment of the tested eye is to provide the non-tested eye with an alternative fixation target location such that the direction of the tested eye would be toward the fixation target. Another alternative would be to place an appropriate prism in front of the non-tested eye.
In conclusion, this pilot study suggests that our unique method may prove to be an excellent option to assess the visual field of an eye with severely limited central vision. We now plan to assess the method using testing strategies that assess a larger visual field. We also plan to assess reliability of the novel method by determining whether it better correlates with ganglion cell and retinal nerve fiber layer OCT findings. The method may also be relevant for other specialized populations, such as patients with latent nystagmus or individuals that are poor test takers with conventional testing. This will be another objective of our future directions.
Abbreviations
NIH, National Institute of Health; SD, Standard Deviation; SITA, Swedish Interactive Thresholding Algorithm.
Ethical Approval
The study was performed with the approval of the local institutional review board (Hadassah Medical Center). All procedures performed in studies involving human participants were in accordance with the ethical standards of the institutional research committee and with the 1964 Helsinki Declaration and its later amendments or comparable ethical standards.
Informed Consent
Informed consent was obtained from all individual participants included in the study.
Disclosure
The authors report no conflicts of interest in this work.
References
1. Madge SN. Clinical Techniques in Ophthalmology. Elsevier Health Sciences; 2006.
2. Christoff A, Guyton DL. The Lancaster red-green test. Am Orthopt J. 2006;56(1):157–165. doi:10.3368/aoj.56.1.157
3. Kupersmith MJ, Garvin MK, Wang J-K, et al. Retinal ganglion cell layer thinning within one month of presentation for optic neuritis. Mult Scler. 2016;22:641–648. doi:10.1177/1352458515598020
4. Danesh-Meyer HV, Carroll SC, Foroozan R, et al. Relationship between retinal nerve fiber layer and visual field sensitivity as measured by optical coherence tomography in chiasmal compression. Invest Ophthalmol Vis Sci. 2006;47(11):4827–4835. doi:10.1167/iovs.06-0327
5. Dooley MC, Foroozan R. Optic neuritis. J Ophthalmic Vis Res. 2010;5(3):182–187.
6. Tan NYQ, Tham Y-C, Koh V, et al. The effect of testing reliability on visual field sensitivity in normal eyes. Ophthalmology. 2018;125(1):15–21. doi:10.1016/j.ophtha.2017.08.002
7. Chew SSL, Kerr NM, Wong ABC, et al. Anxiety in visual field testing. Br J Ophthalmol. 2016;100:1128–1133. doi:10.1136/bjophthalmol-2015-307110
8. Browning DJ, Lee C. Scotoma analysis of 10-2 visual field testing with a red target in screening for hydroxychloroquine retinopathy. Clin Ophthalmol. 2015;9:1499–1509. doi:10.2147/OPTH.S87850
 © 2020 The Author(s). This work is published and licensed by Dove Medical Press Limited. The
full terms of this license are available at https://www.dovepress.com/terms
and incorporate the Creative Commons Attribution
- Non Commercial (unported, 3.0) License.
By accessing the work you hereby accept the Terms. Non-commercial uses of the work are permitted
without any further permission from Dove Medical Press Limited, provided the work is properly
attributed. For permission for commercial use of this work, please see paragraphs 4.2 and 5 of our Terms.
© 2020 The Author(s). This work is published and licensed by Dove Medical Press Limited. The
full terms of this license are available at https://www.dovepress.com/terms
and incorporate the Creative Commons Attribution
- Non Commercial (unported, 3.0) License.
By accessing the work you hereby accept the Terms. Non-commercial uses of the work are permitted
without any further permission from Dove Medical Press Limited, provided the work is properly
attributed. For permission for commercial use of this work, please see paragraphs 4.2 and 5 of our Terms.