Back to Journals » Diabetes, Metabolic Syndrome and Obesity » Volume 12
A Novel Indicator Of Lipid Accumulation Product Associated With Metabolic Syndrome In Chinese Children And Adolescents
Authors Zhang Y ![]() , Hu J, Li Z, Li T, Chen M, Wu L, Liu W, Han H, Yao R, Fu L
, Hu J, Li Z, Li T, Chen M, Wu L, Liu W, Han H, Yao R, Fu L
Received 3 July 2019
Accepted for publication 3 September 2019
Published 10 October 2019 Volume 2019:12 Pages 2075—2083
DOI https://doi.org/10.2147/DMSO.S221786
Checked for plagiarism Yes
Review by Single anonymous peer review
Peer reviewer comments 2
Editor who approved publication: Prof. Dr. Antonio Brunetti
Yifei Zhang, Jingyao Hu, Zhiqiang Li, Ting Li, Manman Chen, Lu Wu, Wenmin Liu, Hui Han, Rongying Yao, Lianguo Fu
Department of Child and Adolescent Health, School of Public Health, Bengbu Medical College, Bengbu, People’s Republic of China
Correspondence: Lianguo Fu
Department of Child and Adolescent Health, School of Public Health, Bengbu Medical College, 2600 East Sea Avenue, Bengbu 233030, Anhui, People’s Republic of China
. Tel +8613195529639
Fax +86-5523175215
Email [email protected]
Background: The lipid accumulation product (LAP) is a powerful marker for predicting metabolic syndrome (MS) in adults. The present study aimed to propose a novel indicator, the children’s lipid accumulation product (CLAP), and to assess its association with MS among Chinese children and adolescents.
Methods: A total of 683 Chinese children aged 8–15 years were recruited using a stratified cluster sampling method in this cross-sectional study. The presence of MS was defined according to the NCEP-ATP III criteria. The effects of BMI, WHtR and the CLAP for predicting MS were compared using logistic regression models and receiver operating characteristic (ROC) curves.
Results: The prevalence of MS was 5.1% (6.6% and 3.5% among boys and girls, respectively). Overall obesity (based on BMI), abdominal obesity (based on WHtR) and CLAP≥P75 were significantly associated with an increased risk of MS (ORs (95% CIs) were 143.79 (18.78–1101.22), 86.83 (27.19–277.27), 150.75 (20.11–1130.19), respectively). The area under the ROC curve (AUC) for the CLAP was higher than that for BMI and WHtR for predicting MS, with AUC (95% CI) values of 0.944 (0.913–0.975), 0.895 (0.864–0.927), and 0.928 (0.903–0.953), respectively.
Conclusion: The children’s lipid accumulation product (CLAP) was an effective indicator associated with MS in Chinese children and adolescents and was better than BMI and WHtR for predicting MS.
Keywords: childhood obesity, lipid metabolism, metabolic syndrome
Introduction
Metabolic syndrome (MS), which is characterized by a cluster of interdependent disorders, including abdominal obesity, hypertension, hyperglycemia, and dyslipidemia, is correlated with the development of cardiovascular diseases (CVD) and diabetes.1–3 With obesity among children being widespread, the occurrence of MS in children has been increasingly common.1 The National Health and Nutrition Examination Survey (NHANES) showed that the prevalence of MS in American children and adolescents ranged from 4.2% in 1988–1994 to 10.1% in 2001–2010.4,5 In China, the prevalence of MS among children and adolescents aged 10–16 years was 4.1% in 2012.6 MS not only has an influence on childhood health but also increases the risk of several adulthood diseases4,7 and has become an important public health issue.8
The diagnosis of MS requires several factors, including anthropometric and clinical factors. It is difficult to apply the diagnostic criteria for MS in large-scale epidemiological studies due to the time and economic cost for measuring the required indicators.9 Some studies have shown that obesity is one of the main risk factors for MS and have proposed BMI, waist circumference (WC) and WHtR to predict MS.10–12 Nevertheless, not all adipose tissue is harmful to the human body; for example, brown fat can burn fat and release energy. Therefore, it cannot simply be assumed that high body weight and excessive overall fat are indicators of unhealthy states.12,13 BMI does not distinguish between lean body mass and the distribution of fat and, therefore, might miss a large proportion of the population at risk due to abdominal obesity and may additionally result in false-positive obesity diagnoses for parts of the population with a lean body mass.14 WC and WHtR are important indices for screening abdominal obesity, however, they do not show that the excess body fat presents in circulating blood as TG.9
The definition and quantification of lipid accumulation in a specific environment may represent certain physiological risks and can help researchers to further understand the role of adipose tissue in the pathophysiology of diseases and its value in predicting the risk of disease occurrence.15 Whether an individual’s excess lipid fuel eventually appears as an enlarged abdomen or as an elevated circulating TG level could be dictated in part by genes or by features of the individual’s environmental circumstances, and an increase in WC or TG can reflect the status of lipid accumulation in the body.12
Kahn et al15 proposed a new marker, the lipid accumulation product (LAP), which reflects the total lipid accumulation in the body, to predict MS in adults. Waist circumference and fasting TG concentration were used to define the LAP. The LAP for men=[WC(cm)-65]×TG(mmol/L), and the LAP for women=[WC(cm)-58]×TG (mmol/L), which reflect the combined anatomic and physiologic changes associated with lipid overaccumulation in adults. A growing number of studies have shown that LAP is a powerful marker for predicting MS in adults better than BMI12,16 and WHtR.9,17
The LAP calculation in adults usually involves the subtraction of a minimum WC value; however, children and adolescents are different from adults, and the WC and minimum WC have obviously increasing trends with age. Hence, the LAP may not directly reflect lipid accumulation in children and adolescents. Beyond waist circumference (WC) and triglycerides (TG), abdominal skinfold thickness (AST) is an important and simple index reflecting abdominal adipose tissue accumulation among children and adolescents. The aim of this study was to develop a new marker, the children’s lipid accumulation product (CLAP), using waist circumference (WC), abdominal skinfold thickness (AST) and triglycerides (TG) and to explore the association of this marker with MS.
Materials And Methods
Subjects
This study effectively recruited 683 Chinese students aged 8–15 years, including 366 boys (53.6%) and 317 girls (46.4%), via the stratified cluster sampling method by school and grade from 2 nine-year system schools. This study was conducted in accordance with the Declaration of Helsinki and was approved by the Medical Ethics Committee of the Bengbu Medical College ([2015] No.003). Informed consent was signed by parents or guardians of the children and adolescents before the medical examination.
Measurements Of Physiological And Biochemical Indexes
The participants were required to wear light clothes and to stand straight, be barefoot, and have an empty stomach when being measured. Their height was determined by a mechanical height measure and was accurate to 0.1 cm. Weight was measured by an electronic scale and was accurate to 0.1 kg. The waist circumference (WC), which was the perimeter of the waist along a horizontal line at 1 cm above the belly button, was measured to the nearest 0.1 cm using Nylon tape. Abdominal skinfold thickness (AST), which was the skinfold thickness at the junction of the belly button horizontal line and right collarbone midline, was measured to 0.1 mm using a skinfold thickness gauge. The systolic blood pressure (SBP) and diastolic blood pressure (DBP) of the participants were measured after sitting quietly for 10 min. If the difference in two measures was greater than 8 mmHg, the measurement was repeated after an interval of 2 min, and the average of the final two measures was used in the analyses. SBP was defined as the onset of the Korotkoff sound (K1), and DBP was defined as the fifth Korotkoff sound (K5).
After at least 8 h of overnight fasting, 3 mL venous blood samples were collected from the children and adolescents by the medical staff after they received standardized training. Triglyceride (TG) and fasting blood glucose (FBG) levels were detected using enzymatic methods. High-density lipoprotein cholesterol (HDL-C) was detected using the enzyme-linked immunoassay method.
Surveys Of Behavioral Indexes
Dietary behaviors were investigated by a food frequency questionnaire designed by the researcher team which included the frequency of breakfast, eggs, milk, fresh vegetables, fruits, nuts, eating out, fried foods, carbonated drinks, western-style fast food, and high-energy snacks. Each of the dietary behavior items was assigned 7 points for 1 time per day, 5 points for 4–6 times per week, 2 points for 1–3 times per week, 0.5 points for 2 time per month, 0.25 points for 1 time per month, and 0 points for never. According to the dietary guidelines and related literature for Chinese residents,18 dietary behaviors were divided into healthy behaviors (including breakfast, eggs, milk, fresh vegetables, fruits, nuts) and risk behaviors (including eating out, fried foods, carbonated drinks, western-style fast food, high-energy snacks). The total scores of healthy dietary behaviors and risk dietary behaviors were added. Children with a total score of healthy dietary behaviors and risk dietary behaviors ≥the 75th percentile (P75) were defined as the high group; the others were defined as the low group. Physical activities were investigated by the Children’s Leisure Activities Study Survey (CLASS) questionnaire.19 Children with moderate-to-vigorous physical activity for ≥60 min were defined as the high group; the others were defined as the low group.20 Children with a sedentary activity time ≥120 min were defined as the high group; the others were defined as the low group.21
Criteria For Metabolic Syndrome (MS)
In this study, MS and its components were defined according to the modified NCEP-ATP III criteria.4 MS was identified when three or more of the following five components were present: (1) abdominal obesity: a WC equal to or above the gender- and age-specific 90th percentile for Chinese children;22 (2) elevated TG: a TG≥110 mg/dL; (3) low HDL: an HDL≤40 mg/dL; (4) elevated blood pressure: an SBP and/or a DBP≥90th percentile for gender and age;23 and (5) elevated fasting glucose: a glucose≥110 mg/dL.
Calculation Of The Derivative Variables
The body mass index (BMI) = weight (kg)/height (m)2, and the participants who exceeded the BMI for their ages and gender were classified as having overall obesity according to the BMI reference norm for screening overweight and obesity in Chinese children and adolescents.24 The waist-height ratio (WHtR) =WC (cm)/height (m), and WHtR≥0.5 was defined as abdominal obesity.25 Children’s lipid accumulation product (CLAP) was defined as CLAP= waist circumference (WC(cm)) ×abdominal skinfold thickness (AST(mm)) × triglyceride (TG(mmol/L))/100. The CLAP was divided into two grades (≥75th percentile and <75th percentile) by 75th percentile of CLAP for gender and age.
Statistical Analysis
The SPSS 23.0 software (SPSS Inc., Chicago, IL, USA) was used for statistical analysis. The data were described using rate or proportion, mean ± standard deviation. The independent-samples t-test and Chi-square test were used to compare differences between two groups. The relationships between overall obesity, abdominal obesity, CLAP and MS were analyzed by a binary logistic regression model. The receiver operating characteristic (ROC) curve was generated to detect the predictive capabilities of BMI, WHtR and CLAP for MS. P < 0.05 was considered statistically significant.
Results
A total of 683 children aged 8–15 years were included in this study. As shown in Table 1, the overall prevalence of metabolic syndrome was 5.1%, 6.6% among boys and 3.5% among girls. Compared with girls, boys had higher values of height, WC, WHtR, SBP and FBG and lower values of AST, TG and lnCLAP (P<0.05). The proportion of abdominal obesity (based on WHtR), risk dietary behaviors ≥P75, and moderate-to-vigorous physical activity time ≥60 min in boys were higher than those in girls. The proportion of sedentary activity time ≥120 min in boys was lower than that in girls (P<0.05). There were no significant differences in age, weight, BMI, DBP, HDL-C, overall obesity (Yes or No), CLAP (<P75 or ≥P75), or healthy dietary behaviors (<P75 or ≥P75) between boys and girls.
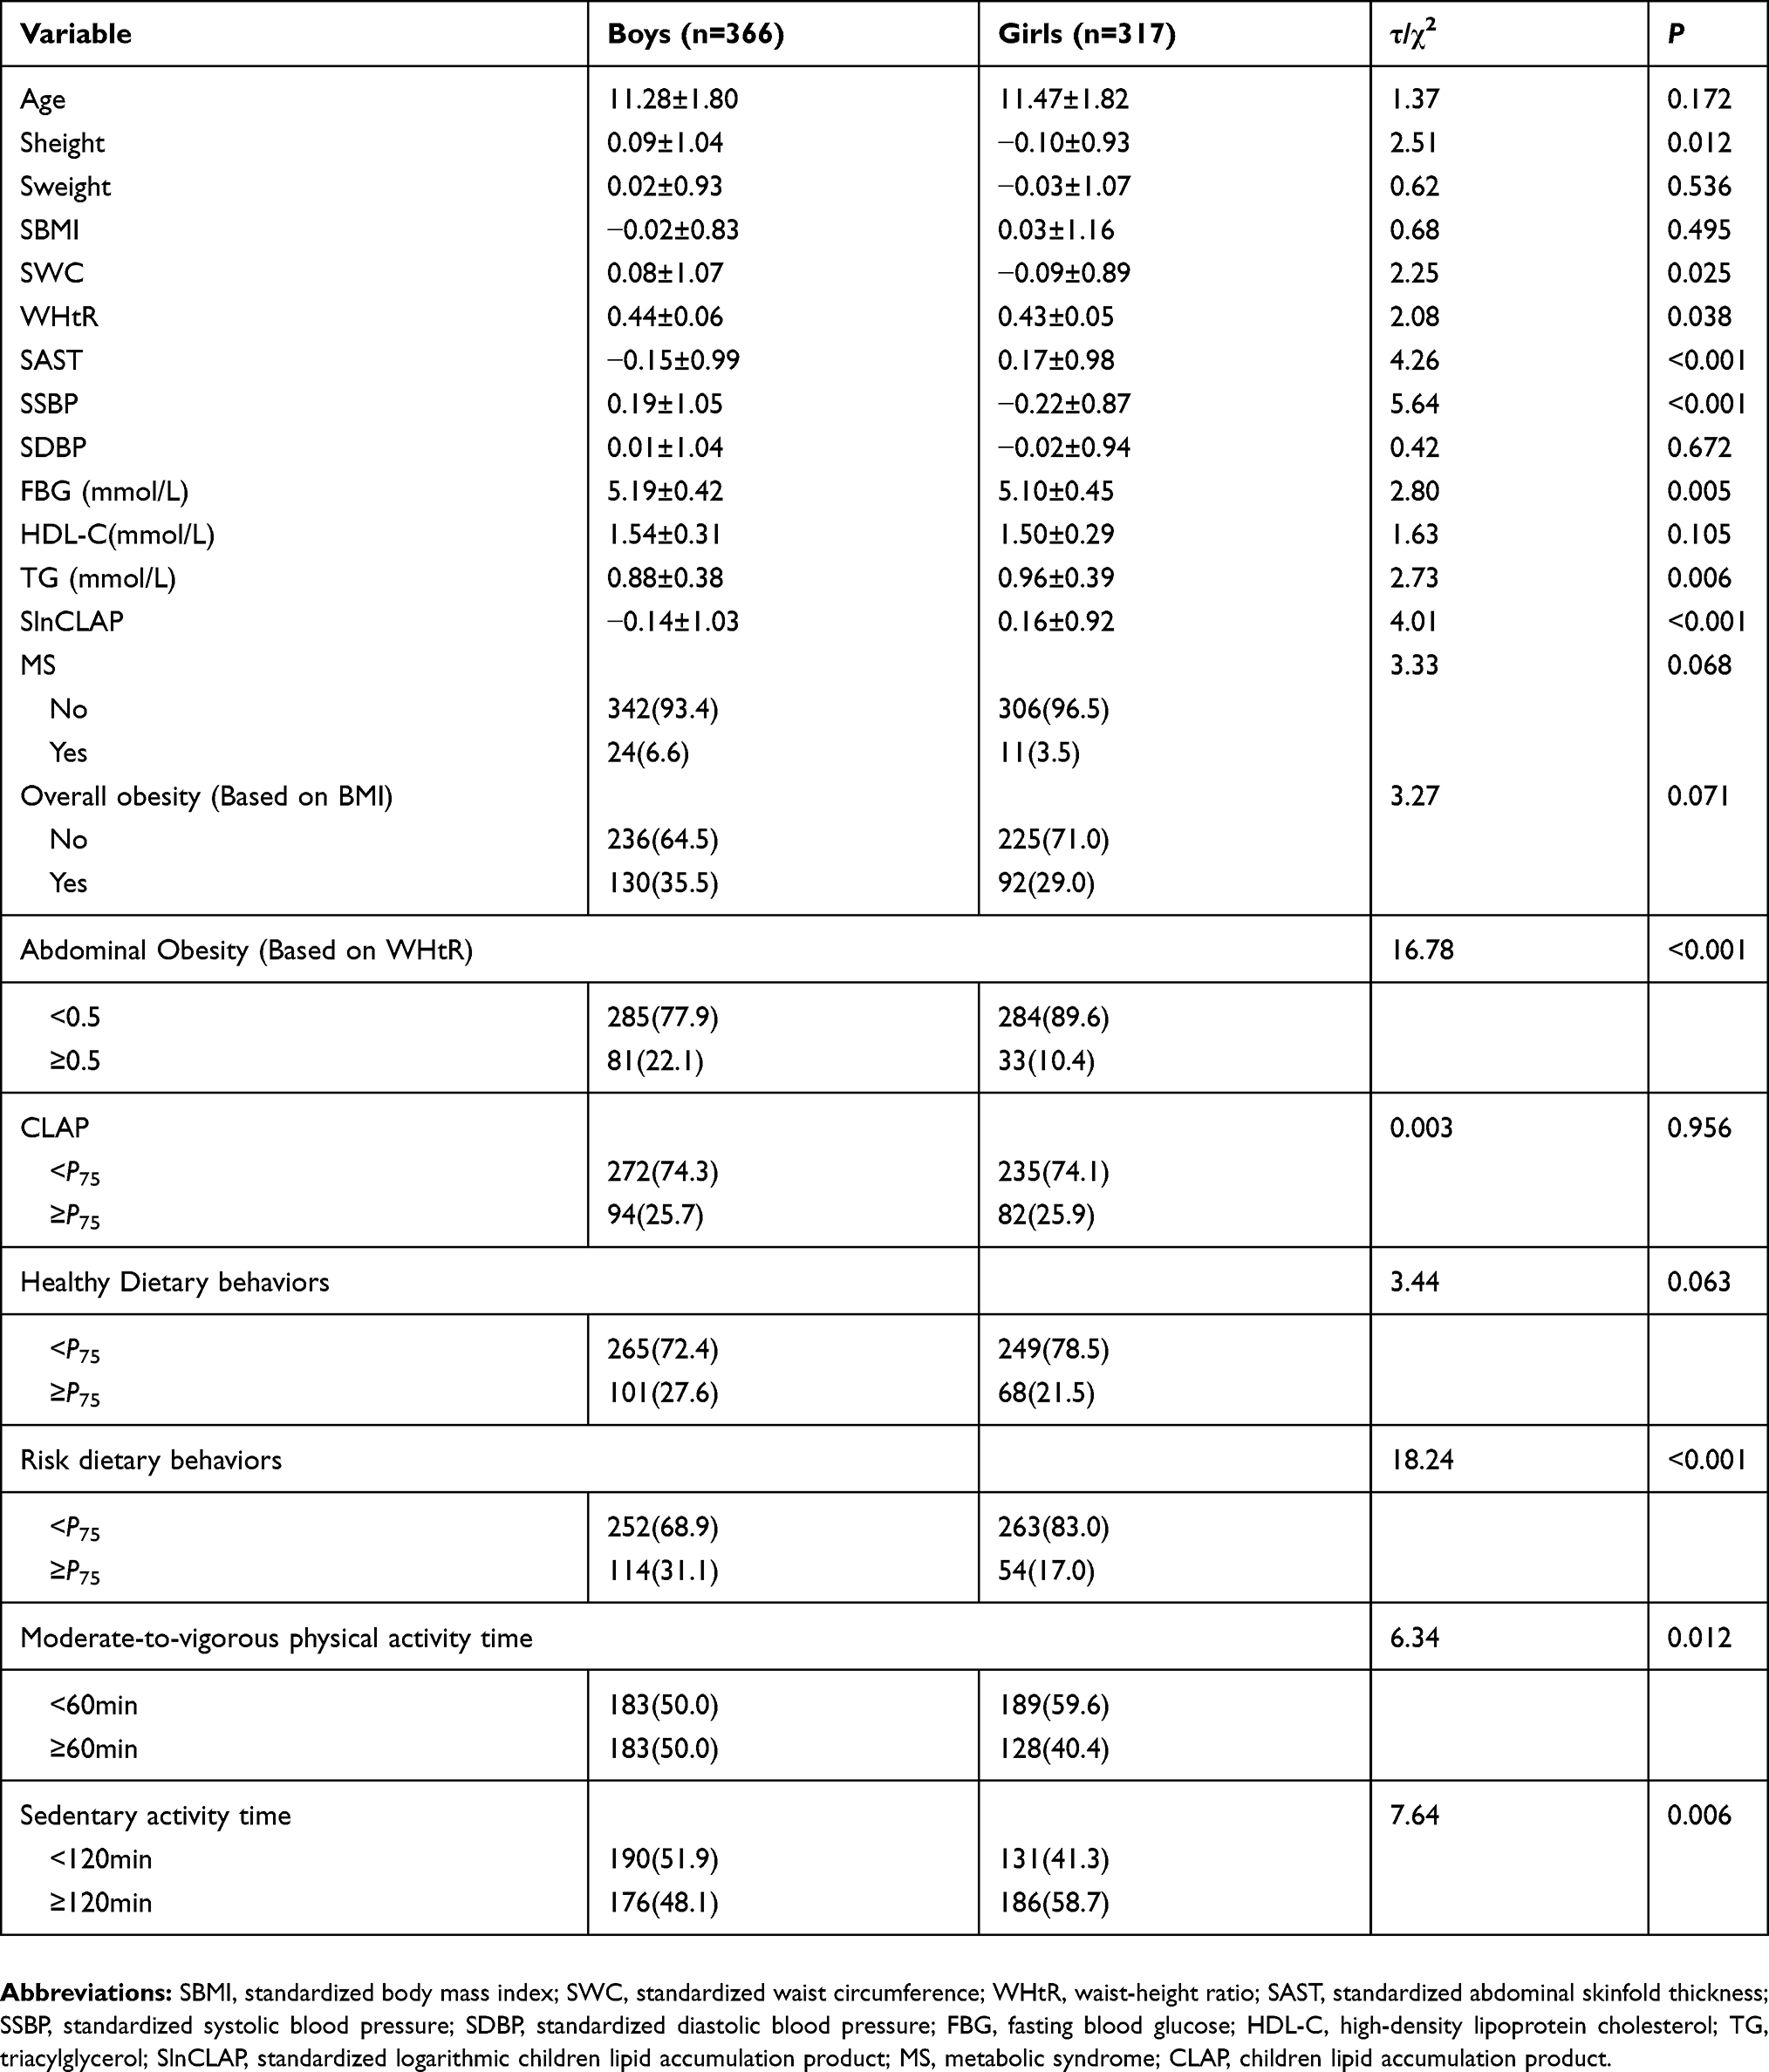 |
Table 1 The Comparison Of Demographic Characteristics, Dietary Behaviors, Physical Activities And Other Variables Between Different Genders |
As shown in Table 2, the age, height, weight, BMI, WC, WHtR, AST, SBP, DBP, FBG, TG and lnCLAP among children with MS were higher than those among children with no MS, while HDL-C was lower (P<0.05). In addition, overall obesity (based on BMI), abdominal obesity (based on WHtR), CLAP≥P75, and moderate-to-vigorous physical activity time<60 min were risk factors for MS (P<0.05). However, there were no significant associations between MS and healthy dietary behaviors, risk dietary behaviors and sedentary activity time (P>0.05).
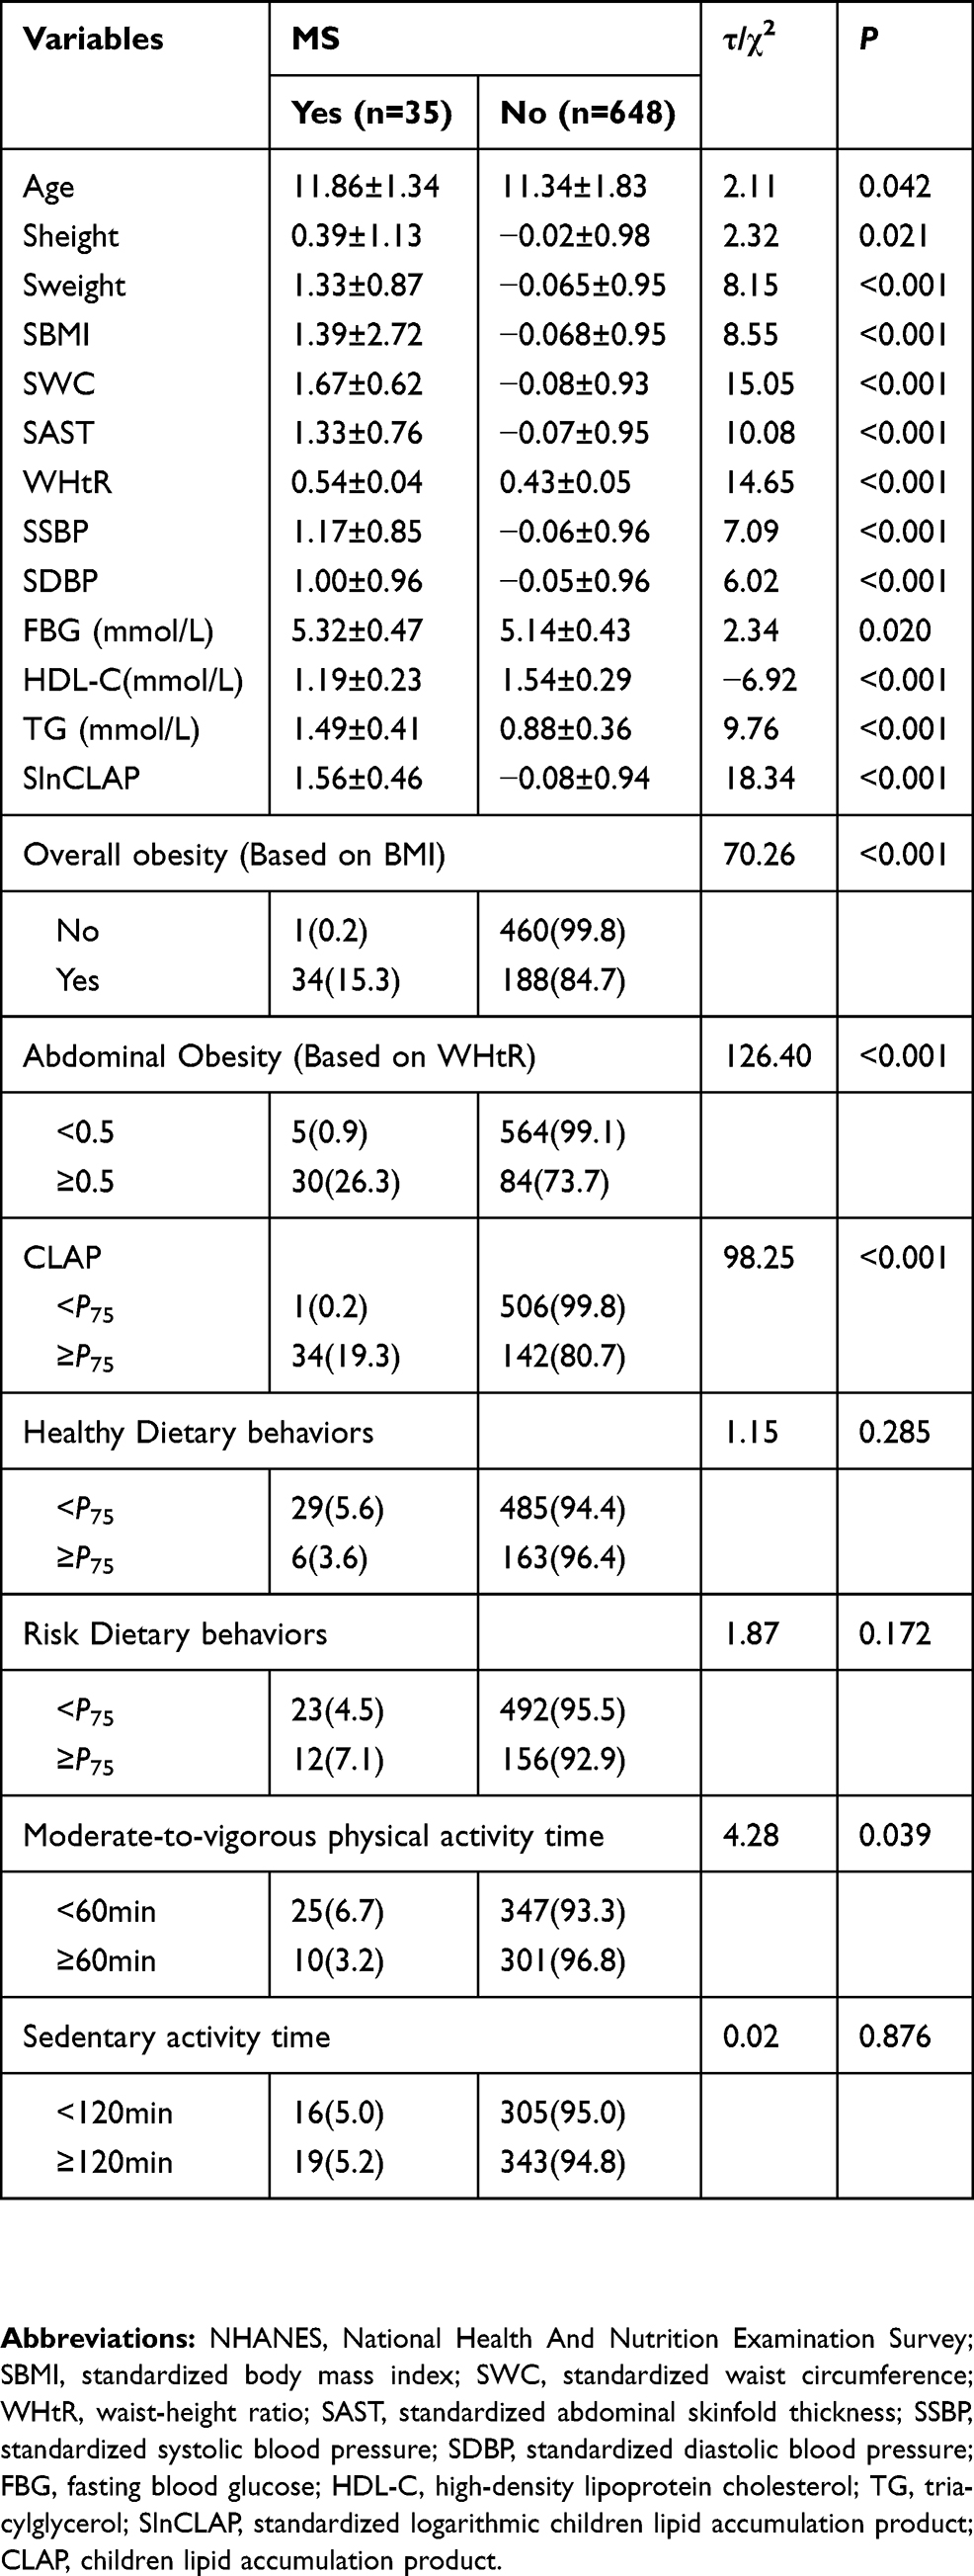 |
Table 2 Demographic Characteristics And Prevalence Of The Metabolic Syndrome Among Chinese Children And Adolescents Aged 8–15 Years, NHANES Ⅲ |
As shown in Table 3, the overall obesity (based on BMI), abdominal obesity (based on WHtR) and CLAP ≥P75 were still risk factors for MS after adjusting for age, gender, risk dietary behaviors, sedentary activity time and moderate-to-vigorous physical activity time factors (ORs (95% CIs): 143.79(18.78–1101.22), 86.83 (27.19–277.27), and 150.75(20.11–1130.19), respectively). In addition, moderate-to-vigorous physical activity time<60 min was also a risk factor for MS (ORs (95% CIs):3.60 (1.52–8.50), 3.68 (1.49–9.14), and 3.32 (1.41–7.82) in model 1, model 2 and model 3, respectively).
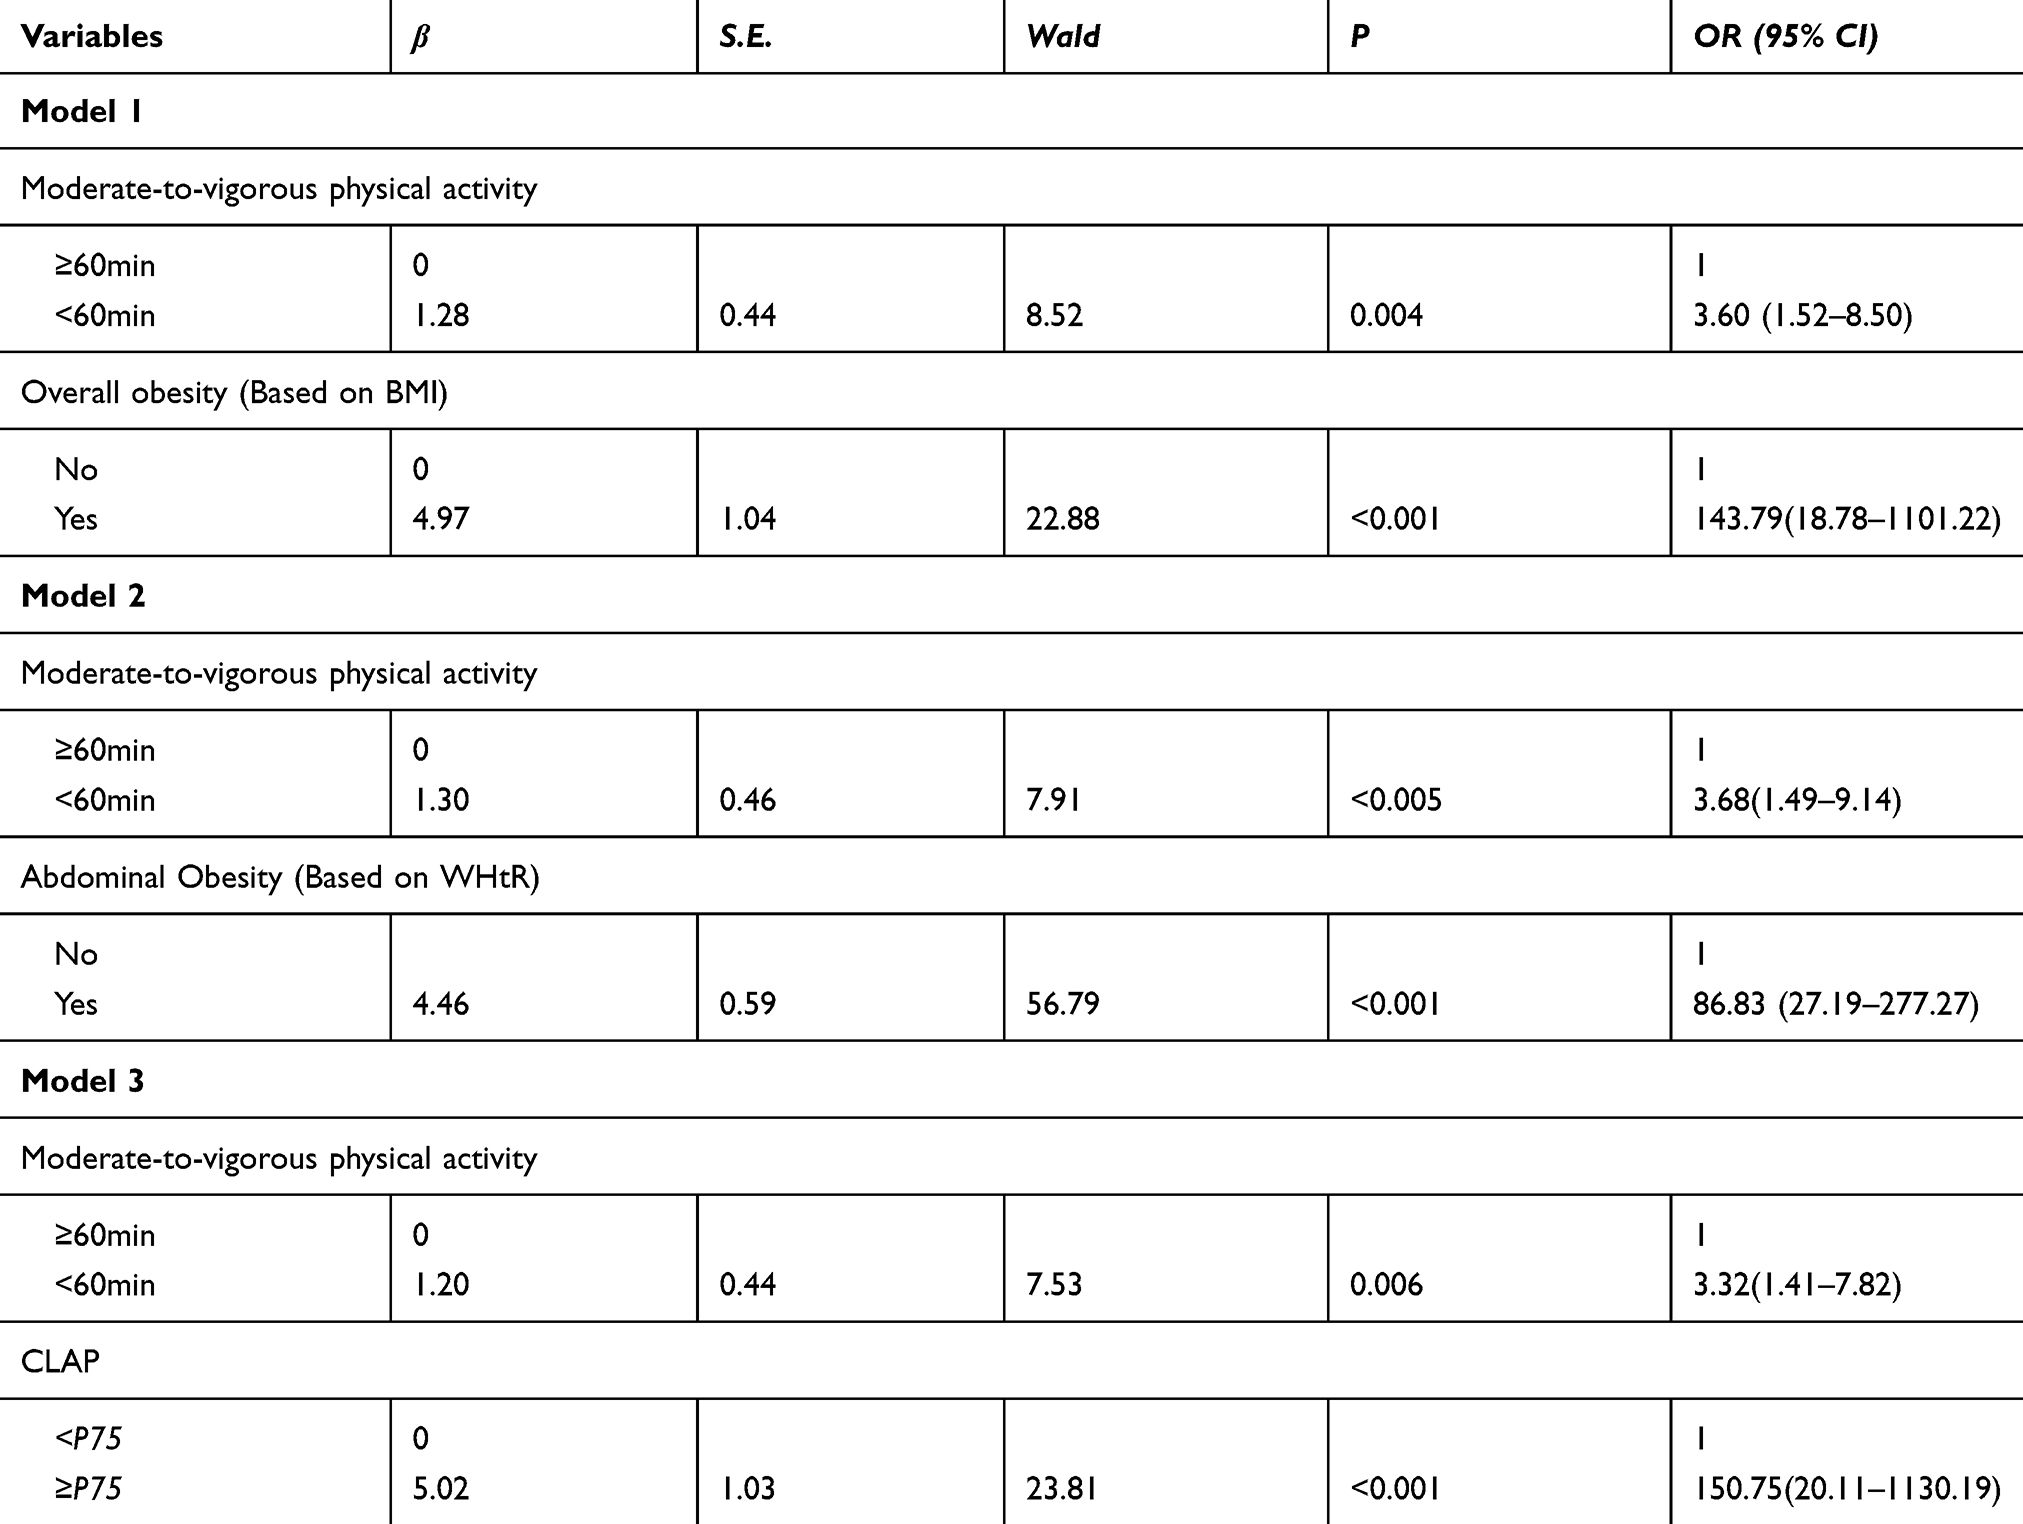 |
Table 3 The Effect Of BMI, WHtR And CLAP On Metabolic Syndrome In Children And Adolescents Via Binary Logistic Regression Analysis |
The receiver operating characteristic (ROC) curve was generated to detect the predictive capabilities of CLAP, BMI and WHtR for predicting MS (Figure 1). The area under the ROC curve (AUC) of lnCLAP, BMI and WHtR for predicting MS was 0.944 (0.913–0.975), 0.895 (0.864–0.927), and 0.928 (0.903–0.953), respectively.
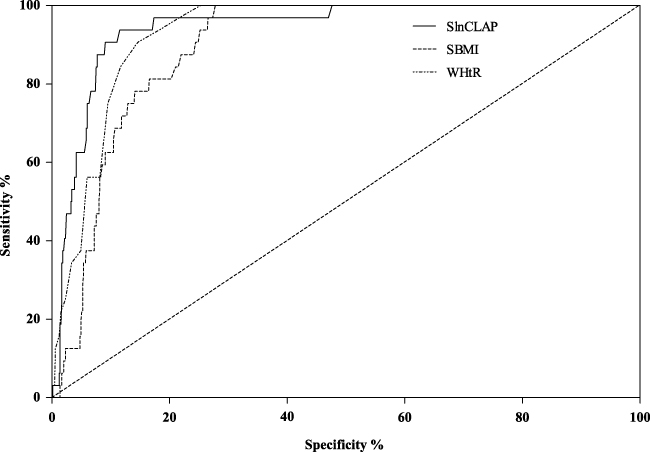 |
Figure 1 ROC curves of SlnCLAP, SBMI, WHtR for predicting metabolic syndrome among children and adolescents. |
Discussion
With the increasing prevalence of overweight and obesity in children and adolescents, MS has become an important public health issue that affects the health of children into adulthood.4,26 The current study showed that the overall prevalence of MS in children and adolescents was 5.1%, 6.6% in boys and 3.5% in girls. Kim et al27 reported that the overall MS prevalence was 5.7% and was higher among boys (5.8%) than among girls (5.5%) (based on the modified NCEP-ATP III) in Korean children. The results from the Chinese Work Group of Pediatric Metabolic Syndrome’s survey showed that the prevalence of pediatric metabolic syndrome in six Chinese cities was 2.4%, 3.3% in boys versus 1.4% in girls (based on MS-CHN2012).28 Ye et al29 also indicated that the prevalence of MS in boys was higher than that in girls’ in China. The higher prevalence of MS in boys may be related to dietary factors. Our study showed that the proportion of risk dietary behaviors (≥P75) in boys was significantly higher than that in girls. The study from Pan et al30 indicated that the girls’ overall diet quality was better than the boys. However, there was also a study that showed that the prevalence of MS in girls was higher than in boys.31 This finding might be related to a family history of obesity or MS.32,33 Additionally, we found a significant gender difference in WHtR, SBP, FBG and TG, and boys had higher values of WHtR, SBP and FBG and lower values of TG, which was consistent with the studies from Yang et al.34 and Kim et al.27
The current study showed that sedentary activity time was not related to MS, which was also consistent with the study from Wang et al.35 However, our study showed that moderate-to-vigorous physical activity time<60 min was a risk factor for MS, which was in line with previous studies.36,37 Furthermore, the study by Chastin, et al38 and Stabelini Neto, et al39 also pointed out that moderate-to-vigorous physical activity was related to metabolic syndrome (MS) and encouraged children and adolescents to gradually replace part of their sedentary time with moderate-to-vigorous physical activity.
Previous studies have shown that BMI and WHtR are important indexes for predicting MS; however, they are limited in distinguishing lean mass from adipose tissue and in reflecting lipid accumulation in the circulating blood.40 An individual’s excess lipid fuel appears eventually as an enlarged abdomen or elevated circulating TG, indicating that available lipid fuels have exceeded the individual’s capacity to buffer and safely store this major form of acquired energy.15 In this study, TG, WC, and AST were significantly associated with MS. AST was defined as the skinfold thickness at the junction of the belly button horizontal line and right collarbone midline and reflected a point of abdominal fat accumulation. The product of WC and AST may reflect total abdominal fat accumulation. Therefore, the products of WC, AST and TG were used to establish the children’s lipid accumulation product (CLAP) to describe the lipid accumulation situation in this study. The results of the present study indicated that there were significant differences in CLAP (<P75 or ≥P75) between children and adolescents with and without MS. After adjusting for age, gender, risk dietary behaviors and moderate-to-vigorous physical activity time, CLAP≥P75 was still a risk factor for MS and was more strongly correlated with MS than BMI and WHtR. The studies of Ray et al41 and Rodeamontero et al11 showed that BMI, WHtR and LAP were correlated with metabolic syndrome and that LAP was a powerful marker for predicting adult MS better than BMI12,16 and WHtR9,17 in adults. Of course, an association between WHtR, BMI and MS might be affected by the different cutoffs of WHtR and BMI.42,43 In addition, the receiver operating characteristic (ROC) also showed that the CLAP had a stronger prediction accuracy. The area under the curve (AUC) for the CLAP was 0.944; the AUCs of BMI and WHtR were 0.895 and 0.928, respectively. Clearly, CLAP was a stronger risk factor for MS compared with BMI and WHtR.
There were still several limitations in the current study. The number of people with metabolic syndrome (MS) in this study was small, and the sample selection might be insufficient to represent the overall disease level of MS in children and adolescents. Finally, there was limited ability to infer causality between CLAP and MS for the present cross-sectional study.
In summary, the children’s lipid accumulation product (CLAP) was a novel indicator associated with MS in children and adolescents that was better than BMI and WHtR.
Acknowledgments
Yifei Zhang and Jingyao Hu are co-first authors. This work was supported by the National Natural Science Foundation of China (No. 81502823), the Outstanding Young Talent Key program of the College and University in Anhui Province (No. gxyqZD2017063) and the University Natural Science Foundation of Anhui Province (No. KJ2019A0298). The authors would like to thank the students who participated in the current study and Weige Jiang and Yu Liu for assisting with student recruitment.
Disclosure
All authors gave final approval of the submitted manuscript versions and declare no conflicts of interest in this work.
References
1. Falkner B, Cossrow ND. Prevalence of metabolic syndrome and obesity-associated hypertension in the racial ethnic minorities of the United States. Curr Hypertens Rep. 2014;16(7):449. doi:10.1007/s11906-014-0449-5
2. Kim CJ, Park J, Kang SW. Prevalence of metabolic syndrome and cardiovascular risk level in a vulnerable population. Int J Nurs Pract. 2015;21(2):175–183. doi:10.1111/ijn.12258
3. O’Neill S, O’Driscoll L. Metabolic syndrome: a closer look at the growing epidemic and its associated pathologies. Obes Rev. 2015;16(1):1–12. doi:10.1111/obr.12229
4. Cook S, Weitzman M, Auinger P, Nguyen M, Dietz WH. Prevalence of a metabolic syndrome phenotype in adolescents: findings from the third National Health and Nutrition Examination Survey, 1988-1994. Arch Pediatr. 2003;157(8):821–827. doi:10.1001/archpedi.157.8.821
5. Miller JM, Kaylor MB, Johannsson M, Bay C, Churilla JR. Prevalence of metabolic syndrome and individual criterion in US adolescents: 2001-2010 National Health and Nutrition Examination Survey. Metab Syndr Relat Disord. 2014;12(10):527–532. doi:10.1089/met.2014.0055
6. Wang ZH, Zou ZY, Wang S, et al. Analysis of the epidemiological characteristics of metabolic syndrome among 10-16 adolescents in 7 provinces in China, 2012. Chin J Preventive Med. 2017;51(4):295–299. doi:10.3760/cma.j.issn.0253-9624.2017.04.004
7. Daniels SR, Greer FR. Lipid screening and cardiovascular health in childhood. Pediatrics. 2008;122(1):198–208. doi:10.1542/peds.2008-1349
8. Lim S, Shin H, Song JH, et al. Increasing prevalence of metabolic syndrome in Korea: the Korean National Health and Nutrition Examination Survey for 1998-2007. Diabetes Care. 2011;34(6):1323–1328. doi:10.2337/dc10-2109
9. Ejike C. Lipid accumulation product and waist-to-height ratio are predictors of the metabolic syndrome in a Nigerian male geriatric population. J Rural Trop Public Health. 2011;10:101–105.
10. Al-Hamad D, Raman V. Metabolic syndrome in children and adolescents. Trans Pediatr. 2017;6:397–407. doi:10.21037/tp.2017.10.02
11. Rodea-Montero ER, Evia-Viscarra ML, Apolinar-Jimenez E. Waist-to-height ratio is a better anthropometric index than waist circumference and BMI in predicting metabolic syndrome among obese Mexican adolescents. Int J Endocrinol. 2014;2014:195407. doi:10.1155/2014/195407
12. Liu C, Zhang LJ. Research progress of new type body fat indexes of lipid accumulation product index and visceral adiposity index. Chin J Diabetes. 2016;24(11):1032–1035. doi:10.3969/j.issn.1006-6187.2016.11.16
13. Sidossis L, Kajimura S. Brown and beige fat in humans: thermogenic adipocytes that control energy and glucose homeostasis. J Clin Invest. 2015;125(2):478–486. doi:10.1172/jci78362
14. Prado CM, Gonzalez MC, Heymsfield SB. Body composition phenotypes and obesity paradox. Curr Opin Clin Nutr Metab Care. 2015;18(6):535–551. doi:10.1097/mco.0000000000000216
15. Kahn HS. The “lipid accumulation product” performs better than the body mass index for recognizing cardiovascular risk: a population-based comparison. BMC Cardiovasc Disord. 2005;5:26. doi:10.1186/1471-2261-5-26
16. Taverna MJ, Martinez-Larrad MT, Frechtel GD, Serrano-Rios M. Lipid accumulation product: a powerful marker of metabolic syndrome in healthy population. Eur J Endocrinol. 2011;164(4):559–567. doi:10.1530/eje-10-1039
17. Guo SX, Zhang XH, Zhang JY, et al. Visceral adiposity and anthropometric indicators as screening tools of metabolic syndrome among low income rural adults in Xinjiang. Sci Rep. 2016;6:36091. doi:10.1038/srep36091
18. Shi X. Dietary guidelines for chinese residents. Chin J Woman Child Health Res. 2016;27(5):670.
19. Huang YJ, Wong SH, Salmon J. Reliability and validity of the modified Chinese version of the Children’s Leisure Activities Study Survey (CLASS) questionnaire in assessing physical activity among Hong Kong children. Pediatr Exerc Sci. 2009;21(3):339–353.
20. Australian Government Department of Health. Australian 24 hr movement guidelines for children and young people (5-17 years) – an integration of physical activity, sedentary behaviour and sleep. 02 April 2019. Commonwealth of Australia. Available from: https://www1.health.gov.au/internet/main/publishing.nsf/Content/ti-5-17years.
21. Villagran Perez S, Novalbos-Ruiz JP, Rodriguez-Martin A, Martinez-Nieto JM, Lechuga-Sancho AM. Implications of family socioeconomic level on risk behaviors in child-youth obesity. Nutr Hosp. 2013;28(6):1951–1960. doi:10.3305/nutrhosp.v28in06.6848
22. Song P, Li X, Gasevic D, Flores AB, Bmi YZ. Waist circumference reference values for chinese school-aged children and adolescents. Int J Environ Res Public Health. 2016;13(6). doi:10.3390/ijerph13060589
23. Mi J, Wang TY, Meng HL, et al. Development of blood pressure reference standards for Chinese children and adolescents. Chin J Evid Based Pediatr. 2010;5(1):4–14. doi:10.3969/j.issn.1673-5501.2010.01.002
24. Group of China Obesity Task Force. Body mass index reference norm for screening overweight and obesity in Chinese children and adolescents. Chin J Epidemiol. 2004;25(2):97–102.
25. Hsieh SD, Yoshinaga H, Muto T. Waist-to-height ratio, a simple and practical index for assessing central fat distribution and metabolic risk in Japanese men and women. Int J Obes Relat Metab Disord. 2003;27(5):610–616. doi:10.1038/sj.ijo.0802259
26. Gordon-Larsen P, Wang H, Popkin BM. Overweight dynamics in Chinese children and adults. Obes Rev. 2014;15(Suppl 1):37–48. doi:10.1111/obr.12121
27. Kim S, So WY. Prevalence of metabolic syndrome among korean adolescents according to the national cholesterol education program, adult treatment panel III and international diabetes federation. Nutrients. 2016;8(10):588. doi:10.3390/nu8100588
28. Wang CL, Liang L, Fu JF, et al. Prevalence of metabolic syndrome of children and adolescent students in Chinese six cities. Chin J Pediatr. 2013;51(6):409–413. doi:10.3760/cma.j.issn.0578-1310.2013.06.004
29. Ye P, Yan Y, Ding W, et al. Prevalence of metabolic syndrome in Chinese children and adolescents: a meta-analysis. Chin J Epidemiol. 2015;36(8):884–888. doi:10.3760/cma.j.issn.0254-6450.2015.08.025
30. Pan Y, Pratt CA. Metabolic syndrome and its association with diet and physical activity in US adolescents. J Am Diet Assoc. 2008;108(2):276–286. doi:10.1016/j.jada.2007.10.049
31. Tandon N, Garg MK, Singh Y, Marwaha RK. Prevalence of metabolic syndrome among urban Indian adolescents and its relation with insulin resistance (HOMA-IR). J Pediatr Endocrinol Metab. 2013;26(11–12):1123–1130. doi:10.1515/jpem-2013-0020
32. Monzani A, Rapa A, Fuiano N, et al. Metabolic syndrome is strictly associated with parental obesity beginning from childhood. Clin Endocrinol. 2014;81(1):45–51. doi:10.1111/cen.12261
33. Oh MS, Kim S, Jang JH, et al. Associations among the degree of nonalcoholic fatty liver disease, metabolic syndrome, degree of obesity in children, and parental obesity. Pediatr Gastroenterol Hepatol Nutr. 2016;19(3):199–206. doi:10.5223/pghn.2016.19.3.199
34. Yang Y, Dong B, Wang S, et al. Prevalence of high blood pressure subtypes and its associations with BMI in Chinese children: a national cross-sectional survey. BMC Public Health. 2017;17(1):598. doi:10.1186/s12889-017-4522-2
35. Wang YY, Xiong F, Zhang YN, et al. Survey on components of the metabolic syndrome and analysis of its influencing factors among 7-16 years old children and adolescents in Chongqing. J Chongqing Med Univ. 2016;41(10):1069–1075. doi:10.13406/j.cnki.cyxb.001033
36. Mehairi AE, Khouri AA, Naqbi MM, et al. Metabolic syndrome among Emirati adolescents: a school-based study. PLoS One. 2013;8(2):e56159. doi:10.1371/journal.pone.0056159
37. Kelishadi R, Hovsepian S, Djalalinia S, Jamshidi F, Qorbani M. A systematic review on the prevalence of metabolic syndrome in Iranian children and adolescents. J Res Med Sci. 2016;21:90. doi:10.4103/1735-1995.192506
38. Chastin SF, Palarea-Albaladejo J, Dontje ML, Skelton DA. Combined effects of time spent in physical activity, sedentary behaviors and sleep on obesity and cardio-metabolic health markers: a novel compositional data analysis approach. PLoS One. 2015;10(10):e0139984. doi:10.1371/journal.pone.0139984
39. Stabelini Neto A, de Campos W, Dos Santos GC, Mazzardo Junior O. Metabolic syndrome risk score and time expended in moderate to vigorous physical activity in adolescents. BMC Pediatr. 2014;14:42. doi:10.1186/1471-2431-14-42
40. Weber DR, Leonard MB, Shults J, Zemel BS. A comparison of fat and lean body mass index to BMI for the identification of metabolic syndrome in children and adolescents. J Clin Endocrinol Metab. 2014;99(9):3208–3216. doi:10.1210/jc.2014-1684
41. Ray L, Ravichandran K, Nanda SK. Comparison of lipid accumulation product index with body mass index and waist circumference as a predictor of metabolic syndrome in Indian population. Metab Syndr Relat Disord. 2018;16(5):240–245. doi:10.1089/met.2017.0119
42. Monzani A, Rapa A, Prodam F, et al. High discrepancy in abdominal obesity prevalence according to different waist circumference cut-offs and measurement methods in children: need for age-risk-weighted standardized cut-offs? PLoS One. 2016;11(1):e0146579. doi:10.1371/journal.pone.0146579
43. Bravo J, Raimundo AM, Santos DA, Timon R, Sardinha LB. Abdominal obesity in adolescents: development of age-specific waist circumference cut-offs linked to adult IDF criteria. Am J Hum Biol. 2017;29(6):e23036. doi:10.1002/ajhb.23036
 © 2019 The Author(s). This work is published and licensed by Dove Medical Press Limited. The
full terms of this license are available at https://www.dovepress.com/terms
and incorporate the Creative Commons Attribution
- Non Commercial (unported, 3.0) License.
By accessing the work you hereby accept the Terms. Non-commercial uses of the work are permitted
without any further permission from Dove Medical Press Limited, provided the work is properly
attributed. For permission for commercial use of this work, please see paragraphs 4.2 and 5 of our Terms.
© 2019 The Author(s). This work is published and licensed by Dove Medical Press Limited. The
full terms of this license are available at https://www.dovepress.com/terms
and incorporate the Creative Commons Attribution
- Non Commercial (unported, 3.0) License.
By accessing the work you hereby accept the Terms. Non-commercial uses of the work are permitted
without any further permission from Dove Medical Press Limited, provided the work is properly
attributed. For permission for commercial use of this work, please see paragraphs 4.2 and 5 of our Terms.