Back to Journals » Clinical, Cosmetic and Investigational Dermatology » Volume 11
A novel animal model for residence time evaluation of injectable hyaluronic acid-based fillers using high-frequency ultrasound-based approach
Authors Merola F, Scrima M ![]() , Melito C, Iorio A, Pisano C, Giori AM
, Melito C, Iorio A, Pisano C, Giori AM ![]() , Ferravante A
, Ferravante A ![]()
Received 10 November 2017
Accepted for publication 23 February 2018
Published 11 July 2018 Volume 2018:11 Pages 339—346
DOI https://doi.org/10.2147/CCID.S156740
Checked for plagiarism Yes
Review by Single anonymous peer review
Peer reviewer comments 2
Editor who approved publication: Dr Jeffrey Weinberg
Filomena Merola,1 Mario Scrima,1 Carmela Melito,1 Antonio Iorio,1 Claudio Pisano,2 Andrea Maria Giori,3 Angela Ferravante1
1Research and Development, Bouty SpA, Ariano Irpino, Italy; 2Medicinal Investigational Research, Biogem, Ariano Irpino, Italy; 3Research and Development, IBSA Farmaceutici Italia, Lodi, Italy
Background: Hyaluronic acid (HA)-based devices are among the most popular filler agents for skin rejuvenation. One of the principal goals is the improvement in residence time of HA-based products, to increase their performance and reduce frequency of the treatment. So, understanding fillers, behavior after subcutaneous injection is a fundamental aspect for discovery and optimization of new products. Current in vivo approaches to detect/quantify injected HA fillers are not always well optimized or easy to apply.
Objective: To develop more efficacious and noninvasive diagnostic tools to make a quantitative evaluation of the degradation of fillers in a small animal model.
Materials and methods: We evaluated the residence time of different HA-based fillers, fluorescein-labeled and not, injected subcutaneously in mice. Volumes of fillers were monitored through high-frequency ultrasound (HF-US) method while fluorescence intensity through the well-established fluorescence living imaging method. To confirm the effectiveness of HF-US, obtained volumetric measurements were compared with fluorescence intensity values.
Results: Both the presented methods revealed the same degradation kinetics for the tested products.
Conclusion: The two used methods are fully comparable and quantitatively accurate. The presented approach has been proved to be noninvasive, sensitive, and reproducible.
Keywords: hyaluronic acid, hyaluronan, dermal filler, HF-US, ultrasound, animal model
Introduction
Hyaluronic acid (HA) is one of the most abundant macromolecules of the extracellular matrix of mammals. Its structure is highly conserved in evolution and the molecule appears identical in rodents and humans. Also, the mechanisms of degradation in vivo, based on the activity of endogenous hyaluronidases1 and on the action of free radicals and reactive oxygen species associated with inflammatory processes,2,3 are very similar.
Literature data illustrate HA use for therapeutic purposes due to its good safety, biocompatibility, and bio-revitalizing properties.4 In fact, HA is used in treatment of knee pains due to osteoarthritis5,6 of wound healing and tissue regeneration,7,8 and for dermo-aesthetic applications,9 like the nonsurgical procedures of soft tissue augmentation through the injection of HA-based dermal fillers.10 HA is extremely hydrophilic and thanks to its ability to produce a gel after subcutaneous injection, it absorbs water increasing in volume and fills the soft tissue space creating a smooth and natural appearance.11
Nowadays, an extended range of HA-based products exists, providing an advanced bespoke aesthetic solution for smoothing and filling wrinkles, restoring facial volumes, and rehydrating skin. To meet the different structural and functional needs of skin, two main categories of dermal fillers were developed: the linear HA-based fillers (e.g., Belotero Soft, Merz Pharma Italia, Milan, Italy; Viscoderm, IBSA Farmaceutici Italia, Lodi, Italy), used for mesotherapy and skin rejuvenation, thanks to their bio-revitalizing properties,12 and the chemically modified cross-linked HA-based fillers (e.g., Juvedérm Ultra XC, Allergan SpA, Rome, Italy; Restylane Silk, Galderma Italia SpA, Agrate Brianza, Italy), used for restoring volume of deep wrinkles with longer-lasting effects.4 So, one of the major goals in the field of development of new HA-based fillers, properly aimed to the intended use, is to identify a fast, easy to apply, and noninvasive method to investigate their efficacy in terms of longevity after subcutaneous injection.
Nowadays, in the absence of an accepted animal model, the methods used to measure in vivo persistence of tissue fillers involve human patients, and they are based on a subjective visual analog scale assessment, thus depending on the skill and experience of the operator in performing these tasks.11,13 Moreover, current assessment techniques of filler performance, such as magnetic resonance imaging (MRI) and positron emission tomography–computed tomography, are not limited to evaluations of the skin surface topography and are able to monitor what is happening to the filler beneath the skin surface, but the disadvantage is that they are expensive and strongly invasive.14 High-frequency ultrasound (HF-US) could represent a fast and innovative technology to obtain high-resolution images of the skin, of the underlying tissues, and, eventually, of the subcutaneous injected compounds in an inexpensive and noninvasive manner.15,16 Furthermore, the new generation software allows the 3D reconstruction and measurements of the structures acquired by HF-US,17 making a quantitative estimation of residence time of fillers possible. This makes HF-US an ideal diagnostic instrument for testing the effectiveness and the lifetime of subcutaneous or intradermal skin products.
The aim of this study was to develop an animal model to make a quantitative monitoring of the lifetime of soft tissue fillers through HF-US.
To this purpose, we inoculated different formulations of HA (representative of the two main commercial families of fillers) subcutaneously in mice and measured the volume of injected products through the HF-US image diagnostic system over time.
To confirm the results obtained with HF-US, we replicated the experiment by inoculating fluorescein-labeled HA products, measuring their signal over time with a fluorescence living imaging (FLI) diagnostic system. To check the validity of the method using the naturally occurring molecule and not a chemically modified form, only linear HA was tested with both methods.18 In addition to setting up the new diagnostic technique, this study allowed us to collect data about residence time of tested dermal fillers. Surprisingly, we observed that residence time of linear HA fillers in vivo was longer than that suggested by in vitro studies.19 Cross-linked fillers showed degradation kinetics in accordance with previous literature results.20
Materials and methods
Animals
The animal protocol (no 4511) was approved by the Italian “Ministero della Salute”; all the experimental procedures were performed according to Italian guidelines and regulations. CD1 mice (female, 8–10 weeks, not pregnant) were purchased from Charles River Laboratories. Prior to the experiments, animals were housed for 7 days for acclimatization to animal room conditions.
Hyaluronic acid products
Linear HA 0.8% w/v (L-HA 0.8%) was prepared by dissolving sodium hyaluronate (MW 800 kDa; provided by Altergon Italia Srl, Morra De Sanctis, AV, Italy) in buffered saline solution (phosphate buffer, pH 7.0, osmolality: 300 mOsm/Kg). 1,4-Butanediol diglycidyl ether (BDDE)-cross-linked HA 2.5% w/v (CL-HA 2.5%) was prepared from the same starting materials according to the procedure described in the patent21 (example 1). Hyaluronic Acid, Bovine Trachea, Fluorescein-Labeled Calbiochem (herein referred to as L-HA-F) was purchased from EMD Millipore (Billerica, MA,USA). L-HA-F was dissolved in phosphate buffer (pH 7.0) to obtain concentrations of 0.1% and 0.8% w/v. Solutions of L-HA (0.86 mL) and L-HA-F (0.14 mL) were pooled in order to obtain a final concentration of 0.015% w/v of L-HA-F and 0.69% w/v of L-HA.
Experimental groups
A total of 12 mice were used, allocated in four experimental groups with three animals in each, as described in Table 1.
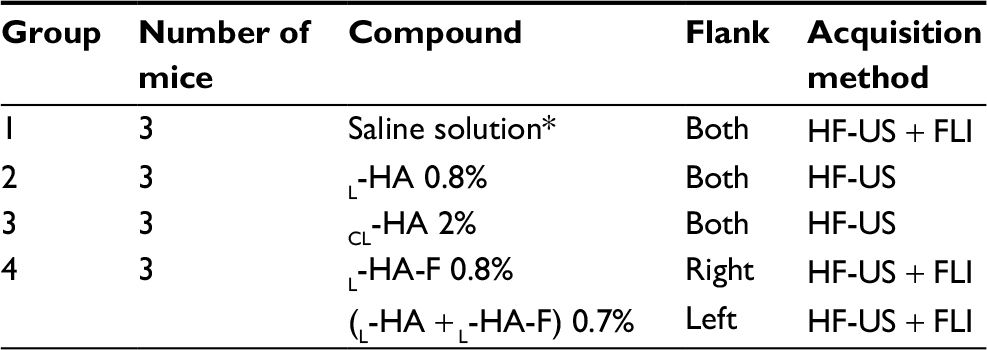 | Table 1 Experimental groups Note: *Saline solution 0.9% was used as negative control Abbreviations: L-HA, linear hyaluronic acid; CL-HA, cross-linked hyaluronic acid; L-HA-F, fluorescein-labeled linear hyaluronic acid; HF-US, high-frequency ultrasound; FLI, fluorescence living imaging. |
Administration procedure
General anesthesia was used for all procedures. Each mouse was placed in a chamber and inhalation anesthesia (1–2% isoflurane, oxygen flow 2 L/min) was delivered until the mice lost their righting reflex. The animals were maintained on inhalation anesthesia (on a scavenged mask circuit of 1–3% isoflurane) throughout the preparation and the acquisition period. Sterile procedures were followed in all operations. All mice were shaved in the dorsal region and disinfected. A subcutaneous injection of 200 µL of each compound was given paraspinally along the dorsum of each mouse on each side of the vertebral column. Injection was performed with a prefilled syringe assembled with a 27G needle. Care was taken to ensure equal injection distance and consistent injection shape was maintained in the mouse skin.
Fluorescence living imaging
Mice were imaged on days 0, 1, 2, 3, 4, 7, and then weekly until the end of the study using the IVIS Spectrum 200 (PerkinElmer, Inc., Massachusetts, MA, USA) for quantitative evaluation of fluorescence intensity. The mice were anesthetized by inhalation of 1–2% isoflurane with 1% oxygen during the imaging session. Mice of groups 1 and 4 were imaged with their dorsal sides toward the camera, so that the fluorescence signal could be totally acquired. Fluorescence images were collected at predetermined series of exposure times using the following settings: excitation filter 500/10; emission filter 540/10; Bin 8; Field of view 21.6 cm; F stop 2. All images were processed for contrast and brightness and analyzed. Identical regions of interest (ROIs) were drawn around the site of injection on both flanks of each mouse. The total radiant efficiency of the area inside the ROIs ([p/s]/[µW/cm2]) was measured with the Living Image Software (PerkinElmer, Inc). Higher fluorescence intensity with respect to the background value (1×10⁵ [p/s]/[μW/cm2]) was considered as a positive signal. Raw data were saved at the end of each session and processed at the end of the study.
HF-US living imaging
US imaging was performed on the same day of fluorescence imaging. Anesthetized mice were placed on a thermostatically controlled heating pad to maintain body temperature. The volume of mounds generated after the injection of test item was imaged with the VisualSonics Vevo™ 2100 In Vivo High-Resolution Micro-Imaging System (VisualSonics Inc., Toronto, ON, Canada). With mice lying on injection sides (left and right side), an aqueous ultrasonic gel was applied to the skin overlying the mounds. A transducer mounted to a 3D motor on a rail system with central frequency at 40 MHz was used. The US scan head linearly translated across the mouse’s skin on the 3D motor rail system, and 2D images were acquired at regular spatial intervals such that they were parallel and uniformly spaced over the entire mound. The 3D images were constructed and displayed through the parallel 2D image planes. Drawing the ROIs on the sequence of 2D images collected during the scan enables the Vevo 2100 3D image software to generate 3D volumetric sonograms (Figure 1C) and to calculate the final volume.
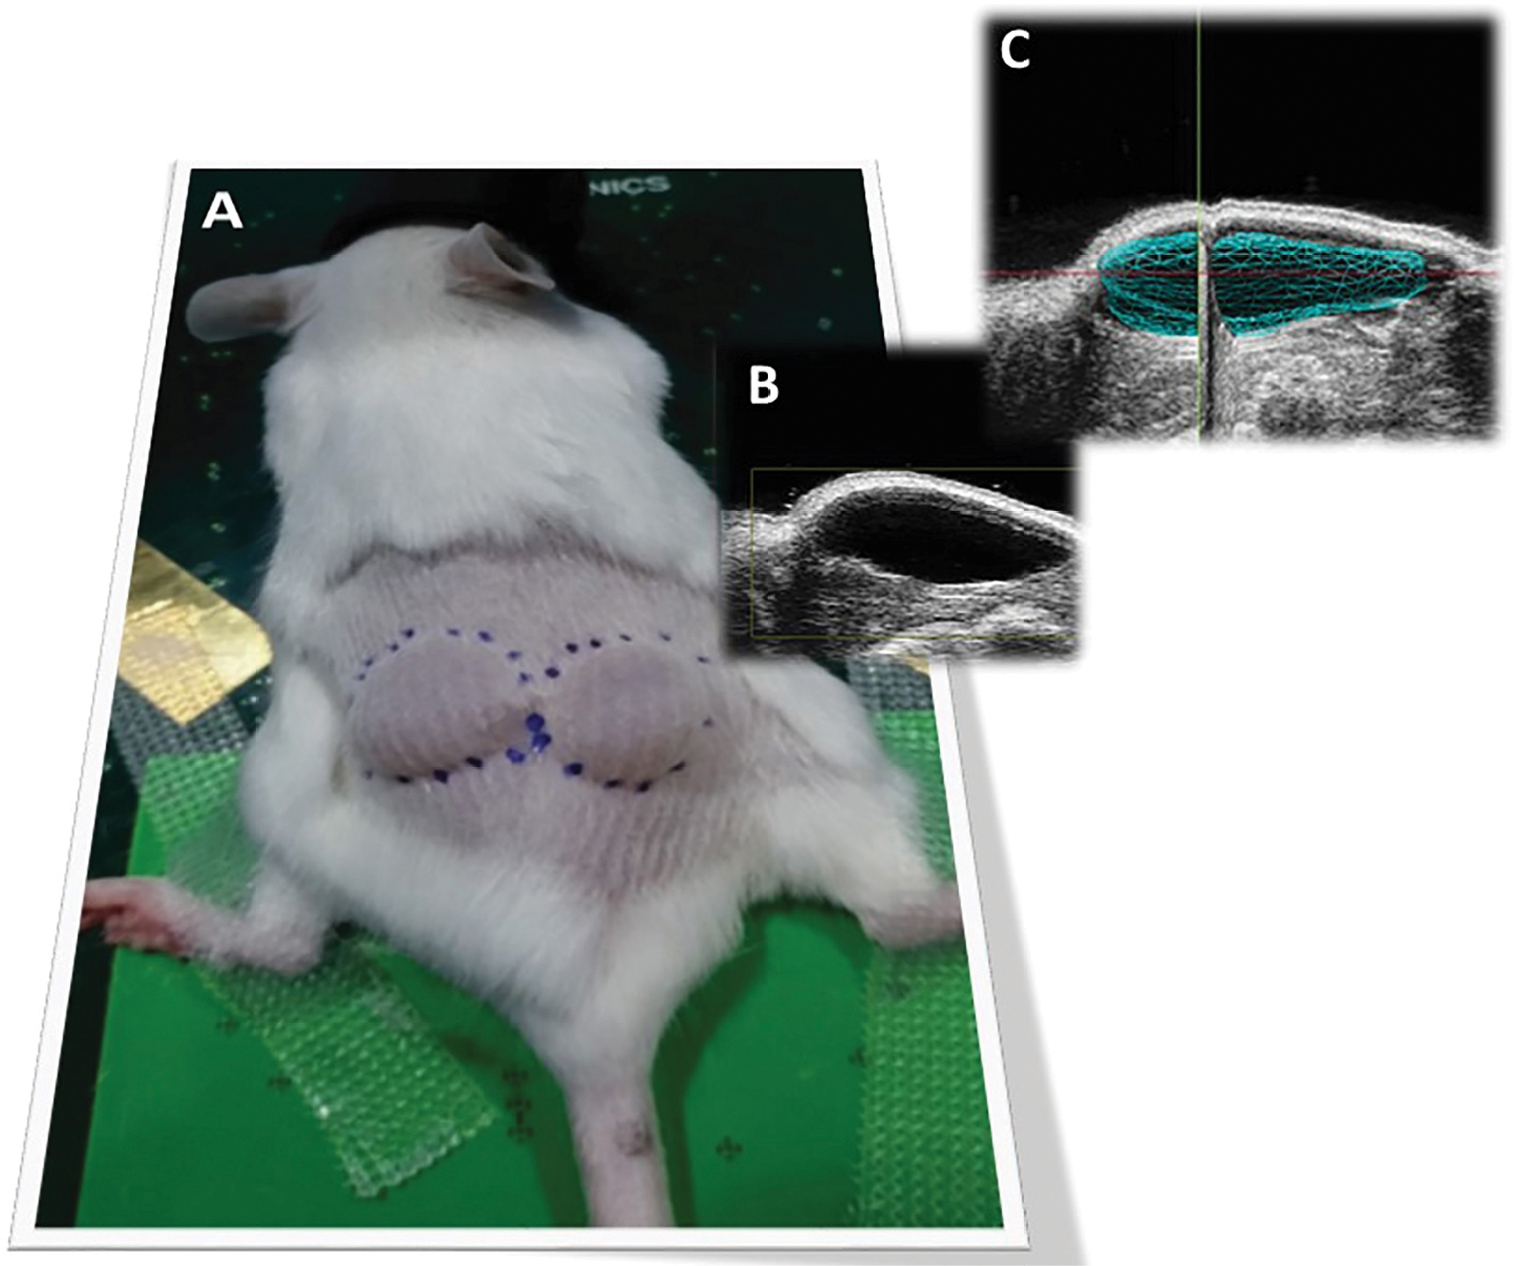 | Figure 1 (A) Subcutaneous injection of test items. On the dorsal region of the mouse are visible the two mounds generated by injection of test items. (B) Bi-dimensional image. Sonographic image of the subcutaneous injection of dermal filler in the dorsal area. The filler appears as anechogenic area. (C) Three-dimensional image of a dermal filler. The figure shows a 2D ultrasound image and the 3D reconstruction of the volume occupied by the filler. |
Statistical analysis
Statistical analysis was conducted using the software GraphPad Prism® 6.07. Correlation and statistical significance were calculated through Student’s t-test and Pearson’s correlation (P<0.01).
Results
In this work, degradation kinetics of two different formulations of HA-based soft tissue fillers (linear HA [L-HA 0.8%] and cross-linked HA [CL-HA 2.5%]) was evaluated. A new and innovative approach based on HF-US living imaging system was used to monitor fillers’ longevity in a small animal model.
Monitoring of filler longevity through HF-US
L-HA 0.8% and CL-HA 2.5% were injected subcutaneously (in left and right flanks, respectively), producing a visible mound on the dorsum of the mice (Figure 1A). HF-US diagnostic system was used to visualize the volume occupied by the products under the skin. In fact, subcutaneously injected fillers appeared as ovoidal hypoechogenic (black) mounds just below the line (white/gray) of the skin (Figure 1B and C). L-HA 0.8% remained detectable through HF-US for 22 days, reducing to 40% of its initial volume in the first week after injection. On the other hand, CL-HA 2.5% had comparable degradation kinetics in the first week from injection, but showed a slower volumetric degradation during the following weeks, remaining detectable through HF-US for 56 days (Figure 2).
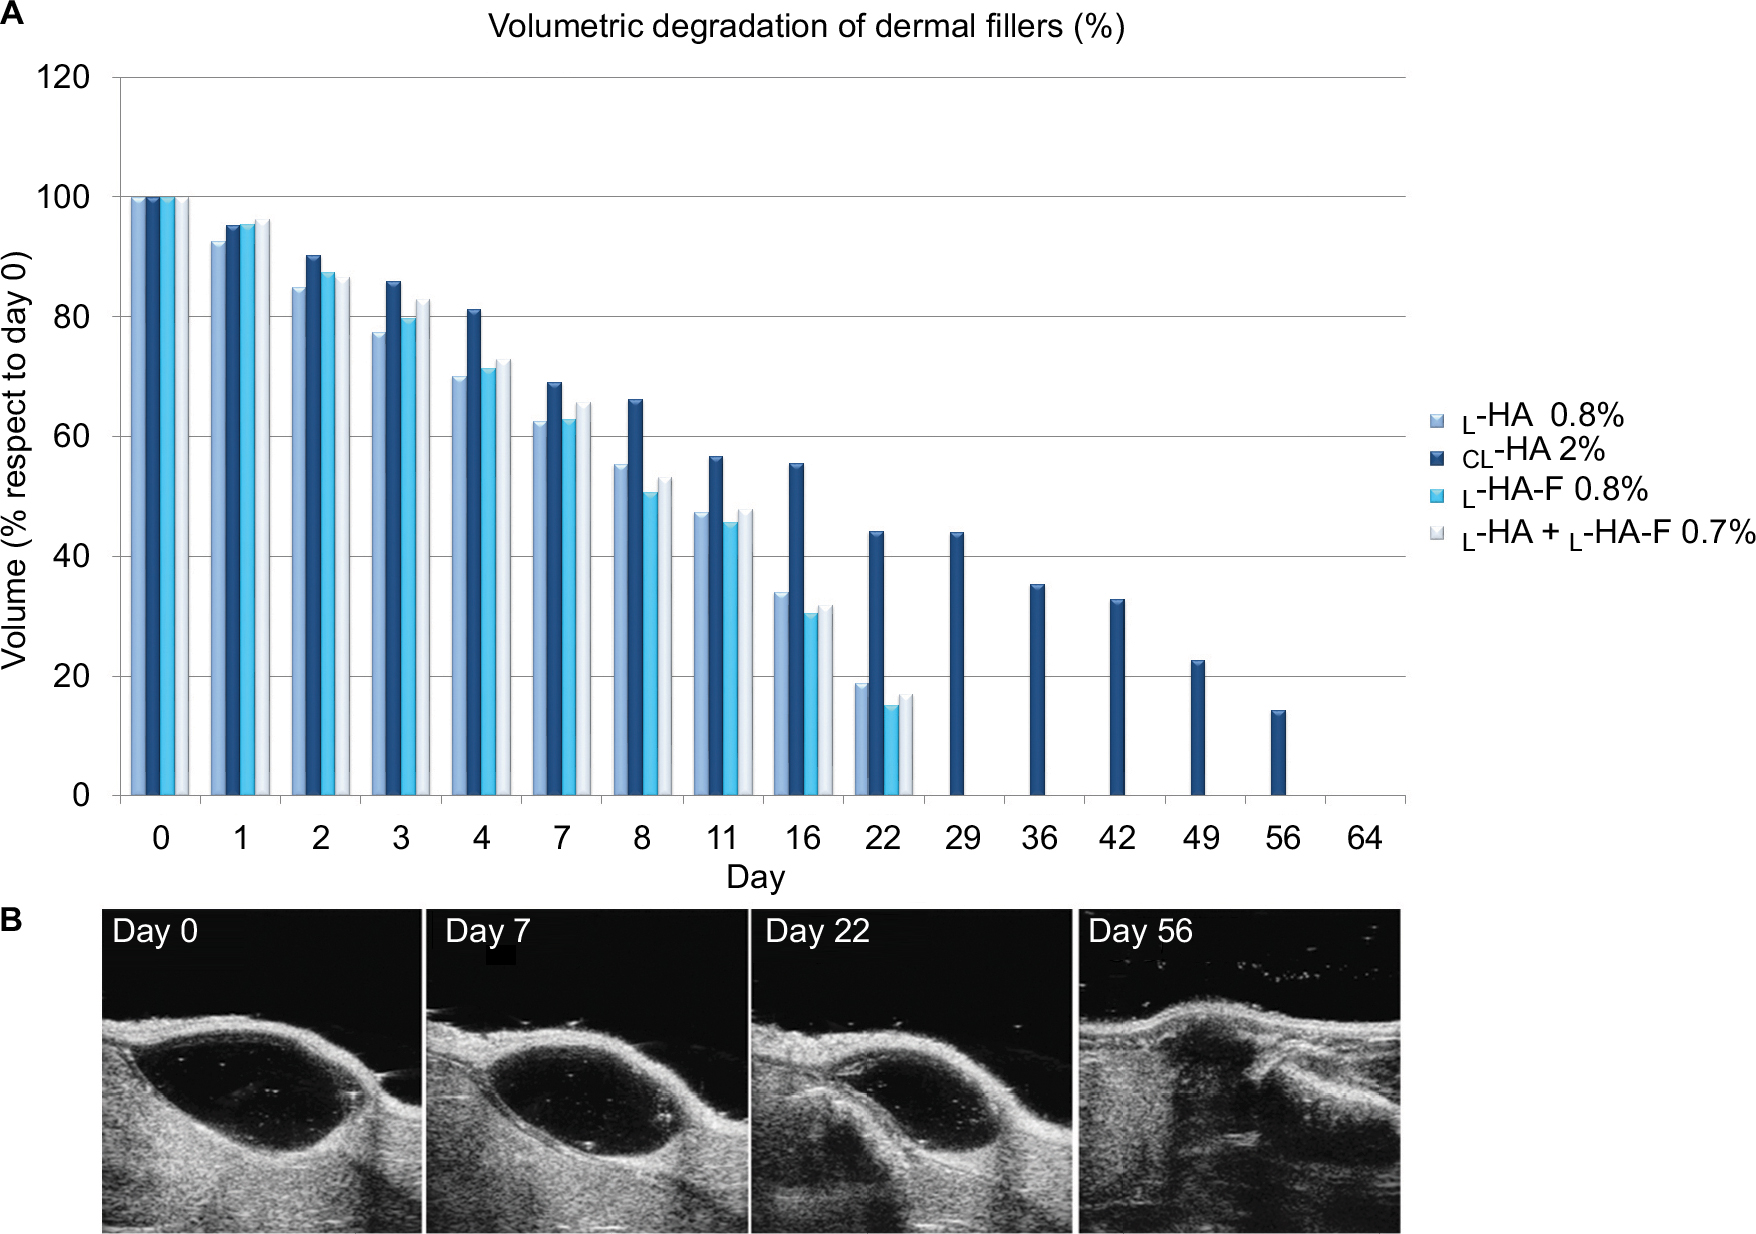 | Figure 2 (A) Volumetric degradation of fillers monitored through HF-US. (B) Representative images of degradation kinetics of CL-HA by HF-US. Abbreviations: HF-US, high-frequency ultrasound; CL-HA, cross-linked hyaluronic acid; L-HA, linear hyaluronic acid; L-HA-F, fluorescein-labeled linear hyaluronic acid. |
Monitoring of fluorescein-labeled fillers through FLI
In order to confirm HF-US measurements, an in vivo fluorescence imaging analysis was performed. To make L-HA visible through FLI method, it was mixed with L-HA-F at a final concentration of about 0.7% and then was injected subcutaneously in the left flank of the mouse as previously described in the “Administration procedure” section. This labeling strategy also allowed us to monitor the behavior of products in their final form without further modifications. Then, to evaluate if the degradation/absorption kinetics of HA-F was affected if used in combination with unlabeled HA, L-HA-F alone (final concentration 0.8%) was injected in the right flank of the same mouse. Mice were imaged on days 0, 1, 2, 3, 4, 7, and then weekly until the end of the study for quantitative evaluation of fluorescence intensity.
Fluorescence signal remained detectable until day 36 for both flanks, suggesting that disappearance kinetics of L-HA-F was not affected by mixing it with L-HA (Figure 3). In addition, volume of mounds generated by injection of L-HA-F, alone or in combination, was evaluated through HF-US imaging system on the same days. HF-US imaging system was able to detect the presence of HA (both L-HA-F alone and the mixture of L-HA-F + L-HA) under the skin until day 22.
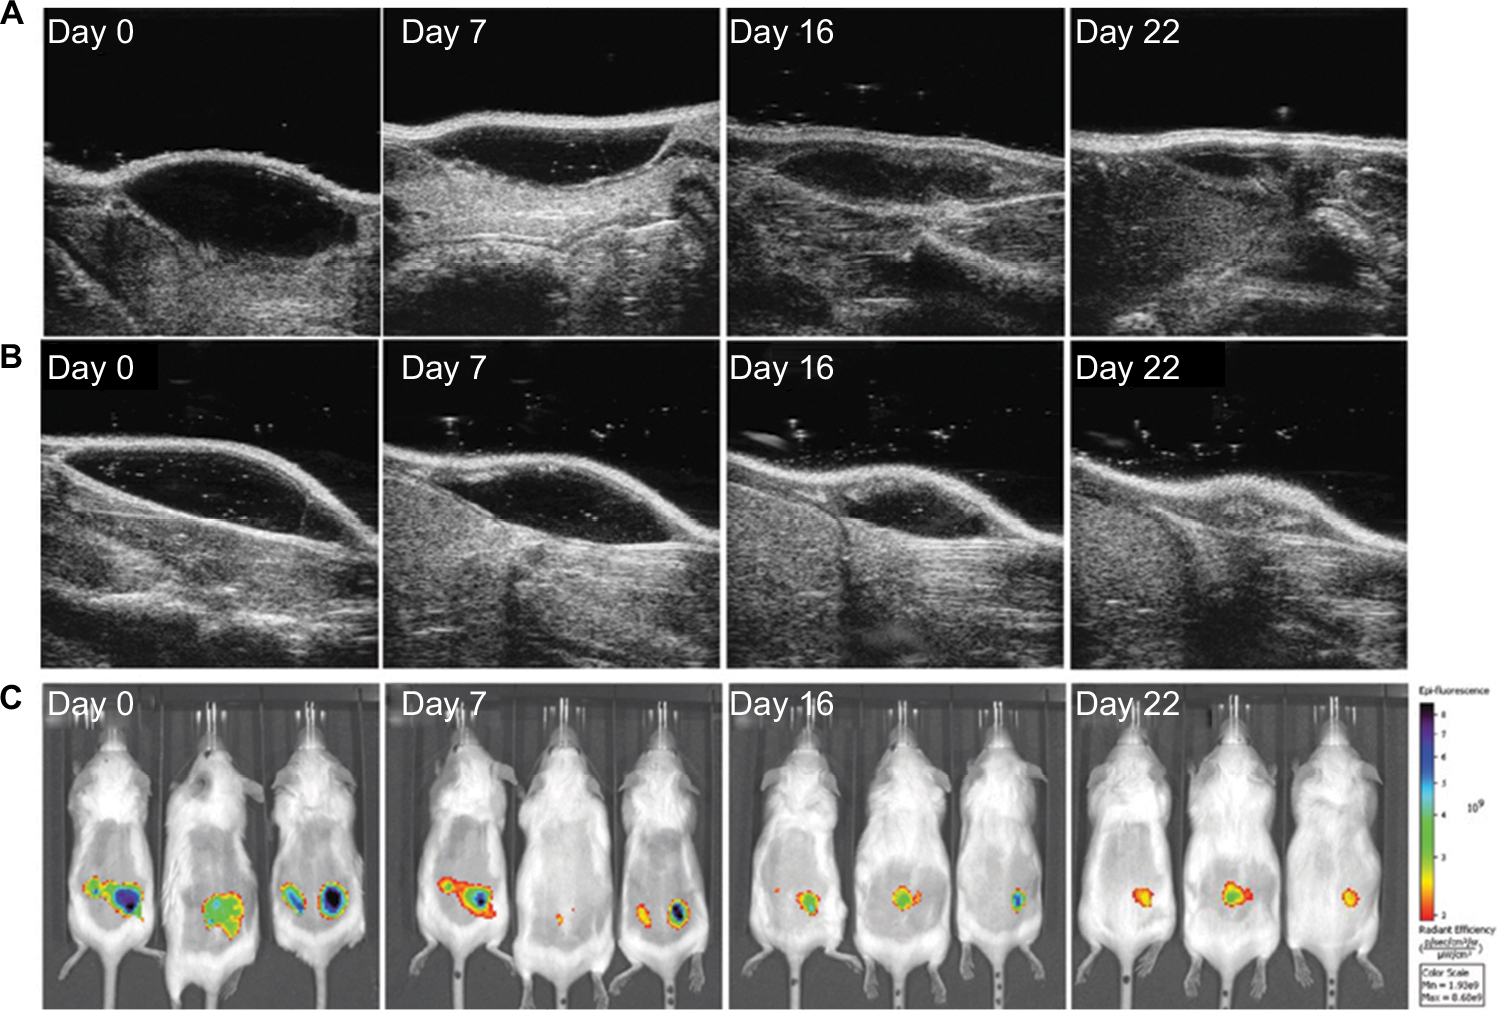 | Figure 3 Volumetric degradation of hyaluronic acid products. (A) Degradation kinetics of L-HA-F 0.8% monitored through HF-US. (B) Degradation kinetics of (L-HA + L-HA-F) 0.7% monitored through HF-US. (C) Degradation kinetics of L-HA-F 0.8% (left flank) and (L-HA + L-HA-F) 0.7% (right flank) monitored through FLI. Abbreviations: HF-US, high-frequency ultrasound; L-HA, linear hyaluronic acid; L-HA-F, fluorescein-labeled linear hyaluronic acid; FLI, fluorescence living imaging. |
Correlating fluorescence imaging and US imaging measurements for assessing filler longevity
To validate the correlation of fluorescence and US imaging modalities for assessment of degradation kinetics of tested dermal fillers, all the injected mice of groups 1 and 4 were imaged using both imaging modalities, as described earlier. For each imaging modality, raw imaging data were saved at the end of each imaging session and batch-processed later, blinding the data analysis process to individual mound identity. To determine the correlation between the two imaging modalities, we compared mounds size calculated from fluorescence images acquired using a single exposure time to mounds size determined from US images. This process yielded a correlation graph; the correlation coefficient R2 was calculated between US mounds volume and fluorescence intensity. P<0.05 was considered significant. Statistical analysis showed a valid correlation (P<0.01) (Figure 4), enforcing the idea that fluorescence imaging and US modalities are complementary approaches to monitor HA fillers, longevity using mouse models.
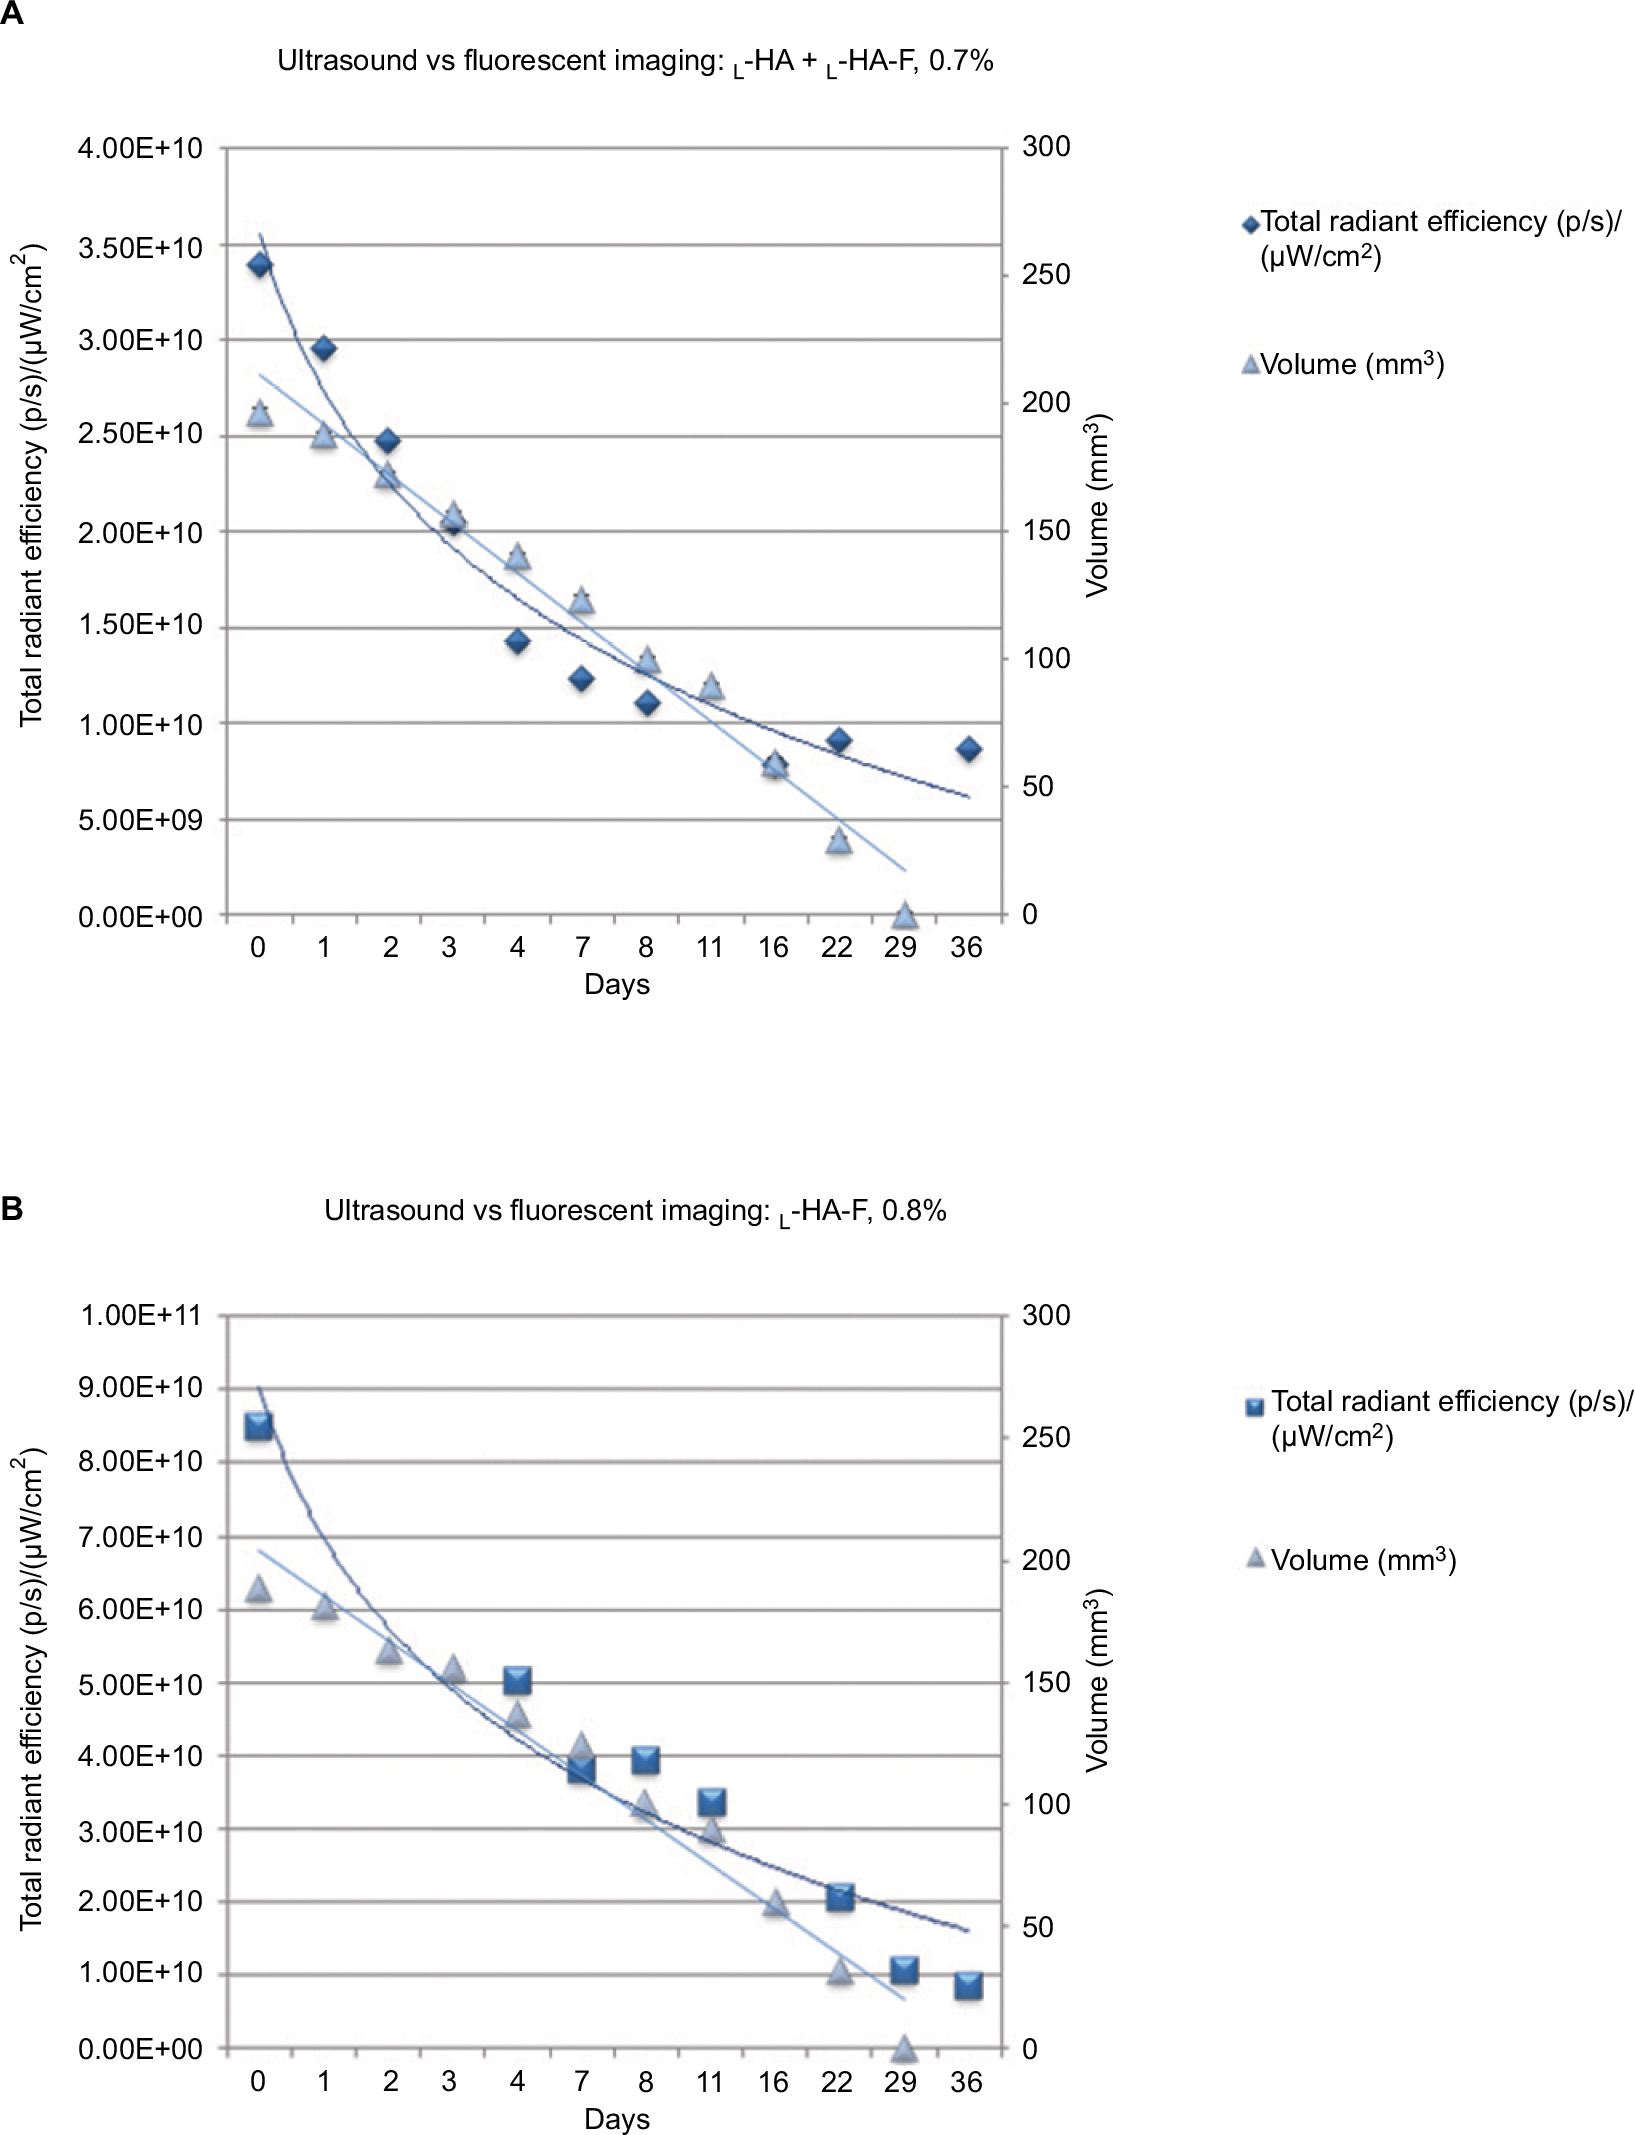 | Figure 4 Graphical representation of the statistical correlation (P<0.01) existing between volumes of fillers and absorbance values obtained through HF-US and FLI techniques for L-HA-F 0.8% (A) and ( L-HA + L-HA-F) 0.7% (B). Abbreviations: HF-US, high-frequency ultrasound; L-HA, linear hyaluronic acid; L-HA-F, fluorescein-labeled linear hyaluronic acid; FLI, fluorescence living imaging. |
Discussion
HA is among the most widespread tissue fillers in the clinical practice, being the most typical representative of biodegradable polymer.22 In this study, we showed the efficacy of high-frequency diagnostic US in the assessment of longevity of dermal fillers in vivo. In fact, in our opinion, the presented experimental approach could be a valid and clinically significant method, useful to monitor longevity and/or physical behavior of new potential products and of commercially available tissue fillers. Although this preclinical model has some limitations due to the small number of animals in each group and to the histological differences between human and mouse skin,23–25 in our opinion, it represents the most innovative, standardized, and easy-to-transfer-to-patients approach to monitor longevity of dermal fillers. This new preclinical model can also overpass the main limitation of in vitro-reconstituted models, like 3D-skin models, i.e., a short lifetime.
Our results showed that degradation kinetics of tissue fillers measured by US imaging system is strongly correlated with degradation kinetics measured using fluorescence imaging system. We noticed a difference in fluoresceinated filler lifetime when it was measured using US or fluorescence imaging system. This could be due to a difference in the detection sensitivity of the instruments used in this study; in fact, it is easily deducible that the sensitivity of the camera in acquiring a fluorescence spot is higher than operator’s performance in interpreting a sonographic pattern. On the other hand, the use of US imaging system is advantageous because it is easy and rapid to use, and overall, it does not require product labeling that is expensive and could modify the chemical and physical properties of the injected product. In addition, US system is able to identify sonographic properties specific for each filler agent in a different manner, making it possible to detect and characterize the products in vivo and in situ. In this regard, it is notable that fillers consisting of biologic macromolecules show a different sonographic pattern with respect to synthetic fillers, e.g., silicone and hydroxyapatite and polymethylmethacrylate.26 Sonography is also able to visualize eventual lesions and complications associated to the injection of fillers,27 such as product deposits or the presence of cystic structures that lead to increased blood flow, which can be easily detected using color Doppler US. No other technology currently available is able to provide all those parameters in a noninvasive manner, and thus US represents a useful adjunct tool for investigation in the field of soft tissue fillers. Moreover, the availability of a fast and standardized method to screen the longevity of new formulations of fillers could be useful to clinicians to evaluate the site and the number of treatments. This new tool, in fact, could support clinicians in defining the schedule of treatments taking into account the individual tissue responses of patients. It also allows a comparative evaluation of different formulations, simplifying the screening of new prototypes or the selection of the optimal commercial product. Recently, Choi et al validated 3D magnetic resonance (3D-MR) imaging as a novel method to evaluate the longevity of HA fillers in a mouse model.28 Nevertheless, application of 3D-MR is restricted to the preclinical animal model, being more laborious and invasive with respect to US technique.29
Conclusion
In conclusion, we demonstrated that the HF-US-based procedure is fully comparable, easily reproducible, and quantitatively accurate when compared to FLI method; therefore, it is a suitable, noninvasive, and effective tool to evaluate residence time of HA-based fillers in preclinical models. In addition, our results suggest that this new method permits discrimination of degradation kinetics of fillers related to their chemical–physical properties, based on cross-linking and concentration. In fact, this study demonstrated that cross-linked HA has a longer residence time after subcutaneous injection when compared to linear HA, but the concentration of cross-linked HA was higher than the linear one. So, further investigations are needed to verify if the long-lasting effect of cross-linked HA was due to a stronger resistance to degradation acquired through chemical modifications (i.e., cross-linking), or if it is also a consequence of the higher concentration.
In vitro studies19 showed that the degradation of HA is very fast, confirming the well-established data about the physiological turnover of this glycosaminoglycan in vivo,30 ranging from half a day to 2 or 3 days, regardless of its route of elimination.31 Nevertheless, our results revealed an unexpected longer residence time for linear HA, thus explaining, at least in part, the long-lasting skin rehydration effect of bio-revitalizing agents. These considerations suggest that some knowledge gaps still exist in this field of investigations and opens a window for future research efforts.
Disclosure
Andrea Maria Giori is an employee of IBSA Farmaceutici Italia, a pharmaceutical company based in Lodi, Italy. Filomena Merola, Mario Scrima, Carmela Melito, Antonio Iorio, and Angela Ferravante are employees of Bouty SpA., a pharmaceutical company based in Milan, Italy. Claudio Pisano is a consultant of Bouty SpA. The authors report no other conflicts of interest in this work.
References
Csoka AB, Frost GI, Stern R. The six hyaluronidase-like genes in the human and mouse genomes. Matrix Biol. 2001;20:499–508. | ||
Šoltés L, Kogan G. Catabolism of hyaluronan: involvement of transition metals. Interdiscip Toxicol. 2009;2:229–238. | ||
Urbaniak B, Plewa S, Zenon J, Kokot Z. Preliminary high performance capillary electrophoresis (HPCE) studies of enzymatic degradation of hyaluronic acid by hyaluronidase in the presence of polyvalent metal ions. Acta Pol Pharm. 2017;74:41–51. | ||
Buck DW, Alam M, Kim JY. Injectable fillers for facial rejuvenation: a review. J Plast ReconstrAesthet Surg. 2009;62:11–18. | ||
Namiki O, Toyoshima H, Morisaki N. Therapeutic effect of intra-articular injection of high molecular weight hyaluronic acid on osteoarthritis of the knee. Int J Clin Pharmacol Ther Toxicol. 1982;20:501–507. | ||
Wang C-T, Lin J, Chang C-J, Lin Y-T, Hou S-M. Therapeutic effects of hyaluronic acid on osteoarthritis of the knee. J Bone Joint Surg. 2004;86:538–545. | ||
Neuman MG, Nanau RM, Oruña-Sanchez L, Coto G. Hyaluronic acid and wound healing. J Pharm Pharm Sci. 2015;18:53–60. | ||
Dereure O, Czubek M, Combemale P. Efficacy and safety of hyaluronic acid in treatment of leg ulcers: a double-blind RCT. J Wound Care. 2012;21:131–132, 134–136, 138–139. | ||
Cohen JL, Dayan SH, Brandt FS, et al. Systematic review of clinical trials of small and large gel particle hyaluronic acid injectable fillers for aesthetic soft tissue augmentation. Dermatol Surg. 2013;39:205–231. | ||
Beasley KL, Weiss MA, Weiss RA. Hyaluronic acid fillers: a comprehensive review. Facial Plastic Surg. 2009;25:86–94. | ||
Narins RS, Brandt FS, Lorenc Z, Maas CS, Monheit GD, Smith SR. Twelve-month persistency of a novel ribose–cross-linked collagen dermal filler. Dermatol Surg. 2008;34:31–39. | ||
Tedeschi A, Lacarrubba F, Micali G. Mesotherapy with an intradermal hyaluronic acid formulation for skin rejuvenation: an intrapatient, placebo-controlled, long-term trial using high-frequency ultrasound. Aesth Plastic Surg. 2015;39:129–133. | ||
Narins RS, Dayan SH, Brandt FS, Baldwin EK. Persistence and improvement of nasolabial fold correction with nonanimal-stabilized hyaluronic acid 100,000 gel particles/mL filler on two retreatment schedules: results up to 18 months on two retreatment schedules. Dermatol Surg. 2008;34:2–8. | ||
Hillel AT, Nahas Z, Unterman S, et al. Validation of a small animal model for soft tissue filler characterization. Dermatol Surg. 2012;38:471–478. | ||
Young S, Bolton P, Downie J. Use of high-frequency ultrasound in the assessment of injectable dermal fillers. Skin Res and Techn. 2008;14:320–323. | ||
Grippaudo FR, Mattei M. The utility of high-frequency ultrasound in dermal filler evaluation. Ann Plas Surg. 2011;67:469–473. | ||
Wortsman X. Common applications of dermatologic sonography. J Ultrasound Med. 2012;31:97–111. | ||
Fatakdawala H, Poti S, Zhou F, et al. Multimodal in vivo imaging of oral cancer using fluorescence lifetime, photoacoustic and ultrasound techniques. Biomed Opt Express. 2013;4:1724–1741. | ||
Jones D, Tezel A, Borrell M. In vitro resistance to degradation of hyaluronic acid dermal fillers by ovine testicular hyaluronidase. Dermatol Surg. 2010;36:804–809. | ||
Lemperle G, Morhenn V, Charrier U. Human histology and persistence of various injectable filler substances for soft tissue augmentation. Aesthetic Plast Surg. 2003;27:354–366. | ||
Piron E and Tholin R, inventors; D Esthetique Appliquee Lab., applicants. Polysaccharide Crosslinking, Hydrogel Preparation, Resulting Polysaccharide(s) And Hydrogel(s), Uses Thereof. United States patent 6921819 B2. 2005 July 26. | ||
Wortsman X. Identification and complications of cosmetic fillers. J Ultrasound Med. 2015;34:1163–1172. | ||
Abdullahi A, Amini-Nik S, Jeschke M. Animal models in burn research. Cell and Mol Life Sci. 2014;71:3241–3255. | ||
Dahiya P. Burns as model SIRS. Front Biosci. 2009;14:4962–4967. | ||
Wong VW, Sorkin M, Glotzbach JP, Longaker MT, Gurtner GC. Surgical approaches to create murine models of human wound healing. BioMed Res Int. 2010;2011:969618. | ||
Wortsman X, Wortsman J, Orlandi C, Cardenas G, Sazunic I, Jemec G. Ultrasound detection and identification of cosmetic fillers in the skin. J Eur Acad Dermatol Venereol. 2012;26(3):292–301. | ||
Hirsch RJ, Stier M. Complications of soft tissue augmentation. J Drugs Dermatol. 2008;7:841–845. | ||
Choi SY, Choi EJ, Suh JH, Kim BJ. Three-dimensional imaging as a novel method of evaluating the longevity of hyaluronic acid fillers in a mouse model. Dermatol Surg. 2017;43:1108–1112. | ||
Micheels P, Besse S, Sarazin D, et al. Ultrasound and histologic examination after subcutaneous injection of two volumizing hyaluronic acid fillers: a preliminary study. Plast Reconstr Surg Glob Open. 2017;5: e1222. | ||
West DC, Shaw DM, Lorenz P, Adzick NS, Longaker MT. Fibrotic healing of adult and late gestation fetal wounds correlates with increased hyaluronidase activity and removal of hyaluronan. Int J Biochem Cell Biol. 1997;29:201–210. | ||
Fraser J, Laurent T, editors. Turnover and metabolism of hyaluronan. In: The Biology of Hyaluronan: Ciba Foundation Symposium, Vol 143. 1989: Wiley Online Library. |
 © 2018 The Author(s). This work is published and licensed by Dove Medical Press Limited. The
full terms of this license are available at https://www.dovepress.com/terms
and incorporate the Creative Commons Attribution
- Non Commercial (unported, 3.0) License.
By accessing the work you hereby accept the Terms. Non-commercial uses of the work are permitted
without any further permission from Dove Medical Press Limited, provided the work is properly
attributed. For permission for commercial use of this work, please see paragraphs 4.2 and 5 of our Terms.
© 2018 The Author(s). This work is published and licensed by Dove Medical Press Limited. The
full terms of this license are available at https://www.dovepress.com/terms
and incorporate the Creative Commons Attribution
- Non Commercial (unported, 3.0) License.
By accessing the work you hereby accept the Terms. Non-commercial uses of the work are permitted
without any further permission from Dove Medical Press Limited, provided the work is properly
attributed. For permission for commercial use of this work, please see paragraphs 4.2 and 5 of our Terms.