Back to Journals » Journal of Inflammation Research » Volume 15
A Nomogram Model for Predicting Recurrence of Stage I–III Endometrial Cancer Based on Inflammation-Immunity-Nutrition Score (IINS) and Traditional Classical Predictors
Authors Jiang P ![]() , Wang J, Gong C, Yi Q, Zhu M, Hu Z
, Wang J, Gong C, Yi Q, Zhu M, Hu Z
Received 17 February 2022
Accepted for publication 14 May 2022
Published 22 May 2022 Volume 2022:15 Pages 3021—3037
DOI https://doi.org/10.2147/JIR.S362166
Checked for plagiarism Yes
Review by Single anonymous peer review
Peer reviewer comments 2
Editor who approved publication: Professor Ning Quan
Peng Jiang,1 Jinyu Wang,1 Chunxia Gong,2 Qianlin Yi,1 Mengqiu Zhu,1 Zhuoying Hu1
1Department of Gynecology, The First Affiliated Hospital of Chongqing Medical University, Chongqing, People’s Republic of China; 2Department of Gynecology, Chongqing Health Center for Women and Children, Chongqing, People’s Republic of China
Correspondence: Zhuoying Hu, Department of Gynecology, The First Affiliated Hospital of Chongqing Medical University, Chongqing, People’s Republic of China, Email [email protected]
Objective: The purpose of this study was to investigate the prognostic value of the inflammation-immunity-nutrition score (IINS) in patients with stage I–III endometrial cancer (EC) and establish a nomogram model to predict the recurrence of EC by combining IINS and traditional classical predictors.
Methods: Seven hundred and seventy-five patients with stage I–III EC who underwent initial surgical treatment at the First Affiliated Hospital of Chongqing Medical University were included in this study as the training cohort. In the training cohort, IINS (0– 3) was constructed based on preoperative C-reactive protein (CRP), lymphocytes (LYM), and albumin (ALB). Univariate and multivariate Cox regression analysis were used to screen independent predictors associated with recurrence of EC for developing the nomogram model. Internal validation of the model was performed in the training cohort by using the C-index and calibration curve, while external validation of the model was performed in another cohort (validation cohort) of 491 patients from the Second Affiliated Hospital of Chongqing Medical University.
Results: IINS was successfully constructed, and survival analysis showed that patients with high IINS had a worse prognosis. Multivariate analysis showed that IINS, age, FIGO stage, pathological type, myometrial invasion, lymphatic vessel space invasion (LVSI), Ki67 expression, estrogen receptor (ER) expression, and P53 expression were significantly associated with shorter recurrence-free survival, and then a nomogram model for predicting the recurrence of EC was successfully established. The internal and external calibration curves of the model showed that the model fit well, and the C-index (0.887 in training cohort and 0.883 in validation cohort) showed that the model proposed in this study had better prediction accuracy than other prediction models.
Conclusion: IINS may be a strong predictor of prognosis in patients with EC. The nomogram model incorporated into the IINS can better predict the recurrence of EC than the traditional models.
Keywords: inflammation-immunity-nutrition score, IINS, nomogram model, predict, endometrial cancer, recurrence
Introduction
Endometrial cancer (EC) is one of the common gynecological malignancies and is the fourth most frequent one in women worldwide.1 The overall survival rate of patients is relatively high, but the prognosis of patients with recurrence is extremely poor, and the recurrence of tumor is one of the main causes of death in patients.2 Predicting the recurrence of EC as accurately as possible and applying risk stratification of patients can not only ensure that patients receive personalized prognostic management, reduce tumor recurrence rates, but also prevent patients from being over-treated, which leads to waste of medical resources.3 Traditionally, prognostic indicators used to predict the recurrence of EC are mostly based on classical predictors, including clinicopathological parameters and molecular prognostic markers.4 For example, clinicopathological parameters including age, International Federation of Gynecology and Obstetrics (FIGO) stage, histological type and grade, myometrial invasion, lymphovascular space invasion (LVSI), etc. are always used as the basis for risk stratification of patients in various international guidelines; in recent years, molecular prognosis makers such as ER, PR, Ki67 and P53 have also been shown to be reliable predictors of EC prognosis and are widely used in clinical practice in the form of immunohistochemistry.5,6 However, clinicopathological parameters and molecular prognostic markers only represent the biological behavior of tumors.7 In fact, the prognosis of patients is not only affected by the clinicopathological features and molecular prognostic markers of the tumor, but also by the systemic inflammatory response, immune response, and nutritional status.7,8
At present, it has been confirmed that the occurrence and development of tumors are closely related to the inflammatory response, immune infiltration, and nutritional support. Inflammation, immunity, and nutritional status of the body have been used as potential prognostic factors for a variety of tumors, among which, C-reactive protein (CRP), lymphocytes (LYM) and albumin (ALB) are representative indicators of inflammation, immune, and nutritional status in clinical practice, respectively.8 CRP is a protein synthesized in the liver in the acute phase of the inflammatory response and is significantly elevated during the acute inflammatory response.9 LYM is a cell line with immune recognition and response functions, lymphocyte counts reflect systemic inflammatory and immune status.10 ALB is a plasma protein produced in the liver to maintain body nutrition and osmotic pressure, which can reflect the nutritional status of individuals and is closely related to immune function.11 Various prognostic scores established based on CRP, LYM and ALB including Glasgow Prognostic Score (the combination of CRP and ALB), prognostic nutrition index (the combination of LYM and ALB), and inflammation-immune-nutrition score (the combination of CRP, LYM and ALB) have been widely applied in prognostic prediction of various tumors such as hepatocellular carcinoma, pancreatic cancer, colorectal cancer.8,12,13 In EC, some studies have also found that CRP, LYM and ALB are closely related to the prognosis,14–16 but most of these studies focus on a single prognostic index, the prognostic value of which is limited, while the research about the inflammation-immunity-nutrition score (IINS) constructed based on the combination of above three indicators is still very rare.
Therefore, this study aimed to construct an inflammation-immunity-nutrition score (IINS) based on inflammatory markers (CRP), immune markers (LYM) and nutritional status markers (ALB), and to evaluate the prognostic value of IINS in EC. On this basis, a nomogram model was constructed combined with traditional classical predictors to predict the recurrence of EC.
Materials and Methods
Study Population
Patients with stage I–III (according to the 2009 FIGO guidelines17) EC who received initial surgical treatment in the First Affiliated Hospital of Chongqing Medical University and the Second Affiliated Hospital of Chongqing Medical University from October 2013 to May 2018 were included. The exclusion criteria of patients were as follows: 1. Without standard surgery; 2. Receiving neoadjuvant therapy before surgery; 3. With incomplete medical records; 4. Lost to follow-up; 5. With other malignancies, 6. Preexisting significant inflammatory conditions or immune system disorders. At the same time, the clinical case data of the patients were collected, including age, body mass index, preoperative blood index results (Ca125, CRP, LYM and ALB), surgical procedures, and postoperative pathological examination results (tumor site and size, histologic type and grade, the depth of myometrial invasion, the status of LVSI and cervical stromal invasion, etc.), immunohistochemical results of molecular markers (ER, PR, Ki67 and P53), and postoperative adjuvant therapy. Preoperative blood indexes were measured one week before the operation, LYM counts were obtained from routine blood tests, and ALB was obtained from liver function tests.8
Treatment
All patients underwent at least abdominal total hysterectomy and bilateral salpingo-oophorectomy, with or without nodal staging (sentinel lymph node ± pelvic ±-para-aortic lymphadenectomy). The adjuvant treatment plan was determined according to international guidelines and multidisciplinary discussions after surgery.3,18 Generally, patients pooled at least one of the following adverse risk factors were recommended to receive postoperative radiotherapy: older age (especially >60 years), advanced FIGO stage, non-endometrioid carcinoma (especially serous or clear cell carcinoma histology), high-grade (G3) tumors, deep myometrial invasion (≥1/2), cervical stromal invasion, or extensive LVSI. Especially when patients were accompanied with one of these high-risk factors including FIGO stage (FIGO stage III), non-endometrioid carcinoma (especially serous or clear cell carcinoma histology), high-grade (G3) tumors, and deeper myometrial invasion (≥1/2), the systemic therapy (chemotherapy) was further required. Radiotherapy was mainly vaginal brachytherapy (total dose 22–24Gy, 5.5–6Gy x 4 fractions, 2 fractions/week, 2 weeks in total) or pelvic external beam radiotherapy (total dose 45–50Gy, 1.8–2Gy x 25 fractions, 5 fractions/week, 5 weeks in total), which were usually applied within 12 weeks after surgery (usually 6–8 weeks after surgery). The combination chemotherapy regimen is mainly based on the TP regimen (carboplatin and paclitaxel) every 3 weeks for 6–8 cycles in total.
Pathology and Immunohistochemistry
All patients’ postoperative specimens were immediately fixed with formalin tissue fixative, which were further embedded, sectioned, stained with H&E (H&E staining was used to determine the cancerous area) in the Pathology Experiment Center of Chongqing Medical University according to unified standards. Immunohistochemical analysis of ER, PR, Ki67 and P53 was performed on an immunohistochemical autostainer (Leica Bond-Max, Milton Keynes, UK) according to an optimized and validated protocol of immunohistochemistry, the following mouse primary antibodies (ready-to-use) were used for immunohistochemistry: Ki67 (clone MX006), ER (clone SP1), PR (clone MX009), and P53 (clone MX008) (all purchased from Fuzhou, China, the specific experimental steps of immunohistochemistry can be seen in the references).19,20
Pathological analysis (tumor site and size, histologic type and grade, the depth of myometrial invasion, the status of LVSI and cervical stromal invasion, etc.) were initially judged by primary physicians and reviewed by superior physicians.2 Pathological type I of EC was defined as G1 and G2 endometrioid adenocarcinoma, type II was defined as G3 endometrioid adenocarcinoma and non-endometrioid adenocarcinoma including serous carcinoma, clear cell carcinoma, and other histotypes.21
Interpretation of immunohistochemical results refers to the following steps: 5 high-power fields were randomly observed in “hottest spot” area of tumor, and 100 tumor cells were assessed per field, tumor cells with strong nuclear immunostaining were defined as positive cells, then average percentages (range 0–100%) of positive cells of the five fields for each molecular maker (Ki67, ER, PR, and P53) were calculated.19 This process was independently assessed by two experienced pathologists, and if the difference between the two observers’ count results was ≤10%, the observations were considered consistent; otherwise, the results were reassessed (unblinded), and a consensus was reached. The average of the positive percentages assessed by two observers represented the final result of the immunohistochemical interpretation.22
Referring to most other similar studies, ER and PR were defined as negative expression if the proportion of positive tumor cells of ER and PR was ≤5%; otherwise, ER and PR were defined as positive expression.19,23 According to the results of our previous study, the proportion of positive tumor cells of Ki67 ≥40% and <40% were defined as high expression and low expression of Ki67, respectively.19,21 According to the 3-stratified interpretation criteria of P53 immunohistochemistry, overexpression or complete loss of expression (no obvious positive tumor cell) of P53 was defined as abnormal (aberrant/mutation-type) expression, conversely, positive expression between the two extremes was defined as normal (wild-type) expression of P53.19,24
Follow-Up and Recurrence
Patients were followed up every 3 months for the first 2 years, every 6 months for the next 3 years, and annually thereafter. Follow-up started from the day of surgery, including regular physical examinations and necessary auxiliary examinations, the follow-up deadline was June 2021 (since the relevant literature reports that the recurrence time of most recurrent EC patients is concentrated within 3 years after surgery, except for some patients who died during the follow-up period, the rest of the patients are guaranteed to have a follow-up time of more than 3 years).25
Recurrence was confirmed by more than two gynecological oncologists through physical examination, biochemical indicators, imaging examination and pathological biopsy.2 According to the recurrence site, recurrence was divided into local recurrence and distant metastasis. Local recurrence included vaginal stump recurrence and central pelvic region recurrence. Distant metastasis included upper para-aortic lymph node metastases, peritoneal metastases, and metastases to other organs.26 Recurrence-free survival (RFS) was defined as the time from the date of surgery to the date of confirmation of recurrence, and overall survival (OS) was defined as the time from the date of surgery to death or the end of follow-up.21
Study Design and Statistical Analysis
The study design is shown in Figure 1. Specifically, a patient cohort from the First Affiliated Hospital of Chongqing Medical University was used as the training cohort to construct IINS and a nomogram model, the internal validation of the model was also performed in the training cohort. Patients from the Second Affiliated Hospital of Chongqing Medical University acted as the validation cohort for external validation of the model. The differences between the two cohorts were compared, the chi-square test was used for the comparison of categorical variables; the t–test and the rank sum test were used for the comparison of continuous variables. P values <0.05 were considered as statistically significant differences.
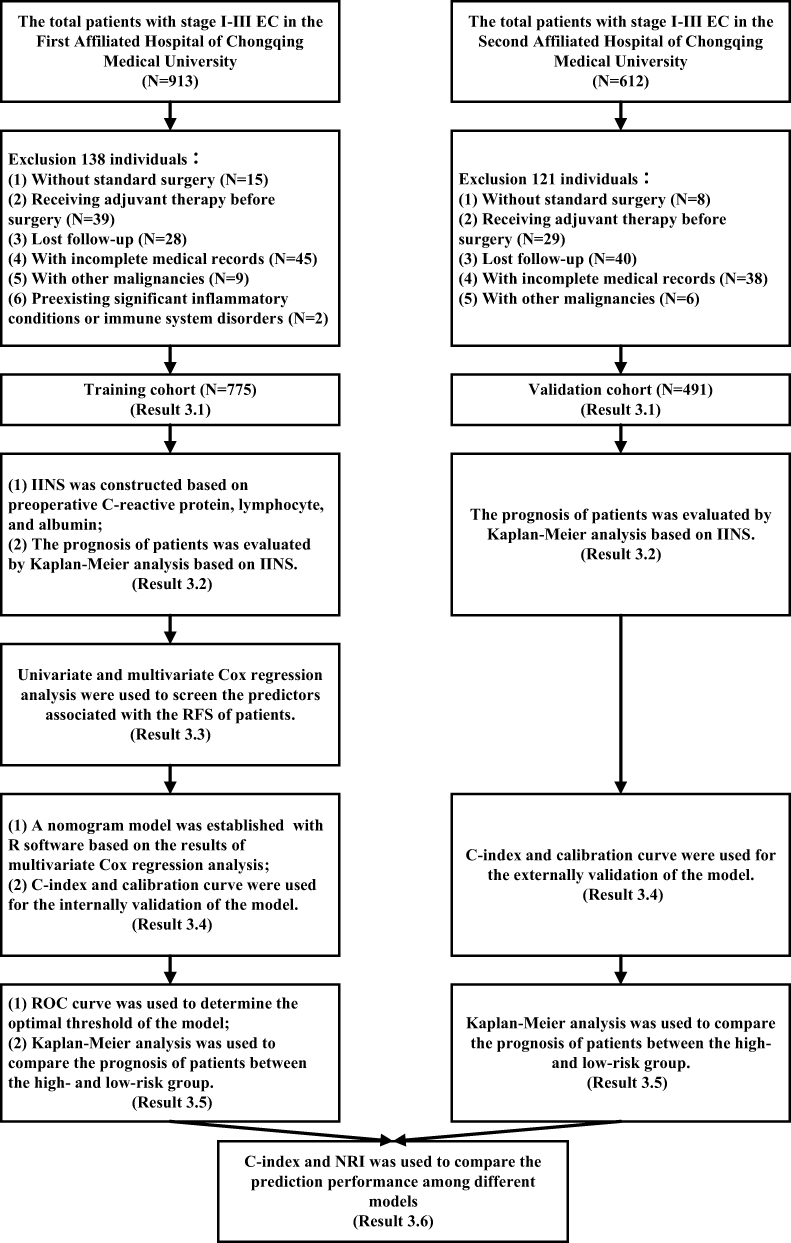 |
Figure 1 Study design and the flow chart of patient inclusion. |
In the training cohort, the receiver operating characteristic (ROC) curve and the maximum value of Youden index (Youden index = sensitivity + specificity - 1) were used to determine the optimal thresholds of CRP, LYM and ALB to predict EC recurrence, respectively.19,27 The IINS was established based on the optimal thresholds of the above three indicators and the prognostic analysis of the IINS was performed. IINS and classical predictors were put into univariate Cox regression analysis to analyze their correlation with EC recurrence, and then predictors with P values <0.05 were further included in multivariate Cox regression analysis to screen the factors that were independently associated with EC recurrence. Factors with P values <0.05 in multivariate analysis were finally selected for building a nomogram model through R software. The ROC curve and the maximum value of Youden index were used to determine the optimal threshold of 3-year recurrence-free survival (risk threshold) calculated by the nomogram model. According to the risk threshold of the model, the patients in the two cohorts were further divided into the high-risk group and low-risk group. Kaplan–Meier analysis was used to describe the distribution of RFS and OS in the two groups, and Log rank test was used to compare the differences of RFS and OS between the two groups.
Internal and external validation of the model was performed in the training cohort and validation cohort, respectively. First, the consistency between the “predicted values” of the model and “actual values” was assessed by internal and external calibration curves.28 Then, the prediction performance of the model was evaluated using the consistency index (C-index) in the two cohorts. C-index (range 0–1) is mainly used to evaluate the prediction accuracy of the model. If the C-index lies between 0.5 and 0.6, 0.6 and 0.7, or greater than 0.8, the model is considered to have poor, general or good performance.29 Finally, to further demonstrate the superiority of the model proposed in this study, it was compared with the models proposed by other similar studies via the C-index and net reclassification index (NRI). NRI (range −2-2) is mainly used to evaluate the probability of using the new model to improve the individual prediction results compared with the old model when the two models use the optimal diagnostic cut-off point for prediction. If NRI > 0, it means positive improvement, indicating that the prediction ability of the new model is improved compared with the old model; If NRI < 0, it represents negative improvement, indicating that the prediction ability of the new model decreases; If NRI = 0, it is considered that the new model has not improved.30 Data were statistically analyzed using SPSS software (version 25.0, IBM Statistics, Chicago, IL, USA) and R software (version 4.0.3, http://www.r-project.org) (Supplementary Material R).
Results
General Clinicopathological Characteristics of Patients in Two Cohorts
As shown in Figure 1 and Table 1, a total of 775 patients and 491 patients were included in the training cohort and the validation cohort, respectively. The median age of patients in the two cohorts was 53 (range 24–81) years and 52 (range 25–83) years, respectively, and the median follow-up time was 51 (range 7–91) months and 50 (range 7–91) months, respectively. Most of the patients were with FIGO stage I (70.7% and 70.9%, respectively), with histological type I (71.6% and 72.3%, respectively). A total of 477 patients in the training cohort received postoperative adjuvant therapy, of which 26 patients only received chemotherapy for personal reasons, and the rest received radiotherapy or chemoradiotherapy. The proportion of patients who received adjuvant therapy in the validation cohort was similar to the training cohort.
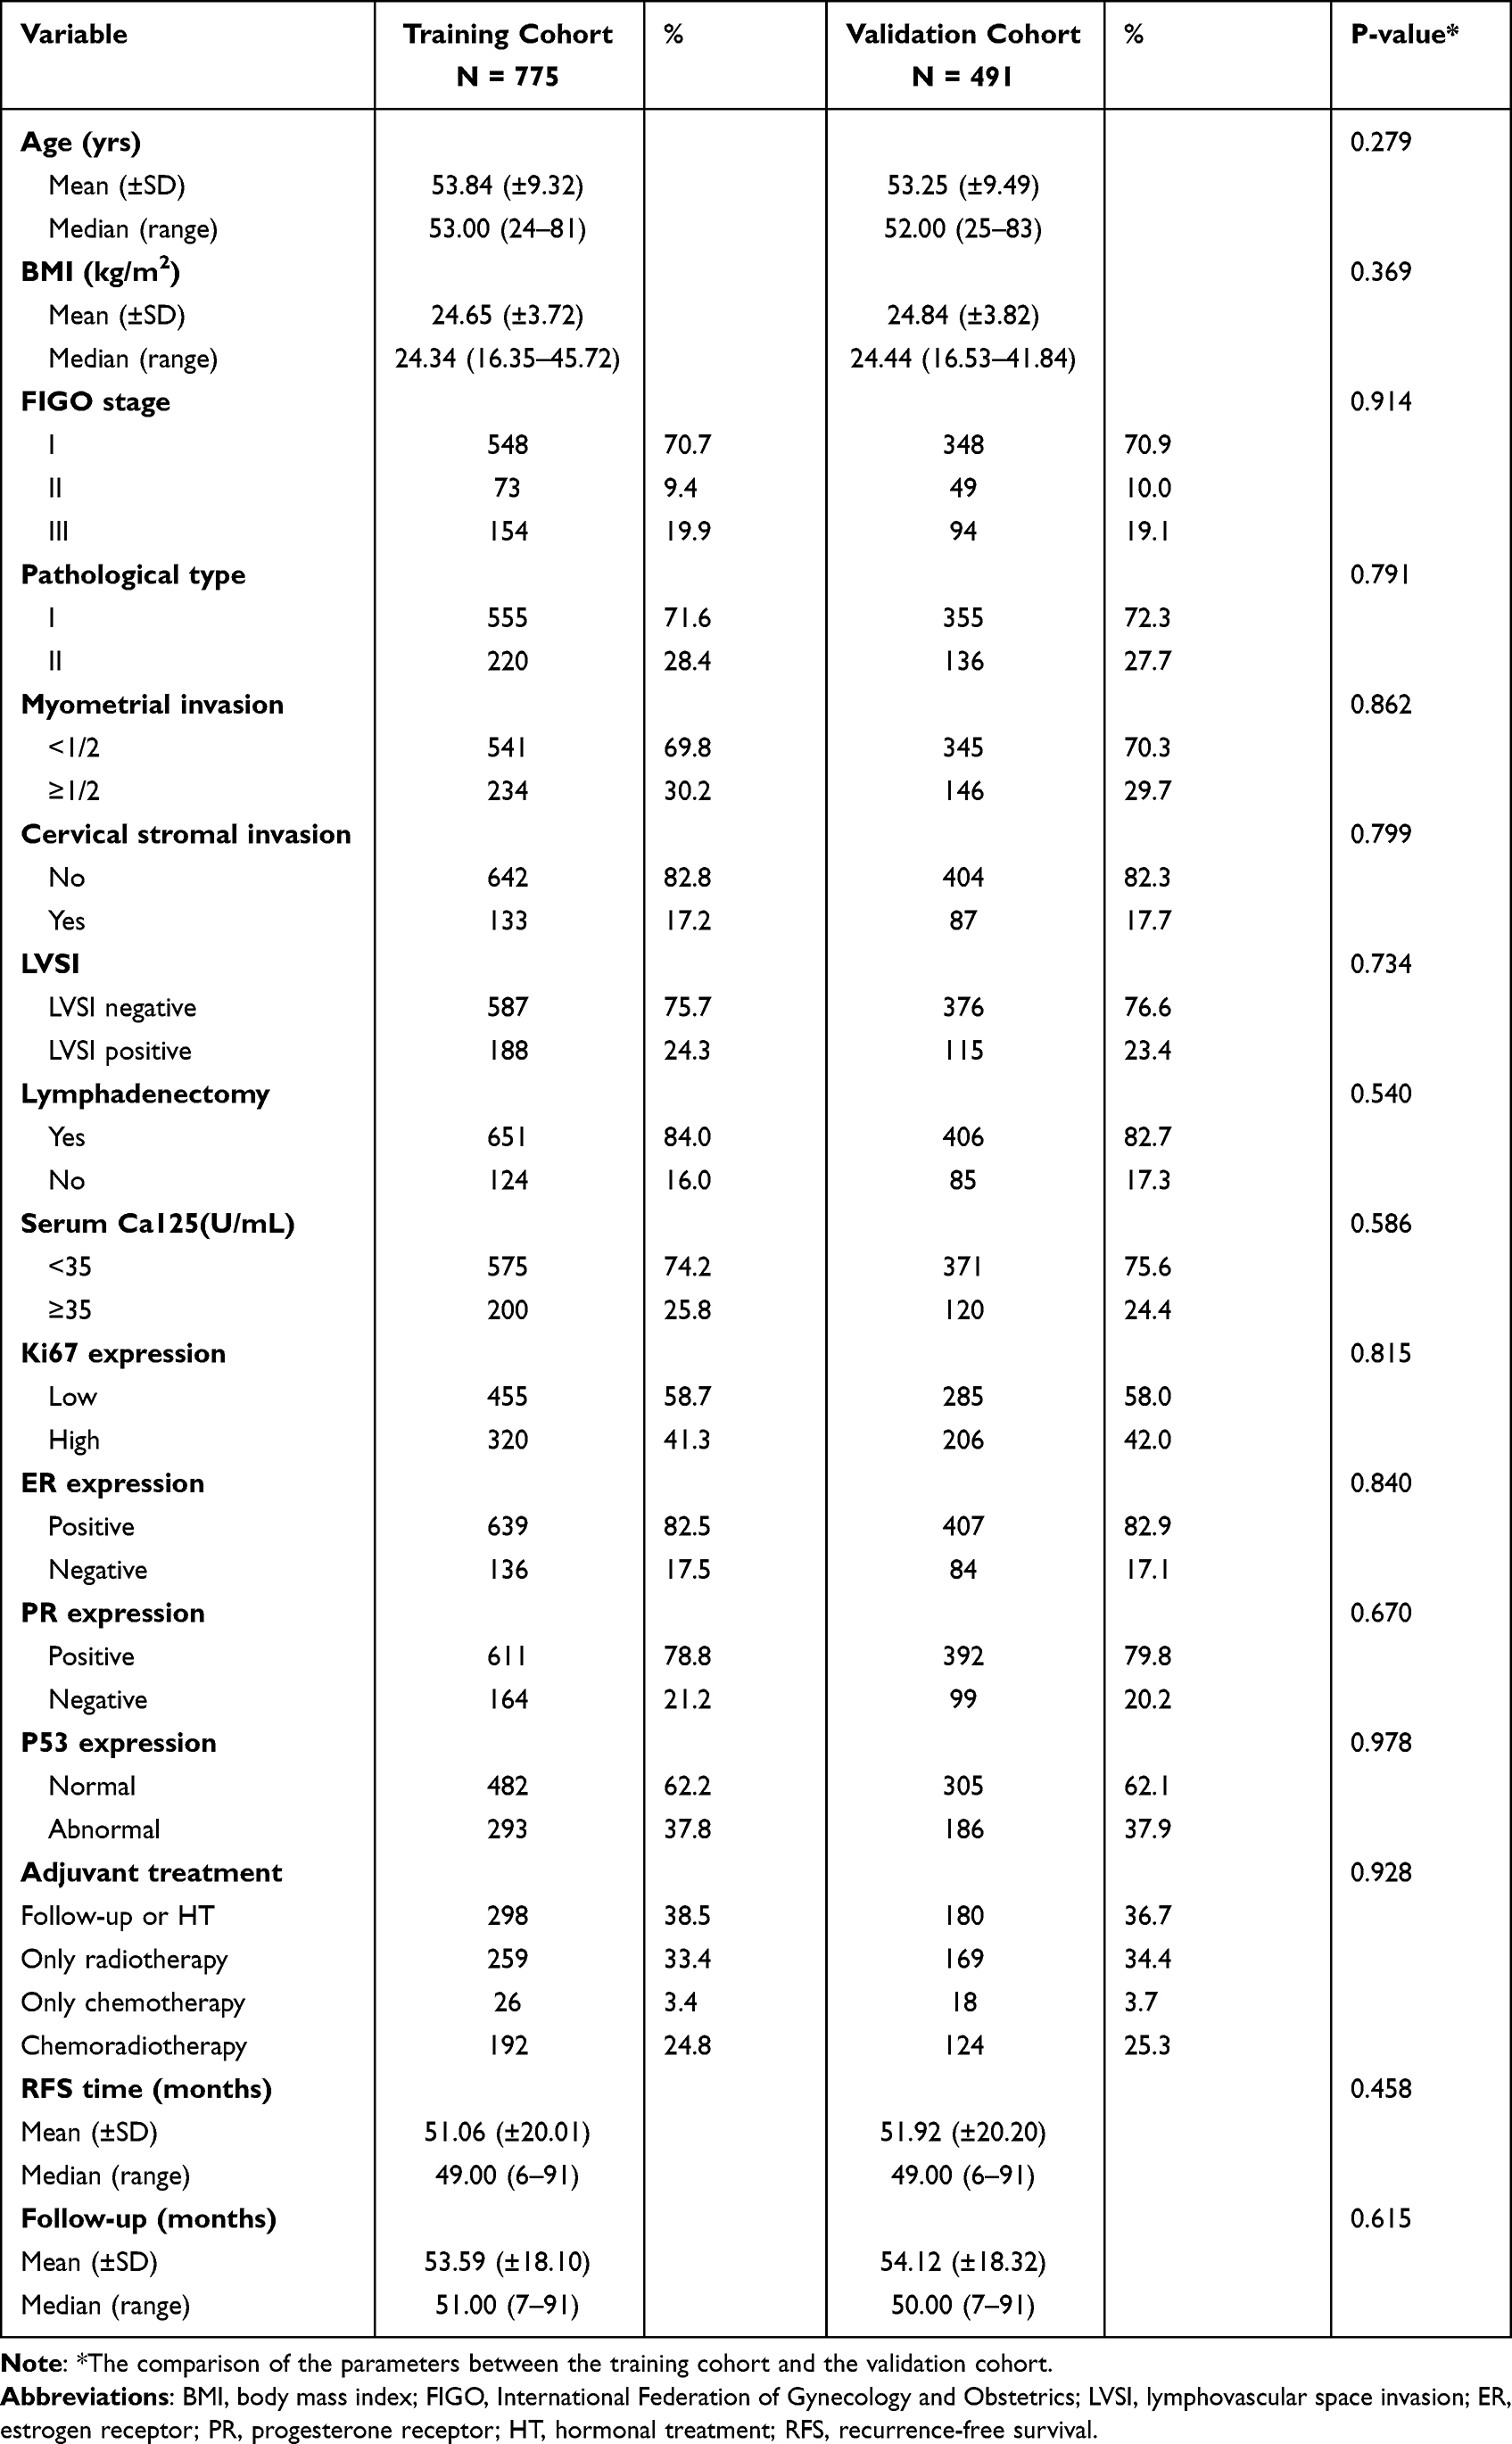 |
Table 1 Baseline Characteristics of the Training Cohort and the Validation Cohort |
The clinical characteristics of relapsed patients in the two cohorts are summarized in Supplementary Table 1. There were 106 patients relapsed in the training cohort, 75 patients were found to be died during follow-up, 70 of whom died due to relapse, and the median follow-up and RFS for relapsed patients were 32 months and 17 months, respectively; the validation cohort had 60 relapses and 42 deaths, 38 of whom died due to relapse, and the median follow-up and relapse-free survival were similar to those in the training cohort. The distribution of demographic and clinicopathological characteristics of patients in the two cohorts was relatively consistent, with no statistically significant differences (the P values of comparison of all parameters between two cohorts were >0.05).
The Construction of Inflammation-Immunity-Nutrition Score
The ROC curve and the maximum of Youden index showed that the optimal thresholds of CRP, LYM, and ALB for predicting the recurrence of EC were 4.76 mg/L, 1.37×10⁹/L, and 37 g/L, respectively (Figure 2). Based on the above thresholds, CRP, LYM, and ALB were scored as follows: (1) CRP <4.76 mg/L, score 0; CRP >4.76 mg/L, score 1; (2) LYM ≥1.37×10⁹/L, score 0; LYM <1.37×10⁹/L, score 1; (3) ALB ≥37 g/L, score 0; ALB <37 g/L, score 1. Then, inflammation-immunity-nutrition score (IINS) was defined as the sum of the scores of CRP, LYM and ALB (IINS = the score of CRP (0 or 1) + the score of LYM (0 or 1) + the score of ALB (0 or 1), range 0–3).8 Finally, the distribution of IINS of patients in the two cohorts is shown in Table 2. The IINS of most patients (>80%) were 0 or 1, patients with higher IINS had worse overall prognosis (RFS and OS), the difference was statistically significant (P < 0.001) (Figure 3). However, the predictive performance for using IINS alone to predict the recurrence of EC was not good, the C-index of IINS in training cohort and validation cohort were only 0.708 (95% CI, 0.657–0.759) and 0.696 (95% CI, 0.628–0.764), respectively.
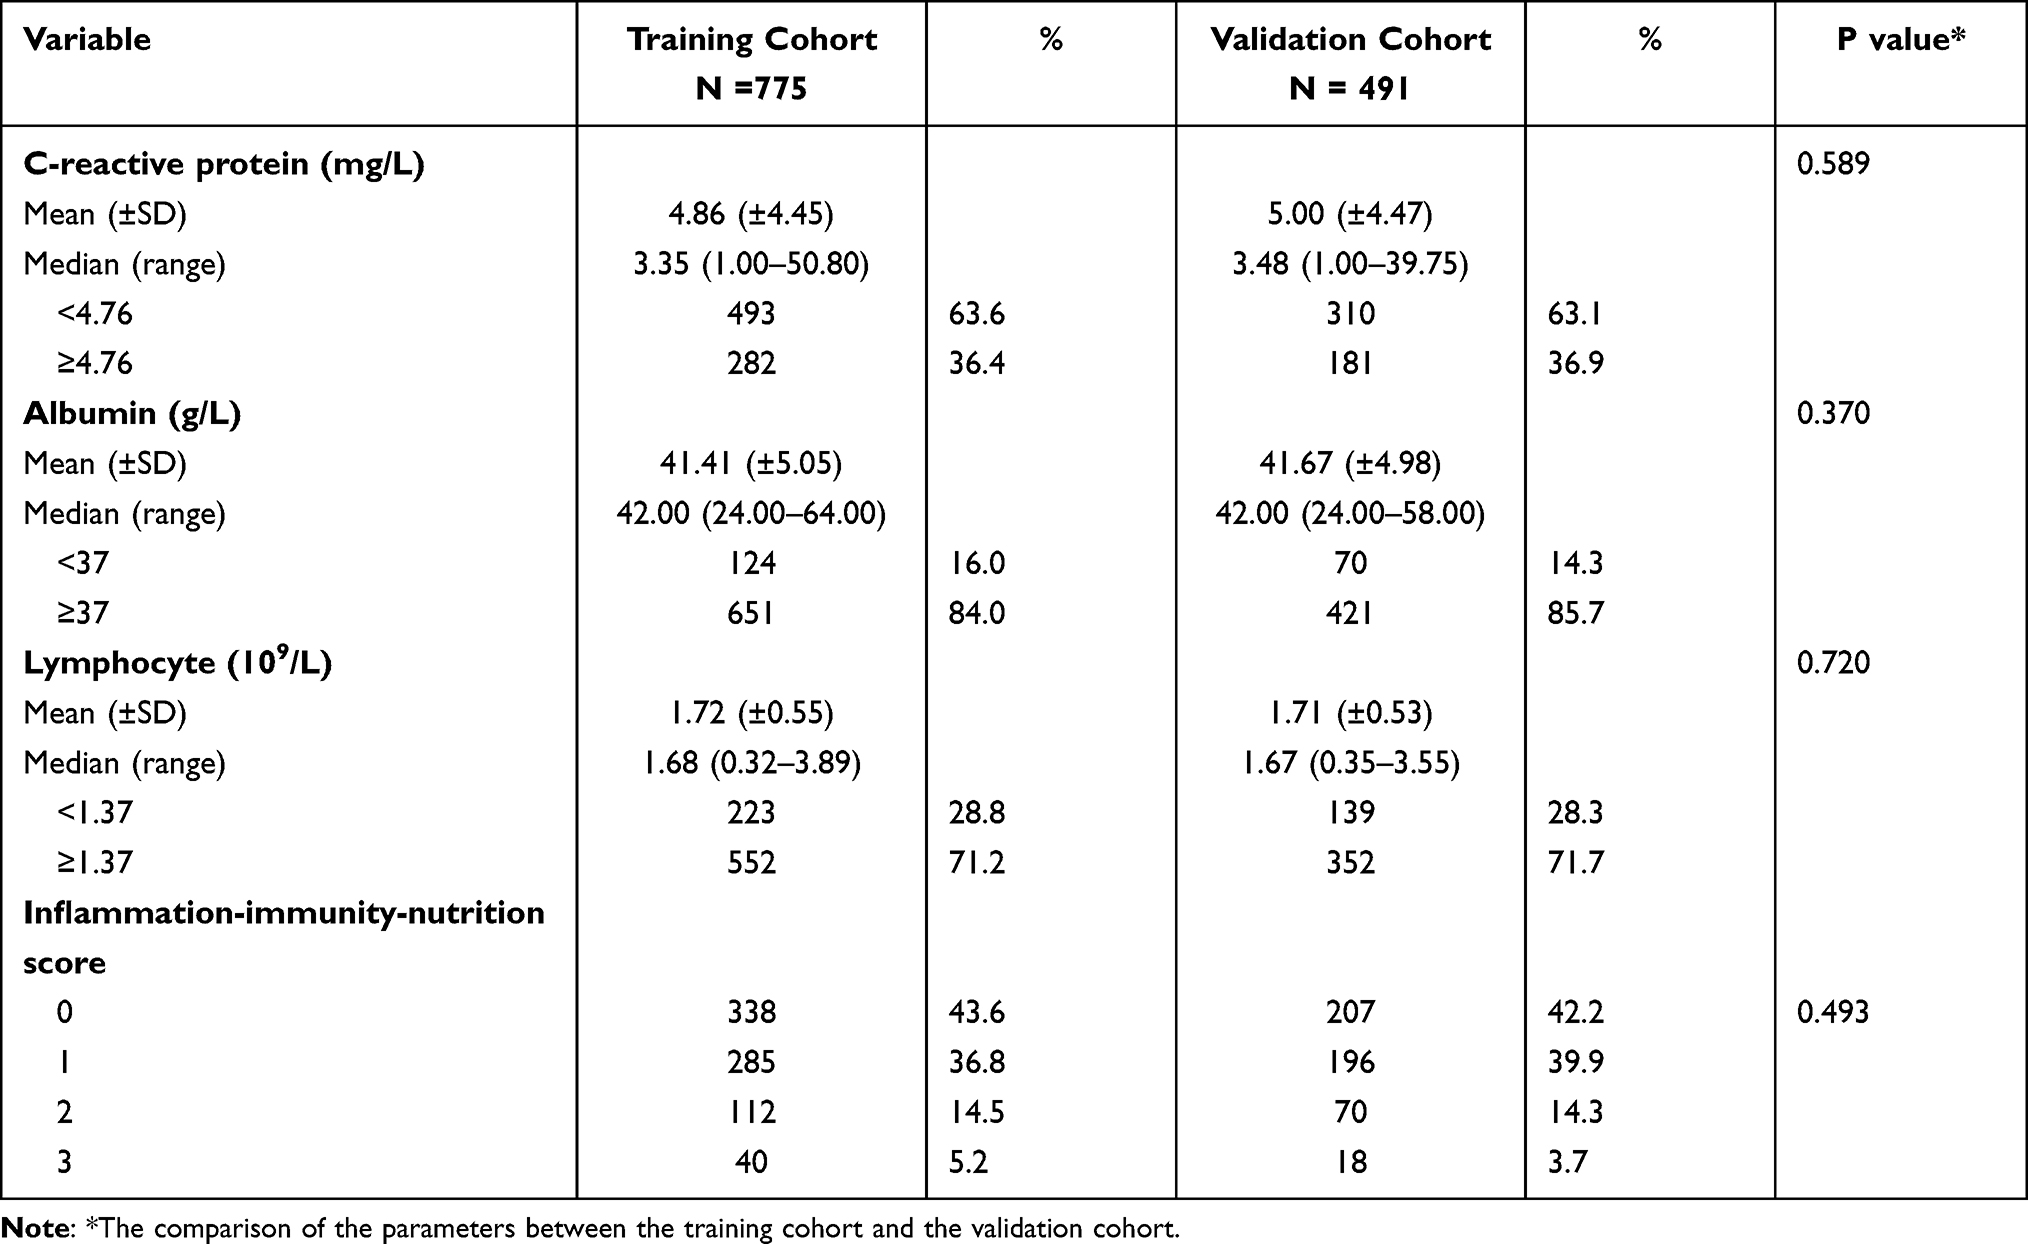 |
Table 2 The Distribution of Inflammation-Immunity-Nutrition Score (IINS) of Two Cohorts |
 |
Figure 2 The ROC curve of (A) CRP, (B) ALB, and (C) LYM for predicting the recurrence of EC. Description: “black dot” represents the area under the curve (AUC) at this point is the largest, which suggests that the value of this point is the optimal threshold of the indicator for predicting the recurrence of EC. |
 |
Figure 3 Kaplan–Meier survival curve of IINS in two cohorts. Description: (A) RFS curve of IINS in the training cohort; (B) OS curve of IINS in the training cohort. (C) RFS curve of IINS in the validation cohort. (D) OS curve of IINS in the validation cohort. |
Univariate and Multivariate Cox Regression Analysis of Predictors for Predicting Recurrence
Univariate analysis showed that except for BMI (P = 0.185) and lymphadenectomy (P = 0.554), other predictors included IINS (P < 0.001), age (P < 0.001), FIGO stage (P < 0.001), pathological type (P < 0.001), myometrial invasion (P < 0.001), cervical stromal invasion (P < 0.001), LVSI (P < 0.001), adjuvant treatment (P < 0.001), serum Ca125 (P < 0.001), Ki67 expression (P < 0.001), ER expression (P < 0.001), PR expression (P < 0.001), and P53 expression (P = 0.001) were all significantly associated with recurrence of EC, and these factors were further included in multivariate analysis. Then, multivariate analysis showed that nine predictors were independently associated with recurrence, namely IINS (P < 0.001), age (P = 0.030), FIGO stage (P = 0.018), pathological type (P = 0.019), myometrial invasion (P = 0.030), LVSI (P = 0.008), Ki67 expression (P = 0.019), ER expression (P = 0.038), and P53 expression (P = 0.028) (Table 3). The nine predictors were further used to develop a nomogram model.
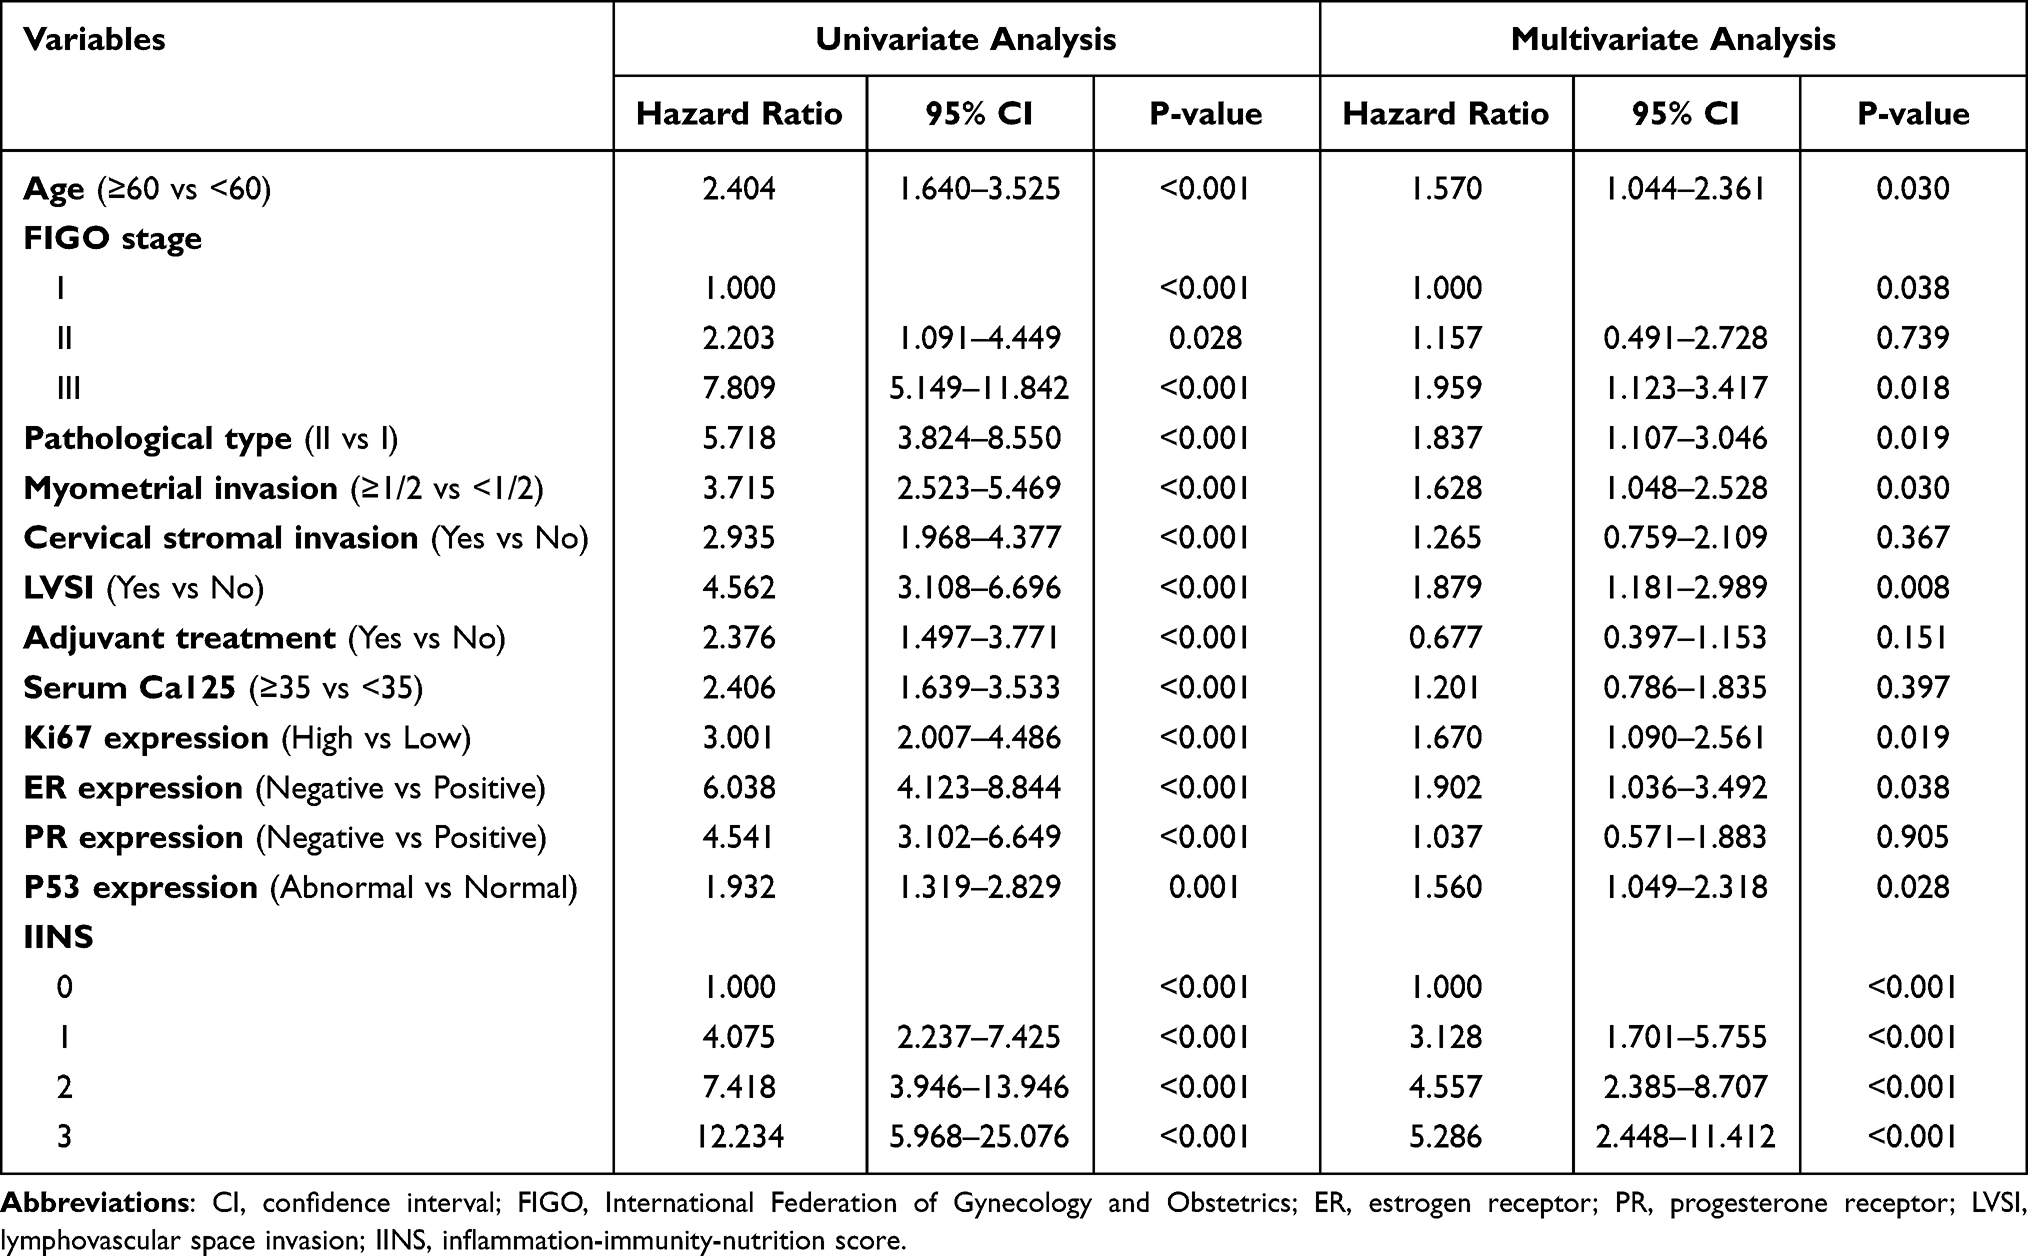 |
Table 3 Univariate and Multivariate Analysis of Factors Predicting EC Recurrence in the Training Cohort |
Establishment of the Nomogram Model and Evaluation of Its Predictive Performance
Nine predictors with P-value <0.05 in multivariate analysis were used to successfully construct a nomogram model by R software (Figure 4). Through the nomogram model, the prognostic value of each predictor can be seen intuitively, because the length of the line segment corresponding to each predictor in the nomogram represents the weight of the predictor leading to the recurrence of EC. It can be seen from this nomogram that even compared with the other eight traditional classical predictors, the weight of IINS was still larger (the line segment corresponding to IINS was the longest), which indicated that IINS might play an important role in the occurrence of prognostic outcome (recurrence).
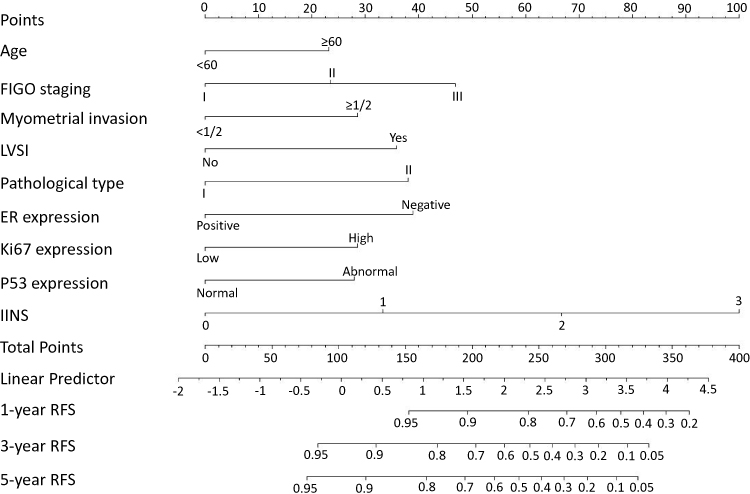 |
Figure 4 Nomogram model for predicting the 1-year, 3-year, and 5-year RFS rates of EC patients. Description: to predict the 1-year, 3-year, and 5-year RFS rates of EC patients, locate the patient’s age on the “age” axis. Draw a straight line up to the “point” axis to determine the points for “age”. Repeat the process for each of the remaining axes, drawing a straight line each time to the “point” axis. Add the points received from each variable and locate this point on the “total point” axis. A straight line is drawn down from the “total point” axis to the “1-year RFS”, “3-year RFS”, and “5-year RFS” axis to determine the 1-year, 3-year, and 5-year RFS rates of EC patients. |
The predictive performance of the model was comprehensively evaluated by internal and external calibration curves as well as the C-index. The 1-, 3-, and 5-year internal and external calibration curves showed that the “nomogram predicted survival” was highly consistent with the “actual survival”, indicating that the model fit well (Figure 5). Similarly, the C-index of internal and external validation of the model were 0.887 (95% CI, 0.855–0.918) and 0.883 (95% CI, 0.838–0.928), respectively, which also indicated that the model had a relatively good prediction accuracy.
 |
Figure 5 The calibration curve for internal and external validation of the nomogram model. Description: (A–C) the internal calibration curve of the nomogram for predicting the 1-year, 3-year, and 5-year RFS rates of EC patients, respectively; (D–F) the external calibration curve of the nomogram for predicting the 1-year, 3-year, and 5-year RFS rates of EC patients, respectively. |
Optimal Risk Thresholds of the Nomogram Model
Since most recurrent EC patients relapsed within 3 years after surgery, we calculated the 3-year RFS rate for each patient in the training cohort through the model. Then, ROC curve and the maximum of Youden index were used to determine the optimal threshold (0.85) of the 3-year RFS rate predicted by the nomogram model (Figure 6). Based on this threshold, patients with 3-year RFS rates ≤0.85 and >0.85 in the two cohorts were defined as high-risk group and low-risk group of recurrence, respectively. Kaplan–Meier survival analysis showed that the RFS and OS of patients in the high-risk group were much lower than those in the low-risk group in both two cohorts, and the difference was statistically significant, which is shown in Table 4 and Figure 7.
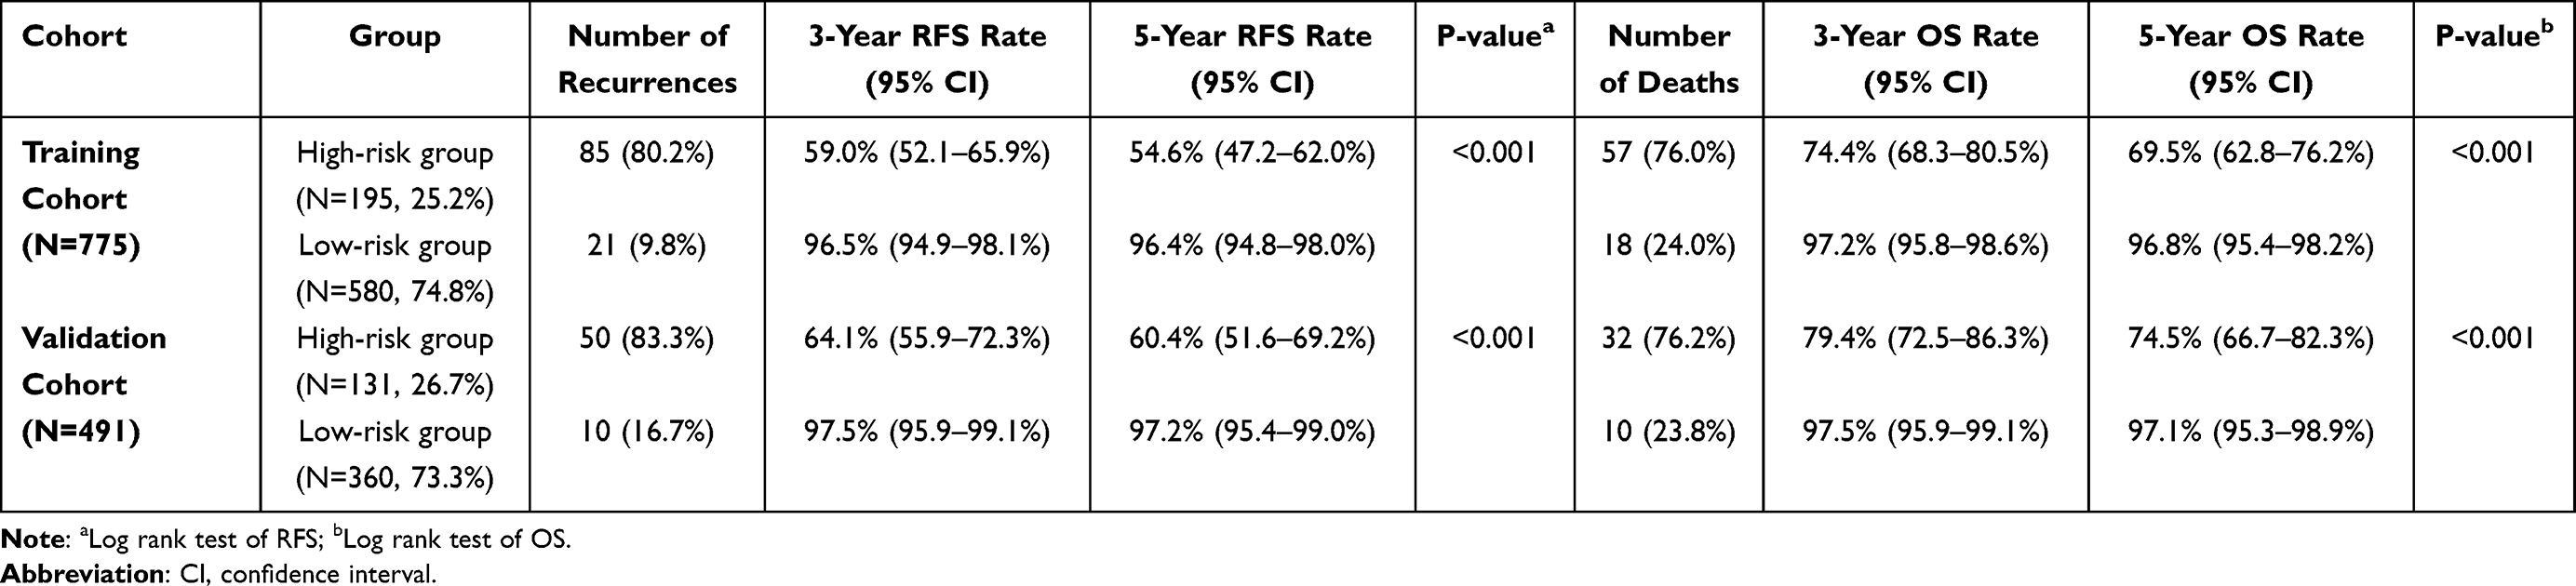 |
Table 4 Analysis of Survival Differences Between High- and Low-Risk Groups in Training Cohort and Validation Cohort |
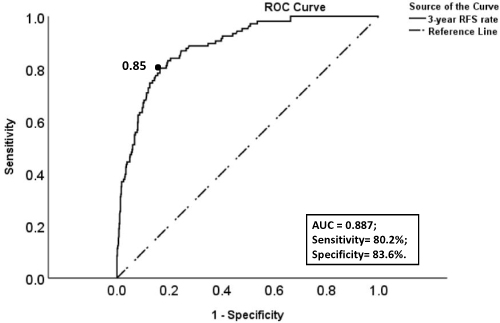 |
Figure 6 The ROC curve of the 3-year RFS rates (predicted by the nomogram model) for predicting the recurrence of EC. Description: “black dot” represents the area under the curve (AUC) at this point is the largest, which suggests that the optimal threshold of the 3-year RFS rate (risk threshold of the model) for predicting the recurrence of EC is 0.85 (area under the curve = 0.887; sensitivity, 80.2%; specificity, 83.6%). |
 |
Figure 7 Kaplan–Meier survival curve of low- and high-risk groups in two cohorts. Description: (A) RFS curve of low- and high-risk groups in the training cohort; (B) OS curve of low- and high-risk groups in the training cohort. (C) RFS curve of low- and high-risk groups in the validation cohort. (D) OS curve of low- and high-risk groups in the validation cohort. |
Comparison of the Predictive Performance (C-Index and NRI) Among Different Predictive Models
To further demonstrate the superiority of the model proposed in this study, we compared it with four similar models for predicting recurrence of EC in other studies. The four models were all composed of traditional classical predictors (clinicopathological parameters or/and molecular markers), including model A,31 model B,26 model C32 and model D.33 Through the comparison of C-index of the five models, it was found that the five models can be roughly divided into three echelons: (1) model B and model C, the predictive performance of the two models was average (0.75<C-index<0.80); (2) model A and model D, the predictive performance of the two models was good (0.80<C-index<0.85); (3) the model proposed in this study, the predictive performance of the model was best (C-index>0.88) (Table 5). Obviously, with the continuous enrichment of the key predictors included in the above three echelons, the predictive performance of the models was better and better. The model proposed in this study combined IINS and traditional classical predictors, the C-index of the model was the highest among the five models in both the training cohort (0.887, 95% CI 0.855–0.918) and the validation cohort (0.883, 95% CI 0.838–0.928), which indicated that combining IINS based on traditional predictors can further optimize the model prediction performance. Similarly, NRI also suggested that the model proposed in this study has significantly different degrees of positive improvement compared with the four models (NRI > 0).
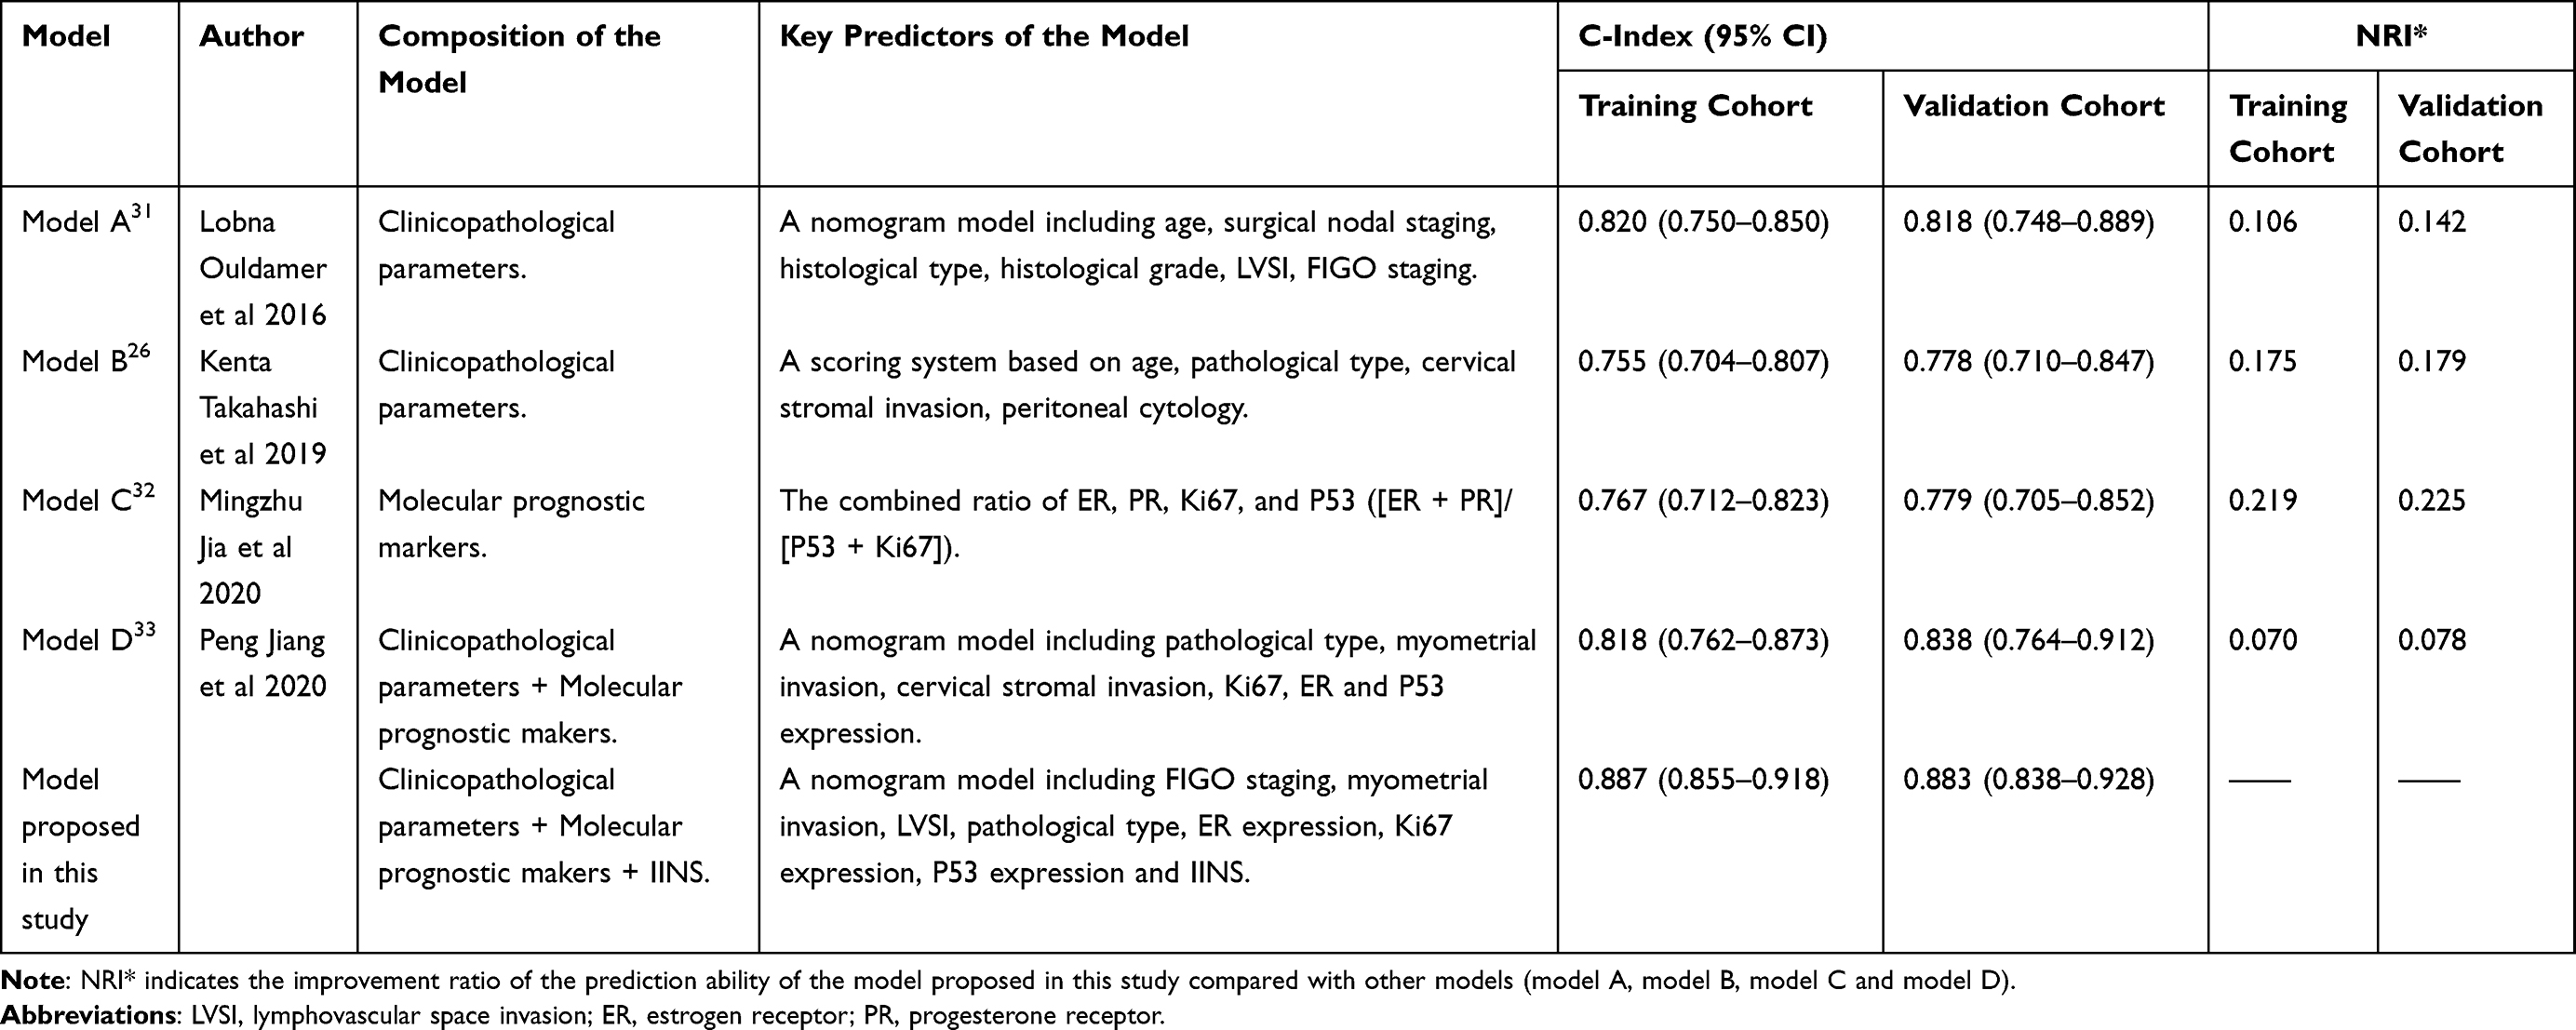 |
Table 5 The Predictive Performance (C-Index and NRI) of Different Models for Predicting EC Recurrence in the Training Cohort and Validation Cohort |
Discussion
Accurate prediction of EC recurrence and subsequent personalized treatment have always been the direction of researchers’ efforts.2 In this study, we first explored the prognostic significance of IINS in EC and demonstrated that IINS may be an independent predictor of EC recurrence even when compared with traditional classical predictors (clinicopathological parameters and molecular prognostic markers). However, the prognostic value for using IINS alone to predict the recurrence of EC was very limited (the C-index of IINS for independently predicting EC recurrence was only about 0.7); therefore, we combined IINS and traditional predictors to further develop a nomogram model that can visually display IINS. The calibration curve and C-index of the internal and external validation of the model showed that the model proposed in this study had good prediction accuracy, and the prediction performance of the model proposed in this study was also better than similar prediction models in other studies due to the combination of IINS and traditional predictors. Through this nomogram model, we can more accurately evaluate the prognosis of each patient, for example, a patient with age ≥60 (23 points), FIGO stage II (23 points), the depth of myometrial invasion ≥1/2 (28 points), no LVSI (0 points), pathological type II (38 points), negative expression of ER (39 points), low expression of Ki67 (0 points), normal expression of P53 (0 points), and IINS = 2 (66 points), the total score was 217 points, and the corresponding 1-year, 3-year and 5-year RFS rates of the patient were about 0.86, 0.63 and 0.60, respectively. Because different patients have different clinicopathological characteristics, different patients would get different predictive results of prognostic through this model. Compared with simply telling patients the risk of recurrence was “high” or “low”, such predictive results were undoubtedly very interesting and more convincing, and at the same time, it can also be used as an important reference index for the subsequent formulation of personalized treatment plans for patients.
At present, postoperative adjuvant therapy (radiotherapy or chemoradiotherapy) is still an important intervention to control local recurrence and distant metastasis of patients with EC.5 Whether patients with EC receive adjuvant therapy after surgery mainly depends on whether the patients have high-risk clinicopathological parameters.2 For example, the latest National Comprehensive Cancer Network (NCCN) clinical practice guidelines5 and European Society for Medical Oncology (ESMO) clinical practice guidelines34 still suggest that supplemental postoperative radiotherapy or even combined chemotherapy should be considered if patients with the following high-risk factors: older age (especially >60y), non-endometrioid carcinoma (especially serous or clear cell carcinoma histology), high-grade tumors, extensive LVSI, deep myometrial invasion (≥1/2), cervical stromal invasion, advanced FIGO stage (stage III–IV), etc. However, in this study, we divided patients into high- and low-risk groups of recurrence according to the risk threshold of the model, patients in high-risk group had much lower RFS and OS than those in low-risk group. Even though most patients in high-risk group received postoperative adjuvant therapy according to the existing guidelines, it was obvious that a considerable number of patients in high-risk group relapsed or dead due to the combination of multiple adverse prognostic factors, which suggested that we should pay more attention to the patients in high-risk group identified by the model. For example, the established adjuvant treatment plan of patients could be appropriately adjusted (combination systemic therapy may be recommended for patients when receiving radiotherapy alone, or the cycle of adjuvant treatment could be appropriately extended), follow-up of patients could be performed more closely, and more diversified treatment plans (endocrine therapy, targeted therapy, or immunotherapy) could be recommended for patients, etc. It was worth mentioning that there were still some patients in high-risk group who did not have obvious high-risk clinicopathological factors, so most of them did not receive postoperative adjuvant therapy according to the guidelines, but their molecular markers and IINS indicated a poor prognosis. For example, the clinicopathological features of a patient were age <60 (0 points), FIGO stage I (0 points), the depth of myometrial invasion <1/2 (0 points), no LVSI (0 points), pathological type I (0 points), but the results of the molecular prognostic markers and IINS of the patient were negative expression of ER (39 points), high expression of Ki67 (28 points), abnormal expression of P53 (26 points), and IINS = 3 (100 points), the total score calculated by the model was still as high as 193 points, corresponding 3-year RFS rate of the patients was about 0.73, so the patient still belonged to the high-risk group of recurrence according to the risk threshold (0.85) of the model. It suggested that we should not only focus on the clinicopathological characteristics of patients, but also the expression of molecular markers and IINS in patients. At the same time, these patients may also need to receive certain postoperative adjuvant therapy even if they were with a “low risk” of recurrence according to the guidelines. Of course, whether these patients can benefit from adjuvant therapy still needs further clinical validation, but our model may be the basis for risk stratification of patients in such clinical validation.26
It is worth noting that in recent years, the Cancer Genome Atlas (TCGA) molecular classification of EC has pushed the prognostic value of molecular prognostic markers to a climax due to subverting the traditional pathological classification.35 The four molecular subgroups with significant prognostic differences were POLE-mutated/ultramutated (POLEmt) group (the best prognosis), copy-number-low/p53-wild-type (p53wt) group (relatively good prognosis), microsatellite-instable/hypermutated (MSI) group (poor prognosis), and copy-number-high/p53-mutated (p53mt) group (the worst prognosis).1 Moreover, relevant studies have found that some molecular classification has “priority” compared with clinicopathological parameters.36 For example, patients with POLEmt still show good clinical outcomes even if they are combined with high-grade (G3) tumors, or high-risk histological types such as serous carcinoma, clear cell carcinoma or undifferentiated carcinoma. Based on this, the latest ESMO guidelines have combined molecular classification with classical clinicopathological parameters to define a new prognostic risk group to guide patients’ adjuvant treatment.34 Therefore, the popularization of the study and application of molecular prognostic markers will be the general trend. However, on the one hand, due to the high cost and complicated procedures of gene test, the clinical application of TCGA molecular classification is still very limited in many developing countries or regions.33 On the other hand, the existing guidelines or prediction models ignore the potential prognostic value of IINS in EC. This study integrates a little part of TCGA molecular classification (P53 molecular classification), IINS and clinicopathological parameters in the form of nomogram model. Although the types of molecular classification in the model need to be further expanded, our model could serve as a transitional tool for the popularization of future molecular prognostic models.
It should be explained that in univariate analysis, adjuvant therapy was prompted as “risk factor” (HR value of adjuvant therapy in univariate analysis >1) due to its strong collinearity with multiple adverse prognostic factors (because patients usually received adjuvant therapy when they were combined with adverse prognostic factors). In fact, after multivariate analysis offsets the collinearity between factors, we found that adjuvant therapy was a “protective factor” (HR value of adjuvant therapy in multivariate analysis <1). Although no significant correlation was found between adjuvant therapy and recurrence (P value of adjuvant therapy >0.05), many other studies have reported that adjuvant therapy plays a positive role in improving the prognosis of patients (especially patients with high-risk factors),37,38 and as mentioned above, adjuvant therapy is still the main postoperative supplementary treatment for patients with high-risk factors recommended by current guidelines.5 Secondly, in our previous study, we have proposed a model based on classical predictors to predict EC recurrence.2 However, compared with the previous study, this study further expanded the number of patients included in the study, extended the follow-up time of patients, and added a patient cohort from another center used for external validation of the model, which undoubtedly greatly improved the reliability of statistical analysis results; meanwhile, the setting of external validation cohort from another center also made the predictive performance of the model more convincing and facilitated the generalization of the model. Most importantly, in this study, we first explored the prognostic value of inflammation-immunity-nutrition score (IINS) based on preoperative C-reactive protein (CRP), lymphocytes (LYM), and albumin (ALB) in EC, and found that the combination of IINS and traditional predictors could greatly improve the predictive performance of the model compared with previous studies (Table 5). Therefore, although there are some similarities between this study and the previous study, in fact, this study is the continuation and sublimation of the previous study, which is also in line with the current research trend, that is, constantly looking for new prognostic indicators to improve the predictive performance of the model, so as to carry out accurate prognostic evaluation and personalized treatment for patients. Finally, the biggest limitation of this study is that it is a retrospective study, so it needs to be further demonstrated by prospective clinical trials.
In conclusion, we explored the prognostic value of IINS in EC and developed a nomogram model based on IINS and traditional classical predictors. Through this model, we can more accurately predict the recurrence of EC, and perform risk stratification of patients based on the risk threshold of the model to better manage the prognosis of patients.
Abbreviations
EC, endometrial cancer; IINS, inflammation-immunity-nutrition score; CRP, C-reactive protein; LYM, lymphocytes; ALB, albumin; BMI, body mass index; FIGO, International Federation of Gynecology and Obstetrics; LVSI, lymphovascular space invasion; ER, estrogen receptor; PR, progesterone receptor; HT, hormonal treatment; RFS, recurrence-free survival; OS, overall survival; ROC, receiver operating characteristic; AUC, area under the curve; NCCN, National Comprehensive Cancer Network; ESMO, European Society for Medical Oncology; TCGA, the Cancer Genome Atlas.
Data Sharing Statement
The datasets used and/or analyzed during the current study are available from the corresponding author on reasonable request.
Ethics Approval and Consent to Participate
Ethics Committee of Chongqing Medical University approved this study (Ethics approval number:2020-192). All patients provided their informed consent before starting the treatment and gave consent to have their data published. As it was a retrospective clinical study, all the patients were contacted by telephone to obtain verbal informed consent and it was approved by the ethics committee. All data about the patients was anonymized or maintained with confidentiality. This study complied with the Declaration of Helsinki.
Funding
There is no funding to report.
Disclosure
The authors declared no conflicts of interest in this study.
References
1. Raffone A, Travaglino A, Mascolo M, et al. TCGA molecular groups of endometrial cancer: pooled data about prognosis. Gynecol Oncol. 2019;155:374–383. doi:10.1016/j.ygyno.2019.08.019
2. Jiang P, Huang J, Deng Y, et al. Predicting recurrence in endometrial cancer based on a combination of classical parameters and immunohistochemical markers. Cancer Manag Res. 2020;12:7395–7403. doi:10.2147/CMAR.S263747
3. Versluis MA, de Jong RA, Plat A, et al. Prediction model for regional or distant recurrence in endometrial cancer based on classical pathological and immunological parameters. Br J Cancer. 2015;113:786–793. doi:10.1038/bjc.2015.268
4. Jiang P, Huang Y, Tu Y, et al. Combining clinicopathological parameters and molecular indicators to predict lymph node metastasis in endometrioid type endometrial adenocarcinoma. Front Oncol. 2021;11:682925. doi:10.3389/fonc.2021.682925
5. NCCN. NCCN clinical practice guidelines in oncology (NCCN guidelines®) uterine neoplasms version 1.2021; 2020. NCCN Guidelines for Patients®. Available from: www.nccn.org.
6. Gulseren V, Kocaer M, Ozdemir IA, Cakir I, Sanci M, Gungorduk K. Do estrogen, progesterone, P53 and Ki67 receptor ratios determined from curettage materials in endometrioid-type endometrial carcinoma predict lymph node metastasis? Curr Probl Cancer. 2020;44:100498. doi:10.1016/j.currproblcancer.2019.07.003
7. Ma Y, Lu P, Liang X, Wei S. Models based on dynamic clinicopathological indices for predicting prognosis during the perioperative period for patients with colorectal cancer. J Inflamm Res. 2021;14:1591–1601. doi:10.2147/JIR.S302435
8. Li XY, Yao S, He YT, et al. Score for patients with resectable colorectal cancer. J Inflamm Res. 2021;14:4577–4588. doi:10.2147/JIR.S322260
9. Murata M. Inflammation and cancer. Environ Health Prev Med. 2018;23:50. doi:10.1186/s12199-018-0740-1
10. Ostroumov D, Fekete-Drimusz N, Saborowski M, Kuhnel F, Woller N. CD4 and CD8 T lymphocyte interplay in controlling tumor growth. Cell Mol Life Sci. 2018;75:689–713. doi:10.1007/s00018-017-2686-7
11. Lu J, Xu BB, Zheng ZF, et al. CRP/prealbumin, a novel inflammatory index for predicting recurrence after radical resection in gastric cancer patients: post hoc analysis of a randomized Phase III trial. Gastric Cancer. 2019;22:536–545. doi:10.1007/s10120-018-0892-0
12. Huang J, Xu L, Luo Y, He F, Zhang Y, Chen M. The inflammation-based scores to predict prognosis of patients with hepatocellular carcinoma after hepatectomy. Med Oncol. 2014;31:883. doi:10.1007/s12032-014-0883-x
13. Kobayashi M, Shimodaira S, Nagai K, et al. Prognostic factors related to add-on dendritic cell vaccines on patients with inoperable pancreatic cancer receiving chemotherapy: a multicenter analysis. Cancer Immunol Immunother. 2014;63:797–806. doi:10.1007/s00262-014-1554-7
14. Socha MW, Malinowski B, Puk O, et al. C-reactive protein as a diagnostic and prognostic factor of endometrial cancer. Crit Rev Oncol Hematol. 2021;164:103419. doi:10.1016/j.critrevonc.2021.103419
15. Burgess B, Levine B, Taylor RN, Kelly MG. Preoperative circulating lymphocyte and monocyte counts correlate with patient outcomes in type I and type II endometrial cancer. Reprod Sci. 2020;27:194–203. doi:10.1007/s43032-019-00009-4
16. Seebacher V, Grimm C, Reinthaller A, et al. The value of serum albumin as a novel independent marker for prognosis in patients with endometrial cancer. Eur J Obstet Gynecol Reprod Biol. 2013;171:101–106. doi:10.1016/j.ejogrb.2013.07.044
17. Pecorelli S. Revised FIGO staging for carcinoma of the vulva, cervix, and endometrium. Int J Gynaecol Obstet. 2009;105:103–104. doi:10.1016/j.ijgo.2009.02.012
18. Colombo N, Preti E, Landoni F, et al. Endometrial cancer: ESMO clinical practice guidelines for diagnosis, treatment and follow-up. Ann Oncol. 2013;24(Suppl 6):vi33–vi38. doi:10.1093/annonc/mdt353
19. Jiang P, Yuan R. Analysis of factors related to lymph node metastasis in early-stage type 1 endometrial cancer: verifying the clinical value of positive threshold of the immunohistochemical parameter Ki67. Cancer Manag Res. 2021;13:6319–6328. doi:10.2147/CMAR.S316211
20. Yang B, Shan B, Xue X, et al. Predicting lymph node metastasis in endometrial cancer using serum CA125 Combined with immunohistochemical markers PR and Ki67, and a comparison with other prediction models. PLoS One. 2016;11:e0155145. doi:10.1371/journal.pone.0155145
21. Jiang P, Jia M, Hu J, et al. Prognostic value of Ki67 in patients with stage 1–2 endometrial cancer: validation of the cut-off value of Ki67 as a predictive factor. Onco Targets Ther. 2020;13:10841–10850. doi:10.2147/OTT.S274420
22. Smith D, Stewart CJR, Clarke EM, et al. ER and PR expression and survival after endometrial cancer. Gynecol Oncol. 2018;148:258–266. doi:10.1016/j.ygyno.2017.11.027
23. Ferrandina G, Ranelletti FO, Gallotta V, et al. Expression of cyclooxygenase-2 (COX-2), receptors for estrogen (ER), and progesterone (PR), p53, ki67, and neu protein in endometrial cancer. Gynecol Oncol. 2005;98:383–389. doi:10.1016/j.ygyno.2005.04.024
24. Kobel M, Ronnett BM, Singh N, Soslow RA, Gilks CB, McCluggage WG. Interpretation of P53 Immunohistochemistry in endometrial carcinomas: toward increased reproducibility. Int J Gynecol Pathol. 2019;38:S123–S131. doi:10.1097/PGP.0000000000000488
25. Fung-Kee-Fung M, Dodge J, Elit L, Lukka H, Chambers A, Oliver T; Cancer Care Ontario Program in Evidence-Based Care Gynecology Cancer Disease Site Group. Follow-up after primary therapy for endometrial cancer: a systematic review. Gynecol Oncol. 2006;101:520–529. doi:10.1016/j.ygyno.2006.02.011
26. Takahashi K, Yunokawa M, Sasada S, et al. A novel prediction score for predicting the baseline risk of recurrence of stage I-II endometrial carcinoma. J Gynecol Oncol. 2019;30:e8. doi:10.3802/jgo.2019.30.e8
27. Schisterman EF, Perkins NJ, Liu A, Bondell H. Optimal cut-point and its corresponding youden index to discriminate individuals using pooled blood samples. Epidemiology. 2005;16:73–81. doi:10.1097/01.ede.0000147512.81966.ba
28. Austin PC, Harrell FE Jr, Klaveren D. Graphical calibration curves and the integrated calibration index (ICI) for survival models. Stat Med. 2020;39:2714–2742. doi:10.1002/sim.8570
29. Brentnall AR, Cuzick J. Use of the concordance index for predictors of censored survival data. Stat Methods Med Res. 2018;27:2359–2373. doi:10.1177/0962280216680245
30. Alba AC, Agoritsas T, Walsh M, et al. Discrimination and calibration of clinical prediction models: users’ guides to the medical literature. JAMA. 2017;318:1377–1384. doi:10.1001/jama.2017.12126
31. Ouldamer L, Bendifallah S, Body G, et al. Predicting poor prognosis recurrence in women with endometrial cancer: a nomogram developed by the FRANCOGYN study group. Br J Cancer. 2016;115:1296–1303. doi:10.1038/bjc.2016.337
32. Mingzhu J, Peng J, Zhen H, Jing H, Ying D, Zhuoying H. The combined ratio of estrogen, progesterone, Ki-67 and P53 to predict the recurrence of endometrial cancer. J Surg Oncol. 2020;122:1808–1814. doi:10.1002/jso.26212
33. Jiang P, Jia M, Hu J, et al. Involving Immunohistochemical markers for predicting the recurrence of stage I-II endometrial cancer. Front Oncol. 2020;10:586081. doi:10.3389/fonc.2020.586081
34. Concin N, Matias-Guiu X, Vergote I, et al. ESGO/ESTRO/ESP guidelines for the management of patients with endometrial carcinoma. Int J Gynecol Cancer. 2021;31:12–39. doi:10.1136/ijgc-2020-002230
35. Urick ME, Bell DW. Clinical actionability of molecular targets in endometrial cancer. Nat Rev Cancer. 2019;19:510–521. doi:10.1038/s41568-019-0177-x
36. Leon-Castillo A, Gilvazquez E, Nout R, et al. Clinicopathological and molecular characterisation of ‘multiple-classifier’ endometrial carcinomas. J Pathol. 2020;250:312–322. doi:10.1002/path.5373
37. Kong A, Johnson N, Kitchener HC, Lawrie TA. Adjuvant radiotherapy for stage I endometrial cancer: an updated Cochrane systematic review and meta-analysis. J Natl Cancer Inst. 2012;104:1625–1634. doi:10.1093/jnci/djs374
38. de Boer SM, Powell ME, Mileshkin L, et al. Adjuvant chemoradiotherapy versus radiotherapy alone for women with high-risk endometrial cancer (PORTEC-3): final results of an international, open-label, multicentre, randomised, phase 3 trial. Lancet Oncol. 2018;19:295–309. doi:10.1016/S1470-2045(18)30079-2
 © 2022 The Author(s). This work is published and licensed by Dove Medical Press Limited. The
full terms of this license are available at https://www.dovepress.com/terms
and incorporate the Creative Commons Attribution
- Non Commercial (unported, 3.0) License.
By accessing the work you hereby accept the Terms. Non-commercial uses of the work are permitted
without any further permission from Dove Medical Press Limited, provided the work is properly
attributed. For permission for commercial use of this work, please see paragraphs 4.2 and 5 of our Terms.
© 2022 The Author(s). This work is published and licensed by Dove Medical Press Limited. The
full terms of this license are available at https://www.dovepress.com/terms
and incorporate the Creative Commons Attribution
- Non Commercial (unported, 3.0) License.
By accessing the work you hereby accept the Terms. Non-commercial uses of the work are permitted
without any further permission from Dove Medical Press Limited, provided the work is properly
attributed. For permission for commercial use of this work, please see paragraphs 4.2 and 5 of our Terms.