Back to Journals » Diabetes, Metabolic Syndrome and Obesity » Volume 18
A Nomogram Incorporating Intracranial Atherosclerosis Score for Predicting Early Neurological Deterioration in Minor Stroke Patients With Type 2 Diabetes Mellitus
Authors Shang J, Zhang Z, Ma S, Peng H ![]() , Hou L, Yang F, Wang P
, Hou L, Yang F, Wang P
Received 26 September 2024
Accepted for publication 30 January 2025
Published 18 February 2025 Volume 2025:18 Pages 491—506
DOI https://doi.org/10.2147/DMSO.S494980
Checked for plagiarism Yes
Review by Single anonymous peer review
Peer reviewer comments 2
Editor who approved publication: Dr Rebecca Baqiyyah Conway
Jia Shang,1,2 Zehao Zhang,1 Shifang Ma,1 Hailong Peng,1 Lan Hou,1,3 Fan Yang,1 Pei Wang1,3
1Department of Neurology, Baoding No 1 Central Hospital, Baoding, People’s Republic of China; 2Graduate School of Hebei Medical University, Shijiazhuang,People’s Republic of China; 3Department of Neurology, Key Laboratory of Neurological Diseases, Baoding, People’s Republic of China
Correspondence: Pei Wang, Department of Neurology, Baoding No 1 Central Hospital, Baoding Great Wall North Street No. 320, Baoding, Hebei Province, 071000, People’s Republic of China, Email [email protected]
Purpose: Early neurological deterioration (END) frequently complicates acute ischemic stroke (AIS), worsening prognosis, particularly in patients with type 2 diabetes mellitus (T2DM), where hyperglycemia accelerates atherosclerosis, increasing both stroke risk and subsequent END. This study aimed to identify predictors of END in minor stroke patients with T2DM and develop a nomogram integrating these factors with intracranial atherosclerosis (ICAS) scores, evaluating its performance against various machine learning (ML) models.
Methods: We retrospectively analyzed clinical data from 473 minor stroke patients with T2DM treated at our hospital between January 2021 and December 2023. Utilizing LASSO and multivariate logistic regression, we identified characteristic predictors. The cohort was randomly allocated into training (n = 331) and validation (n = 142) groups. Six ML algorithms—SVM, LR, RF, CART, KNN, and Naive Bayes—were assessed, and nomograms were used to visualize the predictive model’s performance, evaluated via Area Under the Curve (AUC), calibration plot, and Decision Curve Analysis (DCA).
Results: The ICAS score has been recognized as a pivotal determinant of END, alongside four other significant factors: NIHSS score, low-density lipoprotein cholesterol (LDL-C) levels, presence of branch atheromatous disease (BAD), and stenosis of the responsible vessel ≥ 50%. The model demonstrated robust predictive capabilities, achieving strong performance in training (AUC = 0.795) and validation (AUC = 0.799) sets. This advanced ML model, which integrates biochemical and imaging indicators, enables accurate risk assessment for END in minor stroke patients with T2DM.
Conclusion: By integrating the ICAS score with the NIHSS score, LDL-C levels, presence of BAD, and stenosis of responsible vessels ≥ 50%, we developed a clinical model for predicting END in patients with minor stroke and T2DM. This model provides critical decision support for clinicians, facilitating early identification of high-risk patients, personalized treatment, and improved outcomes.
Keywords: early neurological deterioration, prediction model, type 2 diabetes mellitus, machine learning, nomograms
Introduction
Minor strokes constitute approximately one-third of ischemic cerebrovascular diseases. Although these strokes are typically associated with minor initial neurological deficits and are expected to recover swiftly, they often present with high rates of recurrence and substantial risks of disability.1,2 This risk is markedly amplified in patients with Type 2 Diabetes Mellitus (T2DM), which has been shown to significantly elevate stroke risk compared to non-diabetic individuals, with an adjusted hazard ratio (HR) of 2.27.3 The potential for early neurological deterioration (END) in this population is a pressing concern due to the intricate relationship between diabetes and cerebrovascular health, thereby complicating clinical decision-making.
Intracranial atherosclerosis (ICAS) represents a progressive pathological condition characterized by the gradual narrowing of intracranial arteries and consequent cerebral hypoperfusion. It is a major contributor to both the incidence and recurrence of stroke globally. Although the prevalence of symptomatic intracranial arterial stenosis is notably high, ranging between 20% and 53%,4 asymptomatic ICAS also presents a significant concern, with prevalence rates varying from 3.5% to 13%,5 particularly in Asian, African, and Hispanic populations.6,7 Due to variations in composition and metabolic processes, proliferative fibrotic lesions are more prevalent in intracranial atherosclerosis than lipid infiltration.8 Mechanistically, intracranial atherosclerosis causes more severe obstruction of collateral circulation compared to extracranial arteries, leading to impaired blood flow and reduced capacity for embolic clearance.9 Despite milder neurological deficits in patients with minor strokes, evidence indicates that those with intracranial atherosclerotic stenosis are at a higher risk of experiencing new, disabling strokes or early neurological deterioration (END) post-event, leading to significant disability.10 Furthermore, individuals with ICAS face markedly increased risks of recurrent ischemic events and mortality relative to other stroke subtypes. Thus, utilizing ICAS as a predictive marker for neurological deterioration in ischemic stroke is highly justified.
This study introduces a novel predictive model integrating the ICAS score with machine learning techniques to forecast END specifically in minor stroke patients with T2DM. By focusing on this distinct patient cohort, our research addresses a critical gap in current predictive methodologies. The incorporation of advanced machine learning algorithms offers a sophisticated approach to enhance prediction accuracy beyond traditional methods.
Our aim is to develop a nomogram that leverages the ICAS score alongside additional clinical predictors to provide personalized risk assessments. This model promises to facilitate targeted interventions and improve clinical outcomes for minor stroke patients with T2DM, contributing valuable insights to the field of stroke research.
Materials and Methods
Patient Selection
This retrospective analysis was undertaken at Baoding No 1 Central Hospital, spanning from January 1, 2021, to December 31, 2023. We incorporated participants who experienced minor strokes, with symptom onset occurring within 24 hours, and who were concurrently diagnosed with T2DM. Minor stroke was demarcated by a National Institutes of Health Stroke Scale (NIHSS) score ranging from 0 to 5.11 Given the milder condition, longer arrival times, and selective use of reperfusion therapy in patients with minor strokes, this study primarily focuses on those who did not receive reperfusion treatment. The exclusion criteria were rigorous and included: 1) individuals who underwent reperfusion therapies, encompassing thrombolysis, interventional procedures, or surgical interventions; 2) those with severe inflammatory conditions, renal insufficiency, trauma, infections, or immune disorders; 3) patients with incomplete medical records. Upon admission, all eligible patients underwent a comprehensive battery of neuroimaging studies, encompassing cranial computed tomography (CT), head magnetic resonance imaging (MRI), diffusion-weighted imaging (DWI), magnetic resonance angiography (MRA), transcranial Doppler (TCD) ultrasonography, and carotid duplex ultrasound evaluations.
Data Collection
Demographic and Clinical Data
Age, gender, diabetes duration, NIHSS score, a history of hypertension, prior stroke events, smoking and alcohol consumption habits, the time window of stroke onset, baseline systolic and diastolic blood pressure readings, TOAST classification, and the occurrence of early neurological deterioration.
Laboratory Investigations
Within the initial 24 hours of admission, an array of serological parameters were assayed, including fasting plasma glucose (FPG), homocysteine (HCY), glycosylated hemoglobin (HbA1C), hemoglobin (Hb), and a comprehensive blood count analysis (comprising white blood cell (WBC) count, platelet (PLT) count, neutrophil and lymphocyte counts). Furthermore, total cholesterol (TC), high-density lipoprotein cholesterol (HDL-C), low-density lipoprotein cholesterol (LDL-C), triglycerides (TG), urea nitrogen (BUN), serum creatinine (Scr), the urea nitrogen/creatinine ratio, albumin (ALB), fibrinogen, total bilirubin (TBIL), and plasma D-dimer levels were also assessed.
Composite Indices
The red blood cell distribution width to platelet ratio (RPR)(calculated as the red blood cell distribution width divided by the PLT count), the neutrophil-lymphocyte ratio (NLR) (calculated as the neutrophil count divided by the lymphocyte count), the triglyceride-glucose index (TyG) index (calculated as the natural logarithm of the product of TG and FPG), the atherogenic index of plasma (AIP) [calculated as log10 (TG / HDL-C)], the hemoglobin-albumin-lymphocyte-platelet inflammatory index (HALP) [computed as Hb * ALB * lymphocyte count / PLT count], the neutrophil to haemoglobin ratio (NHR) [neutrophil count / Hb], the platelet to lymphocyte ratio (PLR) [platelet count / lymphocyte count], the prognostic nutritional index (PNI) [ALB + 5 * lymphocyte count], and the Stress Glycaemic Hyperglycaemia Ratio (SHR) [calculated as the admission blood glucose level divided by ((1.59 * HbA1C) - 2.59)].
Data Processing for Analysis: To facilitate analysis, SHR was categorized into quartiles (Q1 < 0.68; 0.68 ≤ Q2 < 0.80; 0.80 ≤ Q3 < 0.94; Q4 ≥ 0.94). TyG index was categorized as T1 (<1.506), T2 (1.506 ≤ TyG < 2.126), and T3 (≥2.126). The AIP index was divided into T1 (<0.033), T2 (0.033 ≤ AIP < 0.278), and T3 (≥0.278). The HALP index was categorized as T1 (<36.960), T2 (36.960 ≤ HALP < 53.360), and T3 (≥53.360).
Imaging Assessment
The presence of responsible vessel stenosis was defined as a ≥50% reduction in the diameter of the vessel associated with the infarct lesion, as confirmed by carotid duplex ultrasound, TCD, or MRA. The Intracranial Atherosclerosis Score (ICAS) was determined based on the criteria established by Kim et al,12 taking into account the number and severity of stenosed and occluded cerebral arteries. Scores were assigned as follows: <50% stenosis = 0, 50–99% stenosis = 1, occlusion = 2. This scoring system was applied to intracranial arteries, including the middle cerebral artery, anterior cerebral artery, posterior cerebral artery, intracranial carotid artery, intracranial vertebral artery, and basilar artery. Each side was evaluated separately, and the total score was calculated to determine the ICAS. The definition of Branch atheromatous disease (BAD) relies on the observation of infarct lesions in transversal diffusion-weighted imaging (DWI) scans. These lesions must extend across at least three consecutive slices within LSA terminations or unilaterally involving the pons in connection with the cerebral surface of the ventral pons, without crossing the midline at the terminations of the paramedian pontine artery (PPA).13,14
Outcome Definition
END was characterized by the exacerbation of neurological deficit symptoms, manifesting as an increase of ≥2 points in the NIHSS score, or a ≥1 point increase in the level of consciousness or muscular strength category, or the emergence of new neurological injury symptoms within 7 days of admission.15 Between January 1, 2021, and December 31, 2023, the average length of stay (LOS) for minor stroke patients with type 2 diabetes was 8.16 days (Figure 1). The data were non-normally distributed, with an interquartile range of 7 to 9 days. Only 0.63% of patients (3 cases) were discharged within 7 days. Of these, two patients experienced early neurological deterioration and were subsequently transferred to other hospitals for further treatment, while one patient, who stayed for 6.5 days, was discharged against medical advice without experiencing early neurological deterioration. This group represented just 0.21% of the total sample. To assess the potential impact of these cases on the overall results, a sensitivity analysis was performed. The results showed that the regression coefficient for LOS remained nearly identical in both scenarios (coefficient = 0.424, p = 2.19e-06), indicating that the missing data had no significant effect on the model’s conclusions.
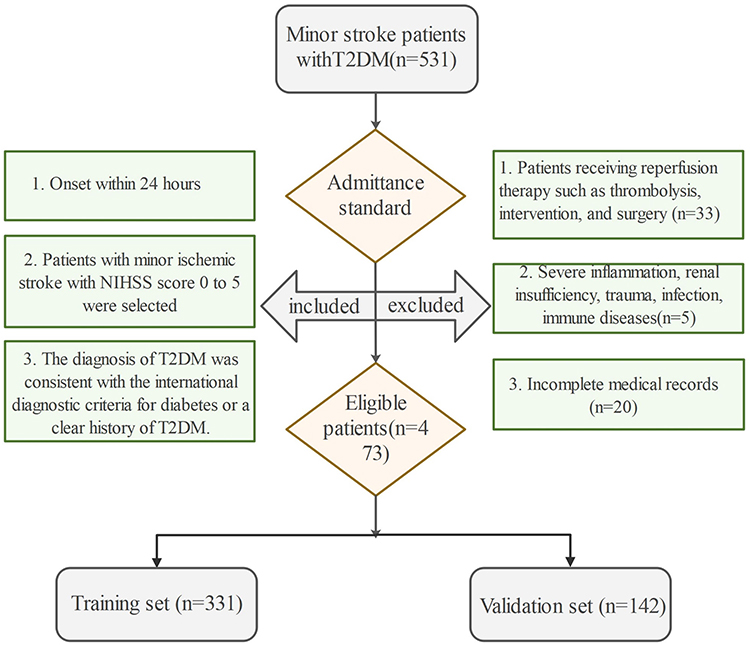 |
Figure 1 Flowchart of patient selection. Abbreviations: NIHSS, National Institutes of Health Scale; T2DM, Type 2 Diabetes Mellitus. |
Statistical Analysis
Statistical analyses were conducted utilizing R software version 4.4.0. Continuous variables that adhered to normal distribution were succinctly represented as mean (standard deviation) and were compared using the t-test. Conversely, continuous variables that deviated from normal distribution were expressed as median (interquartile ranges) and analyzed via the Wilcoxon rank sum test. Categorical variables, on the other hand, were presented as count (percentage) and were compared through the Chi-squared test. Statistical significance was assigned to a two-sided p-value of less than 0.05. To discern characteristic variables, both LASSO regression and multivariate logistic regression were employed. The patient cohort was randomly assigned to a training set (n = 331) and a validation set (n = 142) in a 7:3 ratio. An ensemble of six machine learning (ML) models, namely Support Vector Machine (SVM), Logistic Regression (LR), Random Forest (RF), Classification and Regression Tree (CART), K-Nearest-Neighbors (KNN), and Naive Bayes, were utilized to ascertain the optimal model predicated on the identified characteristic variables. Internal 10-fold cross-validation was implemented for refining model hyperparameters. The performance of the models was rigorously evaluated using the area under the Receiver Operating Characteristic (ROC) curve (AUC), calibration curves, and decision curve analysis (DCA).
Results
Patients’ Characteristics
As depicted in Figure 1, a cohort of 473 patients with minor stroke and T2DM was recruited between January 2021 and December 2023. The baseline demographics and clinical characteristics of this study population are outlined in Table 1. The cohort was stratified into a training set (n = 331) and a validation set (n = 142) via simple random sampling, adhering to a 7:3 ratio. Statistical analysis revealed no significant disparities in any of the included variables between the two groups (p>0.05), and the prevalence of END was comparable in both groups (27.46% versus 28.4%, P = 0.836), as depicted in Table 2.
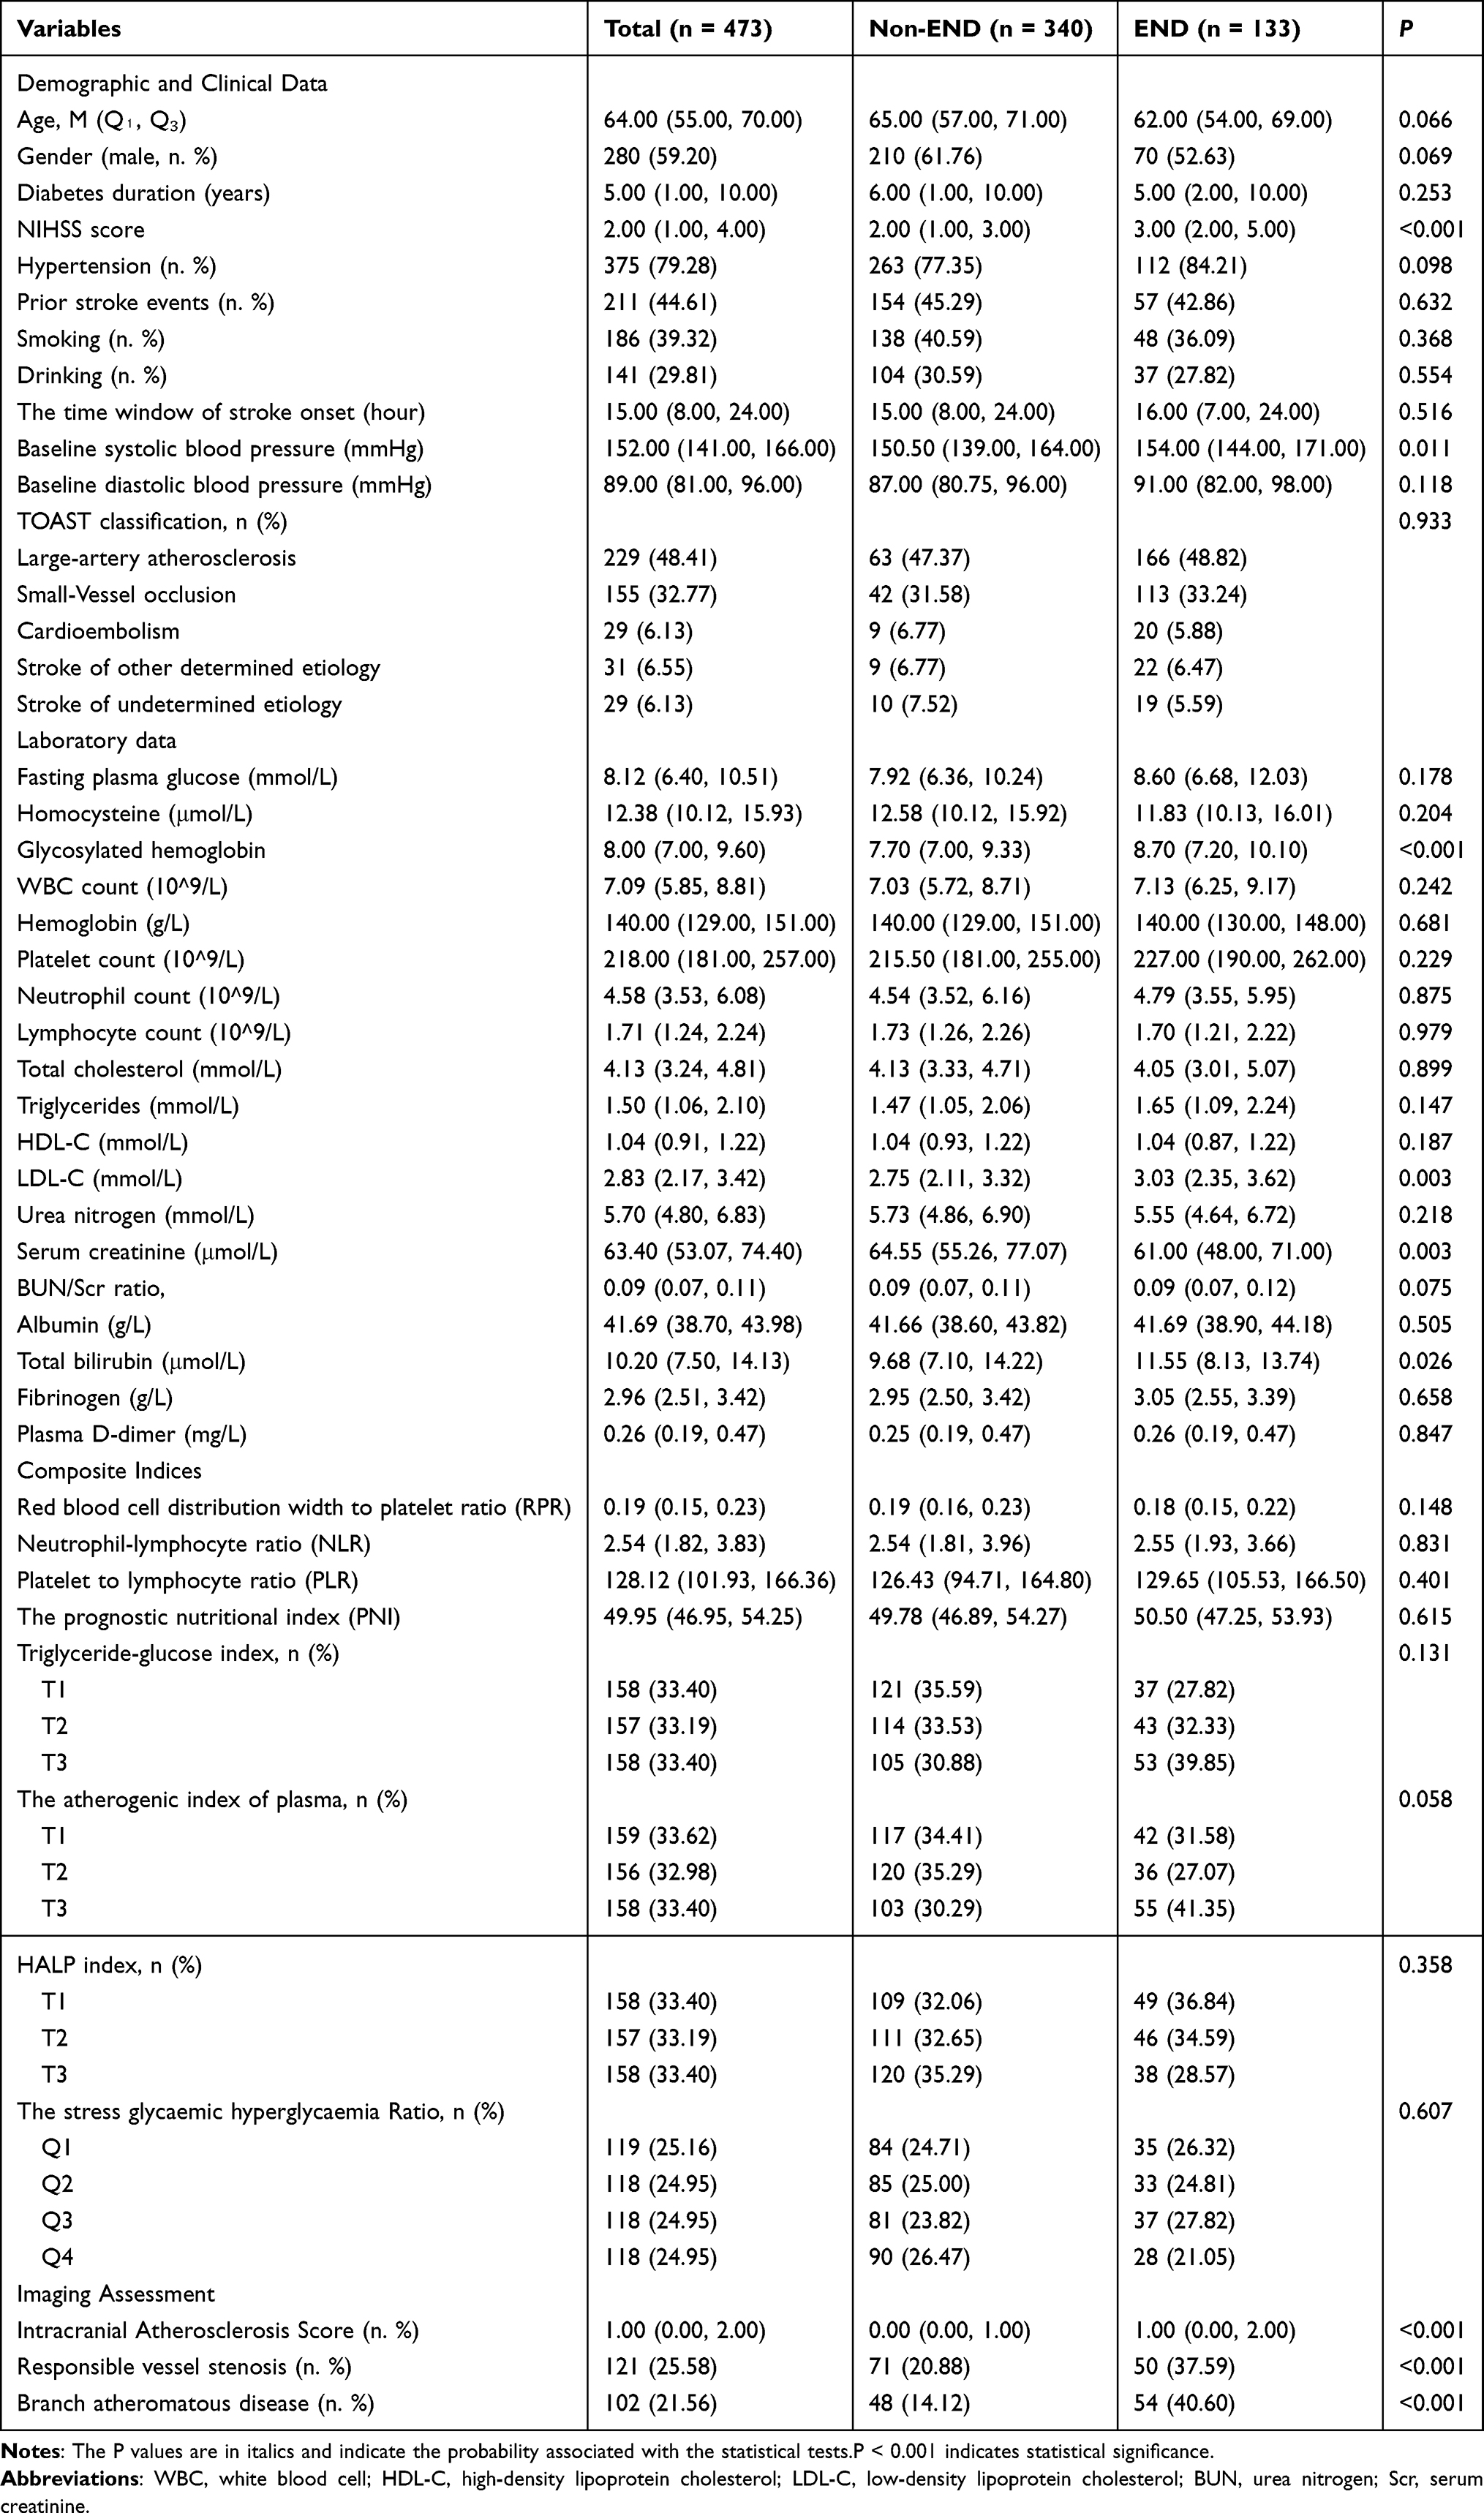 |
Table 1 Comparing Baseline Characteristics Between END and Non-END Groups in Patients |
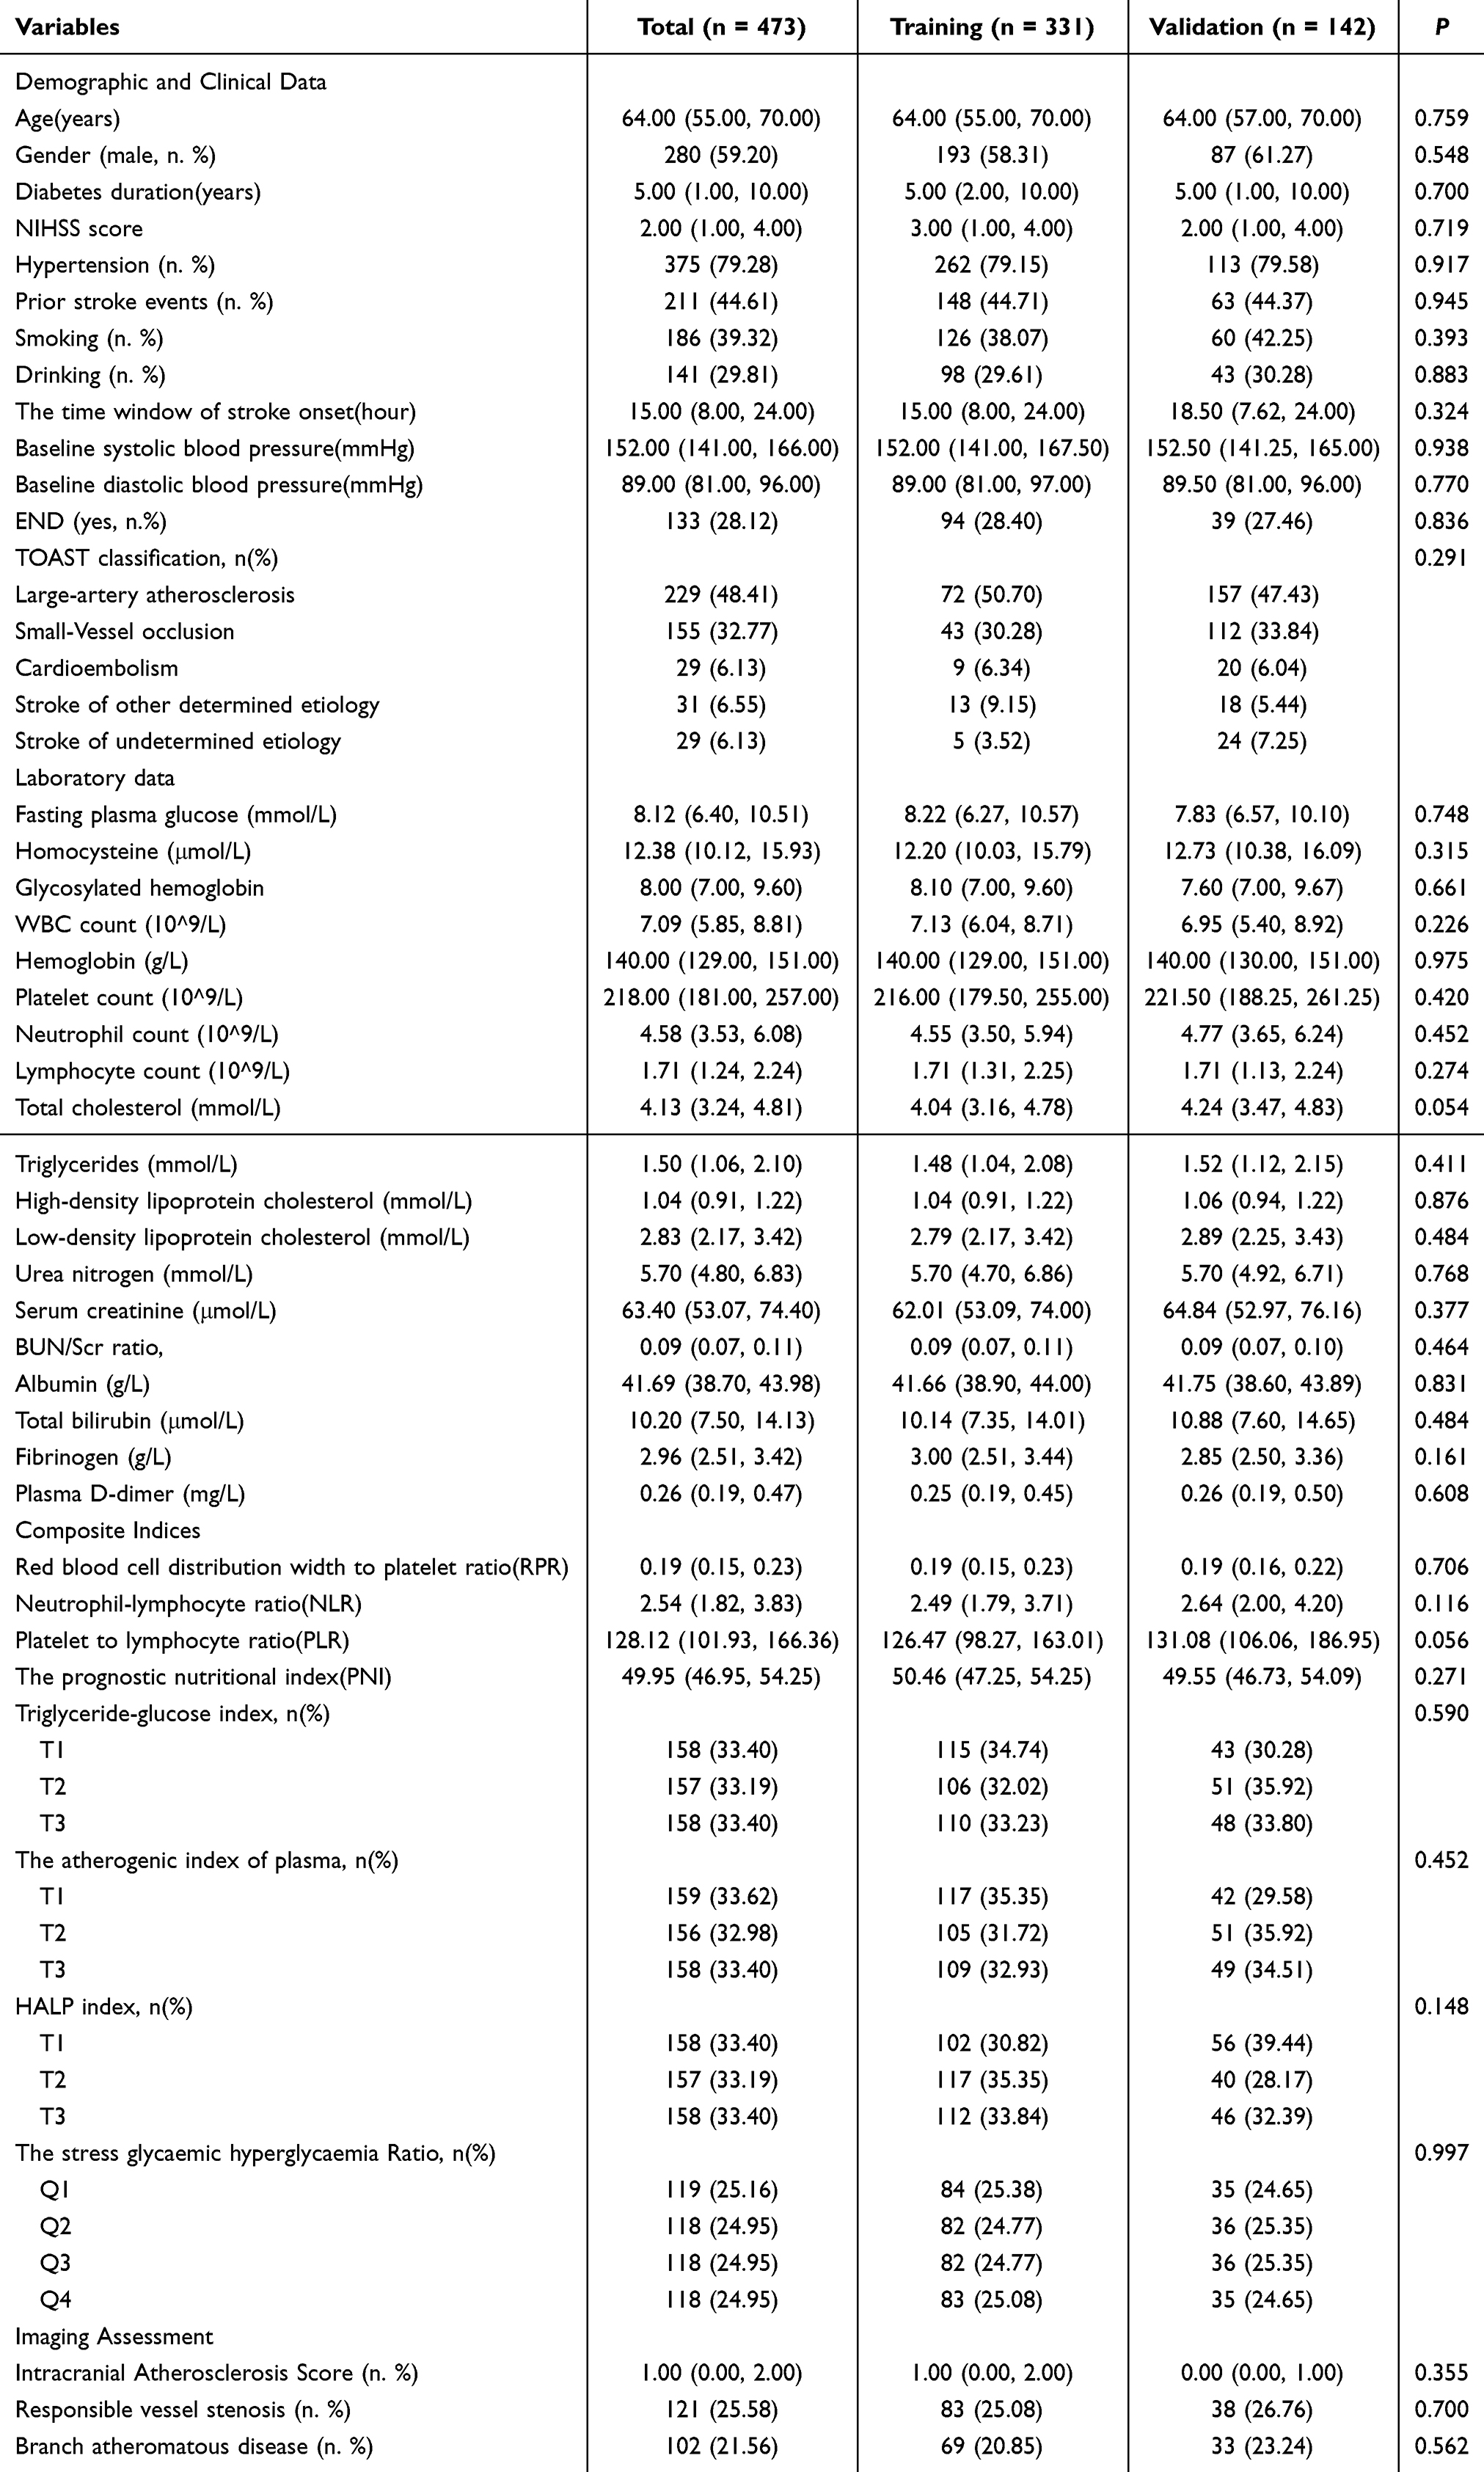 |
Table 2 Comparison of Clinical Data Between Training Set and Validation Set |
Identification of END Risk Factors in Minor Stroke Patients With T2DM
To mitigate the risks of overfitting and severe multicollinearity, a Least Absolute Shrinkage and Selection Operator (LASSO) regression analysis was performed on the all variables. The variation in the coefficients of these variables is visualized in Figure 2A. The optimal model, characterized by robust performance and minimal variable inclusion, was identified at a lambda.1se value of 0.0372 (Figure 2B). The variables selected through this LASSO analysis included the NIHSS score at admission, ICAS score, LDL-C level, presence of BAD, stenosis of the responsible vessel ≥50%, diabetes duration, HbA1c, Scr, and BUN/Scr Ratio. Utilizing these LASSO-selected variables, a refined multivariate logistic regression model was constructed (Table 3). Ultimately, the NIHSS score at admission, ICAS, LDL-C level, presence of BAD, and stenosis of the responsible vessel ≥50% emerged as characteristic factors predictive of END in this patient population.
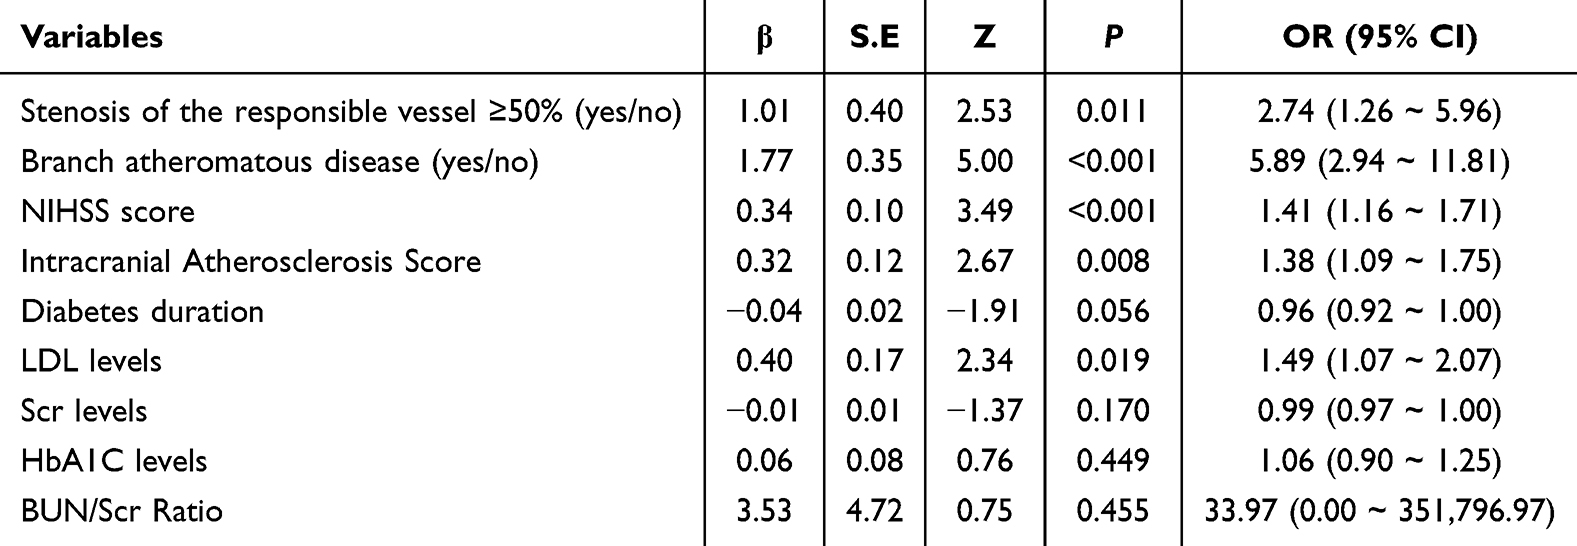 |
Table 3 Multivariate Logistic Regression |
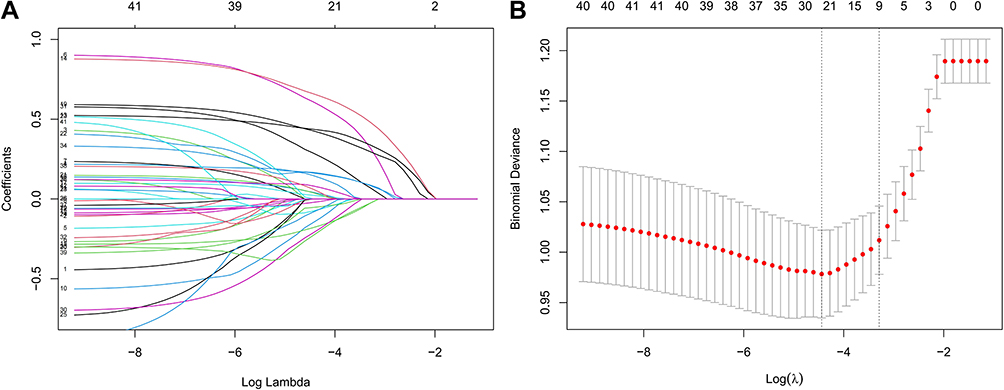 |
Figure 2 Feature selection using Lasso regression. (A) LASSO coefficient profiles: A plot showing the changes in regression coefficients for selected features across different values of the regularization parameter λ. (B) Cross-validation error plot: Variation in cross-validated errors for different λ values in Lasso regression. The vertical dashed line on the right indicates the optimal λ for the most simplified model, λ.1se=0.0372. |
Integrated Multi-Model Analysis
The ROC curves of six machine learning models, both in the training and validation sets, are depicted in Figure 3A and B. The outcomes indicated that KNN exhibited the superior performance in the training set, whereas Logistic Regression surpassed all other models in the validation set. Through a rigorous examination of model performance across both sets, methodologies such as KNN and Random Forests, which manifested pronounced overfitting, were eliminated. Logistic Regression emerged as the most viable option owing to its robustness and commendable generalization prowess. The clinical validity of the model was affirmed by DCA graphs (Figure 4A and B), and the calibration curve illustrated a harmonious alignment between predicted probabilities and actual occurrence rates (Hosmer-Lemeshow test yielded P-values of 0.602 and 0.251 for the training and validation sets respectively) (Figure 5A and B). Consequently, Logistic Regression was deemed the optimal model.
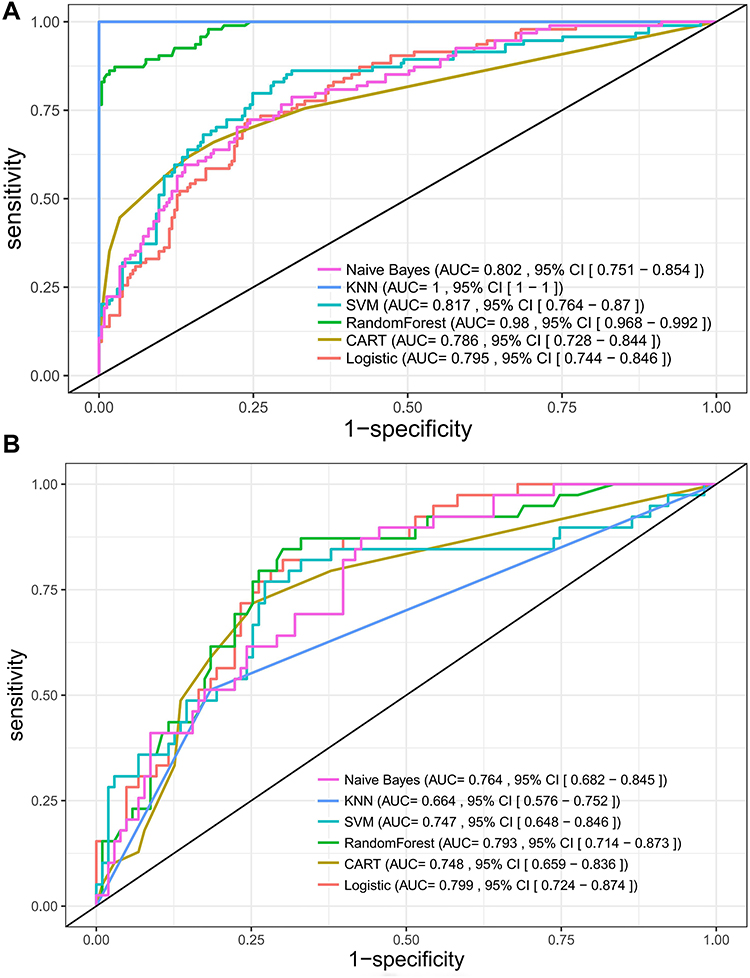 |
Figure 3 ROC curves for six machine learning models. (A) and (B) present ROC curves for the training and validation sets, respectively. |
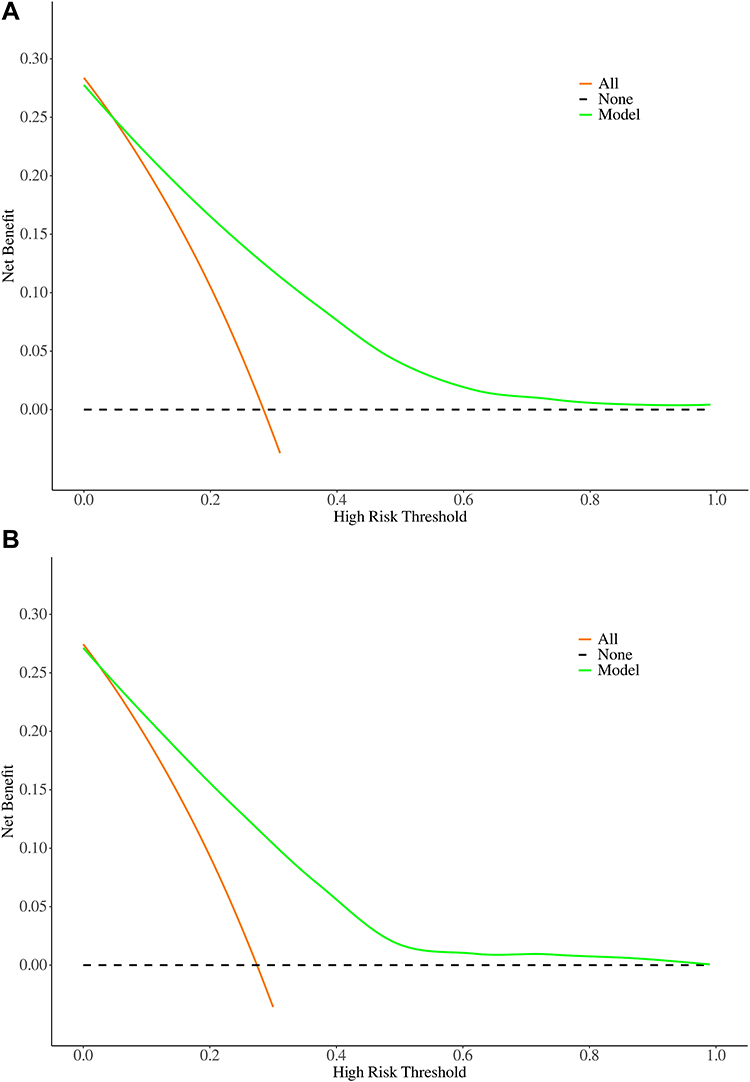 |
Figure 4 Decision curve analysis for predicting END in T2DM patients with minor stroke. (A) Training set and (B) validation set.X-axis: High Risk Threshold—The probability threshold used to decide whether to act. Y-axis: Net Benefit—The net benefit of using the model at different threshold probabilities.The dashed line denotes no action, Orange signifies that action will always be taken, and green illustrates the net benefit of employing the forecasting model. |
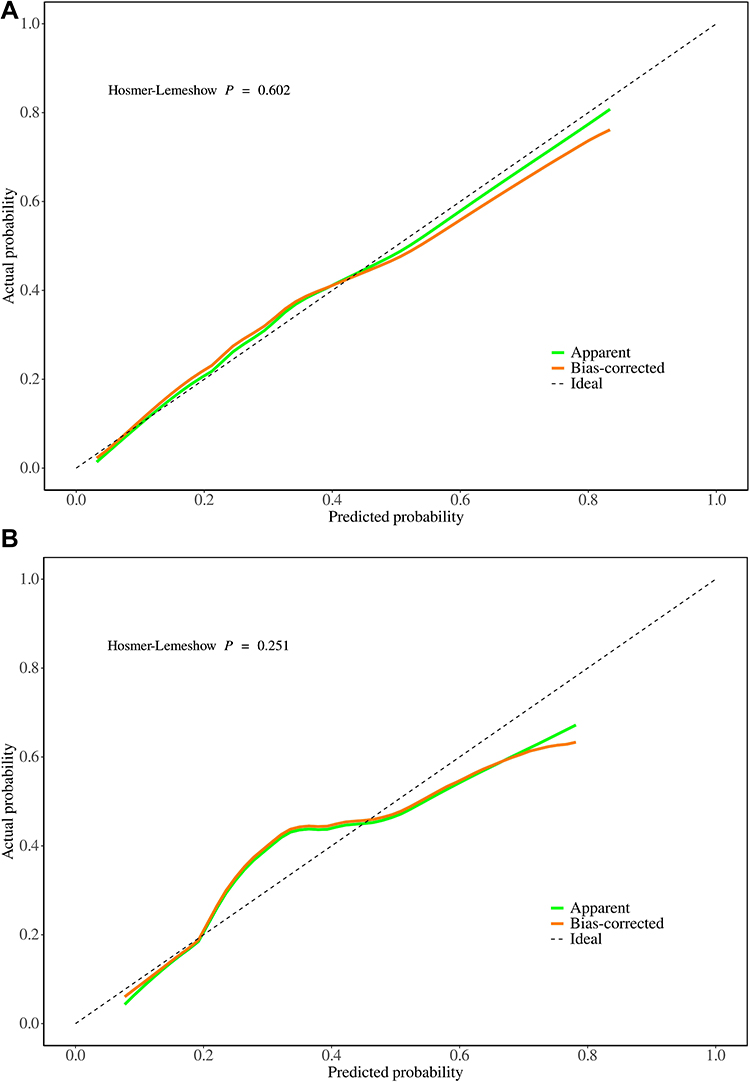 |
Figure 5 Calibration curves for the END prediction model. (A) Training set and (B) validation set.X-axis: Predicted Probability—The probability of END as predicted by the model. Y-axis: Actual Probability—The actual rate of END occurrence in the dataset. |
Assessment of Model Robustness
To evaluate the robustness of the model, we implemented a 10-fold cross-validation procedure on the training set (Figure 6). The results yielded an average Area Under the Curve (AUC) of 0.78, attesting to the model’s accuracy and reliability.
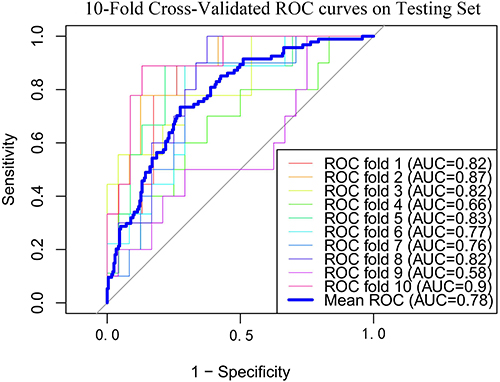 |
Figure 6 10-fold cross-validation results using the logistic regression model on training set. |
Model Presentation
The prediction model was constructed utilizing logistic regression, and its outcomes were visually portrayed through the utilization of a nomogram. To showcase the model’s applicability in a real-world setting, a case study was integrated into the nomogram (Figure 7). Specifically, a patient with an NIHSS score of 3 upon admission, a low-density lipoprotein level of 1.5 mmol/L, a nil intracranial atherosclerosis score, absence of branch atheromatous disease, and responsible vessel stenosis below 50% was evaluated, yielding a total score of 149. This score corresponded to a remarkably low likelihood of early neurological deterioration, amounting to 0.0754. To assess the model’s efficacy, an array of metrics, encompassing AUC, accuracy, sensitivity, specificity, positive predictive value (PPV), and negative predictive value (NPV), were employed for both the training and validation datasets, as detailed in Table 4.
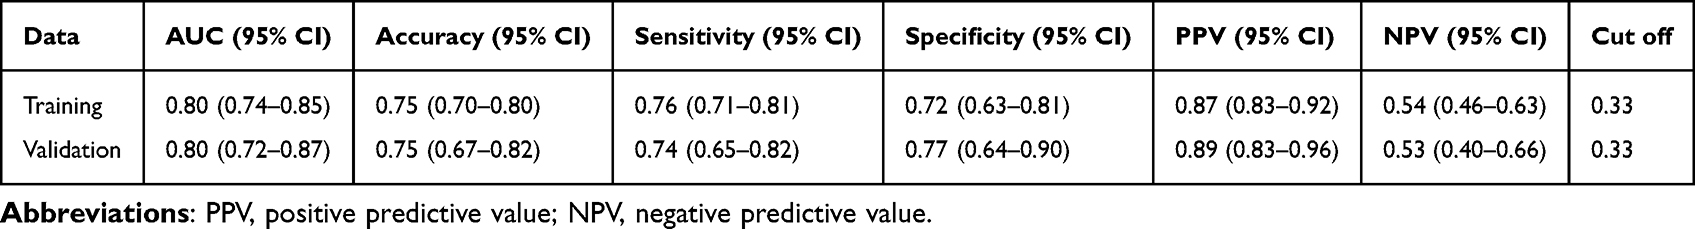 |
Table 4 Performance of the Model |
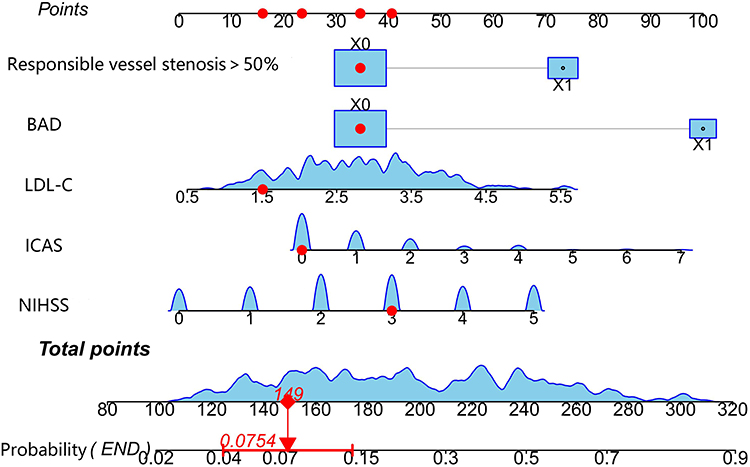 |
Figure 7 Nomogram for predicting END in minor stroke patients with T2DM. A case study demonstrates the model’s application: a patient with an NIHSS score of 3, LDL-C level of 1.5 mmol/L, no ICAS score, absence of BAD, and responsible vessel stenosis below 50% had a total score of 149, indicating a low END probability of 0.0754. |
Discussion
There is a well-established association between renal dysfunction and cerebrovascular disease,16 with serum creatinine levels serving as a crucial biomarker for renal impairment. Typically, elevated Scr levels correlate positively with an augmented risk and severity of stroke.12 Nevertheless, our study revealed an intriguing contrast, as baseline Scr levels were markedly lower in the END group compared to the non-END group, contradicting conventional expectations. Following a rigorous data quality assessment, we confirmed the absence of significant measurement inaccuracies. We postulate that this observed decline in Scr may be attributable to post-stroke alterations in physiological status, particularly fluid imbalances.17 Post-stroke complications such as diminished consciousness, communication challenges, dysphagia, and reduced oral intake may elevate plasma osmolality, precipitating dehydration and fluid depletion.18 This cascade of events could exacerbate brain ischemia and deteriorate neurological outcomes among stroke patients, necessitating further investigation.
In our study, despite amassing an array of biomarkers potentially correlated with neurological deterioration—encompassing RPR, NLR, TyG, AIP, HALP, NHR, PLR, PNI, and SHR—none exhibited a substantial predictive capacity for END in minor stroke patients afflicted with T2DM. Consequently, these biomarkers were omitted from the definitive model. While biomarkers like NLR, PLR, HALP, RPR, and NHR signify systemic inflammation and have been implicated in adverse stroke outcomes and END across diverse investigations,19–22 they failed to distinctly stratify the risk of END in our research. Likewise, AIP, a lipid abnormality marker frequently associated with coronary heart disease and atherosclerosis, has demonstrated a connection with END in prior studies.23 The TyG index, routinely employed to gauge insulin resistance, and PNI, mirroring overall nutritional status, have also been linked to END.24,25 SHR, which quantifies the severity of stress hyperglycemia, has been established as a pertinent indicator.26 Nevertheless, the absence of noteworthy predictive efficacy for these biomarkers in our study might be ascribed to the muted alterations observed in this particular cohort of patients with minor stroke and T2DM, in contrast to more severe pathological presentations. This underscores the need for further exploration to uncover alternative potential biomarkers or composite indices that could more accurately forecast the risk of neurological deterioration in this patient demographic.
The concomitance of diabetes mellitus and stroke is escalating annually, underpinned by potential mechanisms encompassing vascular endothelial dysfunction stemming, premature arterial stiffening, systemic inflammation, and capillary basement membrane thickening.27The concomitance of diabetes mellitusThese factors conspire to initiate and exacerbate stroke, with patients diagnosed with type 2 diabetes mellitus (T2DM) experiencing poorer post-stroke clinical outcomes, exemplified by heightened mortality rates, increased rehospitalizations and complications, prolonged hospital stays.28–30
Our study identified the NIHSS score, ICAS score, LDL-C levels, presence of BAD, and responsible vessel stenosis ≥50% as independent predictors of END. Utilizing these variables, we devised a predictive nomogram tailored to T2DM patients with minor stroke, aimed at facilitating early identification of high-risk individuals, expeditious decision-making, and the formulation of preventive measures. The subsequent discourse delves into the significance of these indicators in relation to END:
NIHSS Score Upon Admission
The NIHSS serves as a universally acknowledged standardized instrument for evaluating the clinical acuity of stroke cases. Concurrent predictive models for END in acute ischemic stroke patients have consistently identified the NIHSS score as a pivotal variable.31–33 Recent investigations into patients with lacunar infarcts have underscored the significance of an elevated initial NIHSS score, which is markedly correlated with END and unfavorable outcomes at discharge,32 echoing the findings of our current study.
Responsible Vessel Stenosis≥50% and ICAS
Atherosclerotic stroke represents a prominent cause of stroke among Asian, African, and Hispanic populations.6 Intracranial atherosclerosis can more severely impede collateral circulation than extracranial stenosis, contributing to blood flow stagnation and diminished embolus clearance.9 The CICAS study in China revealed that intracranial atherosclerosis of large arteries is the most prevalent vascular lesion in Chinese cerebrovascular patients, who experience more severe strokes, elevated NIHSS scores, and prolonged hospital stays compared to those without intracranial stenosis.7 Our study reinforces this perspective, demonstrating that the ICAS score, which quantitatively assesses intracranial atherosclerosis, and the criterion of “Responsible vessel stenosis ≥50%” for evaluating stenosis in the lesion-related major vessel, are crucial risk factors for END. Other Studies have established a higher prevalence of intracranial atherosclerosis in individuals with diabetes and metabolic syndrome.34 Intriguingly, related research suggests that the severity of intracranial atherosclerosis is not correlated with serum glucose levels or HbA1c,35 aligning with our findings regarding END in patients with type 2 diabetes and minor strokes. This may elucidate why intensive insulin therapy for post-stroke hyperglycemia neither reduces stroke mortality nor improves functional outcomes, but instead heightens the risk of hypoglycemia.36,37
In spite of the moderate clinical presentations observed in minor strokes and transient ischemic attacks (TIA), a notable proportion of patients suffering from intracranial atherosclerotic stenosis may experience novel, disabling strokes or END subsequent to these events, resulting in profound disability.10 An earlier Korean investigation categorized END into ischemic progression, symptomatic hemorrhage, and cerebral edema, pinpointing ischemic progression as the primary contributor to END following thrombolysis. Additionally, it highlighted that large artery intracranial atherosclerosis serves as an independent predictor of END by ischemic progression within 24 hours, consonant with our observations.38 The ICAS score, which quantifies atherosclerosis according to the stenosis severity, demonstrates a robust correlation with END. Elevated ICAS scores are associated with a heightened risk of END. Recent research frequently emphasizes the link between ICAS and stroke in patients who have undergone coronary artery bypass grafting (CABG).39 One study revealed a 1.3-fold augmentation in stroke risk for every 1-point increment in the atherosclerosis score.40
Low-Density Lipoprotein Cholesterol
Elevated levels of LDL-C, a subtype of hyperlipidemia, constitute a prominent risk factor for cerebral infarction. Our research underscores a robust association between heightened LDL-C concentrations and END in minor stroke patients with T2DM. The WORSEN score, incorporating LDL as a pivotal parameter, is prevalently employed to predict END, corroborating our findings. Extensive literature underscores the predictive value of the WORSEN score.40,41 Studies on END in acute ischemic stroke underscore that elevated LDL identifies a high-risk cohort that may benefit from intensified surveillance and therapeutic interventions.42 Furthermore, a machine learning model for predicting END in penetrating artery infarction (PAI) also aligns LDL with END, mirroring our results. Notably, this study observed a heightened incidence of END in patients with branch atheromatous disease (BAD), a finding that is congruent with our research.43 Additionally, high LDL levels emerge as an independent predictor of aspirin resistance, which, along with clopidogrel resistance, is associated with END.44 These discoveries augment our comprehension of the mechanisms underlying dyslipidemia’s contribution to END.
Branch Atheromatous Disease
As elucidated by Caplan,45 BAD represents a prevalent subtype of acute ischemic stroke, accounting for approximately 10–15% of all cases. It is distinct from large-artery atherosclerotic stroke and is characterized by an early symptomatic progression,14 with END occurring in 17–75% of patients, often leading to unfavorable clinical outcomes.46 Contemporary research has identified a correlation between increased middle cerebral artery tortuosity, elevated NIHSS scores, and END in BAD patients.47 Currently, there is no definitive treatment for BAD. Intravenous thrombolysis (IVT) appears to be considered the optimal option for eligible patients within the therapeutic time window, however, studies have shown that IVT does not prevent neurological deterioration48 and may even be associated with symptom recurrence.49 Tirofiban or argatroban in combination with dual antiplatelet therapy may be explored in BAD patients.50 Notably, a recent single-center retrospective study in China reported that PCSK9 inhibitors in conjunction with statins significantly reduced the incidence of END in BAD patients.51
Currently, several methodologies exist for prognosticating early neurological deterioration (END), including those that concentrate on ischemic stroke cohorts post-thrombolysis52 and those investigating non-reperfusion therapeutic strategies for ischemic stroke.53 However, these studies frequently encompass a broad spectrum of stroke patients, potentially introducing confounding variables stemming from varying severities, thereby diminishing their applicability. Conversely, our model is expressly tailored to anticipate END in individuals experiencing minor stroke and Type 2 Diabetes Mellitus (T2DM), pinpointing distinct features and bridging a gap in extant research. Our predictive framework integrates laboratory assays, demographic attributes, imaging modalities, and composite indices. In contrast to models that concentrate on a constrained array of biochemical markers and underscore inflammatory cell proportions,31 our multifaceted variable selection and sophisticated machine learning techniques substantially elevate predictive precision and clinical applicability. Notably, while grounded in single-center retrospective data, this approach facilitates an in-depth examination of specific demographic characteristics, with future multi-institutional studies anticipated to further substantiate the model’s universal applicability.
This investigation is not devoid of constraints. Firstly, the modest sample size, derived from a single establishment, restricts the extensibility of our findings. Additionally, internal validation alone was undertaken, necessitating external validation to fortify the robustness of our machine learning paradigm. Lastly, owing to the retrospective nature of the study, certain variables, including glycemic variability, were omitted, which may have introduced selection prejudices. Consequently, multi-center investigations with enlarged sample sizes are imperative to corroborate our observations.
Conclusion
Logistic regression models were developed using predictive factors such as NIHSS at admission, ICAS score, LDL-C levels, presence of BAD, and stenosis of the responsible vessel ≥50%. These models offer a robust framework for identifying high-risk individuals with minor stroke and T2DM, facilitating personalized interventions. By leveraging these predictive markers, clinicians can more effectively stratify patients at risk for early neurological deterioration (END), thereby guiding targeted treatment strategies. Interventions, including optimizing LDL-C, managing BAD, and monitoring vessel stenosis, can reduce the risk of END and improve patient outcomes.
Ethics Approval
This study followed the principles of the Declaration of Helsinki and was approved by the Ethics Committee of Baoding No 1 Central Hospital ([2023]039). Informed consent was waived because the study was a retrospective analysis and the data of all participants were anonymized.
Acknowledgments
We would like to thank the researchers and study participants for their contributions.
Disclosure
The authors declare no conflict of interest.
References
1. Nedeltchev K, Schwegler B, Haefeli T, et al. Outcome of stroke with mild or rapidly improving symptoms. Stroke. 2007;38:2531–2535. doi:10.1161/STROKEAHA.107.482554
2. Tan S, Choi PMC. Mild in name but not in nature. Stroke. 2021;52:2005–2006. doi:10.1161/STROKEAHA.121.035003
3. Sarwar N, Gao P, Emerging Risk Factors Collaboration. Diabetes mellitus, fasting blood glucose concentration, and risk of vascular disease: a collaborative meta-analysis of 102 prospective studies. Lancet. 375;2010:2215–2222. doi:10.1016/S0140-6736(10)60484-9
4. Mazighi M, Labreuche J, Gongora-Rivera F, et al. Autopsy prevalence of intracranial atherosclerosis in patients with fatal stroke. Stroke. 2008;39:1142–1147. doi:10.1161/STROKEAHA.107.496513
5. Suri MFK, Johnston SC. Epidemiology of intracranial stenosis. J Neuroimaging. 2009;19 Suppl: 11S–6S.
6. Wong LKS. Global burden of intracranial atherosclerosis. Int J Stroke. 2006;1:158–159. doi:10.1111/j.1747-4949.2006.00045.x
7. Wang Y, Zhao X, Liu L, et al. Prevalence and outcomes of symptomatic intracranial large artery stenoses and occlusions in China: the Chinese Intracranial Atherosclerosis (CICAS) Study. Stroke. 2014;45:663–669. doi:10.1161/STROKEAHA.113.003508
8. Wang Y, Meng R, Liu G, et al. Intracranial atherosclerotic disease. Neurobiol Dis. 2019;124:118–132. doi:10.1016/j.nbd.2018.11.008
9. Lee SJ, Lee DG, Lim DS, et al. Impact of intracranial atherosclerotic stenosis on the prognosis in acute ischemic stroke patients with cardioembolic source. Eur Neurol. 2015;73:271–277. doi:10.1159/000381336
10. Kim JT, Kim HJ, Yoo SH, et al. MRI findings may predict early neurologic deterioration in acute minor stroke or transient ischemic attack due to intracranial atherosclerosis. Eur Neurol. 2010;64:95–100. doi:10.1159/000315138
11. Seners P, Ben Hassen W, Lapergue B, et al. Prediction of early neurological deterioration in individuals with minor stroke and large vessel occlusion intended for intravenous thrombolysis alone. JAMA Neurol. 2021;78:1–9. doi:10.1001/jamaneurol.2021.2135
12. Kim HJ, Lee EJ, Jung SH, et al. Cerebral atherosclerosis and early ischemic stroke after left-sided valve replacement surgery. J Thorac Cardiovasc Surg. 2022;163:967–976.e6. doi:10.1016/j.jtcvs.2020.05.002
13. Adachi T, Takagi M. The clinical differences between lacunar infarction and branch atheromatous disease. Nihon Rinsho. 2006;64 Suppl 8:155–159.
14. Petrone L, Nannoni S, Del Bene A, et al. Branch atheromatous disease: a clinically meaningful, yet unproven concept. Cerebrovasc Dis. 2016;41:87–95. doi:10.1159/000442577
15. Li H, Dai Y, Wu H, et al. Predictors of early neurologic deterioration in acute pontine infarction. Stroke. 2020;51:637–640. doi:10.1161/STROKEAHA.119.027239
16. Sarnak MJ, Levey AS, Schoolwerth AC, et al. Kidney disease as a risk factor for development of cardiovascular disease: a statement from the American heart association councils on kidney in cardiovascular disease, high blood pressure research, clinical cardiology, and epidemiology and prevention. Hypertension. 2003;42:1050–1065. doi:10.1161/01.HYP.0000102971.85504.7c
17. Bhatia K, Mohanty S, Tripathi BK, et al. Predictors of early neurological deterioration in patients with acute ischaemic stroke with special reference to blood urea nitrogen (BUN)/creatinine ratio & urine specific gravity. Indian J Med Res. 2015;141:299–307. doi:10.4103/0971-5916.156564
18. Rodriguez GJ, Cordina SM, Vazquez G, et al. The hydration influence on the risk of stroke (THIRST) study. Neurocrit Care. 2009;10:187–194. doi:10.1007/s12028-008-9169-5
19. Gong P, Liu Y, Gong Y, et al. The association of neutrophil to lymphocyte ratio, platelet to lymphocyte ratio, and lymphocyte to monocyte ratio with post-thrombolysis early neurological outcomes in patients with acute ischemic stroke. J Neuroinflamm. 2021;18:51. doi:10.1186/s12974-021-02090-6
20. Wang J, Zhang X, Tian J, et al. Predictive values of systemic inflammatory responses index in early neurological deterioration in patients with acute ischemic stroke. J Integr Neurosci. 2022;21:94. doi:10.31083/j.jin2103094
21. Tian M, Li Y, Wang X, et al. The hemoglobin, albumin, lymphocyte, and platelet (HALP) score is associated with poor outcome of acute ischemic stroke. Front Neurol. 2020;11:610318. doi:10.3389/fneur.2020.610318
22. Jiang M, Shen J, Muhammad B, et al. Red blood cell distribution width to platelet ratio predicts early neurological deterioration in acute ischemic stroke patients receiving intravenous thrombolysis. J Stroke Cerebrovasc Dis. 2023;32:107146. doi:10.1016/j.jstrokecerebrovasdis.2023.107146
23. Wang Q, Jiang G, Yan L, et al. Association of atherogenic index of plasma with early neurological deterioration in patients with acute ischemic stroke. Clin Neurol Neurosurg. 2023;234:108014. doi:10.1016/j.clineuro.2023.108014
24. Zhang B, Lei H, Ambler G. Association between triglyceride-glucose index and early neurological outcomes after thrombolysis in patients with acute ischemic stroke. J Clin Med. 2023;12(10):3471. doi:10.3390/jcm12103471
25. Bao Y, Zhang Y, Du C, et al. Malnutrition and the risk of early neurological deterioration in elderly patients with acute ischemic stroke. Neuropsychiatr Dis Treat. 2022;18:1779–1787. doi:10.2147/NDT.S366851
26. Liu H, Yao Y, Zhang K, et al. Stress hyperglycemia predicts early neurological deterioration and poor outcomes in patients with single subcortical infarct. Diabet Res Clin Pract. 2023;200:110689. doi:10.1016/j.diabres.2023.110689
27. Ogata T, Yasaka M, Wakugawa Y, et al. Predisposing factors for acute deterioration of minor ischemic stroke. J Neurol Sci. 2009;287(1–2):147–150. doi:10.1016/j.jns.2009.08.006
28. Lei C, Wu B, Liu M, Chen Y. Association between hemoglobin A₁C levels and clinical outcome in ischemic stroke patients with or without diabetes. J Clin Neurosci. 2015;22:498–503. doi:10.1016/j.jocn.2014.08.030
29. Eriksson M, Carlberg B, Eliasson M. The disparity in long-term survival after a first stroke in patients with and without diabetes persists: the Northern Sweden MONICA study. Cerebrovasc Dis. 2012;34:153–160. doi:10.1159/000339763
30. Li HW, Yang MC, Chung KP. Predictors for readmission of acute ischemic stroke in Taiwan. J Formos Med Assoc. 2011;110:627–633. doi:10.1016/j.jfma.2011.08.004
31. Yang H, Lv Z, Wang W, Wang Y, Chen J, Wang Z. Machine learning models for predicting early neurological deterioration and risk classification of acute ischemic stroke. Clin Appl Thromb Hemost. 2023;29:10760296231221738. doi:10.1177/10760296231221738
32. Luo B, Yuan M, Kuang W, et al. A novel nomogram predicting early neurological deterioration after intravenous thrombolysis for acute ischemic stroke. Heliyon. 2024; 10:e23341.
33. Lyu Z, Yang H, Wang Y, et al. Establishment and evaluation of a predictive model for early neurological deterioration after intravenous thrombolysis in acute ischemic stroke based on machine learning. Zhonghua Wei Zhong Bing Ji Jiu Yi Xue. 2023;35:945–950. doi:10.3760/cma.j.cn121430-20230601-00413
34. López-Cancio E, Galán A, Dorado L, et al. Biological signatures of asymptomatic extra- and intracranial atherosclerosis: the Barcelona-Asia (Asymptomatic Intracranial Atherosclerosis) study. Stroke. 2012;43:2712–2719. doi:10.1161/STROKEAHA.112.661702
35. Thomas GN, Lin JW, Lam WWM, et al. Increasing severity of cardiovascular risk factors with increasing middle cerebral artery stenotic involvement in type 2 diabetic Chinese patients with asymptomatic cerebrovascular disease. Diabetes Care. 2004;27:1121–1126. doi:10.2337/diacare.27.5.1121
36. McCormick M, Hadley D, McLean JR, et al. Randomized, controlled trial of insulin for acute poststroke hyperglycemia. Ann Neurol. 2010;67:570–578. doi:10.1002/ana.21983
37. Kreisel SH, Berschin UM, Hammes H-P. Pragmatic management of hyperglycaemia in acute ischaemic stroke: safety and feasibility of intensive intravenous insulin treatment. Cerebrovasc Dis. 2009;27:167–175. doi:10.1159/000185608
38. Kim JM, Moon J, Ahn SW, et al. The etiologies of early neurological deterioration after thrombolysis and risk factors of ischemia progression. J Stroke Cerebrovasc Dis. 2016;25:383–388. doi:10.1016/j.jstrokecerebrovasdis.2015.10.010
39. Lee EJ, Chung CH, Choi KH, et al. The impact of cerebral atherosclerosis according to location on prognosis after coronary artery bypass grafting. Cerebrovasc Dis. 2018;46:200–209. doi:10.1159/000494502
40. Lee EJ, Choi KH, Ryu JS, et al. Stroke risk after coronary artery bypass graft surgery and extent of cerebral artery atherosclerosis. J Am Coll Cardiol. 2011;57:1811–1818. doi:10.1016/j.jacc.2010.12.026
41. Miyamoto N, Tanaka R, Ueno Y, et al. Analysis of the usefulness of the WORSEN score for predicting the deterioration of acute ischemic stroke. J Stroke Cerebrovasc Dis. 2017;26:2834–2839. doi:10.1016/j.jstrokecerebrovasdis.2017.07.005
42. Miyamoto N, Tanaka Y, Ueno Y, et al. Demographic, clinical, and radiologic predictors of neurologic deterioration in patients with acute ischemic stroke. J Stroke Cerebrovasc Dis. 2013;22:205–210. doi:10.1016/j.jstrokecerebrovasdis.2011.07.018
43. Sun S, Wang Y, Wang Y, et al. Lipid and hyperglycemia factors in first-ever penetrating artery infarction, a comparison between different subtypes. Brain Behav. 2017; 7:e00694.
44. Yi X, Wang C, Liu P, et al. Antiplatelet drug resistance is associated with early neurological deterioration in acute minor ischemic stroke in the Chinese population. J Neurol. 2016;263(8):1612–1619. doi:10.1007/s00415-016-8181-5
45. Caplan LR. Intracranial branch atheromatous disease: a neglected, understudied, and underused concept. Neurology. 1989;39:1246–1250. doi:10.1212/WNL.39.9.1246
46. Huang YC, Lee JD, Weng HH, et al. Statin and dual antiplatelet therapy for the prevention of early neurological deterioration and recurrent stroke in branch atheromatous disease: a protocol for a prospective single-arm study using a historical control for comparison. BMJ Open. 2021; 11:e054381.
47. Ha SH, Jeong S, Park JY. Association between arterial tortuosity and early neurological deterioration in lenticulostriate artery infarction. Sci Rep. 2023;13(1):19865. doi:10.1038/s41598-023-47281-8
48. Park MG, Oh EH, Kim BK, et al. Intravenous tissue plasminogen activator in acute branch atheromatous disease: does it prevent early neurological deterioration? J Clin Neurosci. 2016;33:194–197. doi:10.1016/j.jocn.2016.04.011
49. Deguchi I, Hayashi T, Kato Y, et al. Treatment outcomes of tissue plasminogen activator infusion for branch atheromatous disease. J Stroke Cerebrovasc Dis. 2013;22:e168–172. doi:10.1016/j.jstrokecerebrovasdis.2012.10.012
50. Kamo H, Miyamoto N, Otani H, et al. The importance of combined antithrombotic treatment for capsular warning syndrome. J Stroke Cerebrovasc Dis. 2018;27:3095–3099. doi:10.1016/j.jstrokecerebrovasdis.2018.06.038
51. Zhu LL, Fu SS, Qin HQ, et al. Effect of PCSK9 inhibitors on early neurological deterioration in patients with branch atheromatous disease. Zhonghua Yi Xue Za Zhi. 2023;103:2940–2946. doi:10.3760/cma.j.cn112137-20230525-00856
52. Jin M, Peng Q, Wang Y. Post-thrombolysis early neurological deterioration occurs with or without hemorrhagic transformation in acute cerebral infarction: risk factors, prediction model and prognosis. Heliyon. 2023;9:e15620. doi:10.1016/j.heliyon.2023.e15620
53. Xie X, Xiao J, Wang Y. Predictive model of early neurological deterioration in patients with acute ischemic stroke: a retrospective cohort study. J Stroke Cerebrovasc Dis. 2021;30(3):105459. doi:10.1016/j.jstrokecerebrovasdis.2020.105459
 © 2025 The Author(s). This work is published and licensed by Dove Medical Press Limited. The
full terms of this license are available at https://www.dovepress.com/terms
and incorporate the Creative Commons Attribution
- Non Commercial (unported, 3.0) License.
By accessing the work you hereby accept the Terms. Non-commercial uses of the work are permitted
without any further permission from Dove Medical Press Limited, provided the work is properly
attributed. For permission for commercial use of this work, please see paragraphs 4.2 and 5 of our Terms.
© 2025 The Author(s). This work is published and licensed by Dove Medical Press Limited. The
full terms of this license are available at https://www.dovepress.com/terms
and incorporate the Creative Commons Attribution
- Non Commercial (unported, 3.0) License.
By accessing the work you hereby accept the Terms. Non-commercial uses of the work are permitted
without any further permission from Dove Medical Press Limited, provided the work is properly
attributed. For permission for commercial use of this work, please see paragraphs 4.2 and 5 of our Terms.