Back to Journals » Cancer Management and Research » Volume 13
A Nomogram Based on CT Deep Learning Signature: A Potential Tool for the Prediction of Overall Survival in Resected Non-Small Cell Lung Cancer Patients
Authors Lin T, Mai J, Yan M, Li Z ![]() , Quan X
, Quan X ![]() , Chen X
, Chen X
Received 30 December 2020
Accepted for publication 2 March 2021
Published 30 March 2021 Volume 2021:13 Pages 2897—2906
DOI https://doi.org/10.2147/CMAR.S299020
Checked for plagiarism Yes
Review by Single anonymous peer review
Peer reviewer comments 3
Editor who approved publication: Professor Seema Singh
Ting Lin,1,* Jinhai Mai,2,3,* Meng Yan,1,* Zhenhui Li,4 Xianyue Quan,1 Xin Chen3,5
1Department of Radiology, Zhujiang Hospital, Southern Medical University, Guangzhou, 510282, People’s Republic of China; 2School of Automation Science and Engineering, South China University of Technology, Guangzhou, 510641, People’s Republic of China; 3Department of Radiology, Guangdong Provincial People’s Hospital, Guangdong Academy of Medical Sciences, Guangzhou, 510080, People’s Republic of China; 4Department of Radiology, Yunnan Cancer Hospital, The Third Affiliated Hospital of Kunming Medical University, Kunming, 650118, People’s Republic of China; 5Department Of Radiology, Guangzhou First People’s Hospital, School of Medicine, South China University of Technology, Guangzhou, 510180, People’s Republic of China
*These authors contributed equally to this work
Correspondence: Xin Chen
Department of Radiology, Guangzhou First People’s Hospital, School of Medicine, South China University of Technology, Guangzhou, 510180, People’s Republic of China
Tel/Fax +86-2081048816
Email [email protected]
Xianyue Quan
Department of Radiology, Zhujiang Hospital, Southern Medical University, Guangzhou, 510282, People’s Republic of China
Tel/Fax +86-2061643114
Email [email protected]
Purpose: To develop and further validate a deep learning signature-based nomogram from computed tomography (CT) images for prediction of the overall survival (OS) in resected non-small cell lung cancer (NSCLC) patients.
Patients and Methods: A total of 1792 deep learning features were extracted from non-enhanced and venous-phase CT images for each NSCLC patient in training cohort (n=231). Then, a deep learning signature was built with the least absolute shrinkage and selection operator (LASSO) Cox regression model for OS estimation. At last, a nomogram was constructed with the signature and other independent clinical risk factors. The performance of nomogram was assessed by discrimination, calibration and clinical usefulness. In addition, in order to quantify the improvement in performance added by deep learning signature, the net reclassification improvement (NRI) was calculated. The results were validated in external validation cohort (n=77).
Results: A deep learning signature with 9 selected features was significantly associated with OS in both training cohort (hazard ratio [HR]=5.455, 95% CI: 3.393– 8.769, P< 0.001) and external validation cohort (HR=3.029, 95% CI: 1.673– 5.485, P=0.004). The nomogram combining deep learning signature with clinical risk factors of TNM stage, lymphatic vessel invasion and differentiation grade showed favorable discriminative ability with C-index of 0.800 as well as a good calibration, which was validated in external validation cohort (C-index=0.723). Additional value of deep learning signature to the nomogram was statistically significant (NRI=0.093, P=0.027 for training cohort; NRI=0.106, P=0.040 for validation cohort). Decision curve analysis confirmed the clinical usefulness of this nomogram in predicting OS.
Conclusion: The deep learning signature-based nomogram is a robust tool for prognostic prediction in resected NSCLC patients.
Keywords: deep learning, non-small cell lung cancer, prognosis, nomogram
Introduction
Non-small cell lung cancer (NSCLC), the most frequent cause of cancer-related mortality, accounts for approximately 85% of lung cancer,1–4 and surgical resection is the preferred treatment for stage I–IIIa NSCLC.5 However, overall survival (OS) still varies even though the tumor is completely resected.6–9 Currently, the tumor-node-metastasis (TNM) staging system is the routine method to estimate prognosis.10 However, the survival outcomes could be dramatically different among patients with the same TNM tumor stage.11 Therefore, there is an urgent need to develop a new prognosis estimation method for achieving personalized precision medicine.12,13
Computed tomography (CT), a routinely used imaging technique for disease diagnosis, provides great opportunities for personalized medicine. Radiomics, a recently emerging method for characterizing tumor heterogeneity with high-dimensional quantitative features extracted from medical images, has shown promising results in evaluation of tumor treatment response and prognosis.14–16 Most previous studies have relied on hand-crafted features which encode our prior knowledge on the data.15,17–21 However, hand-crafted features are low-order and susceptible to noise, and may not be adequate for unveiling the characteristics of tumors.22
Currently, deep learning based on a neural network structure has shown great potential in medical images.23,24 It can automatically extract high-level features from pixel images for tumor classification, segmentation and detection.25,26 Hosny et al27 reported that deep learning could be used to improve risk stratification for NSCLC patients. However, a deep learning signature they developed for binary prediction of 2-year OS relied on arbitrary thresholds and cannot predict OS as a continuous variable. Moreover, they failed to further develop a model which might be useful for clinical practice.
Therefore, we aimed to construct and validate a signature-based nomogram to predict OS as a continuous variable and to evaluate the incremental prognostic value of the deep learning signature from preoperative CT images for individual OS prediction in patients with resected NSCLC.
Patients and Methods
Patients
Ethical approval for this study was obtained from the Ethics Committees of Guangdong Provincial People’s Hospital (Hospital 1) and Zhujiang Hospital (Hospital 2), and the review board exempted the acquisition of informed consent because this was a retrospective study. Confidentiality of patient data was maintained anonymously, and all procedures performed in our study were in compliance with the Declaration of Helsinki. Inclusion criteria were described below: (a) patients pathologically diagnosed NSCLC; (b) both preoperative non-enhanced and venous-phase CT scanning were available. Exclusion criteria were described below: (a) missing preoperative non-enhanced or venous-phase CT images; (b) multiple primary carcinomas or concurrent malignancies; (c) patients received chemotherapy or radiotherapy before surgery; (d) clinical characteristics were incomplete; (e) Patients with obvious artifacts in CT images. Finally, a total of 308 patients were included in the study. Of 308 patients, 231 patients enrolled between January 2007 and August 2014 from Hospital 1 served as the training cohort, and 77 patients enrolled between March 2010 and December 2015 from Hospital 2 served as the validation cohort. The patient recruitment process is shown in Figure A1.
Clinical Characteristics and Follow-Up
Baseline clinical information was retrieved from the institutional database for medical records, including age, gender, smoking status, TNM stage, the status of lymphatic vessel invasion, differentiation grade, pathological type and location of tumor.
The primary outcome was OS, defined as the time from the date of preoperative CT scan to the date of death from any cause (event) or last follow-up (censored). Patients were followed up at least 3 years postoperatively. The investigators were blinded to the clinical variables and patients’ outcome.
Image Acquisition
All patients underwent non-enhanced and venous-phase chest CT scans. The parameters are listed in Appendix A1.
Tumor Segmentation
All preoperative non-enhanced and venous-phase chest CT images were obtained from the picture archiving and communication system (PACS). A radiologist with 8-year experience in interpreting chest CT images manually delineated the region of interest (ROI) along the maximum cross-sectional border of the tumor using ImageJ (National Institutes of Health, Bethesda, MD). This procedure was performed on nonenhanced and venous-phase chest CT images, respectively.
To analyze the interobserver reproducibility of features, another radiologist with 5-year experience in chest CT interpretation randomly chose 50 cases for segmentation. Then, interclass correlation coefficients (ICCs) were calculated, and features with ICCs larger than 0.75 were considered highly reproducible.28
Image Pre-Processing
In order to correct the influence of different CT devices on feature extraction, the following pre-processing steps were performed before feature extraction. First of all, all CT images were normalized to a consistent voxel size of 0.5×0.5×1 mm3. Then, the gray values of the segmented ROI were converted into the range (0, 300) using linear transformation.
Deep Learning Feature Extraction
A deep architecture, ResNet-18, was applied to extract deep learning features from both preoperative non-enhanced and venous-phase chest CT images. ResNet-18 was pretrained on the ImageNet Large Scale Visual Recognition Challenge 2012 (ILSVRC-2012) dataset, and all weights of the network were predetermined, including 17 convolution layers (Conv1-17) and 1 fully connected layer (fc18).
CT images were grayscale images (single-channel images), while three-channel and 224×224 pixel2 RGB input images (224×224×3) were required for the pretrained ResNet-18 on the ILSVRC-2012 dataset. Therefore, the following two steps were taken to meet the requirements of the pretrained ResNet-18 inputs images. First, the segmented tumor region was read, and then a bounding box covering the whole tumor area was cropped (size, 224×224 pixels). Deep learning features would be extracted from the output of Conv3_2, conv4_2, conv5_2 of pretrained ResNet-18.29 The toolbox of deep learning feature extraction was implemented in MATLAB 2019a (http://www.mathworks.com/help/deeplearning/ug/extract-image-features-using-pretrained-network.html).30 The flow chart of feature extraction process is shown in Figure 1.
 |
Figure 1 Deep learning workflow for feature extraction. Image segmentation was performed by experienced radiologist on the CT images. Sub-images contain whole tumor were cropping from the segmented images, and then combined into the RGB image. The deep learning features were extracted from the RGB images. |
Deep Learning Feature Selection and Signature Development
The following steps were performed for feature selection. Firstly, robust features with ICCs>0.75 were chosen and normalized by Z-score transformation. Secondly, the least absolute shrinkage and selection operator (LASSO) Cox regression was applied to select prognosis-related features from the robust features.31 Finally, the deep learning signature was built by fitting the selected features with the Cox proportional hazards model. A risk score was calculated as a linear combination of all the selected features with their weighting coefficients.
Evaluation and Validation of the Signature
Signature performance was evaluated in the training cohort and then validated in the external validation cohort. The association of the deep learning signature with OS was assessed by univariate Cox regression analysis. Patients were stratified into high- and low-risk group using the median of the risk score as the cut-off point. Survival curves were plotted using the Kaplan–Meier method, and the Log rank test was used to compare the difference of survival curves between high- and low-risk groups. The concordance index (C-index) was calculated to assess the predictive discrimination of the signature. Predictive accuracy was evaluated using the area under the receiver operating characteristic (ROC) curve (AUC) for 3-year OS.
We also assessed whether the deep learning signature could further stratify patients within subgroups as defined by: age (≤60 or >60 years), gender (female or male), smoking status (yes or no), TNM stage (I–III), lymphatic vessel invasion (yes or no), and differentiation grade (well, moderate, poor).
Construction and Assessment of the Nomogram
Univariate and multivariate Cox regression analyses were performed to identify the prognostic factors. To assess the incremental prognostic value of the deep learning signature for individual OS prediction, a deep learning signature-based model and a clinical model were built. Variables included in the deep learning signature-based model were selected via the stepwise selection method by minimizing Akaike’s information criterion (AIC) and are expressed as a nomogram. The clinical model was built with only clinical risk factors.
We assessed the performances of the nomogram and the clinical model in both the training and the external validation cohorts. Predictive discrimination was evaluated using C-index, and predictive accuracy was measured using AUC for 3-year OS estimation. A calibration curve was presented to evaluate the concordance between the observed outcome and the estimated survival probability. To quantify the improvement of deep learning signature for the nomogram, the net reclassification improvement (NRI) was calculated. Finally, we employed decision curve analysis to estimate the clinical usefulness (net benefit over a range of risk thresholds).
Statistical Analysis
The Chi-square test or the Mann–Whitney U-test as appropriate was used to compare the differences of baseline clinical information between the training and the external validation cohorts.
Statistical analyses were performed with R programming language (R version 3.3.1; http://www.R-project.org). The R packages employed included “glmnet”, “survival”, and “time ROC”. All statistical tests were two-sided with a significance level of 0.05.
Results
Clinical Characteristics and Follow-Up
The clinical characteristics for the training and external validation cohorts are listed in Table 1. No statistically significant difference was detected between two cohorts with regard to gender, smoking status, lymphatic vessel invasion or tumor location (P=0.109–0.785) except for the factors of age, TNM stage, differentiation grade, follow-up time and pathological type (P≤0.028).
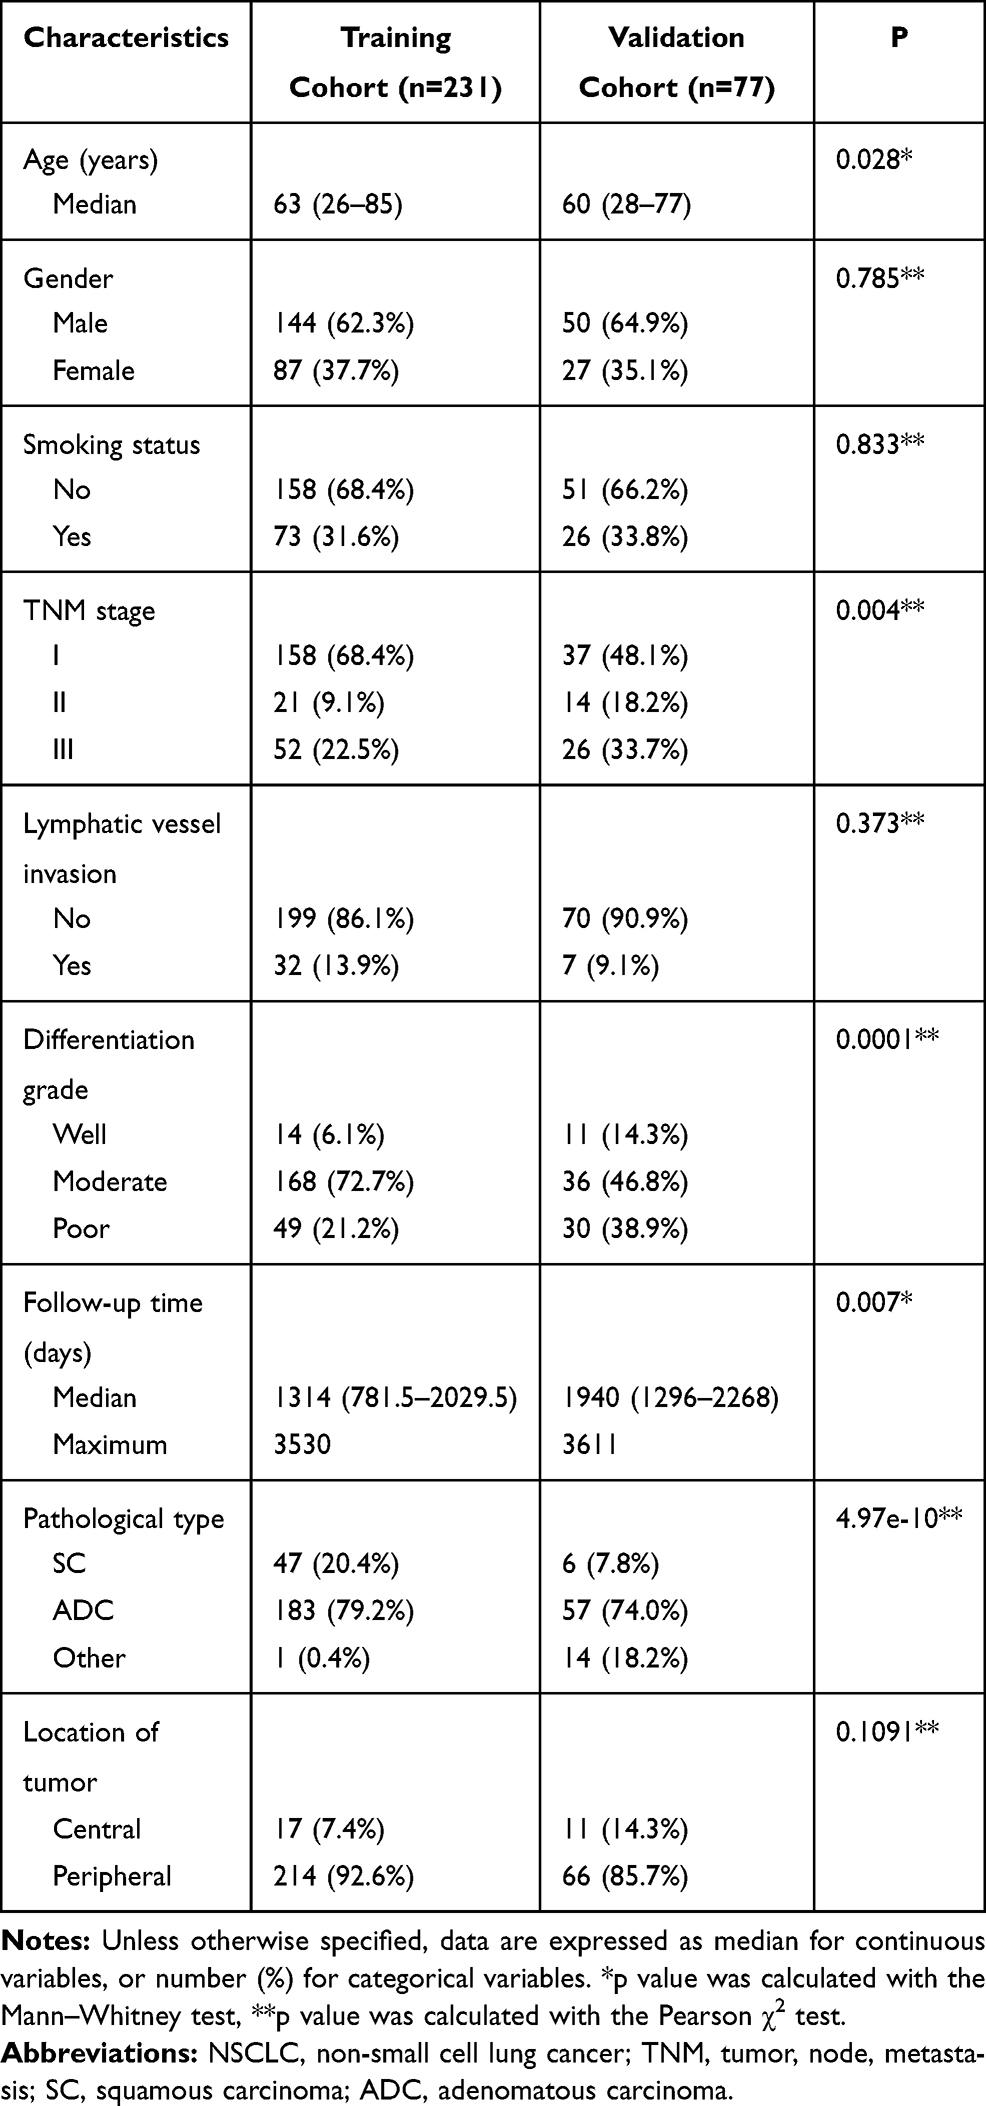 |
Table 1 Clinical Characteristics of Patients with Resectable NSCLC in Training and Validation Cohort |
The maximum follow-up times were 116 months in the training cohort and 119 months in the external validation cohort.
Deep Learning Feature Selection and Signature Construction
In our study, 896 deep learning features were extracted from non-enhanced and venous-phase CT images, respectively. Therefore, there were a total of 1792 deep learning features for each patient, and 435 features with ICCs>0.75 showed good reproducibility. Nine features were finally selected from the robust features by LASSO Cox regression (Figure 2), and the signature was constructed using the selected features weighted by each coefficient (see Appendix A2).
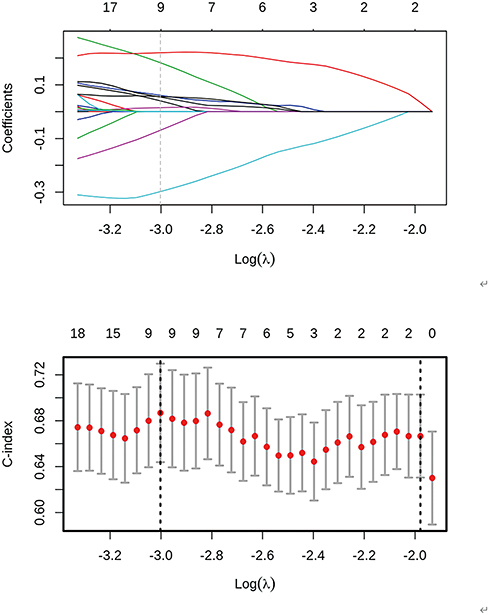 |
Figure 2 Deep learning feature selection using the LASSO Cox regression model. Horizontal line represents a feature selection result for a feature group. The left column represents the distribution of the coefficients for each feature, a coefficient profile plot was produced against the log (λ) sequence and the right column is to use the 10-fold cross-validation to adjust the parameters in the LASSO model to get the minimum standard. The C-index was plotted versus log (λ). Dotted vertical lines were drawn at the optimal values by using the minimum criteria and the 1 standard error of the minimum criteria (the 1-SE criteria). We obtained 9 most significant features with non-zero coefficients as the predictive features. |
Evaluation and Validation of the Signature
Deep learning signature was significantly associated with OS in the training cohort (hazard ratio [HR]=5.455, 95% CI: 3.393–8.769, P<0.001) and the external validation cohort (HR=3.029, 95% CI: 1.673–5.485, P=0.004) (Figure 3). Patients were classified into high- and low-risk groups with the cut-off point (median risk score=−0.116). Patients with lower risk scores had better OS (median (interquartile range [IQR]), 1606 [1044–2082] days for the training cohort and 2006 [1572–2280] days for the external validation cohort) than those in the high-risk group (median [IQR], 1177 [620–1897] days for the training cohort and 1705 [726.5–2126] days for the external validation cohort) (Table 2). The C-indexes were 0.748 (95% CI: 0.680–0.817) for the training cohort and 0.695 (95% CI: 0.596–0.794) for the external validation cohort. The signature yielded an AUC of 0.759 for 3-year OS prediction in the training cohort and 0.785 in the external validation cohort (Figure 4).
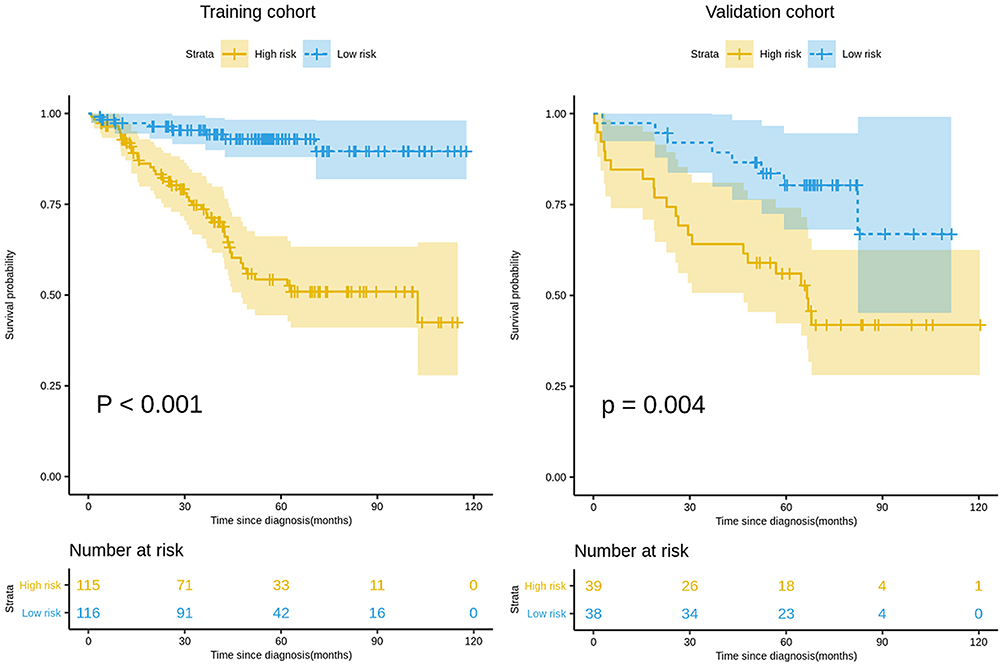 |
Figure 3 Kaplan–Meier survival analyses according to the deep learning signature for patients in training and external validation cohorts. A significant association of the signature with the OS was shown in the training cohort, which was then confirmed in the external validation cohort. Abbreviation: OS, overall survival. |
 |
Table 2 OS and Death Rate in High-Risk and Low-Risk Groups |
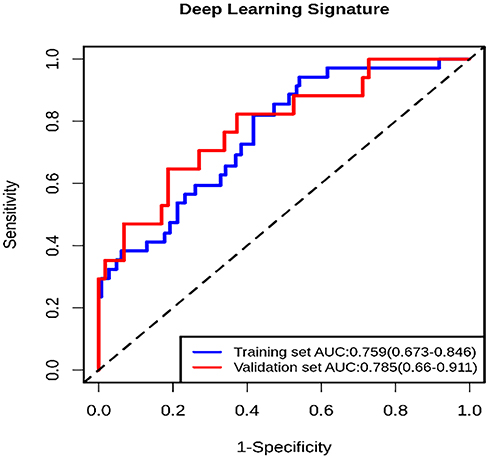 |
Figure 4 Receiver operating characteristic (ROC) curve of deep learning signature for 3-year OS estimation. The blue line represents the ROC curve of the training set. The red line presents the ROC curve of the external validation set. Abbreviations: AUC, area under the ROC curve; OS, overall survival. |
Patients in each TNM stage were successfully divided into high- and low-risk groups with the median risk score based on the training cohort (P <0.05). The result of stratification analysis based on other clinical risk factors are shown in Appendix A3, A4 and Figure A2.
Construction and Assessment of Nomogram
Univariate and multivariate Cox regression analyses are shown in Appendix A5. A deep learning signature-based model, comprising the deep learning signature and clinical risk factors of TNM stage, lymphatic vessel invasion and differentiation grade identified in univariate analysis, was selected based on a minimized AIC=466.71 (Appendix A6) and was expressed as a nomogram (Figure 5). A clinical model was constructed with only the clinical risk factors: TNM stage, lymphatic vessel invasion and differentiation grade.
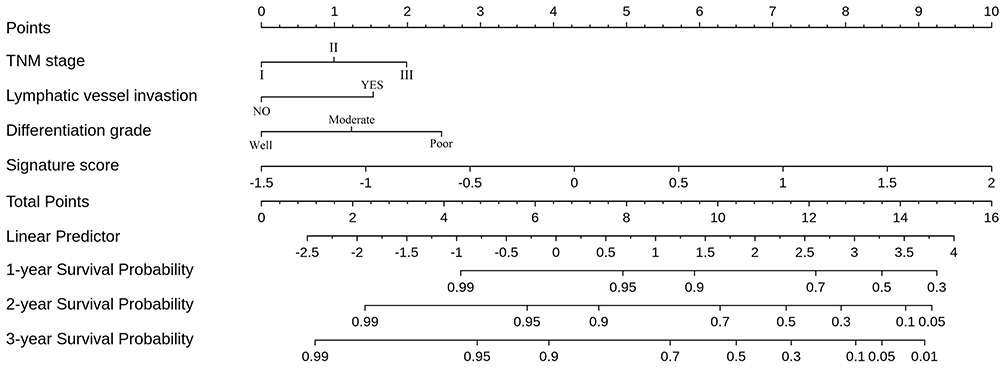 |
Figure 5 The constructed deep learning signature-based nomogram. The nomogram was developed in the training set, with the deep learning signature, TNM stage, lymphatic vessel invasion and differentiation grade. |
The nomogram showed better discrimination performance in predicting OS than the clinical model in both the training cohort (C-index [95% CI], 0.800 [0.746, 0.855] for the nomogram; 0.786 [0.726, 0.847] for the clinical model, P<0.001) and the external validation cohort (C-index [95% CI], 0.723 [0.634, 0.813] for the nomogram, 0.679 [0.578, 0.778] for the clinical model, P<0.001). The ROCs for 3-year OS for the nomogram and clinical model in both cohorts are presented in Figure 6A and B. The calibration curve showed satisfactory concordance between the observed outcome and estimated survival probability in both cohorts (Figure 6C and D). The additional value of the deep-learning signature to the nomogram was statistically significant (NRI [95% CI], 0.093 [0.004, 0.192], P=0.027 for the training cohort; NRI [95% CI], 0.106 [0.001, 0.236], P=0.040 for the validation cohort). And a decision curve analysis showed that the nomogram had a good overall net benefit (Figure 6E).
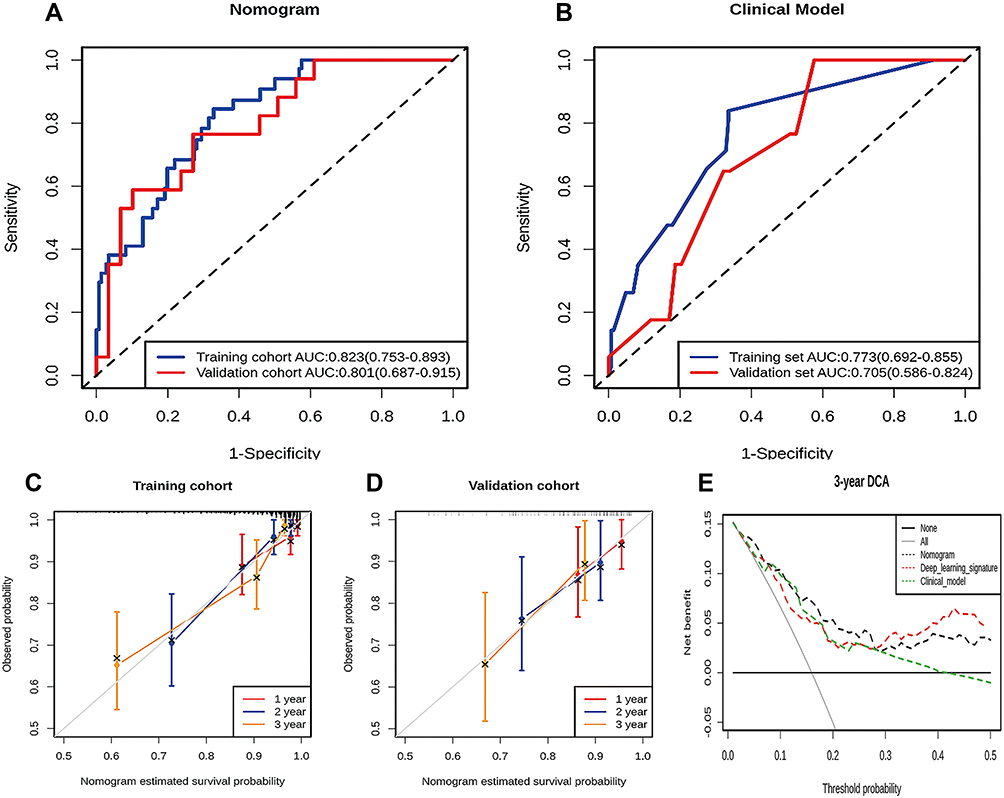 |
Figure 6 The performance of the nomogram. (A and B) Receiver operating characteristic (ROC) curves for the nomogram (A) and clinical model (B) show the predictive accuracy of each model in terms of the area under the curve (AUC) at predicting 3-year OS in the training and the validation cohorts. (C and D) Calibration curves for the nomogram show the agreement between the estimated and observed 1-, 2-, 3-year outcomes in the training cohort (C) and the validation cohort (D). (E) Decision curve analysis for nomogram. The nomogram had a good net benefit compared with clinical model, deep learning signature and simple strategies such as follow-up of all patients (grey line) or no patients (horizontal black line) across the majority range of threshold probabilities. |
Discussion
In the present study, we developed a deep learning signature, which successfully stratified NSCLC patients into high- and low-risk groups. Moreover, the deep learning signature-based nomogram, comprising the clinical risk factors of the TNM stage, lymphatic vessel invasion and differentiation grade, has a better performance than the clinical model in the survival estimation. This indicates the incremental prognostic value of the deep learning signature to the TNM stage and other clinical risk factors for individual OS prediction. A deep learning signature-based nomogram could be used as a valuable tool for clinical decision-making.
TNM stage is widely used in clinical practice for cancer treatment decision-making, while it may limit the clinical usefulness for personalized medicine.32,33 Meanwhile, a single risk factor without any modelling is unable to offer a comprehensive assessment of postoperative outcome.34 Thus, a statistical model with multiple risk factors is necessary. Shi et al32 constructed a nomogram based on clinical risk factors to predict OS for NSCLC patients, showing a better discrimination ability as well as a better net benefit than the TNM stage alone. In our study, it is worth noting that a TNM stage-based clinical model showed discrimination with lower C-index than did the deep learning signature-based nomogram. This result is consistent with previous studies,18,35 suggesting that the TNM stage-based clinical model is insufficient for the prediction of individual prognosis.
Most studies have indicated that biological characteristics of tumors can be revealed via quantitative medical image features,36 which will likely improve tumor prognostic prediction.37 Jong et al38 reported that the hand-crafted signature showed prognostic value in 195 patients with lung adenocarcinoma (C-index, 0.576). We extracted deep learning features from CT images of 231 patients and selected robust features to build deep learning signature. The discrimination performance of the deep learning signature in our study (C-index, 0.748 and 0.695 for the training and external validation cohort) was better than the performance of hand-crafted signature in Jong’s study. Recently, Hosny et al27 reported that CT-based deep learning signature may be used for risk stratification in NSCLC patients, and found that deep learning signature was significantly associated with binary 2-year OS (AUC=0.71). In our study, the predictive accuracy of deep learning signature (AUC, 0.759 and 0.785 for 3-year OS in the training and external validation cohort) was slightly higher than theirs. Meanwhile, the output of our finally constructed model (nomogram) was predicting the OS as a continuous variable, which was closer to the real clinical situation than binary analysis of 2-year OS. Moreover, deep learning-based-nomogram built in our study showed a good estimation power and good discrimination performance, making it to be a practical and user-friendly tool for clinicians. The clinical usefulness of the nomogram for OS prediction was further confirmed by decision curve analysis.
In the present study, the deep learning signature could be utilized for the mortality risk-stratification of resected NSCLC patients within subgroups as defined by clinical risk factors. The important finding of our study is that the deep learning signature identified low-risk patients with better OS in stage I–III NSCLC, which reflected that heterogeneity of survival outcome presented in the same stage. Huang et al35 found that a hand-crafted feature signature has the potential to be a biomarker of risk stratification for disease-free survival (DFS) in early-stage NSCLC patients. However, their hand-crafted feature signature did not successfully stratify patients with stage II NSCLC.
Some limitations existed in this study. Firstly, the sample size was relatively small. Thus, these findings need further multi-institutional validation with a larger sample size. Secondly, the reconstructed image thickness was different between the two participant hospitals and even in the same hospital. However, the difference was not uncommon in current clinical practice, and we have drawn meaningful conclusions even under this imperfect condition. Thirdly, the deep learning algorithms often finds their own rules and do not leave an audit trail to explain the decisions (namely, the black box problem), which is inherently opaque and has not yet been overcome. Finally, we used 2D features rather than 3D features in this study. Although 3D features taking the whole tumor into consideration may be more informative, several previous studies have shown that 2D features could also provide significant prognostic information compared to 3D features.39,40
Conclusion
The deep learning signature could be used for risk stratification in resected NSCLC patients. Moreover, the nomogram combining the deep learning signature with clinical risk factors (TNM stage, lymphatic vessel invasion and differentiation grade) can be used to assist clinical decision-making.
Acknowledgments
This work was supported by National Natural Scientific Foundation of China [82072090 and 81601469], Natural Science Foundation of Guangdong Province in China [2018A030313511], Guangzhou Science and Technology Project of Health [20191A011002], Clinical Research Startup Program of Southern Medical University by High-level University Construction Funding of Guangdong Provincial Department of Education [LC2016PY034].
Disclosure
The authors report no conflicts of interest in this work.
References
1. Travis WD. Pathology of lung cancer. Clin Chest Med. 2011;32(4):669–692. doi:10.1016/j.ccm.2011.08.005
2. Siegel RL, Miller KD, Jemal A. Cancer statistics, 2020. CA Cancer J Clin. 2020;70(1):7–30. doi:10.3322/caac.21590
3. Chen W, Sun K, Zheng R, et al. Cancer incidence and mortality in China, 2014. Chin J Med Res. 2018;30(1):1–12. doi:10.21147/j.issn.1000-9604.2018.01.01
4. Cheng YI, Davies MPA, Liu D, et al. Implementation planning for Lung cancer screening in China. Precis Clin Med. 2019;2(1):13–44. doi:10.1093/pcmedi/pbz002
5. Butts CA, Ding K, Seymour L, et al. Randomized Phase III trial of vinorelbine plus cisplatin compared with observation in completely resected stage IB and II non-small-cell lung cancer: updated survival analysis of JBR-10. J Clin Oncol. 2010;28(1):29–34. doi:10.1200/JCO.2009.24.0333
6. Molinier O, Goupil F, Debieuvre D, et al. Five-year survival and prognostic factors according to histology in 6101 non-small-cell lung cancer patients. Respir Med Res. 2019;77:46–54. doi:10.1016/j.resmer.2019.10.001
7. Ettinger DS, Wood DE, Aggarwal C, et al. NCCN guidelines insights: non-small cell lung cancer, version 1.2020. J Natl Compr Canc Netw. 2019;17(12):1464–1472. doi:10.6004/jnccn.2019.0059
8. Kawachi R, Tsukada H, Nakazato Y, et al. Early recurrence after surgical resection in patients with pathological stage I non-small cell lung cancer. Thorac Cardiovasc Surg. 2009;57(8):472–475. doi:10.1055/s-0029-1185734
9. Lindenmann J, Fink-Neuboeck N, Taucher V, et al. Prediction of postoperative clinical outcomes in resected stage i non-small cell lung cancer focusing on the preoperative glasgow prognostic score. Cancers. 2020;12(1):152. doi:10.3390/cancers12010152
10. Amin MB, Greene FL, Edge SB, et al. The eighth edition AJCC cancer staging manual: continuing to build a bridge from a population-based to a more “personalized” approach to cancer staging. CA Cancer J Clin. 2017;67(2):93–99. doi:10.3322/caac.21388
11. Zhu L, Chen S, Ma S, et al. Glasgow prognostic score predicts prognosis of non-small cell lung cancer: a meta-analysis. SpringerPlus. 2016;5(1):439. doi:10.1186/s40064-016-2093-9
12. Weissman SM. Personalized medicine: a new horizon for medical therapy. Precis Clin Med. 2018;1(1):1–2. doi:10.1093/pcmedi/pby001
13. Li W. Precision medicine: to cure and relieve more. Precis Clin Med. 2018;1(1):3–4. doi:10.1093/pcmedi/pby002
14. Lee G, Lee HY, Park H, et al. Radiomics and its emerging role in lung cancer research, imaging biomarkers and clinical management: state of the art. Eur J Radiol. 2017;86:297–307. doi:10.1016/j.ejrad.2016.09.005
15. Coroller TP, Grossmann P, Hou Y, et al. CT-based radiomic signature predicts distant metastasis in lung adenocarcinoma. Radiat Oncol. 2015;114(3):345–350. doi:10.1016/j.radonc.2015.02.015
16. Hassani C, Varghese BA, Nieva J, et al. Radiomics in pulmonary lesion Imaging. AJR Am J Roentgenol. 2019;212(3):497–504. doi:10.2214/AJR.18.20623
17. Ninomiya K, Arimura H. Homological radiomics analysis for prognostic prediction in lung cancer patients. Phys Med. 2020;69:90–100. doi:10.1016/j.ejmp.2019.11.026
18. Wang L, Dong T, Xin B, et al. Integrative nomogram of CT imaging, clinical, and hematological features for survival prediction of patients with locally advanced non-small cell lung cancer. Eur Radiol. 2019;29(6):2958–2967. doi:10.1007/s00330-018-5949-2
19. van Timmeren JE, Leijenaar RTH, van Elmpt W, et al. Survival prediction of non-small cell lung cancer patients using radiomics analyses of cone-beam CT images. Radiat Oncol. 2017;123(3):363–369. doi:10.1016/j.radonc.2017.04.016
20. Lambin P, Leijenaar RTH, Deist TM, et al. Radiomics: the bridge between medical imaging and personalized medicine. Nat Rev Clin Oncol. 2017;14(12):749–762. doi:10.1038/nrclinonc.2017.141
21. Arimura H, Soufi M, Kamezawa H, et al. Radiomics with artificial intelligence for precision medicine in radiation therapy. J Radiat Res. 2019;60(1):150–157. doi:10.1093/jrr/rry077
22. Wu L, Yang X, Cao W, et al. Multiple level CT radiomics features preoperatively predict lymph node metastasis in esophageal cancer: a Multicentre Retrospective Study. Front Oncol. 2019;9:1548. doi:10.3389/fonc.2019.01548
23. Akay A, Hess H. Deep learning: current and emerging applications in medicine and technology. IEEE J Biomed Health Inform. 2019;23(3):906–920. doi:10.1109/JBHI.2019.2894713
24. Mazurowski MA, Buda M, Saha A, et al. Deep learning in radiology: an overview of the concepts and a survey of the state of the art with focus on MRI. J Magn Reson Imaging. 2019;49(4):939–954. doi:10.1002/jmri.26534
25. Havaei M, Davy A, Warde-Farley D, et al. Brain tumor segmentation with deep neural networks. Med Image Anal. 2015;35:18–31. doi:10.1016/j.media.2016.05.004
26. Wang X, Yang W, Weinreb J, et al. Searching for prostate cancer by fully automated magnetic resonance imaging classification: deep learning versus non-deep learning. Sci Rep. 2017;7(1):15415. doi:10.1038/s41598-017-15720-y
27. Hosny A, Parmar C, Coroller TP, et al. Deep learning for lung cancer prognostication: a retrospective multi-cohort radiomics study. PLoS Med. 2018;15(11):e1002711. doi:10.1371/journal.pmed.1002711
28. Gstoettner M, Sekyra K, Walochnik N, et al. Inter- and intraobserver reliability assessment of the Cobb angle: manual versus digital measurement tools. Eur Spine J. 2007;16(10):1587–1592. doi:10.1007/s00586-007-0401-3
29. He K, Zhang X, Ren S, et al. Deep residual learning for image recognition.
30. Yang X, Wu L, Ye W, et al. Deep learning signature based on staging CT for preoperative prediction of sentinel lymph node metastasis in breast cancer. Acad Radiol. 2020;27(9):1226–1233. doi:10.1016/j.acra.2019.11.007
31. Harrell FE, Lee KL, Mark DB. Multivariable prognostic models: issues in developing models, evaluating assumptions and adequacy, and measuring and reducing errors. Stat Med. 1996;15(4):361–387. doi:10.1002/(SICI)1097-0258(19960229)15:4<361::AID-SIM168>3.0.CO;2-4
32. Shi M, Zhan C, Shi J, et al. Prediction of overall survival of patients with completely resected non-small cell lung cancer: analyses of preoperative spirometry, preoperative blood tests, and other clinicopathological data. Cancer Manag Res. 2019;11:10487–10497. doi:10.2147/CMAR.S232219
33. Hortobagyi GN, Edge SB, Giuliano A. New and important changes in the TNM staging system for breast cancer. Am Soc Clin Oncol Educ Book. 2018;38:457–467. doi:10.1200/EDBK_201313
34. Kattan MW. Judging new markers by their ability to improve predictive accuracy. J Natl Cancer Inst. 2003;95(9):634–635. doi:10.1093/jnci/95.9.634
35. Huang Y, Liu Z, He L, et al. Radiomics signature: a potential biomarker for the prediction of disease-free survival in early-stage (I or II) non–small cell lung cancer. Radiology. 2016;281(3):947–957. doi:10.1148/radiol.2016152234
36. Chen X, Fang M, Dong D, et al. A radiomics signature in preoperative predicting degree of tumor differentiation in patients with non-small cell lung cancer. Acad Radiol. 2018;25(12):1548–1555. doi:10.1016/j.acra.2018.02.019
37. Aerts HJ, Velazquez ER, Leijenaar RT, et al. Decoding tumour phenotype by noninvasive imaging using a quantitative radiomics approach. Nat Commun. 2014;5(1):4006. doi:10.1038/ncomms5006
38. de Jong EEC, van Elmpt W, Rizzo S, et al. Applicability of a prognostic CT-based radiomic signature model trained on stage I-III non-small cell lung cancer in stage IV non-small cell lung cancer. Lung Cancer. 2018;124:6–11. doi:10.1016/j.lungcan.2018.07.023
39. Lubner MG, Stabo N, Lubner SJ, et al. CT textural analysis of hepatic metastatic colorectal cancer: pre-treatment tumor heterogeneity correlates with pathology and clinical outcomes. Abdom Imaging. 2015;40(7):2331–2337. doi:10.1007/s00261-015-0438-4
40. Shen C, Liu Z, Guan M, et al. 2D and 3D CT radiomics features prognostic performance comparison in non-small cell lung cancer. Transl Oncol. 2017;10(6):886–894. doi:10.1016/j.tranon.2017.08.007
 © 2021 The Author(s). This work is published and licensed by Dove Medical Press Limited. The
full terms of this license are available at https://www.dovepress.com/terms
and incorporate the Creative Commons Attribution
- Non Commercial (unported, 3.0) License.
By accessing the work you hereby accept the Terms. Non-commercial uses of the work are permitted
without any further permission from Dove Medical Press Limited, provided the work is properly
attributed. For permission for commercial use of this work, please see paragraphs 4.2 and 5 of our Terms.
© 2021 The Author(s). This work is published and licensed by Dove Medical Press Limited. The
full terms of this license are available at https://www.dovepress.com/terms
and incorporate the Creative Commons Attribution
- Non Commercial (unported, 3.0) License.
By accessing the work you hereby accept the Terms. Non-commercial uses of the work are permitted
without any further permission from Dove Medical Press Limited, provided the work is properly
attributed. For permission for commercial use of this work, please see paragraphs 4.2 and 5 of our Terms.