Back to Journals » Drug Design, Development and Therapy » Volume 14
A New Validated HPLC-MS/MS Method for Quantification and Pharmacokinetic Evaluation of Dovitinib, a Multi-Kinase Inhibitor, in Mouse Plasma
Authors AlRabiah H, Kadi AA ![]() , Aljohar HI, Attwa MW
, Aljohar HI, Attwa MW ![]() , Al-Shakliah NS, Attia SM
, Al-Shakliah NS, Attia SM ![]() , Mostafa GAE
, Mostafa GAE ![]()
Received 17 July 2019
Accepted for publication 3 January 2020
Published 28 January 2020 Volume 2020:14 Pages 407—415
DOI https://doi.org/10.2147/DDDT.S223573
Checked for plagiarism Yes
Review by Single anonymous peer review
Peer reviewer comments 2
Editor who approved publication: Professor Manfred Ogris
Haitham AlRabiah,1 Adnan A Kadi,1 Haya I Aljohar,1 Mohamed W Attwa,1 Nasser S Al-Shakliah,1 Sabry M Attia,2 Gamal AE Mostafa1,3
1Department of Pharmaceutical Chemistry, College of Pharmacy, King Saud University, Riyadh 11459, Saudi Arabia; 2Department of Pharmacology Toxicology, College of Pharmacy, King Saud University, Riyadh 11451, Saudi Arabia; 3Micro-Analytical Laboratory, Applied Organic Chemistry Department, National Research Center, Dokki, Cairo, Egypt
Correspondence: Gamal AE Mostafa, Email [email protected]
Background: Dovitinib (TKI 258) is a small-molecule multi-kinase inhibitor for the treatment of different types of cancer. There is currently no validated method for its quantitative determination; therefore, we aimed to develop a reliable method to assay dovitinib.
Method and Results: An electrospray ionization tandem mass spectrometry (ESI-MS/MS) method was used to separate dovitinib using an analytical C18 column (50 × 2.1 mm, 1.8 μm) at 25°C. Bosutinib was used as the internal standard (IS). Dovitinib was extracted from mouse plasma using a precipitation procedure. The mobile phase consisted of 10 mM ammonium formate: acetonitrile (68:32, v/v, pH 4.3) run at a rate of 0.3 mL min− 1. MS detection was performed in the positive ion mode. Multiple reaction monitoring transitions were 393→ 337 and 393→ 309 for dovitinib, and 530→ 141 and 530→ 113 for bosutinib. The investigated method was validated as a bio-analytical method based on FDA guidelines. The linearity of the developed method was over the range of 5– 500 ng mL,− 1 coefficient of determination (r2= 0.9998). The average intra-day recovery and relative standard deviation (RSD) of the quality control (QC) sample were 97.24% and 1.32%, whereas the overall inter-day accuracy and precision were 97.99% and 0.54%, respectively. Dovitinib was stable during sample storage and handling conditions. Furthermore, the dilution integrity of the method was demonstrated by good recovery (97– 99%) and RSD values (0.5– 0.7%).
Conclusion: This method was selectively sensitive and exhibited no matrix effect, with an acceptable accuracy and precision according to the FDA guidelines. The developed method could be efficiently used for pharmacokinetic studies of dovitinib.
Keywords: HPLC, MS detection, dovitinib, mouse plasma, pharmacokinetics
Introduction
Tyrosine kinase inhibitors (TKIs) are a group of drugs that inhibit the action of tyrosine kinases, which are involved in cell proliferation, growth, and division. Active tyrosine kinase causes the growth of certain cancer cells, which is halted by administering inhibitors, leading to the prevention of proliferation and effective cancer treatment.1–3 The benzimidazol-quinolinone compound, (3Z)-4-amino-5-fluoro-3-[5-(4-methylpiperazin-1-yl)-1,3-dihydrobenzimidazol-2-ylidene] quinolin-2-one, dovitinib (TKI258, Figure 1) is a small-molecule multi-kinase inhibitor used to treat different types of cancer.4,5 Dovitinib was approved by the US Food and Drug Administration (FDA) as a TKI for the treatment of cancer.6
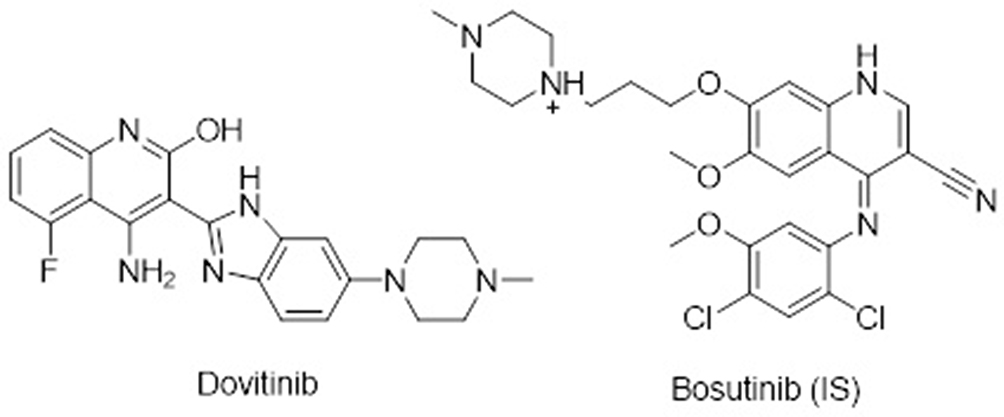 |
Figure 1 Chemical structure of dovitinib (DOV) and bosutinib (IS). |
Dovitinib is a potent inhibitor of receptor tyrosine kinases, including fibroblast growth factor receptor (FGFR),1–3 vascular endothelial growth factor (VEGFR)1–3 and platelet-derived growth factor receptor (PDGFR). Dovitinib has displayed excellent antitumor and antiangiogenic effects in preclinical models of colon, breast, bladder, pancreatic, and renal cancers.7,8 Phase I/II/III clinical trials revealed that dovitinib monotherapy, moderate overall efficacy in patients with a variety of solid tumors.9,10
Pharmacokinetic studies of dovitinib have been conducted using high-performance liquid chromatography-mass spectrometry (HPLC-MS) methods.11–13 However, these methods were based on non-validated liquid/liquid extraction procedures. The maximum tolerated dose of dovitinib (25–175 mg) was assessed based on an independent HPLC method model.14 The present method is based on a protein precipitation procedure with acetonitrile (ACN), followed by filtration of the samples; this is a very simple protocol compared to the tedious liquid-liquid method.11
The liquid/liquid extraction method involves extraction using methyl-t-butyl ether after the plasma sample containing ethylenediaminetetraacetic acid (EDTA) is basified.11 The extracts are then evaporated to dryness at approximately 40°C under nitrogen and reconstituted with water/acetonitrile.11 Dovitinib was found to be safe and displayed an active pharmacokinetic/pharmacodynamic profile.11–14
Determining drugs in biological matrices such as blood, urine and/or in tissue samples is a fundamental requirement in monitoring therapeutics agents, especially in anti-cancer therapy, and is performed by using an analytical method to estimate drug concentration, dose administered, and the dose-limiting toxicity levels. Although dovitinib is important for the therapeutic treatment of cancer, based on an extensive review of the literature, there are no available data on the quantitative determination of dovitinib using a validated method.
Therefore, developing and validating analytical methods for drug determination are essential. All analytical parameters such as accuracy, precision, selectivity, calibration curve, sensitivity, reproducibility, and stability should be examined, according to the FDA guideline.15 HPLC-MS detection has been proven to be the most sensitive technique for assaying drugs in biological matrices.16,17
Consequently, we aimed to develop a reliable HPLC-MS method for quantification and pharmacokinetic evaluation of dovitinib in mouse plasma.
Experimental
Chemicals and Reagents
Dovitinib and the internal standard (IS), bosutinib (purity > 99%) were obtained from “LC Laboratories (Woburn, MA, USA)”. Ammonium formate and formic acid of analytical reagent grade were acquired from “Avonchem (Macclesfield, Cheshire, England)”. HPLC grade ACN and methanol were acquired from “Sigma-Aldrich (West Chester, PA, USA)”. Dimethyl sulfoxide (DMSO > 99%) was obtained from “Panreac Quimica (Barcelona, Spain).” A Millipore purification instrument, Bedford, MA, USA was used to obtain high-purity water to prepare an aqueous solution. Mouse plasma was obtained from “the animal house at King Saud University (Riyadh, KSA).”
Chromatographic Conditions
Dovitinib was separated carried out using an Agilent HPLC-MS/MS system “(6410 QqQ)”, and HPLC Agilent 1200 series system consisting of a binary pump (G1311A) degasser (G1322A), autosampler (G1367B) and thermostatted column compartment (G1316). An Agilent “6410 QqQ LC/MS system (Agilent Technologies, Palo Alto, CA, USA)” with an ESI interface and C18 column (50 mm × 2.1 mm, 1.8 μm) (Waters, USA) was used to elute dovitinib. All parameters (column, mobile phase and MS detection) were optimized to obtain the best separation conditions with a suitable run time. The mobile phase consisted of a mixture of 10mM ammonium formate: ACN (68:32, v/v, pH 4.3); and the run time was 5 min. The flow rate was 0.3 mL min−1, injection volume was 5 µL per sample, and the MS detection was optimized to achieve the best conditions for detecting dovitinib and bosutinib, which was performed using a QqQ mass detector operated using ESI in the positive ion mode. High-purity nitrogen was used as the drying and collision gas at a rate of 12 L min−1 while the source temperature and capillary voltage were set at 350°C and 4000 V, respectively. Instruments were controlled and data were acquired using the mass hunter software. Quantification was performed using MRM with dovitinib transitions of 393→337 and 393→309 with fragmentor voltage and collision energy of 135 V, 28 eV and 140 V, 30 eV, respectively, for the two transitions. For the IS, MRM was 530→141 and 530→113, fragmentor voltage was 135 and 140 V, and the collision energy was 15, 20 eV.
Preparation of Solutions
Dovitinib and bosutinib stock solutions were prepared in DMSO at a concentration of 1.0 mg mL−1 each. Three working solutions were prepared from the stock by suitably diluting dovitinib and IS in the mobile phase (100, 10, and 1 µg mL−1).
Preparation of Samples and Dovitinib Calibration
Appropriate volumes of dovitinib working solution (10 and 1 µg mL−1) were added to mouse plasma samples to prepare eight concentrations: 5, 10, 20, 50, 100, 200, 300, and 500 ng mL−1 and the IS (100 ng mL−1). In addition, three quality control (QC) samples low, medium, and high (QCL, QCM, and QCH: 15, 150, and 400 ng mL−1, respectively) were prepared in the same manner as the calibration samples using different working solutions. The protein precipitation process was performed by adding 2 mL ACN to the mouse plasma sample (1 mL) and then centrifuging at 10,000 rpm for 10 mins under cooling conditions. The supernatants were filtered through a Millex-GP, 0.22-µm syringe filter; 1 mL of the filtrate was loaded onto the auto-sampler tray, and 5 µL of the sample was injected into the HPLC system. Blank mouse plasma was similarly prepared using an appropriate volume of mouse plasma in addition to the mobile phase instead of the sample. Potential interference with dovitinib was tested using blank samples. The 8-point calibration graph was constructed using spiked mouse plasma samples by plotting the peak-area ratio of dovitinib to bosutinib (y axis) versus dovitinib concentrations (x axis). Each point in the calibration was repeated (n = 6). The calibration graph parameters (slope, intercept, and coefficient of determination (r2)) were calculated from the linear fit. The concentrations of dovitinib in different mouse plasma samples were calculated from the calibration plot equation.
Method Validation
The current method was fully validated, as follows, according to the FDA15 guidelines.
Specificity
To investigate the specificity of the develop method, plasma samples from different mice were extracted using the protein precipitation procedure. The clear solution was injected into the HPLC-MS system to identify any peaks at elution times of the investigated drug and IS.
Extraction Matrix Effect and Carry-Over
The recovery percentage of dovitinib was estimated by measuring the peak-area ratio of the QC samples in mouse plasma at the QCL, QCM and QCH levels. The matrix effect was evaluated in mouse plasma post extraction at different levels. The precision of the post-extract is expected to be ±15% coefficient of variation (CV). The carry-over effect was determined by injecting blank mouse plasma samples (n = 6) after the upper limit of quantification (ULOQ) was injected. The peak area must be lower than 20% of the lower limit of quantification (LLOQ) or 5% of the IS.18
Linearity and Sensitivity
To evaluate the linearity of the current method, a calibration graph was constructed (n = 6) by plotting the peak-area ratio of dovitinib to the IS (y axis) as a function of the concentrations of dovitinib (x axis). The calibration plot of dovitinib was constructed in the range of 5–500 ng mL−1 (mouse plasma). The LLOQ of the calibration graph was determined as well as the lowest detected concentration (LOD). The LOD and LLOQ were assessed as recommended by the Pharmacopeia method,19 using the standard deviation (SD) of the intercept and slope of the calibration plot. LOD = 3.3 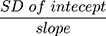 , whereas LLOQ = 10
  .
.
Accuracy and Precision
The precision and accuracy of the investigated method were evaluated at the calibration range using the three QC samples. Analyses were performed on a single day and on three separate days. Accuracy was defined as the recovery percentage or relative error (RE %) while precision was expressed as percentage relative (RSD %) or SD. The RE % is expected to be within 15%15 and the RSD % indicates the accuracy and precision.
Stability and Dilution Integrity
To determine the stability of dovitinib in mouse plasma, the accuracy and precision of three freshly prepared QC samples were analyzed under the following diverse conditions. Short-term stability (bench-top storage for 6 hrs), storage at 4°C for 24 hrs, and long-term storage at −20°C for 4 weeks and three freeze-thaw (−80°C to 25°C) cycles.
Dilution integrity was examined to determine if the drug concentration was higher than the highest points of the calibration curve, which would suggest it should be diluted prior to analysis using the investigated method. The test was performed using a freshly prepared solution of dovitinib with a concentration that was 1.8 fold higher than that of the highest point of the calibration curve. This concentration was then diluted two or four times in mouse plasma. The resulting dovitinib samples were each assessed in triplicate (n = 3) using the recommended procedure. The integrity of the diluted samples was accepted if the recovery was within ±15%.
Pharmacokinetic Study
Animal Test
The pharmacokinetic experiment was conducted using 10–12-week-old Swiss Albino mice (weighing approximately 25–30 gm) from the Experimental Animal Care Center, Faculty of Pharmacy, King Saud University. Mice were kept in our laboratory for 2 days under standard humidity, temperature and illumination (12-hrs light-dark cycle). The mice were also fed a standard diet and provided with water. All animal experiments were conducted in accordance with the guidelines of the National Institutes of Health (NIH, Bethesda, MD, USA) and the legal requirements in Saudi Arabia for experiments with animals and humans. This study was approved by my institutional review board or ethics committee by our university (Ethics Reference No: SE-19-102).
Pharmacokinetic Study of Dovitinib in Mice
After housing the mice in a small animal house for 2 days, they were arbitrarily distributed into 12 groups of three mice each. Mice were injected with dovitinib dissolved in DMSO and further diluted with normal saline to the required volume, which was orally administered by gavage as a single dose of 30 mg kg−1 to 11 groups. The remaining group was injected with DMSO in normal saline to obtain untreated mouse plasma (Blank). The injection volume was 0.01 mL g−1 body weight. All efforts were made to minimize pain, distress, and animals suffering. Blood samples (1 mL) were withdrawn from the heart of each animal at 1, 1.5, 2, 3, 4, 5, 6, 8, 18, 22, and 24 into tubes containing heparin (5 μL of 1000 IU mL−1) as an anticoagulant. Plasma was separated from the blood by centrifugation at 25°C and stored at −20°C until the analysis.
Results and Discussion
Chromatographic Separation and MS Detection
Parameters affecting the chromatographic separation were optimized to obtain the highest separation, resolution, and peak shape in the shortest separation time. Methanol and ACN were included in the mobile phase as organic modifiers. The optimum conditions for separation of dovitinib and IS were investigated using a mixture of ammonium formate (10 mM) and ACN (68:32, v/v, pH 4.3) as the mobile phase. The mobile phase provided good separation conditions for dovitinib with a good peak shape, acceptable selectivity, and excellent resolution. The separation time for dovitinib and bosutinib were 1.3 and 3.36 mins, respectively, which indicated a good separation factor that enhances the high resolution, and thereby increased the sensitivity (Figure 2). The optimum pH of the carrier phase, which facilitates ionization of the analytes and improves the peak symmetry, was determined. Subsequently, the mobile phase constituents and pH were simultaneously investigated. The mixture of ammonium formate (pH 4.3):ACN (68:32, v/v) was selected as the optimum mobile phase for use in the isocratic mode.
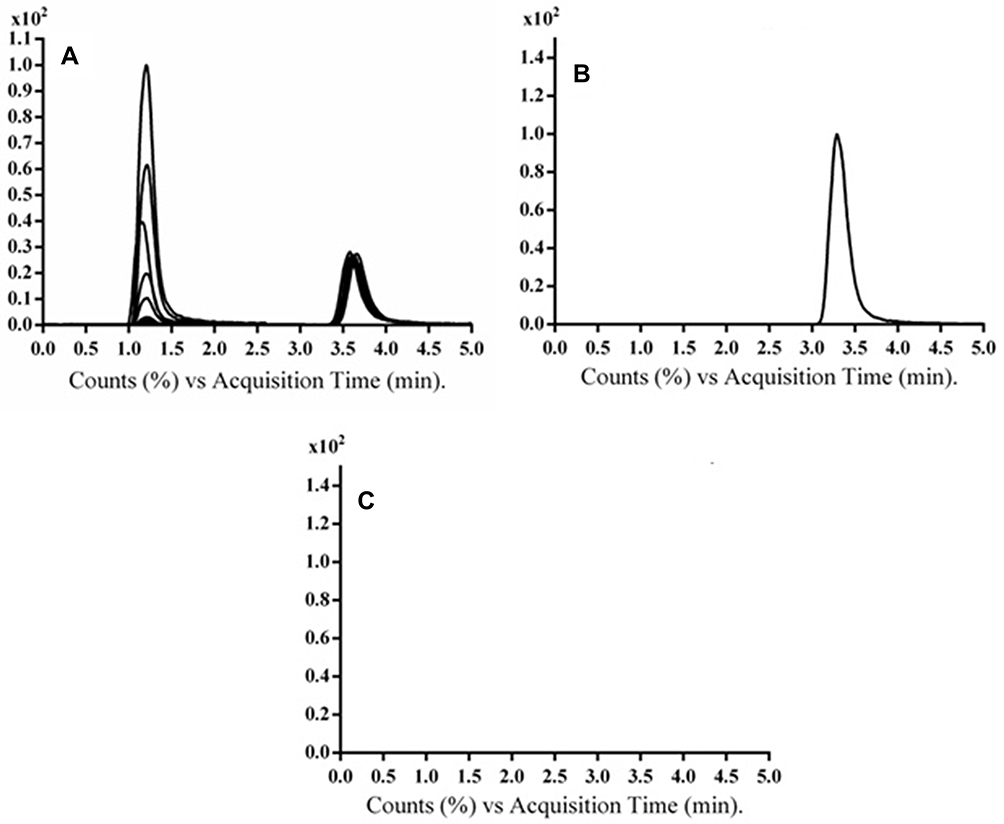 |
Figure 2 TIC chromatogram of MRM (A) DOV (5, 10, 20, 50, 100, 200, 400, 500 ng mL−1, respectively, and IS (100 ng mL−1), (B) Blank plasma with IS and (C) Blank plasma. Notes: Chromatographic Conditions: The mobile phase was a mixture of 10mM ammonium formate: acetonitrile (68:32, pH 4.3) (v/v) and MRM of the dovitinib was at 393→337 and 393→309, while for IS, MRM was 530→141 and 530→113. |
To enhance the ionization ability of the parent and major product of dovitinib and the IS, the MS detection parameters were carefully examined. The MRM mode was selected to eliminate possible interfering signals and simultaneously enhance the specificity of the developed method. The positive ion scan of the tested drug mainly revealed a single ion at m/z 393 and 530 for dovitinib and bosutinib (IS), respectively. The positive product ion scan of dovitinib (m/z 393) yielded two major ions at [M+H]+ m/z 337 and 309. Similarly, the ion scan of the IS (m/z 530) showed two major ions at [M+H]+ m/z 141 and 113. The major ions of dovitinib and the IS were chosen for quantification in the MRM mode. Typical MRM mass spectra of dovitinib and IS are presented in Figure 3.
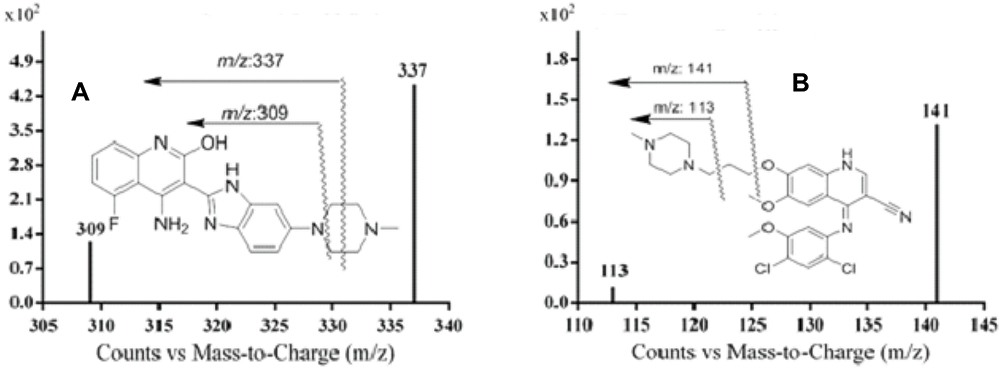 |
Figure 3 MRM mass spectra of (A) DOV and (B) bosutinib (IS). |
Extraction, Matrix Effect
The recovery efficiency of the drug extraction procedure was tested using solid phase or liquid-liquid extraction of mouse plasma using ACN as the protein precipitant. The protein precipitation procedure proved to be a suitable procedure for extracting dovitinib form mouse plasma, exhibiting good selectivity, high recovery, and low matrix effect. The extraction recovery, SD, and RSD of the dovitinib QC samples were 97.98%, 0.14 and 0.54%, respectively, whereas the average matrix effect of mouse plasma was 3.5%. The matrix effect was very low with an RSD ≤ 3.5% for all QC samples, which indicated that the extraction procedure exhibited no matrix effect.
Validation
Specificity
The total ion chromatogram (TIC) of the MRM method showed that no similar peaks were monitored near the retention times of dovitinib and bosutinib in the mouse plasma. Figure 2 shows the MRM of the TIC chromatograms of dovitinib and the IS, blank plasma with the IS, and blank plasma. Furthermore, the proposed HPLC method revealed no carry-over effect of blank samples injected after dovitinib injection at the upper concentration level. Dovitinib and bosutinib were well separated under the optimum conditions with elution times of 1.3 and 3.36 min, respectively.
Linearity and Sensitivity
The developed method was reproducible and sensitive for assaying dovitinib in mouse plasma. Based on the linear-regression analysis of the calibration plot extracted from the calibration curve, the constructed calibration graph was linear from 5–500 ng mL−1 (r2 ≥ 0.9998) in mouse plasma matrices. The regression equation of the plot for dovitinib was y = 0.6127 X −3.176, while the LOD and LLOQ were (1.55) and 4.72 ng mL−1, respectively. The high r2 of the plot indicated the good linearity of the investigated method over the relevant concentration range.20,21 The low SD value of the slope and intercept indicated the precision of the calibration plot (Table 1). Calibration of dovitinib samples in the mouse plasma matrix (eight points) (Figure 4) was back-calculated for method validation. The precision was expressed as RSD and did not exceed 3.22%, whereas, the SD ranged from 0.18 to 3.78 (Table 2). The recovery of dovitinib in mouse plasma was in the range of 98.175% to 112.2% with an RE% ranging from 2.82% to 12.2% (Table 3). The results confirmed that the developed method was highly efficient.
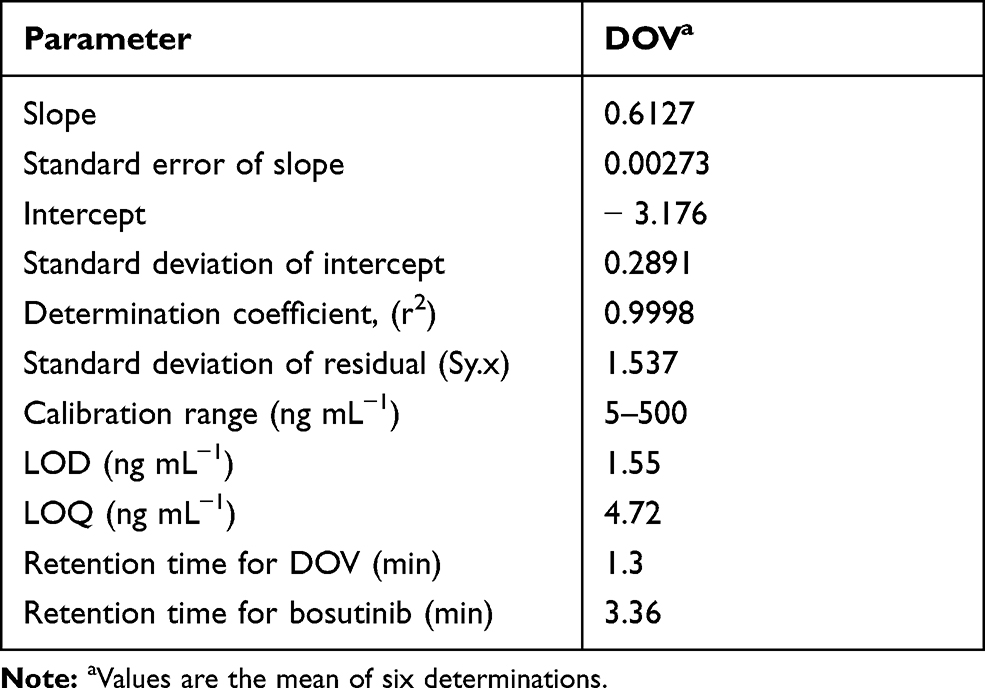 |
Table 1 Analytical Parameters of DOV Using the Proposed HPLC-MS Method |
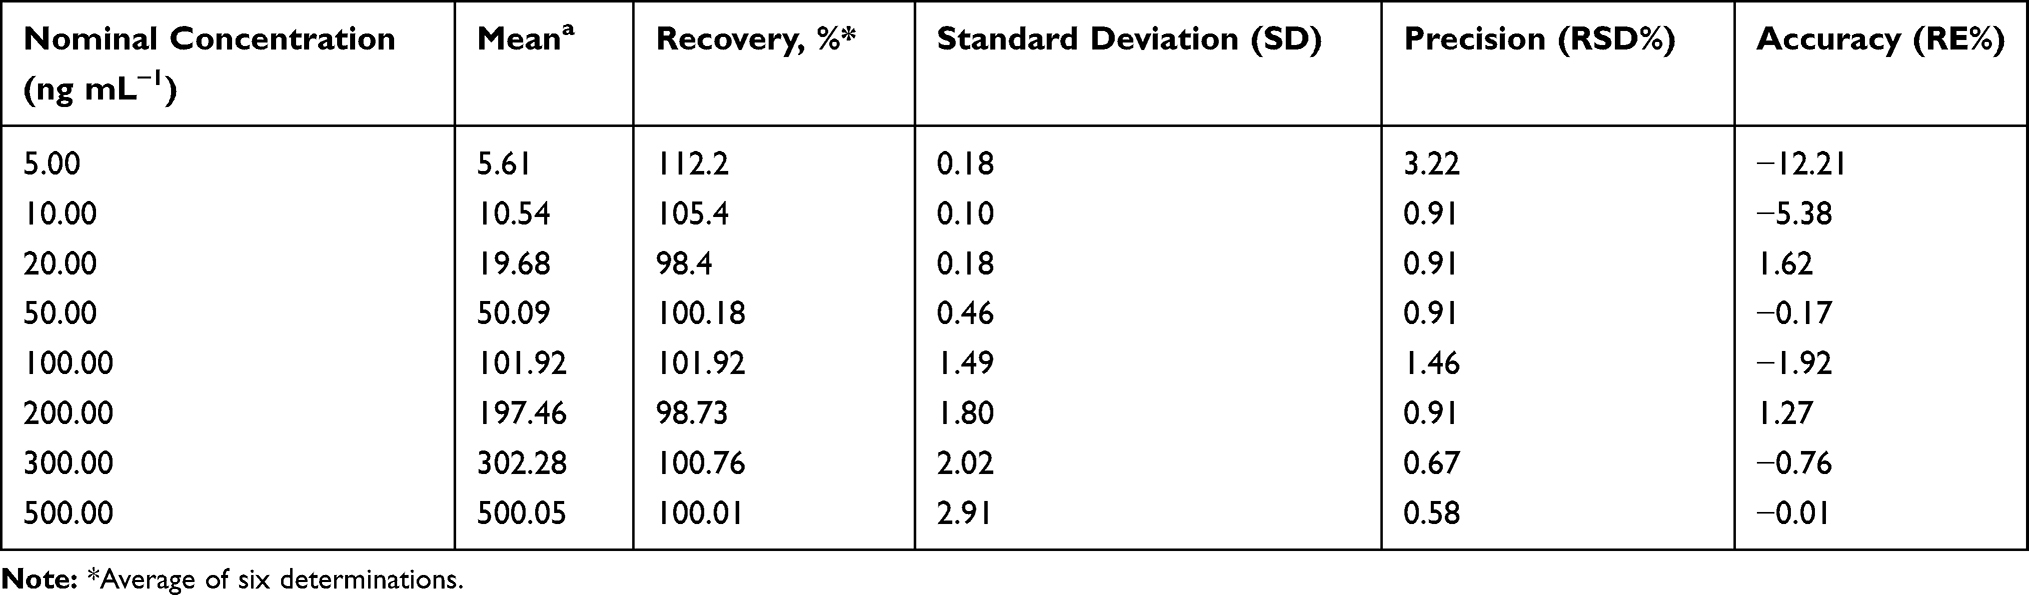 |
Table 2 Data of Back-Calculated DOV Concentration of the Calibration Standards |
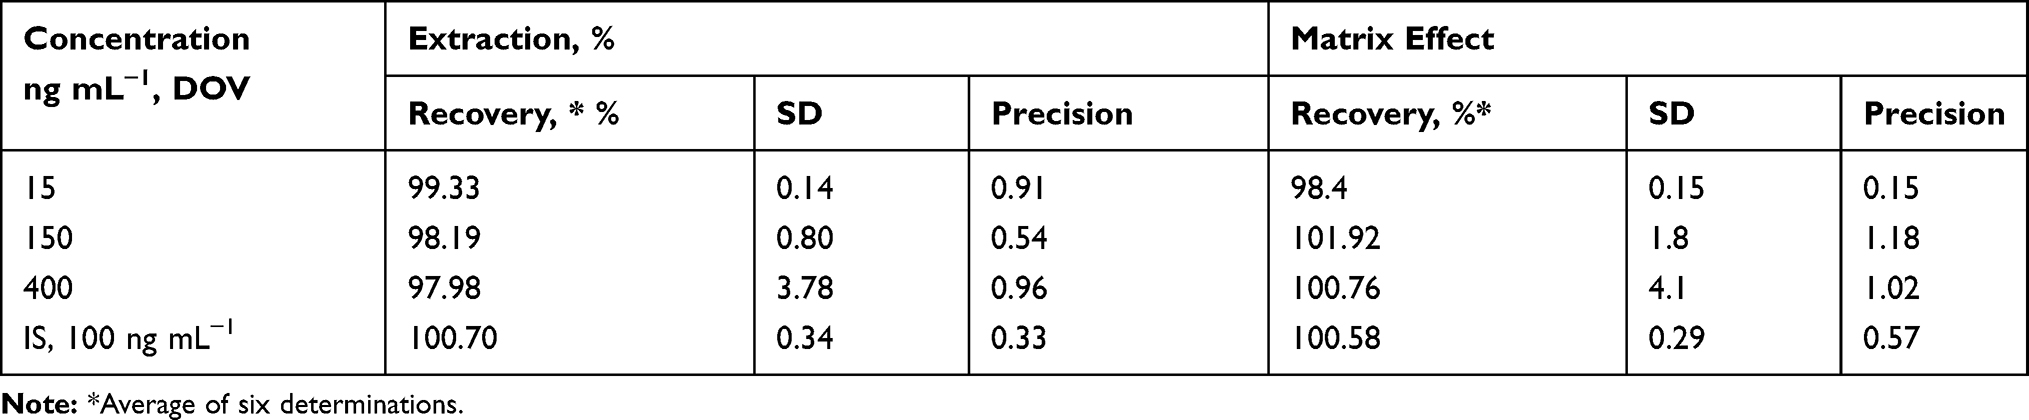 |
Table 3 Extraction Recovery and Matrix Effect of DOV and IS Using the Proposed Method |
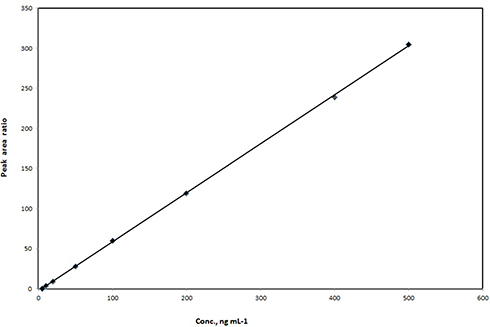 |
Figure 4 Calibration curve of dovitinib. |
Accuracy and Precision
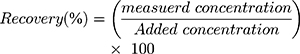
The developed method was examined to verify the reproducible of the dovitinib QC sample analysis using intra-day and inter-days accuracy and precision analysis. Accuracy was expressed as RE % error, or percentage recovery, or both, whereas precision was expressed as RSD %.15 Overall, the intra-day recovery and RSD of the QC samples were 97.24% and 1.32%, respectively, whereas the overall inter-day accuracy and precision were 97.99% and 0.54%, respectively. Table 4 shows the accuracy and precision values of the QC, and our results aligned with the recommended values in the FDA guideline.15
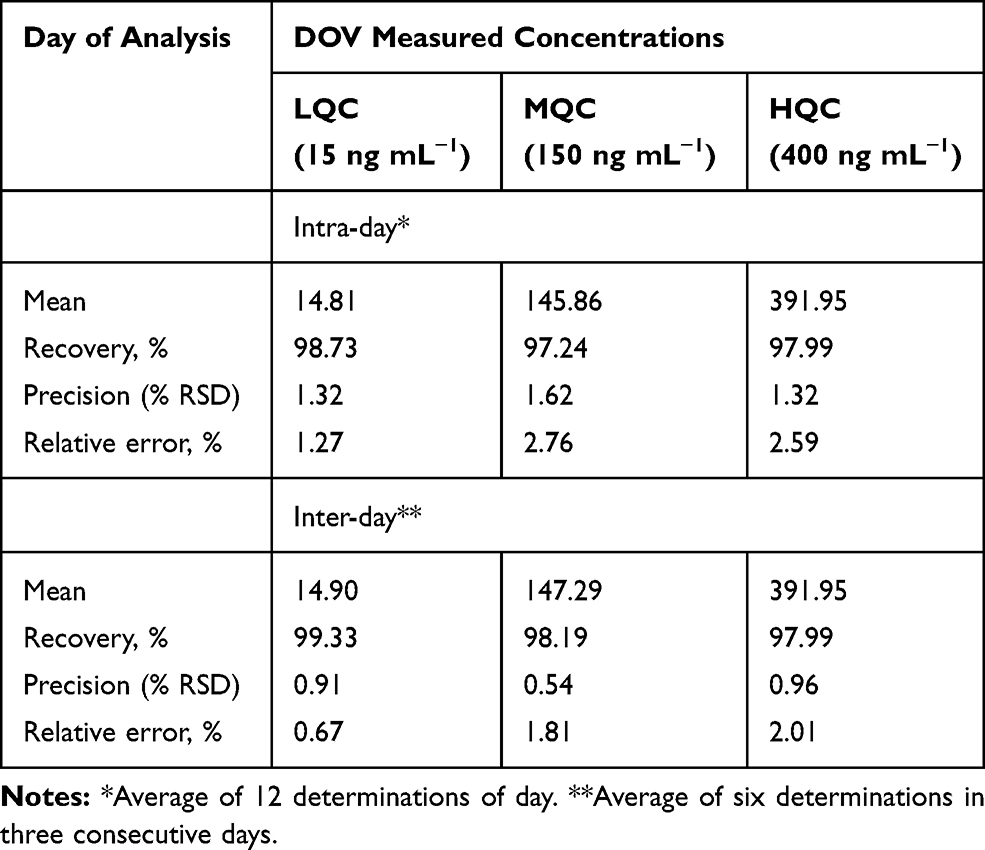 |
Table 4 Accuracy and Precision and of the Investigated HPLC-MS Method |
Stability
QC samples were tested to investigate the stability of dovitinib under different conditions. Short-term (storage at 25°C for 6 hrs and 4°C for 24 hrs) and long-term (storage at −20°C for 4 weeks, and three freeze-thaw cycles at −80°C room temperature) stability of dovitinib in mouse plasma were investigated (Table 5). The deviation of dovitinib under different conditions was ≤7.3% (RE %) compared to the actual concentration with an RSD % ≤ 4.01. Our results demonstrated that dovitinib was stable during sample storage (4°C for 24 hrs and 25°C for 6 hrs) and handling.
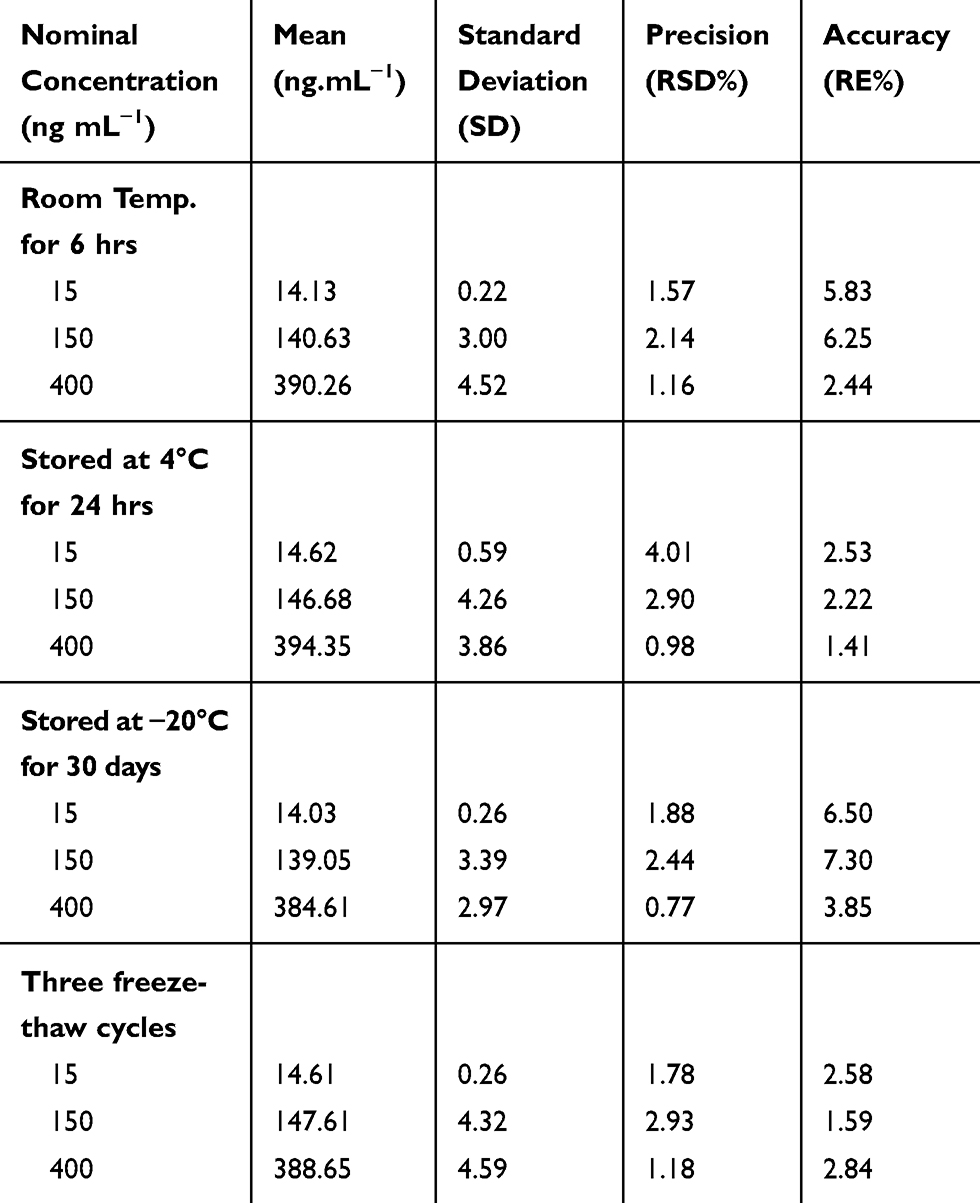 |
Table 5 Stability Data of DOV in Mouse Plasma |
The dilution integrity results of the developed method (Table 6) indicated good recovery (97–99%) and RSD (0.5–0.7%) values, ultimately confirming that the accuracy and precision were within the acceptable range. These findings indicate that a sample with a concentration higher than the ULOQ could be diluted and assessed using the developed method with high efficiency.
 |
Table 6 Dilution Integrity of DOV Using the Proposed HPLC-Mass Method |
No eluted peaks were recorded at the LLOQ of the analyte or IS (peak area ≥20% and ≥5% for IS, respectively) in the chromatograms of blank plasma samples injected after the highest concentration of dovitinib (Figure 2). Therefore, the carry-over effect was not significant in this study.
Pharmacokinetic Study
The validate HPLC-MS/MS method was used to conduct a preliminary pharmacokinetic study of dovitinib in mice. After treatment with dovitinib, the concentration in mouse plasma was assessed at different times and a plasma concentration–time curve of dovitinib was plotted as shown in Figure 5, which enabled the determination of the area under the plasma concentration–time curve (AUC). This curve was then used to calculate the main pharmacokinetic parameter of dovitinib. Following administration of dovitinib at 30 mg kg−1, the mean maximum plasma concentration (Cmax) and time at maximum concentration (Tmax) were 373.4 ± 38.9 ng mL−1 and 2 hrs, respectively. No peaks similar to those obtained for dovitinib were seen with plasma samples of untreated control mice (Figure 2).
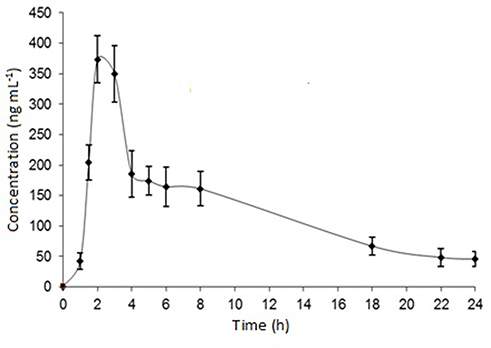 |
Figure 5 Concentration-time profile of dovitinib in mice plasma after oral gavage administration of 30 mg kg−1 of dovitinib. Each point represents the mean ± S.D. |
Conclusions
In this study, we developed and validated an HPLC-MS/MS technique using ESI in the positive mode to assay dovitinib following extraction from in mouse plasma using a protein precipitation procedure, with bosutinib as the IS. The assay range was 5–500 ng mL−1 with an LOD and LLOQ of (1.55) and 4.72 ng mL−1, respectively, and chromatographic run time of 5 mins. A comparison of the investigated method with previously published methods showed that all the parameters of the present assay were validated according to the FDA guideline. In addition, we demonstrated the stability of dovitinib following sample storage and handling under different conditions. Finally, a pharmacokinetic study of dovitinib in mouse plasma was effectively performed using the developed method that confirmed its high precision and potential applicability to therapeutic drug evaluation studies.
Acknowledgment
The authors would like to extend their sincere appreciation to the Deanship of Scientific Research at the King Saud University for funding this work through the Research Group Project No. RGP-1436- 024.
Disclosure
The authors declare no conflicts of interest.
References
1. Roskoski R. Src protein-tyrosine kinase structure, mechanism, and small molecule inhibitors. Pharmacol Res. 2015;94:9–25. doi:10.1016/j.phrs.2015.01.003
2. Gómez X, Valdez N, Paredes R. Tyrosine kinase inhibitors for the treatment of non-small cell lung cancer: an unattended need. Rev Peru Med Exp Salud Publica. 2017;34:349–350. doi:10.17843/rpmesp.2017.342.2690
3. Hartmann JT, Haap M, Kopp HG, Lipp HP. Tyrosine kinase inhibitors-a review on pharmacology, metabolism and side effects. Curr Drug Metab. 2009;10(5):470–481. doi:10.2174/138920009788897975
4. André F, Bachelot T, Campone M, et al. Targeting FGFR with dovitinib (TKI258): preclinical and clinical data in breast cancer. Clin Cancer Res. 2013;19:3693–3702. doi:10.1158/1078-0432.CCR-13-0190
5. Hasinoff BB, Wu X, Nitiss JL, Kanagasabai R, Yalowich JC. The anticancer multi-kinase inhibitor dovitinib also targets topoisomerase I and topoisomerase II. Biochem Pharmacol. 2012;84:1617–1626. doi:10.1016/j.bcp.2012.09.023
6. Dubbelman AC, Upthagrove A, Beijnen JH, et al. Disposition and metabolism of 14 C-dovitinib (TKI258), an inhibitor of FGFR and VEGFR, after oral administration in patients with advanced solid tumors. Cancer Chemother Pharmacol. 2012;70:653–663. doi:10.1007/s00280-012-1947-2
7. Angevin E, Lopez-Martin JA, Lin CC, et al. Phase I study of dovitinib (TKI258), an oral FGFR, VEGFR, and PDGFR inhibitor, in advanced or metastatic renal cell carcinoma. Clin Cancer Res. 2013;19:1257–1268. doi:10.1158/1078-0432.CCR-12-2885
8. Azab AK, Azab F, Quang P, et al. FGFR3 is overexpressed Waldenström macroglobulinemia and its inhibition by Dovitinib induces apoptosis, and overcomes stroma-induced proliferation. Clin Cancer Res. 2011;17:4389–4399. doi:10.1158/1078-0432.CCR-10-2772
9. Keam B, Kim SB, Shin SH, et al. Phase 2 study of dovitinib in patients with metastatic or unresectable adenoid cystic carcinoma. Cancer. 2015;121:2612–2617. doi:10.1002/cncr.29401
10. Lim SM, Chung WY, Nam KH, et al. An open label, multicenter, Phase II study of dovitinib in advanced thyroid cancer. Eur J Cancer. 2015;51:1588–1595. doi:10.1016/j.ejca.2015.05.020
11. Wang X, Kay A, Anak O, et al. Population pharmacokinetic/pharmacodynamic modeling to assist dosing schedule selection for dovitinib. J Clin Pharmacol. 2013;53:14–20. doi:10.1177/0091270011433330
12. Kim KB, Chesney J, Robinson D, Gardner H, Shi MM, Kirkwood JM. Faze I/II and pharmacodynamic study of dovitinib (TKI258), an inhibitor of fibroblast growth factor receptors and VEGF receptors, in patients with advanced melanoma. Clin Cancer Res. 2011;17:7451–7461. doi:10.1158/1078-0432.CCR-11-1747
13. Das M, Padda SK, Frymoyer A, et al. Dovitinib and erlotinib in patients with metastatic non-small cell lung cancer: a drug–drug interaction. Lung Cancer. 2015;89:280–286. doi:10.1016/j.lungcan.2015.06.011
14. Sarker D, Molife R, Evans TJ, et al. A phase I pharmacokinetic and pharmacodynamic study of TKI258, an oral, multitargeted receptor tyrosine kinase inhibitor in patients with advanced solid tumors. Clin Cancer Res. 2008;14:2075–2081. doi:10.1158/1078-0432.CCR-07-1466
15. US Food and Drug Administration. Guidance for Industry: Bioanalytical Method Validation. Rockville, MD: US Department of Health and Human Services, Food and Drug Administration, Center for Drug Evaluation and Research and Center for Veterinary Medicine; 2013.
16. Kadi AA, Alrabiah H, Attwa MW, Attia S, Mostafa GA. Development and validation of HPLC‐MS/MS method for the determination of lixivaptan in mouse plasma and its application in a pharmacokinetic study. Biomed Chromatogr. 2017;31:e4007. doi:10.1002/bmc.4007
17. Alrabiah H, Kadi AA, Attwa MW, Mostafa GA. Development and validation of an HPLC–MS/MS method for the determination of arginine-vasopressin receptor blocker conivaptan in human plasma and rat liver microsomes: application to a metabolic stability study. Chem Cent J. 2018;12:47. doi:10.1186/s13065-018-0414-5
18. Smith G. European medicines agency guideline on bioanalytical method validation: what more is there to say? Bioanalysis. 2012;4:865–868. doi:10.4155/bio.12.44
19. The United State Pharmacopoeia. Convention.
20. Miller JN, Miller JC. Statistics and Chemometrics for Analytical Chemistry.
21. Shabir GA. Validation of high-performance liquid chromatography methods for pharmaceutical analysis: understanding the differences and similarities between validation requirements of the US Food and Drug Administration, the US Pharmacopeia and the International Conference on Harmonization. J Chromatography A. 2003;987:57–66.
 © 2020 The Author(s). This work is published and licensed by Dove Medical Press Limited. The
full terms of this license are available at https://www.dovepress.com/terms
and incorporate the Creative Commons Attribution
- Non Commercial (unported, 3.0) License.
By accessing the work you hereby accept the Terms. Non-commercial uses of the work are permitted
without any further permission from Dove Medical Press Limited, provided the work is properly
attributed. For permission for commercial use of this work, please see paragraphs 4.2 and 5 of our Terms.
© 2020 The Author(s). This work is published and licensed by Dove Medical Press Limited. The
full terms of this license are available at https://www.dovepress.com/terms
and incorporate the Creative Commons Attribution
- Non Commercial (unported, 3.0) License.
By accessing the work you hereby accept the Terms. Non-commercial uses of the work are permitted
without any further permission from Dove Medical Press Limited, provided the work is properly
attributed. For permission for commercial use of this work, please see paragraphs 4.2 and 5 of our Terms.