Back to Journals » Clinical Ophthalmology » Volume 10
A new device to noninvasively estimate the intraocular pressure produced during ocular compression
Authors Korenfeld M, Dueker D
Received 23 July 2015
Accepted for publication 19 September 2015
Published 12 January 2016 Volume 2016:10 Pages 71—77
DOI https://doi.org/10.2147/OPTH.S92954
Checked for plagiarism Yes
Review by Single anonymous peer review
Peer reviewer comments 3
Editor who approved publication: Dr Scott Fraser
Video abstract presented by Dr Michael S Korenfeld.
Views: 2065
Michael S Korenfeld,1,2 David K Dueker3
1Comprehensive Eye Care, Ltd., 2Department of Ophthalmology and Visual Sciences, Washington University, Washington, MO, USA; 3Hamad Medical Corporation, Doha, Qatar
Purpose: To describe a noninvasive instrument that estimates intraocular pressure during episodes of external globe compression and to demonstrate the accuracy and reliability of this device by comparing it to the intraocular pressures simultaneously and manometrically measured in cannulated eyes.
Methods: A thin fluid-filled bladder was constructed from flexible and inelastic plastic sheeting and was connected to a pressure transducer with high pressure tubing. The output of the pressure transducer was sent to an amplifier and recorded. This device was validated by measuring induced pressure in the fluid-filled bladder while digital pressure was applied to one surface, and the other surface was placed directly against a human cadaver eye or in vivo pig eye. The human cadaver and in vivo pig eyes were each cannulated to provide a manometric intraocular pressure control.
Results: The measurements obtained with the newly described device were within ~5% of simultaneously measured manometric intraocular pressures in both a human cadaver and in vivo pig eye model for a pressure range of ~15–100 mmHg.
Conclusion: This novel noninvasive device is useful for estimating the intraocular pressure transients induced during any form of external globe compression; this is a clinical setting where no other devices can be used to estimate intraocular pressure.
Keywords: glaucoma, intraocular pressure, tonometer, ocular compression
Introduction
Many noninvasive devices that estimate intraocular pressure have been invented over the last century. Most deform the globe and correlate the force responsible for the deformation to the pressure within the eye. Most physically contact the globe while in use (Schiotz, Goldmann, Draeger, Perkins, Mackay-Marg, Tono-pen, pneumatonometer, and Maklakov) while others do not (air puff tonometer). The mechanisms and scientific premises that underlie these instruments are well-described.1 Another germane device is the contact lens tonometer.2 This transparent device is applied directly to the globe while in use. In order for the device to produce meaningful measurements, it must be held in a specific orientation upon the eye by an examiner who must also ensure that the space between the contact lens and the cornea is filled with fluid. If the lens is not well centered on the cornea, the three internal pressure sensors will measure very different externally applied appositional forces. External appositional forces can be indirectly applied to the globe by applying force to the contact lens and the resulting artificially raised intraocular pressure can be estimated; ocular pulsations are also measureable with this device and are seen superimposed on the continuous intraocular pressure tracings. Because the device is transparent, it can be used to observe the retinal vasculature while the appositional force is increased. It is therefore suited to perform ophthalmodynomometry.
Unfortunately, it would be impossible to properly utilize any of these devices while a subject’s eyelids were closed and their globe was being externally compressed. Since this clinical situation does arise, a novel ocular pressure estimator (OPE) was invented with this application in mind. Generally, it is accepted that the aforementioned noninvasive devices only “estimate” the intraocular pressure. The gold standard for measuring “true” intraocular pressure is the cannulated eye, which provides direct manometric measurements. The OPE was therefore tested in the most rigorous fashion, on cannulated eyes that were simultaneously providing manometric measurements.
To better acquaint the reader with the hypothesis that underlies the mechanism of the OPE, the following examples and schematic diagrams are offered.
When two or more hollow vessels, with similar wall compliances, are filled with air or a liquid, and are placed into contact with one another, if an external pressure is applied to one of the vessels, the pressure inside both vessels becomes the same:
Example 1: If two tennis balls are placed into a can, and the outermost ball is compressed, the pressure inside both balls becomes the same (Figure 1). In this example, the balls are made of the same material and have the same wall thickness. The tennis ball analogy is intended to convey the general principle of the OPE.
 | Figure 1 A schematic that describes the hypothesis of the OPE is shown. |
Example 2: If a noncompressible, but flexible, septum of any thickness (like a sheet of leather) is placed between the two tennis balls, and the outermost ball is compressed, the pressure inside both balls becomes the same (Figure 1).
Example 3: If a compressible and flexible septum (like a flat sponge) is introduced between the two tennis balls, in a range of thicknesses that are on the order of 20% or less than the diameter of the tennis balls, and the outermost ball is compressed, the force of the compression will initially only be partially conveyed to the second ball, until all of the potential compression within the septum has occurred, and then the septum acts like it is noncompressible (like in Example 2), and then the pressure inside both balls, and the collapsed septum, becomes the same (Figure 1).
Example 4: The OPE’s fluid-filled bladder was constructed from flexible, but inelastic plastic sheeting. This was chosen to match the wall compliance, but not the thickness, of an intact globe. It is impractical to construct a pressure transducer from a cadaver globe and the volume of such a cadaveric transducer anterior to a person’s intact globe would prevent meaningful measurements in clinical practice. The fluid-filled bladder of the OPE was designed to address these issues. Using the fluid-filled bladder of the OPE in vivo in humans over their closed eyelids is analogous to Example 3 above. Once the eyelid under the fluid-filled bladder was fully compressed by the external force applied to the outer wall of the fluid-filled bladder, the pressure of the globe, the fully compressed lid, and the OPE became the same. The lid thickness is not important, only that it is fully compressed before the pressures in all three locations become the same (Figure 1).
Methods
The fluid-filled bladder of the OPE (Figure 2) was constructed by heat sealing a flexible but inelastic plastic sheet around a polyethylene tube (PE-50, Intramedic, Clay Adams, Parsippany, NJ, USA) so that all heat-sealed junctions were water tight up to pressures of 200 mmHg. The portion of the polyethylene tube that was fused into the plastic bladder was friction fit onto a short segment of a blunt-ended shaft of a broken 23-gauge needle, which served to bridge the fluid-filled bladder portion to the length of the polyethylene tubing that was attached to the three-way stopcock, 0.5 m away. The stopcock was attached by a high-pressure hose to a pressure transducer (Model PX-105, Omega Engineering, Inc., Stamford, CT, USA). A bottle of sterile balanced salt solution (BSS, Alcon Surgical, Inc., Fort Worth, TX, USA) was connected to the three-way stopcock with high pressure hosing. A continuous fluid column without air bubbles was thus formed between the calibrated BSS bottle, the stopcock, the pressure transducer, the polyethylene tubing, and the fluid-filled plastic bladder (Figure 3). The amplifier circuitry was designed to produce a linear amplification of the pressure transducer’s signal output. The signal output produced by the pressure transducer was sent to this amplifier circuit and then to a strip chart recorder (Omega Engineering, Inc., RD-MV/Volt module with a series RD-2000 Function Recorders Mainframe).
 | Figure 2 The portion of the OPE that contacts the eye is shown in the fluid-filled and ready-to-use state. |
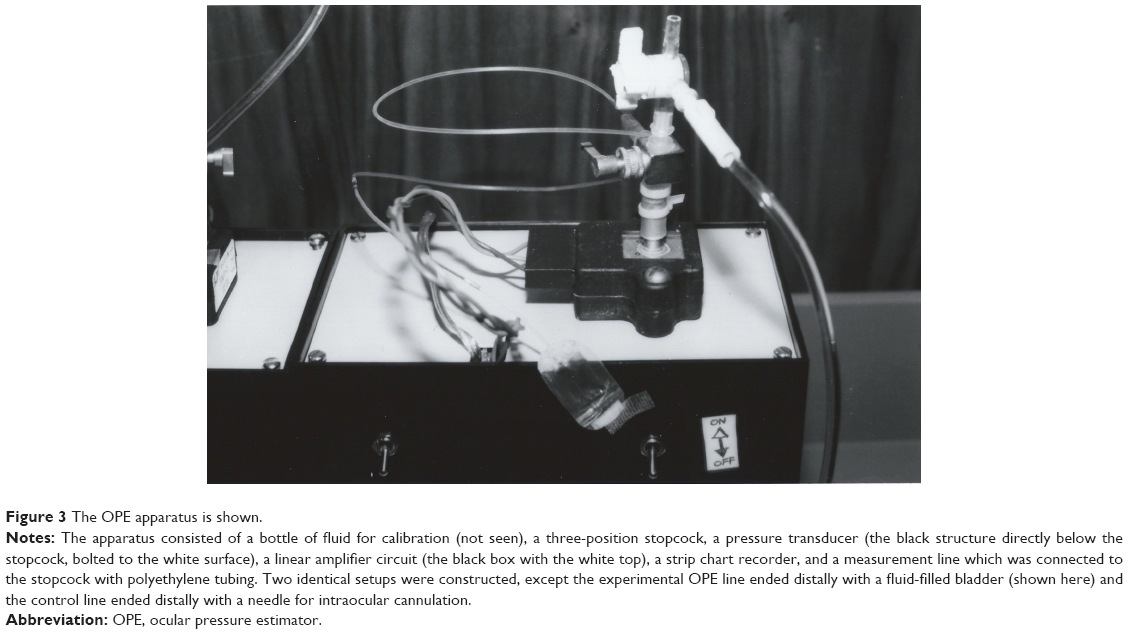 | Figure 3 The OPE apparatus is shown. |
In order to validate the OPE, an additional control setup was also constructed. It consisted of all of the same components, and the output of the two amplifier circuits was electronically matched. The only difference between the two setups was that the OPE ended distally with the heat-sealed plastic bladder and the control device ended distally with a needle for intraocular manometric readings. The needle for the human cadaver eye had the fluid column emerge from the distal sharp end, while the fluid column for the anterior segment needle ended at a slot drilled half way along the needle’s shaft so that the aqueous humor completed the fluid continuum; the sharp end of the needle was occluded with cyanoacrylate glue for the anterior segment experiments prior to placement.
The plastic bladder was held at the same level as the pressure transducer during calibrations. The calibrating BSS bottle was raised above the zero level (transducer level) in height increments corresponding to 10 mmHg. A linear response was confirmed over the range of 0–120 mmHg.
After calibration of the transducer, the system was brought to zero pressure by lowering the BSS bottle, and the BSS bottle was then cut off from the system with the stopcock. This left the fluid-filled bladder in sole connection with the transducer at nominal zero pressure. At this point, the fluid-filled bladder was ~1.5 mm thick and was ready for use (Figure 2). The following experiments were performed to validate the OPE.
For the first experiment, a 19-gauge needle was broken from the hub and was fitted into polyethylene tubing (PE-100, Intramedic, Clay Adams) that was connected to the control transducer/amplifier setup previously described. A fresh human donor globe was cannulated through the length of the optic nerve with this needle. The fluid in the needle lumen formed a liquid continuum with the vitreous body. The needle was passed while fluid was running through it to reduce the chance of tissue plugging the lumen and to eliminate air bubbles in the line. Once in place, the calibrating bottle was elevated from the level of the globe in 10 mmHg increments to 200 mmHg to confirm the lack of leaks and to confirm the expected linear increments of intraocular pressure with known increments in bottle height. The calibrating bottle was lowered to the equivalent of 15 mmHg and the stopcock system was used to isolate the globe and the transducer from the calibrating bottle. The globe was then placed within a mock orbit that consisted of a rigid Styrofoam box filled with a hydrated sponge with holes carved out for the globe and the optic nerve. A latex surgical glove was draped over the globe to simulate the closed eyelid (Figure 4).
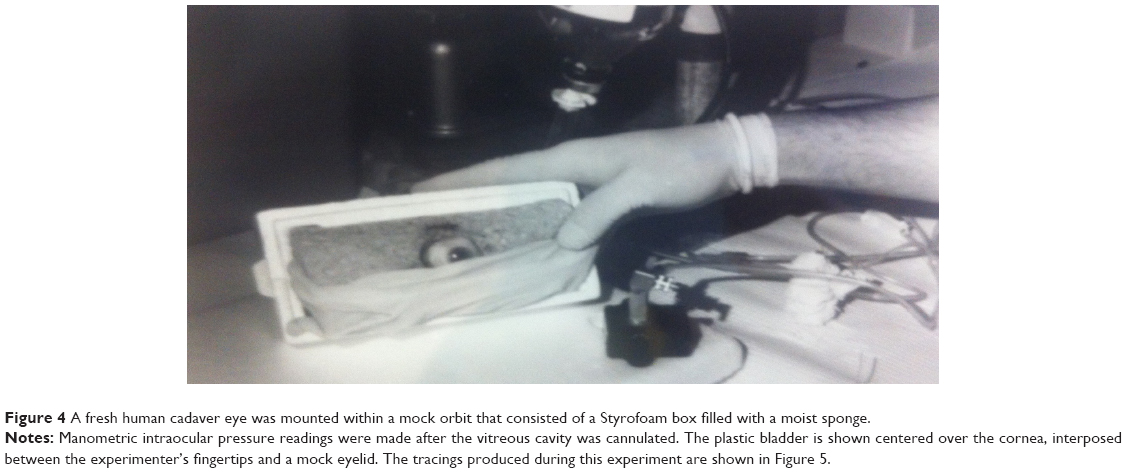 | Figure 4 A fresh human cadaver eye was mounted within a mock orbit that consisted of a Styrofoam box filled with a moist sponge. |
The OPE was prepared and calibrated as previously described. The fluid-filled bladder was placed on the mock eyelid and digital pressure was applied through it to the globe. Variable amounts of digital pressure were applied in a manner similar to the technique used after glaucoma filtration surgery to enhance filtration function. Pressures within the plastic bladder and the manometrically cannulated globe were simultaneously and continuously recorded (Figure 5).
 | Figure 5 The simultaneous tracings produced during the human cadaver eye experiments are shown. |
In another experiment, the OPE was evaluated on the eye of a live, anesthetized pig. A 40 kg pig undergoing terminal anesthesia for a urologic procedure was used for this experiment. Ethical and legal approval was obtained prior to the commencement of the study. This was provided by the University of Missouri-Columbia, Columbia, Missouri. All experiments performed in support of this paper were performed in accordance with the tenets of the Declaration of Helsinki and followed relevant institutional and national guidelines and regulations. Animal use in this study conformed to the Association for Research in Vision and Ophthalmology Resolution on the Use of Animals in Research.
The manometric control measurements for this experiment were obtained with the same setup that was used for the control arm of the human cadaver eye experiments, except that in this experiment, manometric readings were taken from the anterior chamber through a 23-gauge side-slotted needle.
Prior to cannulating the anterior chamber, the nictitating membrane was surgically excised, and a 8 mm lateral canthotomy was performed to improve access to the cornea. The anterior chamber was cannulated by passing the side-slotted needle through the temporal cornea, across the anterior chamber, and out through the nasal cornea. The needle was passed while fluid was running through it to reduce the chance of tissue plugging the lumen and to eliminate air bubbles in the line. The slot drilled in the needle was oriented downward so it would be least likely to encounter tissue during external compressions. The needle was connected via tubing to the control transducer/amplifier setup previously described. The calibrating BSS bottle was raised and lowered in increments equal to 10 mmHg to test for any leaks and to confirm a linear transducer response. Following this, the BSS bottle was brought to a height equivalent to 15 mmHg, and the calibrating BSS bottle was isolated from the transducer with the stopcock, and opened to connect the transducer to the line leading to the needle that ended distally in the anterior chamber of the pig eye. The eye pressure was then recorded without external perturbation to confirm stability.
The fluid-filled bladder was then applied to the closed eyelid centered over the cornea. Digital pressure was applied to the exposed surface of the plastic bladder over a wide range of pressures. Simultaneous and continuous tracings of the OPE and cannulated pig eye were made for induced elevations of pressure above the 20 mmHg baseline. After the experiment, the pressure within the OPE returned to baseline and the pressure within the pig eye came to a new steady state below its initial baseline (Figure 6).
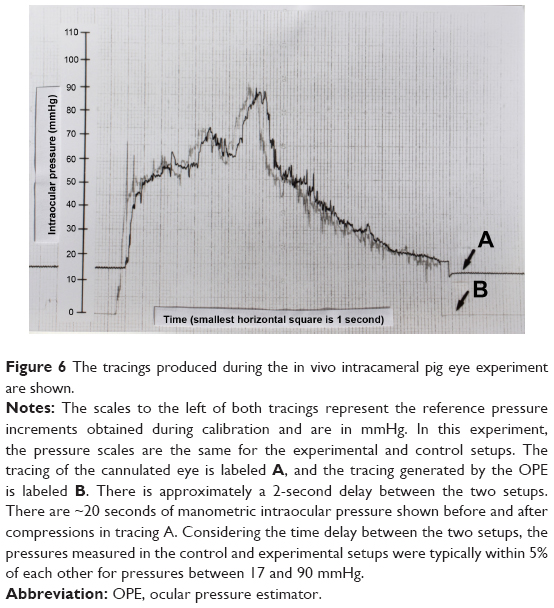 | Figure 6 The tracings produced during the in vivo intracameral pig eye experiment are shown. |
Attempts were also made to obtain simultaneous estimates of intraocular pressure in live human subjects using the OPE and either a hand-held applanation tonometer (Perkins MKII Applanation Tonometer, Clement Park, Inc., Columbus, OH, USA) or a Tono-pen (BioRad, Oculab, Inc., Glendale, CA, USA). Unfortunately, there was not sufficient access to or exposure of the cornea to allow for this method of calibration, and thus, no data are presented.
Results
The manometrically measured intraocular pressures in the human cadaver eye were typically within the 5% of the pressures estimated by the OPE in the range of 15–100 mmHg (Figure 5). Even though the human cadaver eye was calibrated to pressures as high as 200 mmHg, calibration pressures greater than 100 mmHg were not recorded due to the limited scale of the control channel on the strip chart recorder. It is therefore difficult to know if the OPE output remained quantitatively matched to control pressures over 100 mmHg, even though the two tracings closely followed each other over 100 mmHg. There was approximately a 2-second time delay between the two setups.
For the in vivo pig eye experiment, the “baseline” intraocular pressure was “locked into” the globe with the stopcock at ~15 mmHg (tracing A). The pressure within the fluid-filled bladder, when held at the level of the corneal apex but without eye contact, was 0 mmHg (tracing B) (Figure 6). When the fluid-filled bladder was placed upon the eye, and pressure was exerted across the globe, the pressure within the bladder rose until it reached the “locked in” pressure of the globe. As the pressure of the external compression rose above the “locked in” pressure, the tracings of the OPE and the cannulated eye were typically within 5% of each other for a range of ~17–90 mmHg. Once the OPE was in contact with the globe, and the external pressure applied to the fluid-filled bladder was equal to or greater than the intraocular pressure, the experimental system became analogous to Example 4 in the schematic of Figure 1. When the fluid-filled bladder was removed from the globe, the pressure within it returned 0 mmHg and the cannulated eye returned to an intraocular pressure plateau that was 2–3 mmHg below the precompression “locked in” pressure. The lower postcompression plateau was felt to result from a tonographic effect, which was expected in this experiment with a live animal. Note the stability of the manometrically measured intraocular pressure prior to and after external ocular compression, as well as the fine superimposed respiratory variations.
Discussion
It was the intention of this investigation to construct and validate an instrument that could be used to provide some quantification of the intraocular pressure transients that are produced during external ocular compression. The OPE was the result of this effort.
Data obtained from the cannulated eye experiments provide the best substantiation for the validity of the OPE. The experiment with a human cadaver eye had the advantage of placing the manometric needle at a site distant from the corneal compression, minimizing the chance that the two pressure sensing instruments would disturb each other while in use. The OPE was also validated in a live animal model. This experiment confirmed the close agreement of the manometrically measured intraocular pressure and the output of the OPE, first demonstrated with the human cadaver eye, in a mock orbit. When the time delay between the two setups and the different pressure scales are considered, the pressures measured in the control and experimental setups were very closely matched.
The cannulated eye preparations were intact throughout all experimentation. No leaks of the plastic bladder or sites of globe cannulation were ever visualized despite induced pressures of up to 200 mmHg. The soundness of the preparation was confirmed when the postcompression control pressure in the human eye returned to the same level that was “locked in” by the BSS bottle and stopcock before external compressions were performed. There was no tonographic effect expected in a human cadaver eye, and none was seen.
In the pig eye, a tonographic effect was observed. The postcompression pressure plateau was several mmHg lower than the precompression plateau. In addition to the tonographic effect, the fine respiratory pressure variations were also observed to return. The postcompression pressure tracing not only confirms the lack of leaks, but further suggests that the lumen of the intracameral needle was not plugged with tissue. The pressure scale in the pig eye experiment provided a better opportunity to observe these more subtle intraocular pressure effects.
This novel device should be more useful than previously described devices for estimating intraocular pressures during periods of time when the eye experiences externally applied forces. Clinically relevant periods of time when this occurs include during sleep, eye rubbing, and during the digital ocular massage maneuver used by glaucoma surgeons and their patients after trabeculectomy to improve bleb performance. In the future, it is contemplated that a more “user-friendly” device analogous to the OPE would be constructed using the same principles as the ones validated here, but without stopcocks and tubing. This modification will make using the OPE more simple and approachable for clinicians and patients, for use in the clinic and at home.
Disclosure
The authors report no conflicts of interest in this work.
References
Ritch R, et al. Tonometers and tonometry. In: The Glaucomas. St. Louis: The C.V. Mosby Company; 1989:303–312. | ||
Dekker PW, Robert YC, Kanngiesser H, Pirani P, Entenmann B. Principles of contact lens tonometry. Int Ophthalmol. 1999;22(2):105–111. |
 © 2016 The Author(s). This work is published and licensed by Dove Medical Press Limited. The
full terms of this license are available at https://www.dovepress.com/terms
and incorporate the Creative Commons Attribution
- Non Commercial (unported, 3.0) License.
By accessing the work you hereby accept the Terms. Non-commercial uses of the work are permitted
without any further permission from Dove Medical Press Limited, provided the work is properly
attributed. For permission for commercial use of this work, please see paragraphs 4.2 and 5 of our Terms.
© 2016 The Author(s). This work is published and licensed by Dove Medical Press Limited. The
full terms of this license are available at https://www.dovepress.com/terms
and incorporate the Creative Commons Attribution
- Non Commercial (unported, 3.0) License.
By accessing the work you hereby accept the Terms. Non-commercial uses of the work are permitted
without any further permission from Dove Medical Press Limited, provided the work is properly
attributed. For permission for commercial use of this work, please see paragraphs 4.2 and 5 of our Terms.