Back to Journals » International Journal of Chronic Obstructive Pulmonary Disease » Volume 10 » Issue 1
A new approach to assess COPD by identifying lung function break-points
Authors Eriksson G ![]() , Jarenbäck L
, Jarenbäck L ![]() , Peterson S, Ankerst J
, Peterson S, Ankerst J ![]() , Bjermer L
, Bjermer L ![]() , Tufvesson E
, Tufvesson E ![]()
Received 3 April 2015
Accepted for publication 25 May 2015
Published 14 October 2015 Volume 2015:10(1) Pages 2193—2202
DOI https://doi.org/10.2147/COPD.S86059
Checked for plagiarism Yes
Review by Single anonymous peer review
Peer reviewer comments 3
Editor who approved publication: Prof. Dr. Richard Russell
Göran Eriksson,1,* Linnea Jarenbäck,1,* Stefan Peterson,2 Jaro Ankerst,1 Leif Bjermer,1 Ellen Tufvesson1
1Respiratory Medicine and Allergology, Department of Clinical Sciences, Lund University, 2Regional Cancer Center South, Skåne University Hospital, Lund, Sweden
*These authors contributed equally to this work
Purpose: COPD is a progressive disease, which can take different routes, leading to great heterogeneity. The aim of the post-hoc analysis reported here was to perform continuous analyses of advanced lung function measurements, using linear and nonlinear regressions.
Patients and methods: Fifty-one COPD patients with mild to very severe disease (Global Initiative for Chronic Obstructive Lung Disease [GOLD] Stages I–IV) and 41 healthy smokers were investigated post-bronchodilation by flow-volume spirometry, body plethysmography, diffusion capacity testing, and impulse oscillometry. The relationship between COPD severity, based on forced expiratory volume in 1 second (FEV1), and different lung function parameters was analyzed by flexible nonparametric method, linear regression, and segmented linear regression with break-points.
Results: Most lung function parameters were nonlinear in relation to spirometric severity. Parameters related to volume (residual volume, functional residual capacity, total lung capacity, diffusion capacity [diffusion capacity of the lung for carbon monoxide], diffusion capacity of the lung for carbon monoxide/alveolar volume) and reactance (reactance area and reactance at 5Hz) were segmented with break-points at 60%–70% of FEV1. FEV1/forced vital capacity (FVC) and resonance frequency had break-points around 80% of FEV1, while many resistance parameters had break-points below 40%. The slopes in percent predicted differed; resistance at 5 Hz minus resistance at 20 Hz had a linear slope change of -5.3 per unit FEV1, while residual volume had no slope change above and -3.3 change per unit FEV1 below its break-point of 61%.
Conclusion: Continuous analyses of different lung function parameters over the spirometric COPD severity range gave valuable information additional to categorical analyses. Parameters related to volume, diffusion capacity, and reactance showed break-points around 65% of FEV1, indicating that air trapping starts to dominate in moderate COPD (FEV1 =50%–80%). This may have an impact on the patient’s management plan and selection of patients and/or outcomes in clinical research.
Keywords: spirometry, severity, body plethysmography, single-breath carbon-monoxide diffusion test, impulse oscillometry, break-point
Introduction
COPD is one of the leading causes of mortality around the globe and is the third cause of death.1 It is characterized by irreversible progressive loss of lung function. The disease is heterogenic with two prominent characteristics, the first being airway inflammation and remodeling and the second being emphysema with airspace enlargement.2–5 Diagnosis and Global Initiative for Chronic Obstructive Lung Disease (GOLD) grading of COPD is based on spirometry, while non-pharmacologic and pharmacologic management is based on symptoms, spirometry, previous exacerbations, and comorbidities.6,7 Complementary methods are needed to further characterize the disease, both by volume and airflow restriction. Volume restrictions, due to emphysema formation and air trapping, are reflected by reduced forced vital capacity (FVC) but can be further characterized by using body plethysmography (bp).8 We have previously shown that the combination of single-breath helium-diffusion carbon-monoxide diffusion testing together with body plethysmography can show valuable information about volume changes in COPD.9 Flow restrictions can be read from the flow–volume spirometry curve shape,10 but impulse oscillometry provides additional information.11–13 Recruitment of small airways has been shown to be important for clinical outcomes like degree of dyspnea and possibly also risk of exacerbations.14
Classification of severity of airflow limitation is based on post-bronchodilator forced expiratory volume in 1 second (FEV1). Categorization into GOLD grades is valuable to communicate important information of different severity groups, and is a standard way of presenting data in numerous COPD publications.6,7 However, continuous analysis can be a valuable complement, as it utilizes data more efficiently and can give additional information.
Our aim was to investigate if complementary advanced physiologic measurements analyzed in a continuous manner – linear, segmented linear with estimated break-points, and nonlinear regressions – could add to the understanding of the severity staging of COPD. The methodology of continuous analysis was applied on a dataset from our previous study.9
Materials and methods
Study participants
Smokers performed flow–volume spirometry and were classified as either healthy smoking controls (FEV1/FVC ≥0.7) or as COPD (FEV1/FVC <0.7) after bronchodilation. The COPD patients were further classified into GOLD Stages I, II, III, and IV. Study participants had no history of asthma, lung cancer, or any cardiorespiratory or respiratory disease. They had a smoking history of ≥15 pack years and no exacerbations or respiratory infections within the last 3 weeks. All participants performed the lung function tests at least 40 minutes after inhalation of a β2-agonist and an antimuscarinic agonist. Participants inhaled salbutamol (400 μg Buventol® Easyhaler) and ipratropium (80 μg Atrovent® Handihaler) in the clinic except for seven patients who inhaled formoterol (9 μg within Symbicort® Turbuhaler) and tiotropium (18 μg Spiriva® Handihaler) at home in the morning. There were no restrictions on inhaled corticosteroids.
Study design
This study was approved by the Regional Ethical Review Board in Lund (431/2008) and all study participants signed written informed consent. Study participants performed bp, with flow–volume spirometry (Jaeger® MasterScreen™ body plethysmograph; CareFusion [a subsidiary of Becton, Dickinson and Company, Franklin Lakes, NJ, USA]), impulse oscillometry system (Jaeger MasterScreen),15,16 and single-breath helium-dilution carbon-monoxide diffusion test (CO; Jaeger MasterScreen Diffusion). All lung function measurements were done according to the manufacturer’s instructions and according to European Respiratory Society/American Thorax Society recommendations.8,10,17 Established reference values by Crapo et al were used.18
Statistics
For descriptive purposes, medians and interquartile ranges were used. The detection of potential break-points was performed by a regression model allowing for segmented relationships.19,20 In a given linear regression (LR) model, the method tries to estimate a new model having a segmented (or broken-line) relationship. This is defined by the slope of the parameter(s) and the break-point(s) where the linear relation changes. The method gives point estimates and approximate standard errors of the model parameters, including the break-points. In Figure 1, an example is given on the relationship between FEV1 percent of predicted (%pred) and FEV1/FVC. The estimated break-point is shown as a circle at 80% of FEV1 with the associated 95% confidence interval (horizontal line through the circle in the top of the figure). The solid black line to the left and the black hatched line to the right of the break-point are the corresponding segmented linear regression (SLR) technique fits with different slopes and joined at the break-point. An ordinary LR line (gray hatched) and the reference, a nonparametric fit by the local regression (LOESS) line (gray solid) are also displayed.21 The method allows for several break-points, but the investigation presented here only focused on trying to find one break-point. All calculations, where not otherwise specified, were performed in (v 3.1.1) and SPSS (v 22) software.
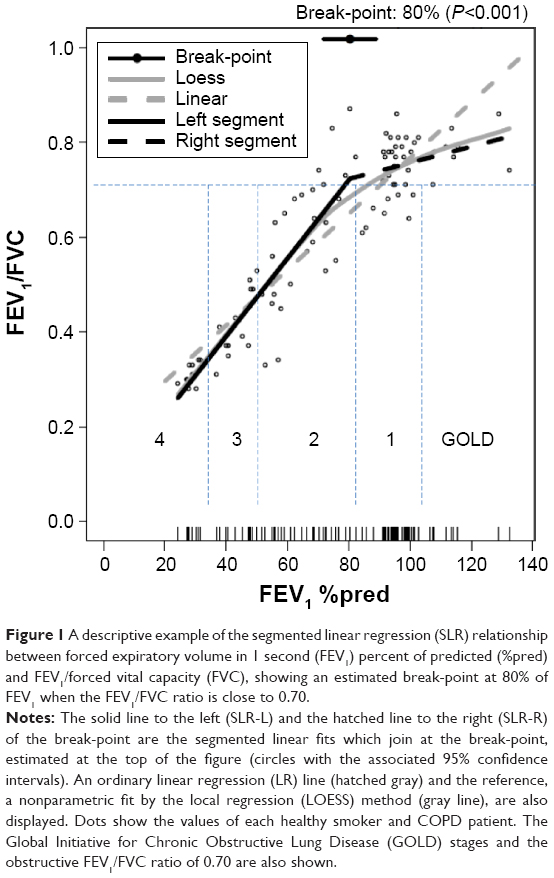 | Figure 1 A descriptive example of the segmented linear regression (SLR) relationship between forced expiratory volume in 1 second (FEV1) percent of predicted (%pred) and FEV1/forced vital capacity (FVC), showing an estimated break-point at 80% of FEV1 when the FEV1/FVC ratio is close to 0.70. |
Results
Subject characteristics
In total, 92 subjects were included in the study, of whom 41 were classified as healthy smokers (FEV1/FVC ≥0.7) and 51 as COPD patients. The COPD group was then classified according to GOLD Stages I–IV: Stage I, n=9; Stage II, n=21; Stage III, n=14; and Stage IV, n=7.6,7 The demographic data between groups were well matched, while disease-related baseline data (smoking, symptoms, FEV1%pred, and prescribed medication) varied according to severity (Table 1).
 | Table 1 Patient characteristics |
Curve fittings of different lung function parameters related to FEV1%pred
The different lung function parameters showed different curve shapes as a function of FEV1%pred. The examples in Figure 2 were selected and arranged by P-value for the segmented test (from no P-value to P<0.001) showing that as the P-value became lower, the SLR curve fitting appeared more closely aligned to LOESS, as our reference, than the LR curve fitting. This appeared applicable even if the P-value was in the range of 0.05 to 0.30.
 | Figure 2 The relationship between spirometric severity (forced expiratory volume in 1 second [FEV1] percent of predicted [%pred]) and selected lung function parameters: (A) resistance at 20 Hz (R20), (B) FEV1, (C) total lung capacity (TLC), and (D) diffusion capacity of the lung for carbon monoxide (DLCO)/alveolar volume (VA). |
Data for all lung function parameters and their fit to LR and SLR can be seen in Table 2.
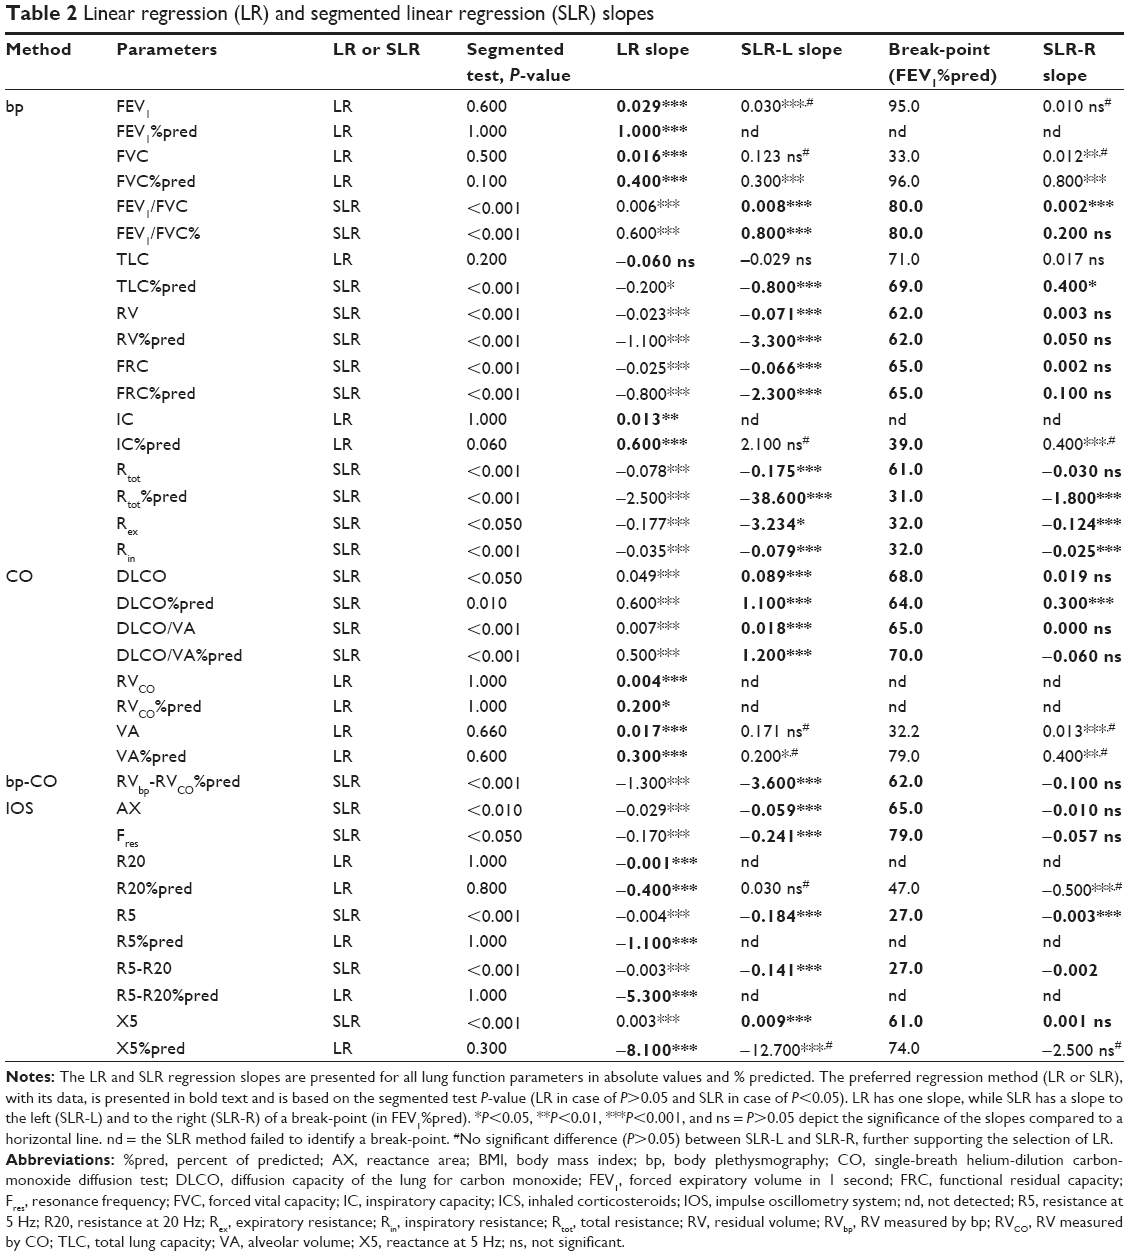 | Table 2 Linear regression (LR) and segmented linear regression (SLR) slopes |
The following lung function parameters in absolute values or %pred were best described by SLR; that is, the segmented test showed P-values <0.05: FEV1/FVC, FEV1/FVC%pred, total lung capacity (TLC) %pred, functional residual capacity (FRC), FRC%pred, RVbp (RV that is measured by bodyplethysmography), RVbp%pred, RVbp-CO%pred, total resistance (Rtot), Rtot%pred, inspiratory resistance (Rin), expiratory resistance (Rex), diffusion capacity of the lung for carbon monoxide (DLCO), DLCO%pred, DLCO/alveolar volume (VA), DLCO/VA%pred, resistance at 5 Hz (R5), R5 minus R20, reactance area (AX), resonance frequency (Fres), and reactance at 5 Hz (X5).
The following lung function parameters were best described by LR (defined as segmented test P>0.05): FEV1, FEV1%pred, FVC, FVC%pred, inspiratory capacity (IC), IC%pred, TLC, RVCO (RV measured by CO-diffusion), RVco%pred, VA, VA%pred, R5%pred, R20, R20%pred, R5-R20%pred, and X5%pred.
In most cases, the segmented test defined the same curve fitting (SLR or LR) for parameters where both absolute value and %pred were determined, indicating that sex, age, and body size did not strongly influence the results. TLC, R5, R5-R20, and X5 were exceptions. TLC had a similar break-point as TLC%pred (71% and 69% predicted, respectively) and followed LOESS well, even though the segmented test defined TLC as having a preferred linear slope (Figure 2C and Table 2). Rtot and Rtot%pred showed the biggest discrepancy between the two significant break-points (61 and 31, respectively).
Break-points for parameters with segmented curve fittings
Break-points in the range of 60–70 FEV1%pred were seen for several of the lung function parameters (Table 2): TLC%pred, FRC, FRC%pred, RVbp, RVbp%pred, RVbp-CO%pred, Rtot, DLCO, DLCO%pred, DLCO/VA, DLCO/VA%pred, AX, and X5.
There was good agreement for the break-points between absolute and predicted values, where both were determined, indicating that sex, age, and body size do not strongly influence the results. The parameters with a break-point in the range of 60–70% FEV1%pred were all related to volume, diffusion capacity or reactance. In Figure 3, four volume-related parameters, one diffusion capacity parameter, and one impulse oscillometry system parameter are displayed.
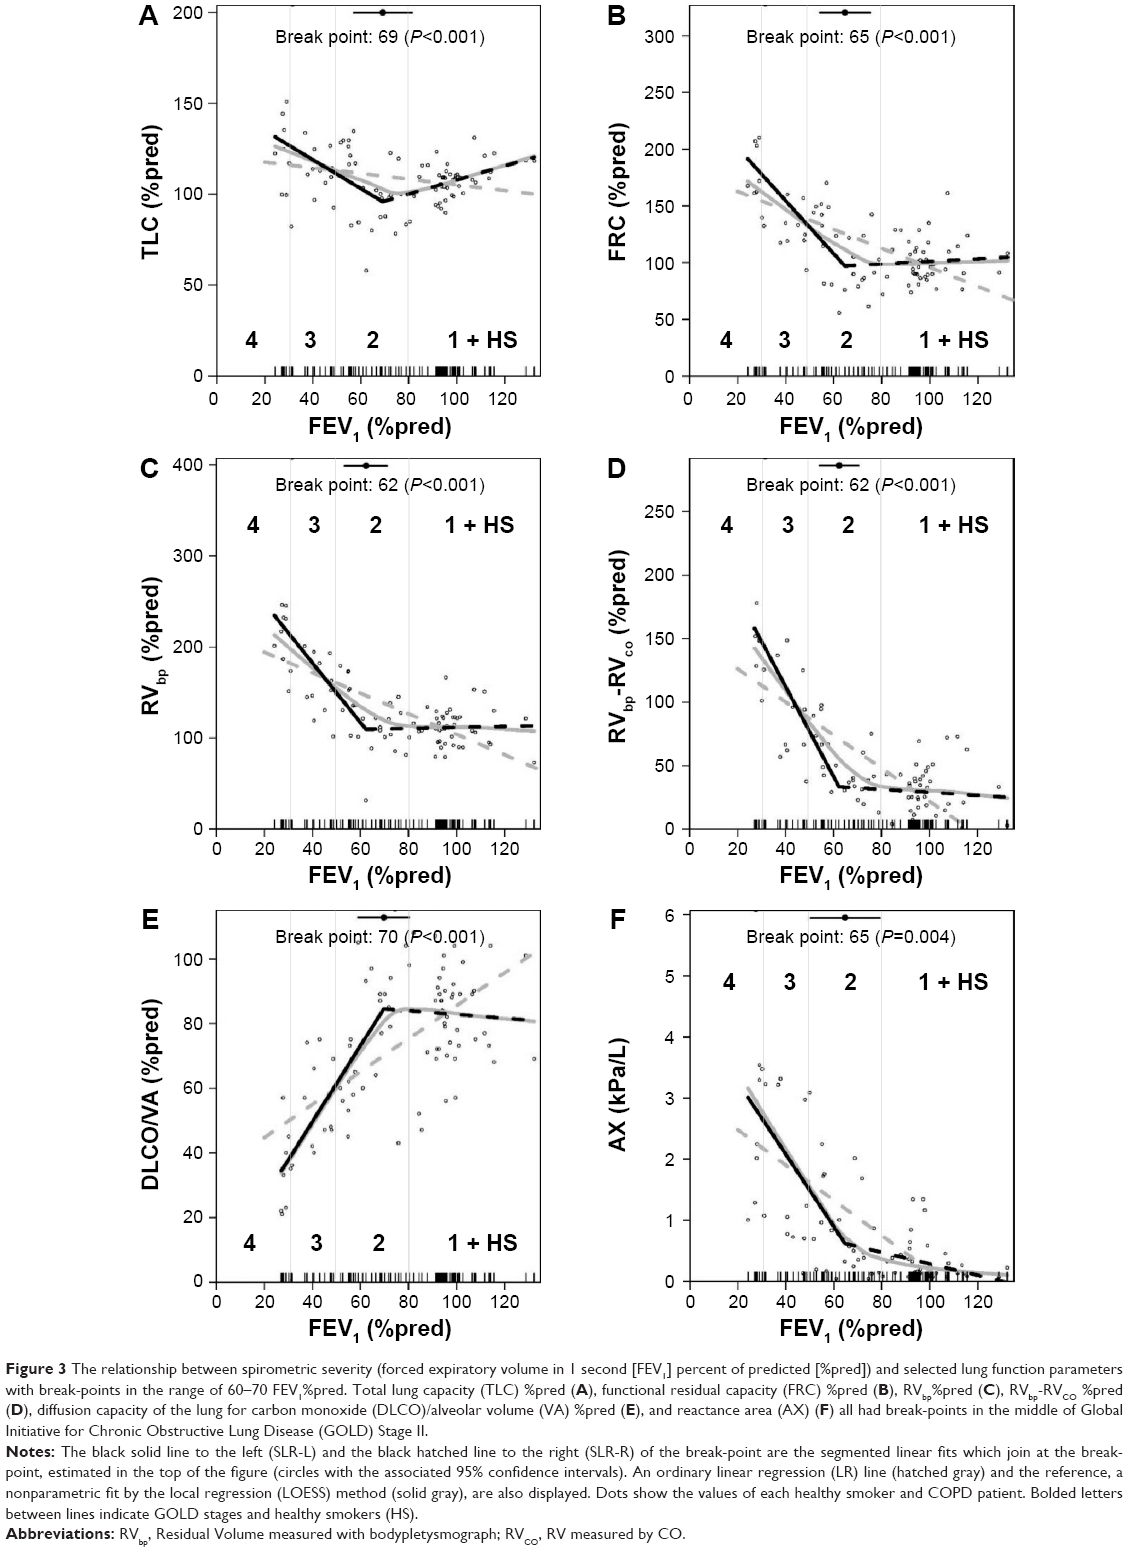 | Figure 3 The relationship between spirometric severity (forced expiratory volume in 1 second [FEV1] percent of predicted [%pred]) and selected lung function parameters with break-points in the range of 60–70 FEV1%pred. Total lung capacity (TLC) %pred (A), functional residual capacity (FRC) %pred (B), RVbp%pred (C), RVbp-RVCO %pred (D), diffusion capacity of the lung for carbon monoxide (DLCO)/alveolar volume (VA) %pred (E), and reactance area (AX) (F) all had break-points in the middle of Global Initiative for Chronic Obstructive Lung Disease (GOLD) Stage II. |
Break-points around 80 FEV1%pred were seen for three lung function parameters (Table 2): FEV1/FVC, FEV1/FVC%pred, and Fres.
Break-points below 40 FEV1% were seen for five lung function parameters (Table 2): Rtot%pred, Rin, Rex, R5, and R5-R20.
There was no good agreement between SLR curves with break-points below 40 FEV1% and the LOESS fitting, as these steep slopes below the break-points were not picked up by the LOESS.
Descriptive presentation of slopes for parameters expressed as percent of predicted
FEV1%pred versus FEV1%pred showed a positive linear slope of 1.0 and other lung function parameters (in %pred values) can be related to FEV1%pred and to each other (Figure 4). IC%pred and FVC%pred also had positive linear slopes of 0.6 (P<0.001) and 0.4 (P<0.001) respectively. R5-R20%pred, X5%pred, R5%pred, and R20%pred showed negative linear slopes: −5.3 (P<0.001), −8.1 (P<0.001), −1.1 (P<0.001), and −0.4 (P<0.001), respectively (Figure 4A).
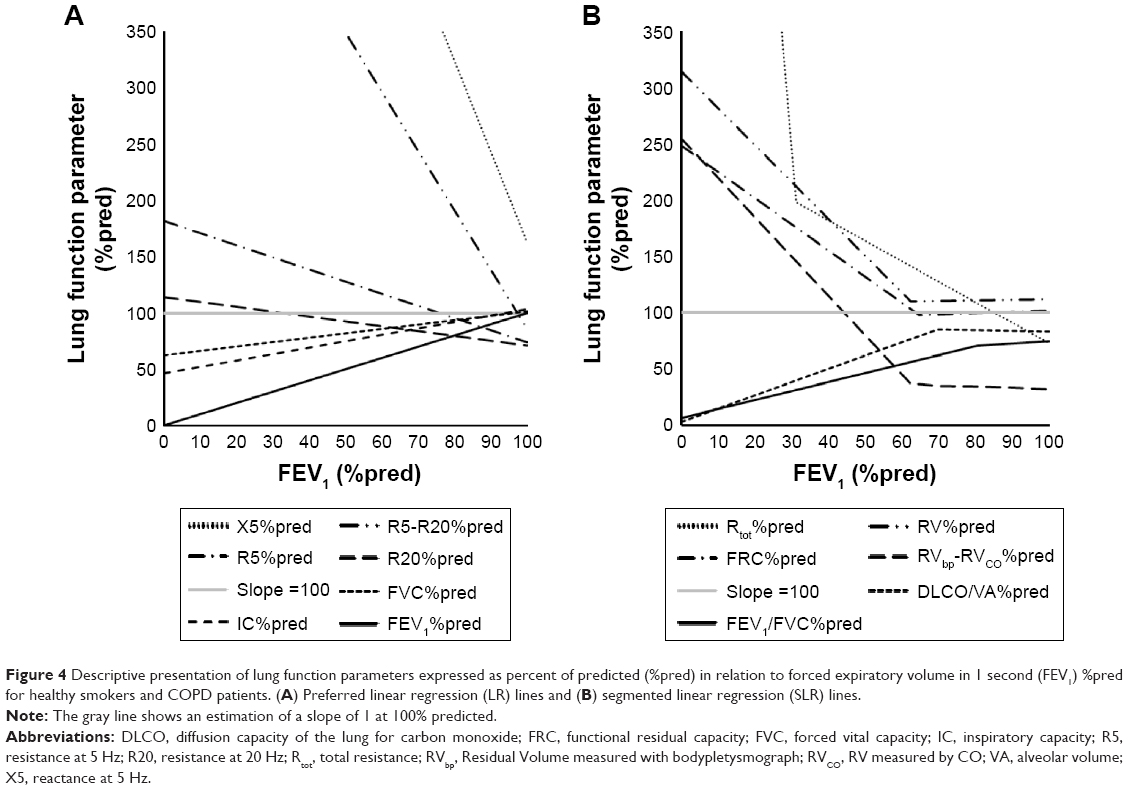 | Figure 4 Descriptive presentation of lung function parameters expressed as percent of predicted (%pred) in relation to forced expiratory volume in 1 second (FEV1) %pred for healthy smokers and COPD patients. (A) Preferred linear regression (LR) lines and (B) segmented linear regression (SLR) lines. |
Figure 4B shows segmented parameters. FEV1/FVC%pred and DLCO/VA%pred had significant positive slopes (0.8 and 1.2, respectively, both P<0.001) below their respective break-point. FEV1/FVC%pred and DLCO/VA%pred showed nonsignificant horizontal slopes above their break-points. FRC%pred, RVbp%pred, and RVbp-CO%pred all had negative slopes below their break-points: −2.3 (P<0.001), −3.3 (P<0.001) and −3.6 (P<0.001), respectively. Above their break-points they all showed nonsignificant slopes. Rtot%pred had a significant positive slope (−38.6, P<0.001) below its break-point as well as above (−1.8, P<0.001). TLC%pred showed a different pattern by having a significant negative slope of −0.8 (P<0.001) below its break-point and a significant positive slope of 0.4 (P<0.05) above.
Discussion
In this post-hoc analysis we analyzed lung function data in relation to spirometric COPD severity, using the classification of severity of airflow limitation.6,7 However, the data were analyzed as continuous data, instead of categorically. Three different regression models were used: a linear, a segmented linear, and a flexible nonparametric fit method. The applied continuous analyses gave information for each lung function parameter about (1) the curve shapes in the whole population from healthy smokers to subjects with very severe COPD, (2) estimated break-points, (3) the slope changes above and below estimated break-points, and (4) the slope expressed as change per unit FEV1%pred for comparison between different parameters. This approach can bring new and valuable information to the understanding of COPD heterogeneity.
Some lung function parameters, for example, FVC%pred and IC%pred, had a linear significant slope through the whole FEV1%pred spectrum. However, several parameters were nonlinear in relation to FEV1%pred, which were supported by both the descriptive LOESS and the statistically significant segmented regression fits with significant break-points.
The FEV1/FVC value was 0.7 at the break-point of 80% of FEV1%pred, which was logical, as two different populations were recruited into the study. The ratio for healthy smokers (>0.7) showed a nonsignificant slope change of 0.2 per unit FEV1%pred, while the ratio for the COPD group (<0.7) had an increased slope change of 0.8 per unit FEV1%pred. This increase in obstruction, below the well-accepted cutoff point of 0.7, was similar to the increase in spirometric severity. An interesting finding was that several different parameters from different methods had break-points between 60% and 70% of FEV1%pred; that is, in the middle of GOLD Stage II. For example the three volume-related parameters from bp (RVbp%pred, FRC%pred, and TLC%pred) showed only small volume changes above their break-points, while the volume increased significantly below their break-points. The volume-related parameters (RVbp%pred, RVbp-CO%pred, and FRC%pred) increased two- to fourfold per unit fall in FEV1%pred. These parameters are strongly related to air trapping and our data suggest that a change in the lung parenchyma occurs in the middle of GOLD Stage II. Similarly, the diffusion capacity showed break-point values from 60%–70% of FEV1%pred, irrespective of whether DLCO was calculated as absolute or %pred or with or without correction for VA. Our findings thereby demonstrate that reduced gas diffusion capacity and increased air trapping occurred in parallel. Finally the two reactance parameters, AX and X5, also had break-points between 60% and 70% of FEV1. Reactance is suggested to reflect elasticity of the parenchyma and is associated with air trapping and differs from resistance, which is measuring airway obstruction.13 Individual patients may have early or late onset of lost diffusion capacity and/or increased air trapping and extended lung function tests may be specifically valid in GOLD Stage II patients.
Resistance showed either a linear curve fitting over the whole spectrum of FEV1%pred (R5%pred, R20 and R20%pred, R5-R20%pred) or a segmented curve fitting with a break-point of less than 40% of FEV1%pred (Rtot%pred, Rin, Rex, R5%pred, R5-R20). The low break-points of 25%–40% are interesting but should be regarded with caution. They could have a physiologic/pathologic explanation – for instance, destruction and collapse of the airways in this very severe group of COPD. A more plausible explanation could be that the data were driven by few individuals and/or the methods reached their lower limit for accurate measures.
The contribution of the regional resistances to the total resistance in the range from healthy smokers down to subjects with severe COPD is interesting. The total resistance, represented by R5%pred and Rtot%pred (above break-point), had a slope change of −1.1 and −1.8 per unit of FEV1%pred, respectively. The regional slope change was small for the central resistance (R20%pred =−0.4 per unit FEV1%pred), while the peripheral slope change (R5-R20%pred) decreased fivefold per unit FEV1%pred in the whole range of COPD. The high increase of the peripheral resistance at lower lung function has been discussed,22 but Hogg et al summarize elegantly this phenomenon as a combination of the narrowing/collapse and destruction of the small airways.23
Our data support the sequence of tissue destruction in COPD. Firstly, toxic particles destroy the terminal bronchioles, indicated early on by the change in peripheral resistance.12,13 Secondly, limitation in gas exchange and increase of hyperinflation follow predominantly in the middle of GOLD Stage II. Emphysema also comes gradually but the collapse of entire lung lobules and coalescence of many lobules occur later,23 maybe below 40%, as our data may indicate.
Our findings may have clinical implications related to the management of patients. Today’s guidelines advocate spirometry to diagnose (FEV1/FVC) and define severity (FEV1%pred) in every patient. A severity grading by only spirometry may miss the small-airway destruction phenotype, the severe gas-exchange mismatch phenotype, and the severe air trapping phenotype. Today’s guidelines have moved away from FEV1 as the only determinant for choice of therapy and recommend a more holistic treatment strategy including symptoms, lung function, and previous exacerbations.6,7 However, the cutoff point of an FEV1 of 50%pred does not address the heterogeneity in GOLD Stage II (50%–80% predicted). We think that a better classification of mild to moderate COPD could differentiate the phenotypes, which need different management plans, and stimulate more personalized management.
Our findings also indicate that clinical and pharmaceutical research should extend the characterization of COPD patients and specifically GOLD Stage II patients. A suggestion would be to expand baseline characterization to report small-airway disease (for example R5-R20), air-trapping (for example RV) and gas exchange (for example DLCO) for each GOLD stage. The advantage would be that subgroup responses to different investigations (tests or interventions) might lead to better understanding of COPD and better management and use of present as well as future treatments.
Limitations and future directions
This study has generated new valuable information. However, to validate our data, more subjects, especially healthy nonsmokers and mild and very severe COPD patients should be included. The healthy nonsmokers may have changed the slopes marginally but most likely positively for the interpretation. The low number of very severe COPD patients makes our interpretation in this range speculative, as this could be a methodological problem. An interesting angle would have been to see where in this regression model the new classification, including exacerbation frequency and dyspnea, would fit in and if it would help, to some extent, to divide GOLD Stage II the same way as the break-points do. A two-segmented regression model could be beneficial, since we may have missed break-points at higher FEV1%pred, due to these low break-points. As a future perspective it would also be interesting to see how our data would appear in relation to airway thickness or emphysema grade estimated by computed tomography.
Conclusion
This study has shown that a discontinuous analysis, using three different regression methods, gives new possibilities aside from the standard categorical approach when studying a broad COPD population. In addition, the results give support to the progression of lung destruction, starting in the small airways, followed by diminished gas exchange and hyperinflation, and finally more advanced emphysema. Thereby, our results also support that spirometry preferably should be complemented by methods measuring small airways, RV, diffusion capacity, and reactance. The number of identified break-points in the middle of GOLD Stage II may have important clinical and scientific implications.
Acknowledgments
The authors would like to thank the Lung and Allergy Research Unit, the Lung and Allergy Clinic, Skånes University Hospital, and especially Doctor Anders Olin for all their help and support.
Author contributions
GE initiated this “post-hoc” study, interpreted the data, and wrote the paper. LJ designed the study, tested the patients and interpreted data, and wrote the paper. SP proposed and performed advanced statistical analysis, interpreted the data and revised the paper critically. JA included patients and revised the paper critically. LB designed the study, interpreted data, and revised the paper critically. ET designed the study, interpreted data, and revised the paper critically. All authors contributed toward data analysis, drafting and critically revising the paper and agree to be accountable for all aspects of the work.
Disclosure
The authors report no conflicts of interest in this work.
References
World Health Organization (WHO). The top 10 causes of death [web page on the Internet]. Fact sheet number 310. Geneva: WHO; nd [updated May 2014]. Available from: http://www.who.int/mediacentre/factsheets/fs310/en/. Accessed March 27, 2015. | ||
Soriano JB, Rodriguez-Roisin R. Chronic obstructive pulmonary disease overview: epidemiology, risk factors, and clinical presentation. Proc Am Thorac Soc. 2011;8(4):363–367. | ||
Rycroft CE, Heyes A, Lanza L, Becker K. Epidemiology of chronic obstructive pulmonary disease: a literature review. Int J Chron Obstruct Pulmon Dis. 2012;7:457–494. | ||
Chung KF, Adcock IM. Multifaceted mechanisms in COPD: inflammation, immunity, and tissue repair and destruction. Eur Respir J. 2008;31(6):1334–1356. | ||
Sohal SS, Ward C, Danial W, Wood-Baker R, Walters EH. Recent advances in understanding inflammation and remodeling in the airways in chronic obstructive pulmonary disease. Expert Rev Respir Med. 2013;7(3):275–288. | ||
Vestbo J, Hurd SS, Agusti AG, et al. Global strategy for the diagnosis, management, and prevention of chronic obstructive pulmonary disease: GOLD executive summary. Am J Respir Crit Care Med. 2013;187(4):347–365. | ||
Global Initiative for Chronic Obstructive Lung Disease (GOLD). Global Strategy for the Diagnosis, Management and Prevention of Chronic Obstructive Pulmonary Disease. GOLD; 2015. Available from http://www.goldcopd.org/uploads/users/files/GOLD_Report_2015_Feb18.pdf. Accessed March 27, 2015. | ||
Wanger J, Clausen JL, Coates A, et al. Standardisation of the measurement of lung volumes. Eur Respir J. 2005;26(3):511–522. | ||
Jarenbäck L, Ankerst J, Bjermer L, Tufvesson E. Flow-volume parameters in COPD related to extended measurements of lung volume, diffusion, and resistance. Pulm Med. 2013;2013(2013):Article ID 782052. | ||
Miller MR, Hankinson J, Brusasco V, et al. Standardisation of spirometry. Eur Respir J. 2005;26(2):319–338. | ||
Goldman MD, Nazeran H, Ramos C, et al. Electrical circuit models of the human respiratory system reflect small airway impairment measured by impulse oscillation (IOS). Conf Proc IEEE Eng Med Biol Soc. 2010;2010:2467–2472. | ||
Al-Mutairi SS, Sharma PN, Al-Alawi A, Al-Deen JS. Impulse oscillometry: an alternative modality to the conventional pulmonary function test to categorise obstructive pulmonary disorders. Clin Exp Med. 2007;7(2):56–64. | ||
Frantz S, Nihlen U, Dencker M, Engstrom G, Lofdahl CG, Wollmer P. Impulse oscillometry may be of value in detecting early manifestations of COPD. Respir Med. 2012;106(8):1116–1123. | ||
Incorvaia C, Riario-Sforza GG, Pravettoni C, Yacoub MR, Frati F. Impairment of small airways in COPD patients with frequent exacerbations and effects of treatment with tiotropium. Int J Chron Obstruct Pulmon Dis. 2008;3(1):123–126. | ||
Goldman MD, Saadeh C, Ross D. Clinical applications of forced oscillation to assess peripheral airway function. Respir Physiol Neurobiol. 2005;148(1–2):179–194. | ||
Aronsson D, Tufvesson E, Bjermer L. Comparison of central and peripheral airway involvement before and during methacholine, mannitol and eucapnic hyperventilation challenges in mild asthmatics. Clin Respir J. 2011;5(1):10–18. | ||
Macintyre N, Crapo RO, Viegi G, et al. Standardisation of the single-breath determination of carbon monoxide uptake in the lung. Eur Respir J. 2005;26(4):720–735. | ||
Crapo RO, Morris AH, Gardner RM. Reference spirometric values using techniques and equipment that meet ATS recommendations. Am Rev Respir Dis. 1981;123(6):659–664. | ||
Muggeo VM. Estimating regression models with unknown break-points. Stat Med. 2003;22(19):3055–3071. | ||
Muggeo VM. Segmented: an R Package to fit regression models with broken-line relationships. R News. 2008;8(1):20–25. | ||
Cleveland WS, Grosse E, Shyu WM. Local regression models. In: Chambers SJ, Hastie TJ, editors. Statistical Models in S. Pacific Grove, CA: Wadsworth; 1992:309–376. | ||
Yanai M, Sekizawa K, Ohrui T, Sasaki H, Takishima T. Site of airway obstruction in pulmonary disease: direct measurement of intrabronchial pressure. J Appl Physiol (1985). 1992;72(3):1016–1023. | ||
Hogg JC, McDonough JE, Suzuki M. Small airway obstruction in COPD: new insights based on micro-CT imaging and MRI imaging. Chest. 2013;143(5):1436–1443. |
 © 2015 The Author(s). This work is published and licensed by Dove Medical Press Limited. The
full terms of this license are available at https://www.dovepress.com/terms
and incorporate the Creative Commons Attribution
- Non Commercial (unported, 3.0) License.
By accessing the work you hereby accept the Terms. Non-commercial uses of the work are permitted
without any further permission from Dove Medical Press Limited, provided the work is properly
attributed. For permission for commercial use of this work, please see paragraphs 4.2 and 5 of our Terms.
© 2015 The Author(s). This work is published and licensed by Dove Medical Press Limited. The
full terms of this license are available at https://www.dovepress.com/terms
and incorporate the Creative Commons Attribution
- Non Commercial (unported, 3.0) License.
By accessing the work you hereby accept the Terms. Non-commercial uses of the work are permitted
without any further permission from Dove Medical Press Limited, provided the work is properly
attributed. For permission for commercial use of this work, please see paragraphs 4.2 and 5 of our Terms.