Back to Journals » Journal of Inflammation Research » Volume 17
A Neutrophil Extracellular Traps-Related Gene Trait Revealed the Prospective Therapy Strategy of Coronary Atherosclerosis
Authors Li Z, Zhao W, Ji W, Li Z, Wang K, Jiang T
Received 5 September 2024
Accepted for publication 19 November 2024
Published 28 November 2024 Volume 2024:17 Pages 9925—9951
DOI https://doi.org/10.2147/JIR.S489847
Checked for plagiarism Yes
Review by Single anonymous peer review
Peer reviewer comments 2
Editor who approved publication: Dr Tara Strutt
Zhetao Li,1 Wansong Zhao,2 Wenbo Ji,3 Zhaoshui Li,1 Kuo Wang,4 Ting Jiang1
1Heart Center, Qingdao Hiser Hospital Affiliated of Qingdao University (Qingdao Traditional Chinese Medicine Hospital), Qingdao, People’s Republic of China; 2Operating Room Department, Qingdao Municipal Hospital, Qingdao, People’s Republic of China; 3Operating Room Department, Qingdao Hiser Hospital Affiliated of Qingdao University (Qingdao Traditional Chinese Medicine Hospital), Qingdao, People’s Republic of China; 4Preventive and Health Care Department, Qingdao Hiser Hospital Affiliated of Qingdao University (Qingdao Traditional Chinese Medicine Hospital), Qingdao, People’s Republic of China
Correspondence: Ting Jiang; Kuo Wang, Email [email protected]; [email protected]
Background: Coronary atherosclerosis (CA) is a major cause of coronary artery disease (CHD), with inflammation significantly influencing its pathogenesis. This study explores the role of neutrophil extracellular traps (NETs) in CA to understand their influence on disease progression.
Methods: Using the GEO database, we analyzed RNA expression microarray data from CA patients, identifying NET-related differentially expressed genes (NETDEGs) through logistic regression, SVM, and LASSO operator regression analyses. CA samples were categorized into risk subgroups based on gene traits, with further analysis on the biological characteristics and immune cell infiltration of the high-risk subgroup. Additionally, transcription factor (TF)-gene, microRNA (miRNA)-gene, and RNA binding protein (RBP)-gene regulatory networks were investigated, alongside a protein-drug network to propose potential targeting therapies. Expression levels of NETDEGs were validated via qRT-PCR and Western blotting.
Results: Three NETDEGs—MMP9, ERN1, and G0S2—were pinpointed as key players in CA development, regulated by TFs, miRNAs, and RBPs. These genes defined high-risk subgroups marked by intense inflammatory signaling and apoptosis. High neutrophil infiltration correlated positively with NETDEG expression in CA samples, supporting their potential as biomarkers. MMP9 emerged as a notable drug target, providing a possible therapeutic avenue.
Conclusion: This research highlights an independent NETDEG trait in CA, offering insights into potential biomarkers and therapeutic targets for combating this disease.
Keywords: neutrophil extracellular traps, coronary atherosclerosis, biomarker, therapy target
Introduction
As the population ages, the morbidity of coronary atherosclerosis (CA) is increasing annually and has become the leading cause of death worldwide.1–3 According to a report from the American Heart Association, approximately 10.9% of adults aged 45 years and older and 17.0% of adults aged 65 and older had CA, and approximately 800,000 Americans suffered a myocardial infarction (MI) each year.4 CA can cause coronary atherosclerotic heart disease, namely, coronary artery disease (CHD), by causing myocardial ischaemia and hypoxia. The main clinical manifestations of CHD contain angina pectoris, myocardial infarction, myocardial fibrosis and sudden coronary death, which is the main reason of death. The treatment of CHD mainly includes lifestyle changes, drug therapy, surgery, and drug treatment, which are the basis of coronary disease control.5–8 Drug therapy includes lipid-regulating drugs, antiplatelet drugs, anti-myocardial ischaemia drugs, drugs to improve cardiac remodelling and prognosis, as well as thrombolytic drugs and anticoagulants, all of which have their own side effects. Surgical treatment mainly involves coronary revascularization, including percutaneous coronary intervention (PCI) and coronary bypass grafting (CABG). Currently diagnostic tests for CHD include blood tests, electrocardiograms, exercise stress tests, coronary CT angiography and coronary angiography; however, there are no specific biomarkers for realize the early diagnosis and prognosis assessment of CHD. More studies are needed to identify specific biomarkers of CHD to enable the early diagnosis and prognosis assessment of CHD.
The inflammatory mechanism runs through the entire process of initiation, progression and complication formation in CA.9,10 When external stimuli, such as dyslipidemia, hypertension or proinflammation cytokines lead to disorders of the arterial endothelium, they can express more adhesion molecules to promote the adhesion of leukocytes and blood vessel walls. With the accumulation of chronic inflammation, endothelial cells become dysfunctional, allowing low-density lipoprotein and inflammatory cells to enter the endodermis, and smooth muscle cells (SMCs) migrate from the tunica media into the intima and promote the synthesis of extracellular matrix, finally leading to CA.10,11
Neutrophil extracellular trap (NETs) necrosis (NETosis) is an inflammatory cell death mode of neutrophils. Activated neutrophils trap and kill pathogens by releasing NETs, which consist of depolymerized chromatin and intracellular granular proteins. NET formation is accompanied by neutrophil death. This novel mode of death is different from apoptosis, cell necrosis and is called NETosis.12 A series of factors, including pathogens, lipopolysaccharides (LPS), immune complexes, antibodies, complement C3,13,14 cytokines14–16 and drugs such as phorbol myristate acetate (PMA) and calcium ionophores. These inducers can promote NETs key proteins neutrophil elastase and myeloperoxidase (MPO). Transcription and translation of MPO and peptidearginine deaminase 4 (PAD4), PAD4 into the nucleus, and nuclear histones are citrullinated by PAD4, resulting in changes in chromatin charge that promote chromatin decondensation. Subsequently, the nuclear and granular membranes dissolved, and a large number of antibacterial proteins in the cytoplasm attached to the depolymerized chromatin formed a network structure, which was finally released into the extracellular. Several studies have shown that NETs are involved in multiple cancers, such as lung, pancreatic, esophageal, gastric, breast and colorectal cancers. NETs may be involved in tumor progression through a number of pathways,17–21 including promoting tumor cell growth,22–24 migration, invasion,21,25,26 increasing angiogenesis27,28 and promoting intravascular adhesion.21 NETs promote tumor growth by increasing cell proliferation, inhibiting apoptosis and promoting activity of matrix metalloproteinase 9 (MMP9) and neutrophil elastase.22–24 Through the biological processes of MMP9 and extracellular matrix (ECM) interactions, cathepsin G mediated cellular aggregation, the disruption of E-cadherin, and NETs are involved in tumor migration and invasion.21,25,26 NETs could promote angiogenesis due to the VEGF liberation mediating by MMP9, neutrophil elastase and cathepsin G. Furthermore, NETs participated in the negative effects on distant organs of tumors, including increasing inflammation and damaging blood vessels.29,30 Some studies have shown NETs involved in autoimmune diseases.31–33 Some auto-antibodies in the body can activate neutrophils to release NETs, which carry the auto-antigens of systemic autoimmune diseases (such as myeloperoxidase, double-stranded DNA, etc)., and then produce auto-antibodies, that can promote the release of NETs. For example, systemic lupus erythematosus releases high mobility group protein 1 (HMGB1), and, by binding DNA and anti-DNA auto-antibodies through the receptor for advanced glycation end products (RAGE), neutrophils are stimulated to release NETs, resulting in kidney damage caused by anti-DNA auto-antibodies in lupus nephritis.34
The mechanism leading to NETosis is not fully understood, however, ROS production is required. NETs plays a vital role in the thrombogenesis.14,35 The formation of immune thrombus helps to clear the pathogen, however, excessive accumulation of thrombus and its interactions with endothelial cells could lead to the formation of atherosclerotic plaques.14 Various inflammatory factors are also risk factors for AS and cardiovascular disease. Therefore, NETs may play an important role in the AS pathogenesis. Bioinformatic analysis is a powerful tool for mining valuable information from existing genomic and proteomic data. This study aimed to elucidate the role of NETs in the pathogenesis mechanism of AS using bioinformatics analysis and to identify specific biomarkers of CHD to achieve early diagnosis and prognosis assessment of CHD.
In this study, NET-related differentially expressed genes (NETDEGs) associated with CA were identified in two GEO datasets. Gene prognostic traits were considered, based on which the disease samples were divided into high- and low-risk subgroups. The related biological characteristics, as well as the changes in immune cell infiltration, were analyzed, which provided the evidence that NETDEGs could be the potential biomarkers of CA progression and the therapeutic targets for this disease. A flow chart of the analysis is shown in Figure 1.
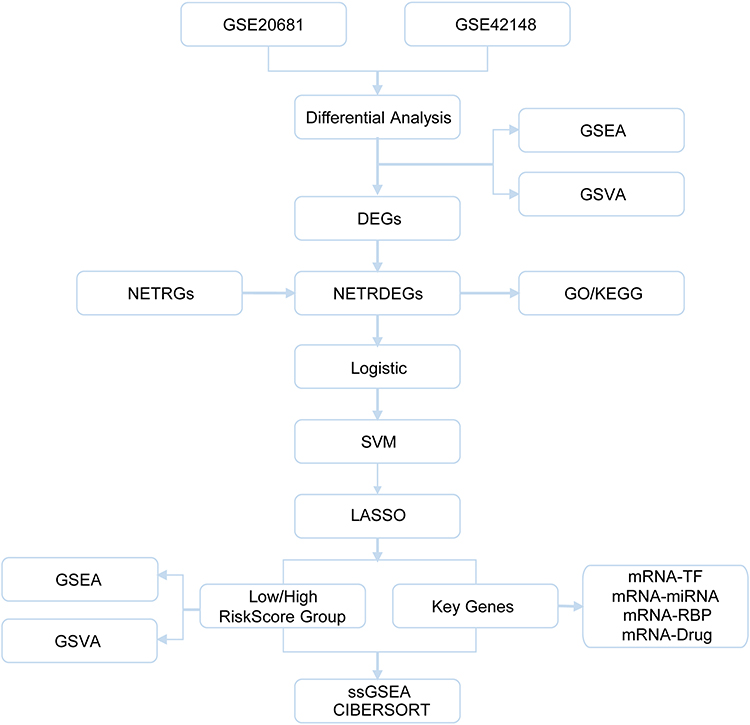 |
Figure 1 The flow chart of bioinformatic analyses. |
Materials and Methods
Data Download
CA datasets GSE20681,36,37 GSE4214838 were downloaded from GEO database39 (https://www.ncbi.nlm.nih.gov/geo/) by R package GEOquery.40 The samples of GSE20681 and GSE42148 were all from Homo sapiens and the tissue sources were whole blood tissue. The chip platform of dataset GSE20681 was GPL4133 and the chip platform of dataset GSE42148 was GPL13607. Among them, dataset GSE20681 contained 99 CA samples and 99 control samples and dataset GSE42148 contained 13 coronary CA samples and 11 control samples. All CA samples and control samples were included in this study and the detailed information is shown in Table 1.
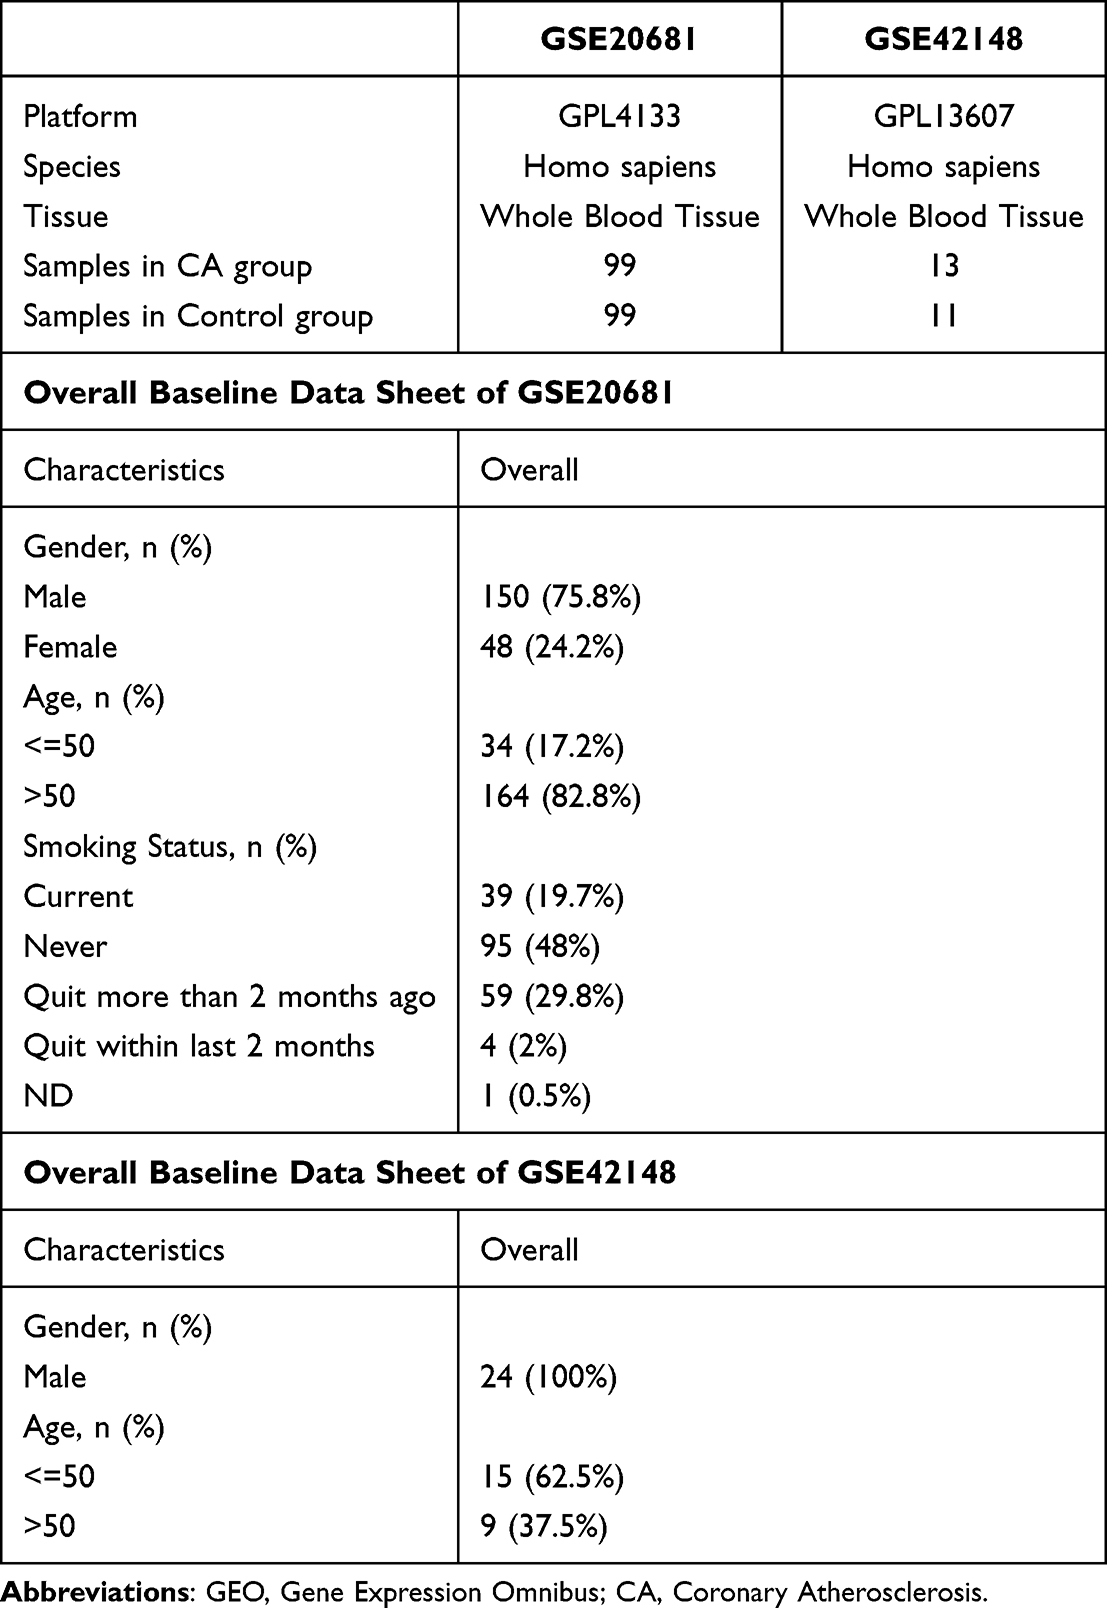 |
Table 1 GEO Microarray Chip Information |
GeneCards database41 (https://www.genecards.org/) is a collection of Neutrophil extracellular traps necrosis related genes (NETs-related Genes, NETRGs). The term “NETs” was as the search keyword and only “protein-coding” NETRGs were searched. A total of 78 NETRGs were obtained. In addition, the term “NETs” was as keywords to search in PubMed website (https://pubmed.ncbi.nlm.nih.gov/) and the NETs related gene sets were obtained from published literature.42 A total of 69 NETRGs were identify. After merging and removing duplications, a total of 128 NETRGs were obtained.
Datasets GSE20681 and GSE42148 were debatched using the R package sva43 and were normalized using the R package limma44 and the annotation probes were normalized. All the samples in dataset GSE20681 were included in this study as the test set and all the samples in dataset GSE42148 were used as the validation set for subsequent analysis.
Analysis of Differentially Expressed Genes
The samples of GSE20681 and GSE42148 were divided into coronary atherosclerosis (CA) group and control (Control) group, respectively. The R package limma was used to analyze the differences in genes between the CA group and the Control group. |logFC| > 0 and P-value < 0.05 were set as threshold of the differentially expressed genes (DEGs). Of them, DEGs with logFC > 0 and P-value < 0.05 were defined as up–regulated genes, DEGs with logFC < 0 and P-value < 0.05 were defined as down–regulated genes. The results of DEGs analysis were plotted using the R package ggplot2 to create volcano plot.
To obtain NETDEGs associated with CA, the DEGs, contained in the CA samples, and NETRGs were intersected and were mapped Venn using the R package pheatmap. The R package RCircos45 was used to draw the chromosomal localization map.
Verification of Differential Expression of NETDEGs
To further explores the expression differences of NETDEGs in the CA group and the Control group in the GSE20681 and GSE42148 datasets respectively, a group comparison map was drawn based on the expression levels of NETDEGs. Then, the R package pROC was used to draw the ROC Curve of NETDEGs and calculate the area under the curve (AUC) value to evaluate the diagnostic effect of NETDEGs expression level on CA. The AUC was generally between 0.5 and 1. The closer the AUC is to 1, the better the diagnostic performance. When AUC was between 0.5 and 0.7, the accuracy was low; when AUC was between 0.7 and 0.9, the accuracy was moderate; and when AUC was above 0.9, the accuracy was high.
Subsequently, in order to explore the correlation between NETDEGs, the Spearman algorithm was used to analyze the correlation between the expression levels of NETDEGs in GSE20681 and GSE42148 datasets. The results of correlation analysis were visualized using the R package pheatmap.46 The absolute value of correlation coefficient below 0.3 was weak or no correlation, 0.3–0.5 was weak correlation, 0.5–0.8 was moderate correlation, and above 0.8 was strong correlation.
Gene Ontology (GO) and Pathway (KEGG) Enrichment Analysis
Gene Ontology (GO) analysis47 is a common method for large-scale functional enrichment studies, including cell component (CC), biological process (BP) and molecular function (MF). Kyoto Encyclopedia of Genes and Genomes (KEGG)48 is a widely used database storing information on genomes, biological pathways, diseases and drugs. Gene ontology (GO) and pathway (KEGG) enrichment analysis of NETDEGs were performed using the R package clusterProfiler.46 Item screening criteria of P-value < 0.05 and FDR value (Q-value) < 0.25 were considered statistically significant. Finally, the R package Pathview49 was used to visualize the related pathway map of KEGG enrichment analysis results.
Gene Set Enrichment Analysis (GSEA)
Gene set enrichment analysis (GSEA)50 is used to evaluate the distribution trend of genes in a predefined gene set in a gene table ranked by their correlation with phenotype, and thus determine their contribution to phenotype. In this study, the dataset GSE20681 was first ranked according to logFC value, and then the R package clusterProfiler was used to perform GSEA on all genes in GSE20681 dataset. The parameters used in GSEA were as follows: the seed is 2020, the number of computations is 1000, the minimum number of genes contained in each gene set is 10, and the maximum number of genes contained in each gene set is 500. Gene set c2.cp.all.v2022.1.Hs.symbols.gmt [All Canonical Pathways](3050) was obtained from the Molecular signatures Database (MSigDB) Database51 to conduct GSEA. The screening criteria of GSEA were adj.p < 0.05 and FDR value (Q-value) < 0.25, and the P-value correction was Benjamini-Hochberg (BH).
The CA samples in dataset GSE20681 were divided into High-risk and Low-risk groups according to the median value of LASSO risk score. The R package limma was used for differential analysis and genes (| logFC | > 0 and P-value < 0.05) the samples of High- and Low-risk groups in CA group were selected. Finally, The GSEA was performed for all genes in CA group with the R-pack cluster Profiler using following the parameters: the seed is 2020, the minimum number of genes contained in each gene set is 10, and the maximum number of genes contained in each gene set is 500. Gene set c2.cp.all.v2022.1.Hs.symbols.gmt [All Canonical Pathways](3050) was obtained from Molecular Signatures Database (MSigDB) to conduct GSEA. The screening criteria of GSEA were adj.p < 0.05 and FDR value (Q-value) < 0.25, and the P-value correction was Benjamini-Hochberg (BH).
Gene Set Variation Analysis (GSVA)
Gene Set Variation Analysis (GSVA)52 is a nonparametric unsupervised analysis method that evaluates gene set enrichment results of microarray nuclear transcriptome by converting gene expression matrix between different samples into gene set expression matrix between samples to evaluate whether different pathways are enriched in different samples. The gene set h.all.v7.4.symbols.gmt was obtained from the Molecular signatures Database51 (MSigDB) and GSVA was performed on all genes in dataset GSE20681. The difference in functional enrichment between the CA group and the Control group was calculated and the screening criterion of GSVA was P-value < 0.05.
The gene set h.all.v7.4.symbols.gmt was obtained from the Molecular traits Database51 (MSigDB) and GSVA was performed on all genes in dataset GSE20681. The difference of functional enrichment between the High-risk group and Low-risk group was calculated and the screening criterion of GSVA was P-value < 0.05.
Construction of Coronary Atherosclerosis Diagnostic Model
To obtains the coronary atherosclerosis diagnostic model of dataset GSE20681, the Logistic regression analysis was performed on NETDEGs. When the dependent variable was a binary variable, namely CA groups and Control groups, the Logistic regression analysis was used to analyze the association between independent and dependent variables. The P-value < 0.05 was used as the criterion to screen NETDEGs and the Logistic regression model was constructed. The group expression of NETDEGs included in the Logistic regression model was displayed by Forest Plot.
Then, Support Vector Machine (SVM)53 algorithm was used to construct the SVM model based on NETDEGs included in the Logistic regression model. NETDEGs were screened based on the number of genes with the highest accuracy and the lowest error rate.
Finally, The R package glmnet54 was used to perform Least Absolute Shrinkage and Selection Operator (LASSO) based on the NETDEGs included in the SVM model with parameters of set.seed (500) and family= “binomial”. LASSO regression analysis reduces the overfitting of the model by adding a penalty term (lambda × absolute value of slope) and improves the generalization ability of the model based on the linear regression analysis. The results of LASSO regression analysis were visualized using diagnostic model and variable trajectory diagrams. The results of LASSO regression analysis were the diagnostic model of CA, and the NETDEGs included in the model were the Key Genes. Finally, the LASSO Risk Score was calculated based on the risk coefficient of LASSO regression analysis, and the risk score was calculated using the following formula:

Validation of the Diagnostic Model for Coronary Atherosclerosis
A Nomogram55 is a graph that uses a cluster of disjoint line segments to represent the functional relationship between multiple independent variables in the rectangular coordinate system of the plane. The R package rms is used to draw a Nomogram based on the results of Logistic regression analysis to show the mutual relationship of Key Genes. Calibration Curve was drawn by Calibration Analysis to evaluate the accuracy and discrimination of CA diagnostic model based on LASSO regression analysis. The R package ggDCA56 was used to draw the decision curve analysis (DCA) map based on the Key Genes in the dataset GSE20681. DCA is a simple method to evaluate clinical prediction models, diagnostic tests and molecular markers. Next, in order to evaluate the diagnostic effect of expression level of LASSO risk score (risk score) on CA, the R package pROC was used to plot the ROC curves and calculate the AUC values in the GSE20681 and GSE42148 datasets.
In addition, the CA group was divided into High-risk group and Low-risk group according to the median expression value of risk score (risk score) of the CA diagnostic model. In order to further explore the expression differences of Key Genes between High-risk group and Low-risk group of CA group, group comparison map was drawn based on the expression levels of Key Genes.
Immune Infiltration Analysis of Key Genes Based on ssGSEA Algorithm
Single-Sample Gene-Set Enrichment Analysis (ssGSEA)57 could quantify the relative abundance of each immune cell infiltrate. First, each infiltrating immune cell type was labeled, such as Activated CD8+ T cell, Activated dendritic cell, Gamma-delta T cell, Natural killer cell, Regulatory T cells (Treg) and other human immune cell subtypes. Secondly, the enrichment scores calculated by ssGSEA analysis were used to represent the relative abundance of each immune cell infiltration in each sample to obtain the immune cell infiltration matrix. Then, the immune cells with significant differences in the two groups were screened for subsequent analysis. The correlation between immune cells was calculated based on Spearman algorithm, and the R package pheatmap was used to draw the correlation heatmap to show the correlation analysis results of immune cells themselves. The correlation between Key Genes and immune cells was calculated based on Spearman algorithm, and the results with P-value < 0.05 were retained. The R package ggplot2 was used to draw correlation bubble plot to show the correlation analysis results between Key Genes and immune cells.
Immune Infiltration Analysis of High and Low Risk Groups (CIBERSORT)
CIBERSORT58 deconvolutes the transcriptome expression matrix based on linear support vector regression to estimate the composition and abundance of immune cells in a mixture of cells. The CIBERSORT algorithm was used to combine the immune cell signature gene matrix and filter out the data with immune cell enrichment score greater than zero, and the specific results of immune cell infiltration matrix in CA samples of dataset GSE20681 were finally obtained. Finally, the R package ggplot2 was used to draw group comparison maps to show the difference in the expression of immune cells between the High-Risk and the Low-Risk groups in the CA samples of dataset GSE20681. Subsequently, the immune cells with significant differences in the two groups were screened for subsequent analysis, and the correlation between immune cells was calculated based on Spearman’s algorithm. The correlation between Key Genes and immune cells was calculated based on Spearman algorithm, and the results with P-value < 0.05 were retained. The R package ggplot2 was used to draw correlation bubble plot to show the correlation analysis results between Key Genes and immune cells.
mRNA-TF, mRNA-miRNA, mRNA-RBP, mRNA-Drug Interaction Network
CHIPBase database (version 3.0)59 (https://rna.sysu.edu.cn/chipbase/) identified thousands of combined base sequence matrix and its binding site from the DNA binding protein ChIP - seq data and predicted the transcriptional regulatory relationships between millions of Transcription Factors (TFs) and genes. The CHIPBase database (version 3.0) were searched for TFS that bind to Key Genes and the sums of Number of samples found (upstream) and Number of samples found (downstream), greater than 6, was used as the screening criteria to screen mRNA-TF interaction pairs. Cytoscape was used to visualize the mRNA-TF Interaction Network.
ENCORI database59 is StarBase version 3.0. The interaction between miRNA-ncRNA, miRNA-mRNA, ncRNA-RNA, RNA-RNA, RBP-ncRNA and RBP-mRNA in ENCORI database is based on CLIP-seq and decompose sequencing (for plants) data mining. ENCORI database was used to predict miRNAs that interact with Key Genes. The pancancerNum > 3 was used as the screening criterion to screen the mRNA-miRNA interaction pairs, and Cytoscape software was used to visualize the mRNA-miRNA Interaction Network.
RNA-binding Protein (RBP)60 plays a key role in the process of gene regulation, such as RNA synthesis, alternative splicing, modification, transport and translation. StarBase v3.0 database61 (https://starbase.sysu.edu.cn/) was used to forecast the Key Genes target RBP, and clusterNum > 2 was used as the selection criterion for mRNA-RBP interaction. Cytoscape software was used to visualize the mRNA-RBP Interaction Network.
The Comparative Toxicogenomics Database43 (https://ctdbase.org/) was used to predict the direct and indirect drug targets of Key Genes and explore the interaction between Key Genes and drugs. The mRNA-Drug Interaction pairs were screened with the screening criterion of “Reference Count” > 2, and Cytoscape software was used to visualize the mRNA-Drug Interaction Network. 1.12 Prediction of protein domain.
Proteins are essential for life and knowing their structures could facilitate to understand their function. The AlphaFoldDB62 database (https://alphafold.com) contains about 350,000 protein structures in humans as well as 20 model organisms commonly used in biological research, such as Escherichia coli, fruit fly, zebrafish and mouse. AlphaFoldDB was used to predict and visualize the protein structures of Key Genes. AlphaFoldDB generates a Predicted Local Distance Difference Test (pLDDT) between 0 and 100 for each residue. When pLDDT < 50, the predicted structure had low confidence; when 50 < pLDDT < 70, the predicted structure had moderate confidence; when 70 < pLDDT < 90, the predicted structure had high confidence; when pLDDT > 90, the predicted structure has higher confidence.
Total RNA Extraction and Quantitative Real Time PCR (qRT-PCR)
A total of 10 peripheral blood samples were obtained from CA patients, and 10 peripheral blood samples were donated from the normal people as the control in Cardiothoracic Surgery Department of Qingdao Traditional Chinese Medicine Affiliated of Qingdao University, who were informed of the use of the samples. All samples were approved by the Ethics Committee of Qingdao Traditional Chinese Medicine Hospital and informed consent was obtained from the patient (2022HC05LS001). Total RNA was extracted from the peripheral blood lymphocytes using the Direct-zol kit (Zymo Research) according to manufacturer’s instructions. The cDNA library was constructed with High-Capacity cDNA Reverse Transcription Kit (Thermo Fisher Scientific) according to manufacturer’s instructions, and the qRT-PCR was done using SsoAdvanced™ Universal SYBR Green Supermix real-time PCR kit (Bio-Rad). The specific primers used in this assay were listed as follows: MMP9-forward: GGACAAGCTCTTCGGCTTCT; MMP9-reverse: TCGCTGGTACAGGTCGAGTA; ERN1-forward: AAAACTACGCCTCCCCTGTG; ERN1-reverse: GTCAGATAGCGCAGGGTCTC; G0S2-forward: CCAAGGAGATGATGGCCCAG; G0S2-reverse: GCTGCACACAGTCTCCATCA.
Western Blotting
Leukocytes were obtained from peripheral blood lymphocytes of CA patients, which were then lysed by RIPA containing 1 mm PMSF on ice. Total protein was harvested from supernatant after the cell lysate was centrifuged at 15,000 rpm for 20 min at 4 °C. Protein concentrations were measured using the bicinchoninic acid (BCA) assay (23,225, Pierce). Equal amounts of protein (20 μg/lane) were loaded onto 4–15% precast protein gels (Bio-Rad) and transferred to polyvinylidene difluoride (PVDF, Bio-Rad) membranes. Non-specific binding was blocked with 5% milk in tris-buffered saline with Tween-20 (TBST) for 1 h at room temperature. The membranes were then incubated with primary antibodies including rabbit anti-MMP9 (30592-1-AP, Proteintech) at 1:1000, rabbit anti-ERN1 (28164-1-AP, Proteintech) at 1:1000, and rabbit anti-G0S2 (12091-1-AP, Proteintech) at 1:1000 overnight at 4 °C. Once excess primary antibody was washed off by TBST, membranes were incubated with horseradish peroxidase (HRP)-linked anti-rabbit secondary antibody (SA00001-2, Proteintech) at 1:1000 for 1 h at room temperature. Rabbit anti-β-actin antibody (20536-1-AP, Proteintech) at 1:1000 was used as a reference (Bu et al, 2018).
Statistical Analysis
All data processing and analysis in this article were based on R software (Version 4.2.2). If not otherwise specified, statistical significance of normally distributed variables was estimated by independent Student’s T-Test for comparisons of continuous variables between two groups. Mann–Whitney U-Test (Wilcoxon Rank Sum Test) was used to analyze the differences between variables that were not normally distributed. Kruskal–Wallis test was used for comparison of three or more groups. Spearman correlation analysis was used to calculate the correlation coefficients between different variables. All statistical P-values were two-sided if not specified, and a P-value of less than 0.05 was considered to indicate statistical significance.
Results
Identification of NETDEGs in CA
To identify the DEGs between CA and norma individuals, GEO database was searched, and GSE20681 and GSE42148 datasets were processed (Table 1). First, the R package sva was used to remove batch effect on datasets GSE20681 and GSE42148 (Supplementary Figure 1). The R package limma was used for differential analysis of GSE20681 and GSE42148 datasets to obtain DEGs between the two groups, and the results were as follows: GSE20681 altogether 886 meet | logFC | > 0 and P-value < 0.05 threshold of DEGs; Under the threshold, 543 genes were identified to be raised expressed genes (logFC > 0 and P-value < 0.05), and 343 genes were identified to be lower expressed genes (logFC < 0 and P-value < 0.05) (Figure 2A and Supplementary Table 1). For GSE42148 datasets, a total of 3725 meet | logFC | > 0 and P-value < 0.05 threshold of DEGs; Under the threshold, 2024 gene were found to be raised expressed genes (logFC > 0 and P-value < 0.05), and 1701 genes were found to be lower expressed genes (logFC < 0 and P-value < 0.05) (Figure 2B and Supplementary Table 2).
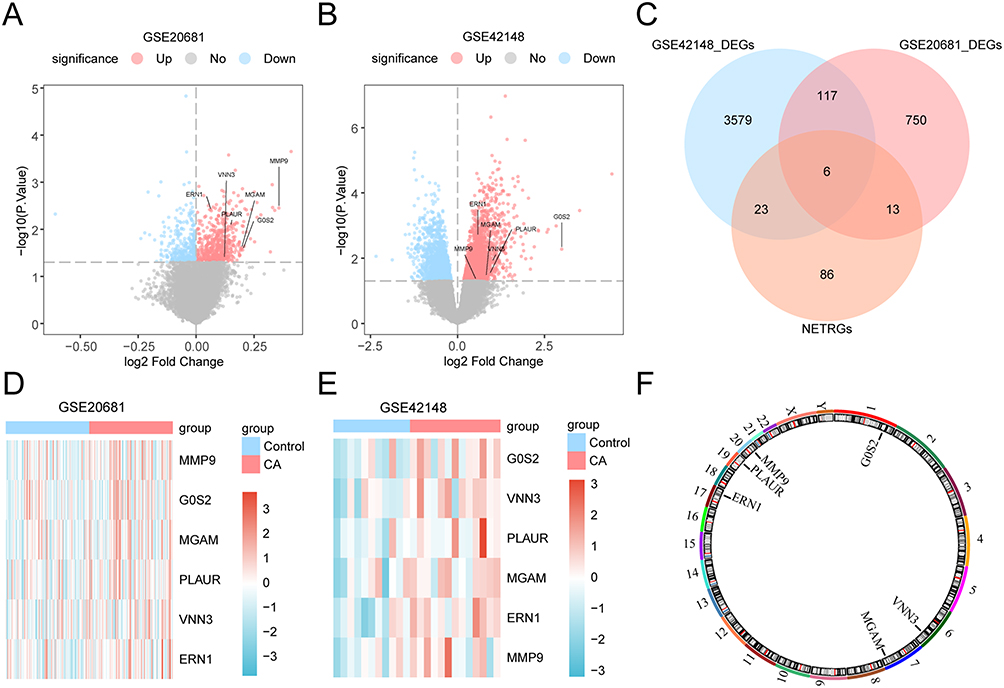 |
Figure 2 The differential genes expression analysis between samples with CA and normal samples in GEO database. (A and B) Volcano map of differential expression genes between the two groups in datasets GSE20681 (A) and GSE42148 (B). NETDEGs were labeled in the figure. (C) Venn diagram of genes and NETRGs in all CA samples in the data sets GSE20681 and GSE42148. (D and E) Heat maps of NETDEGs in datasets GSE20681 (D) and GSE42148 (E). (F) Chromosomal mapping of NETDEGs. Abbreviations: CA, coronary atherosclerosis; DEGs, differentially expressed genes; NETRGs, NETs-related genes; NETDEGs, NETs-related differentially expressed genes. |
To obtain NETDEGs, Venn drawing was performed between all DEGs for the CA and NETRGs samples, and six genes (MMP9, G0S2, MGAM, PLAUR, VNN3, and ERN1) were identified as NETDEGs (Figure 2C). Based on the intersection results, the expression differences of the six NETDEGs between different sample groups in the GSE20681 and GSE42148 datasets were analyzed, and the R package pheatmap was used to draw a heatmap to display the analysis results (Figure 2D and E). Finally, the locations of the six NETDEGs on the human chromosome were analyzed using the R package RCircos, and the chromosome localization map was drawn. The chromosome mapping showed that the six NETDEGs were located on chromosomes 1, 6, 7, 17, 19, and 20, respectively, which were: G0S2 was located on chromosome 1, VNN3 on chromosome 6, MGAM on chromosome 7, ERN1 on chromosome 17, PLAUR on chromosome 19, and MMP9 on chromosome 20 (Figure 2F).
The Prediction Function of the Six NETDEGs Analysis
To explores the expression differences of the six NETDEGs in GSE20681 dataset, the group comparison figure was used to show the difference analysis results of the expression levels of 6 NETDEGs in CA samples and Control samples in GSE20681 dataset. The results showed that five NETDEGs (ERN1, G0S2, PLAUR, MGAM, and MMP9) were highly significantly expressed in CA samples compared to the controls (Figure 3A). A heatmap was drawn to analyze the correlation of the six NETDEGs in GSE20681 dataset, and the results showed that most genes had a significant correlation, among which, MGAM and MMP9 had the strongest positive correlation (R-value = 0.71, P-value < 0.05) (Figure 3B). The R package pROC was used to analyze the ROC curve based on the expression levels of the six NETDEGs in dataset GSE20681, and the results showed that the expression levels of ERN1, G0S2, VNN3, PLAUR, MGAM, and MMP9 in the six NETDEGs showed high accuracy (0.5 < AUC < 0.7) in the classification of CA samples and controls (Figure 3C–E).
 |
Figure 3 The prediction function of the six NETDEGs analysis. (A and B) The comparison diagram of NETDEGs in CA samples and Control samples in dataset GSE20681. (B) Correlation heat map between NETDEGs in dataset GSE20681. (C–E) ROC curves of ERN1 and G0S2 (C) VNN3 and PLAUR (D) MGAM and MMP9 (E) in NETDEGs in dataset GSE20681. (F) The comparison diagram of NETDEGs in CA samples and Control samples in dataset GSE42148. (G) Correlation heat map between NETDEGs in dataset GSE42148. (H–J) ROC curves of ERN1 and G0S2 (H) VNN3 and PLAUR (I) MGAM and MMP9 (J) in NETDEGs in dataset GSE42148. ns represented P-value ≥ 0.05, which had no statistical significance. * means P-value < 0.05, which is statistically significant. ** means P-value < 0.01, which is highly statistically significant. When AUC > 0.5, it indicates that the expression of molecules is the trend to promote the occurrence of events, and the closer the AUC is to 1, the better the diagnostic effect is. AUC has low accuracy at 0.5–0.7, certain accuracy at 0.7–0.9, and high accuracy at above 0.9. Abbreviations: CA, coronary atherosclerosis; ROC, receiver operating characteristic; AUC, area under the curve; TPR, true positive rate; FPR, false positive rate; Cor, correlation. |
For the six NETDEGs in dataset GSE42148, the differential results showed that the expression of ERN1 in the CA samples and the controls in dataset GSE42148 was highly statistically significant (P-value < 0.01) (Figure 3F). Correlation analysis showed that some of the six NETDEGs had a significant correlation, among which G0S2 and PLAUR had the strongest positive correlation (R-value = 0.83, P-value < 0.05) (Figure 3G). The ROC curve showed that the expression levels of six NETDEGs showed certain accuracy (0.7 < AUC < 0.9) in the classification of CA samples and controls (Figure 3H–J).
Biological Characteristics of the CA Samples
The biological characteristics of the six NETDEGs were analyzed using GO and pathway (KEGG) enrichment. The results showed that the six NETDEGs were mainly enriched in the BPs for cell apoptotic regulation, which included the following terms: intrinsic apoptotic signaling pathway, regulation of apoptotic signaling pathway, regulation of cysteine-type endopeptidase activity involved in apoptotic signaling pathway, positive regulation of release of cytochrome c from mitochondria and positive regulation of epidermal growth factor receptor signaling pathway (Figure 4A, Table 2 and Supplementary Table 3). For CCs, the six NETDEGs were significantly enriched in the terms of tertiary granules, ficolin-1-rich granule, secretory granules membranes, serine-type peptidase and endoribonuclease complexes (Figure 4A, Table 2 and Supplementary Table 3). In MFs, six NETDEGs were enriched in the terms of glucosidase activity, platelet-derived growth factor receptor binding, Hsp90 protein binding, and Hsp70 protein binding (Figure 4A, Table 2 and Supplementary Table 3). The KEGG signaling pathway enrichment results showed that the six NETDEGs were involved in the Proteoglycans in cancer and Lipid and atherosclerosis biological pathways (Figure 4A, Table 2, Supplementary Table 3 and Supplementary Figure 2). Meanwhile, the network maps of BPs, CCs, MFs and KEGG enriched terms were drawn according to GO and KEGG enrichment analysis. The results showed that MMP9 and ERN1 were significantly correlated to the bioprocess of cell apoptosis and the pathway of Lipid and atherosclerosis (Figure 4B–E).
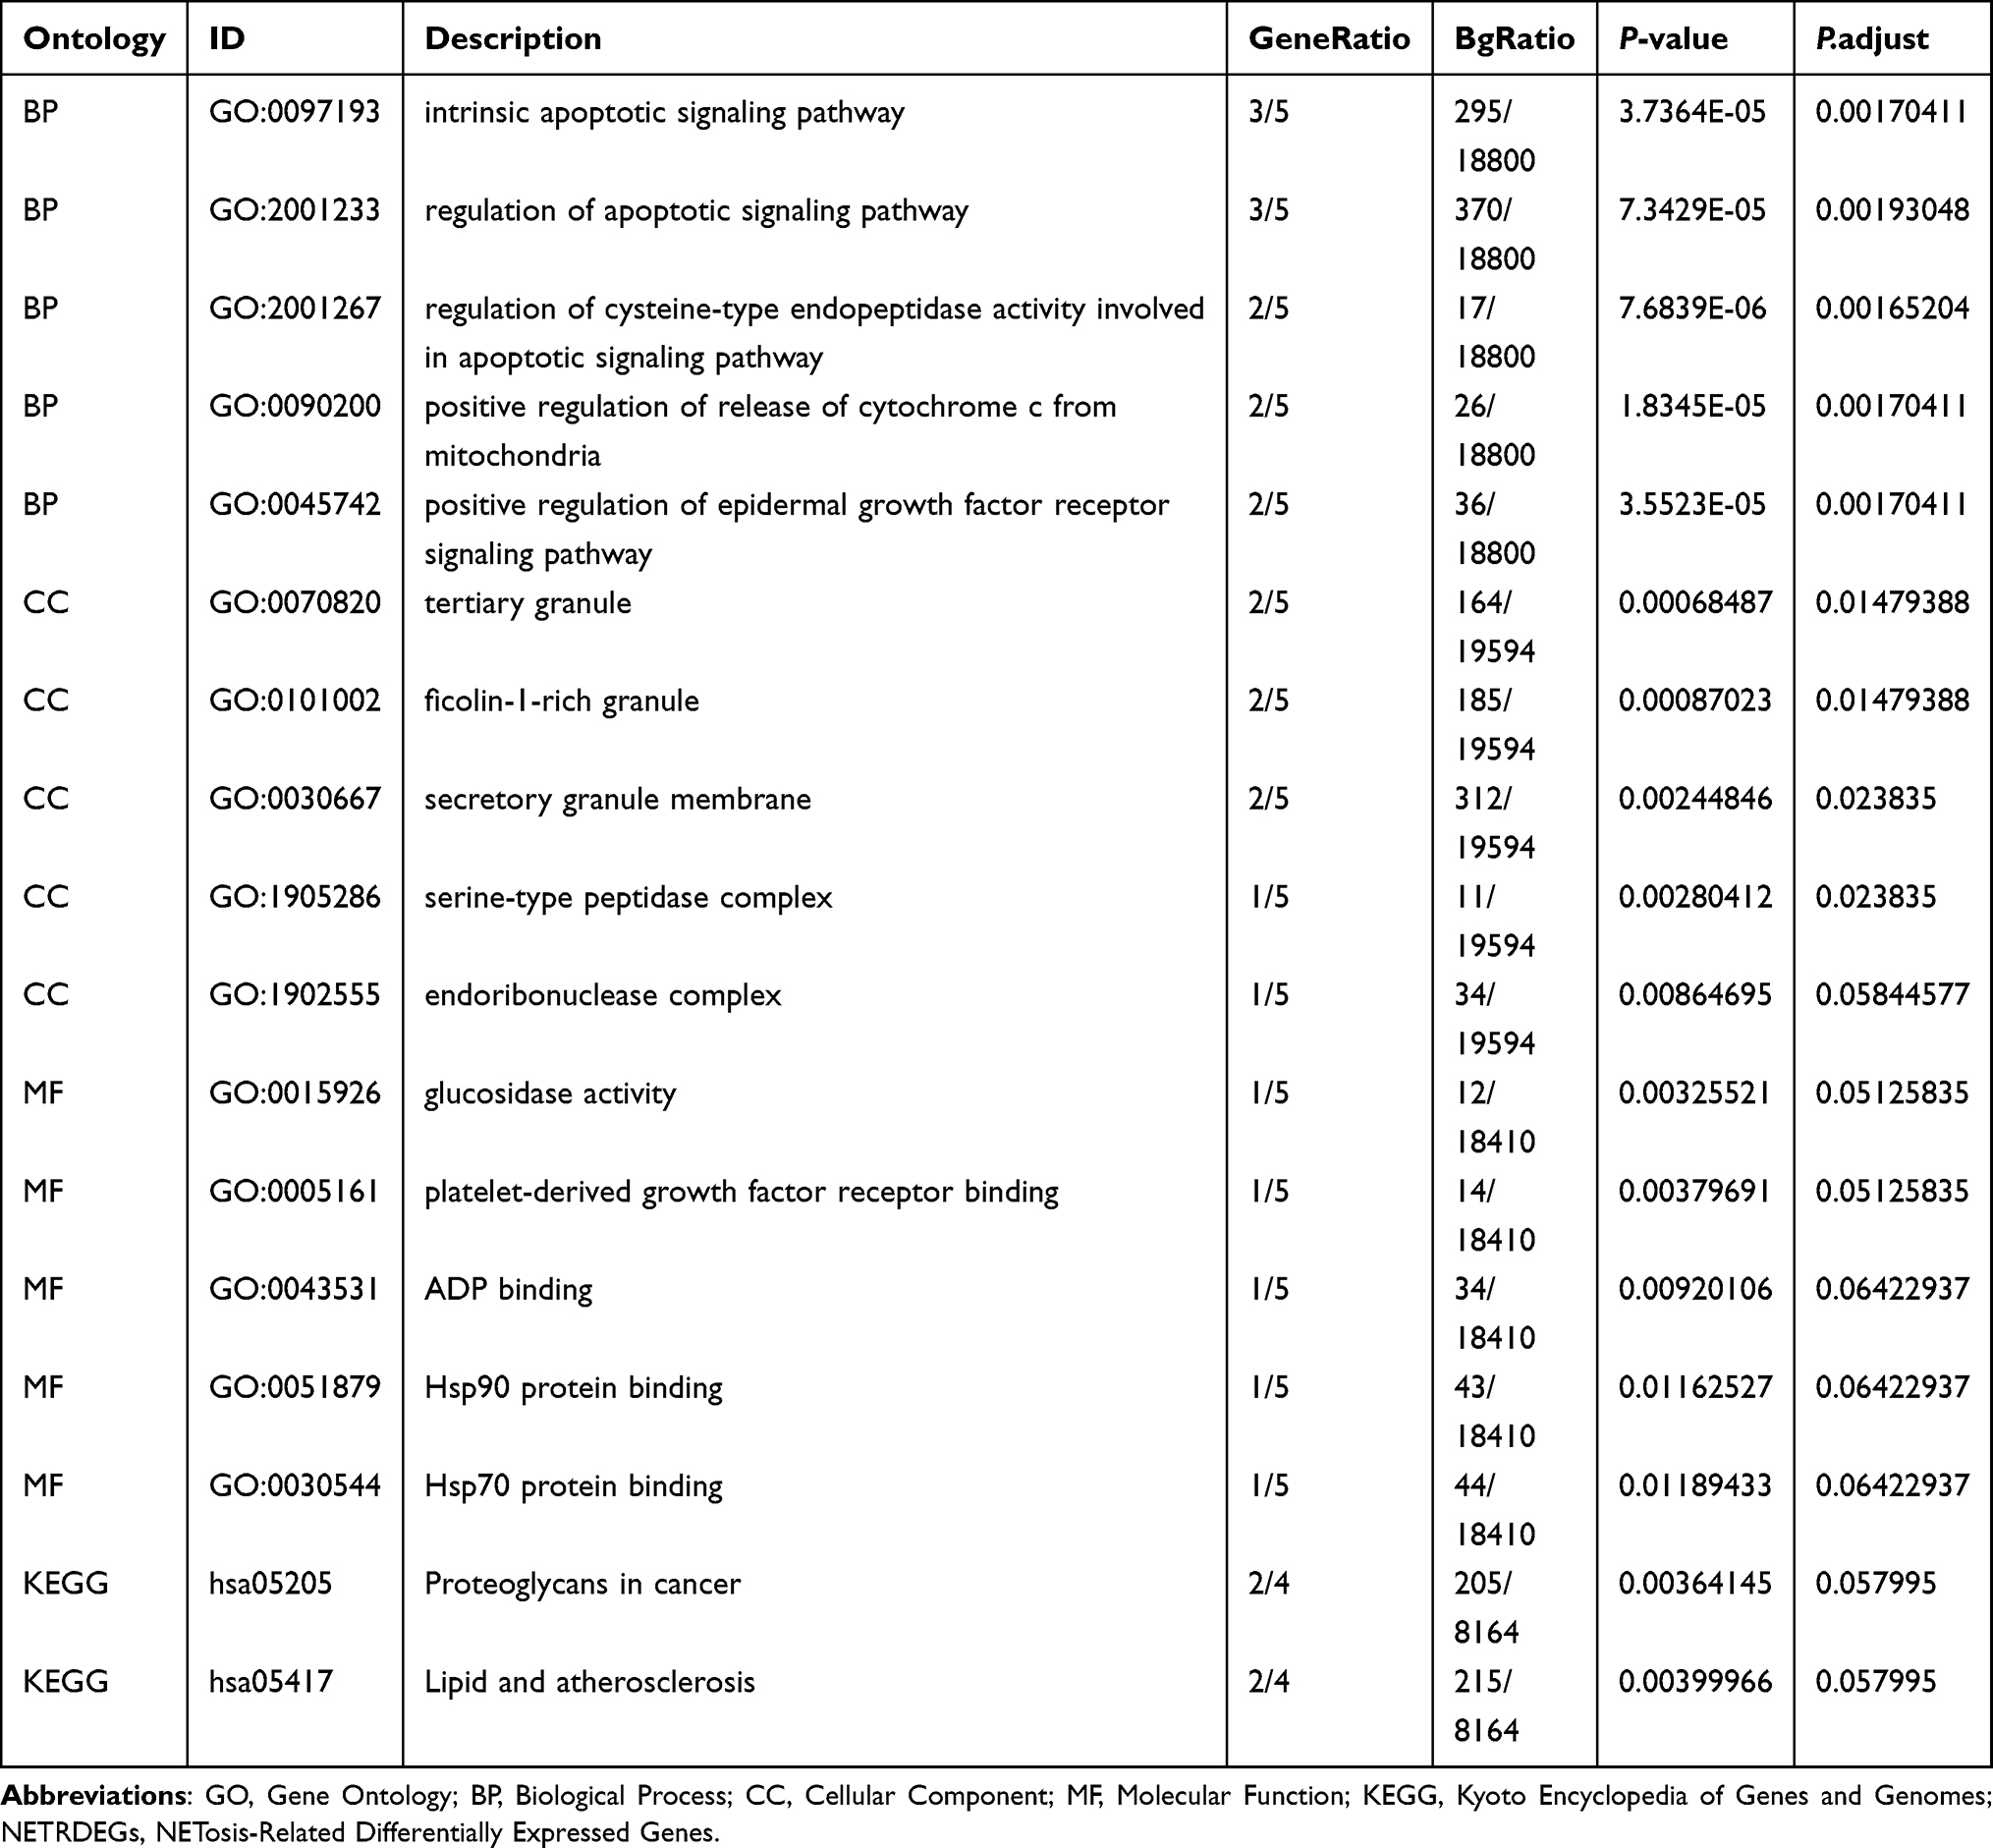 |
Table 2 Results of GO and KEGG Enrichment Analysis for the NETRDEGs |
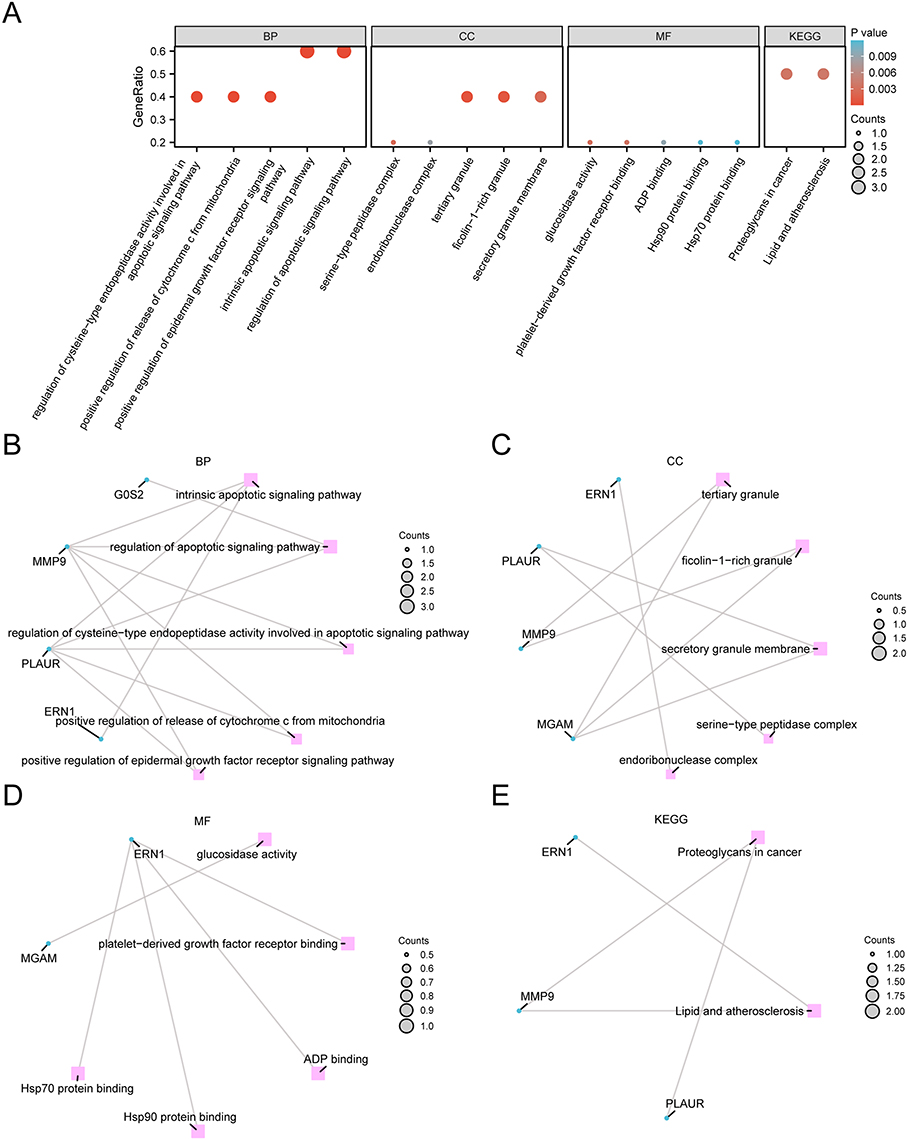 |
Figure 4 GO and KEGG enrichment analysis of the six NETDEGs analysis. (A) Enrichment analysis of GO and pathway (KEGG) of NETDEGs. Bubble map showing BP, CC, MF, and biological pathways (KEGG). The horizontal coordinates are GO terms and KEGG terms. (B–E) The results of GO and pathway (KEGG) enrichment analysis of NETDEGs are shown in the network diagram. Pink nodes represent entries, blue nodes represent molecules, and lines represent relationships between entries and molecules. In the bubble diagram, the size of the bubble represents the number of genes, and the color of the bubble represents the size of the P-value. The redder the color, the smaller the P-value, and the bluer the color, the larger the P-value. Abbreviations: NETDEGs, NETs-related differentially expressed genes; GO, gene ontology; KEGG, Kyoto encyclopedia of genes and genomes; BP, biological process; CC, cellular component; MF, molecular function. |
To further explore the biological characteristics of CA, GSEA was used to investigate the relationship between the expression levels of all genes in dataset GSE20681 and the biological processes, cellular components and molecular functions. The results showed that all genes in dataset GSE20681 were significantly enriched in inflammatory factor-related signaling pathways (Figure 5A, Table 3 and Supplementary Table 4), such as Neutrophil Degranulation (Figure 5B), Interleukin 10 Signaling (Figure 5C), interleukin 6 7 Pathway (Figure 5D), interleukin 6 7 pathway (Figure 5E).
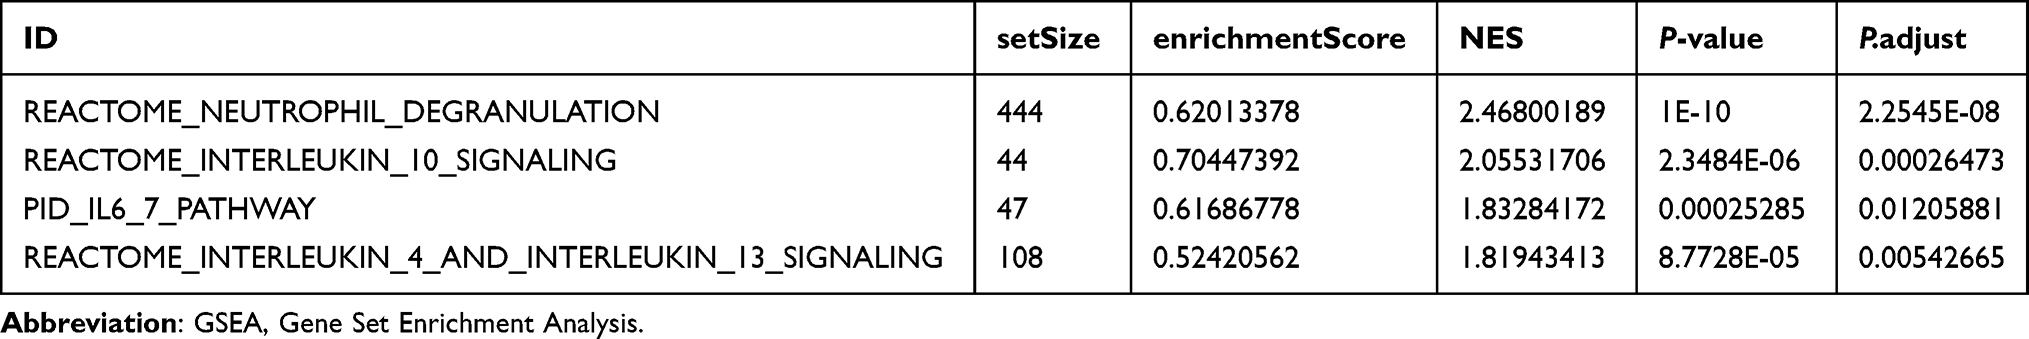 |
Table 3 Results of GSEA Analysis of CA Samples in GSE20681 |
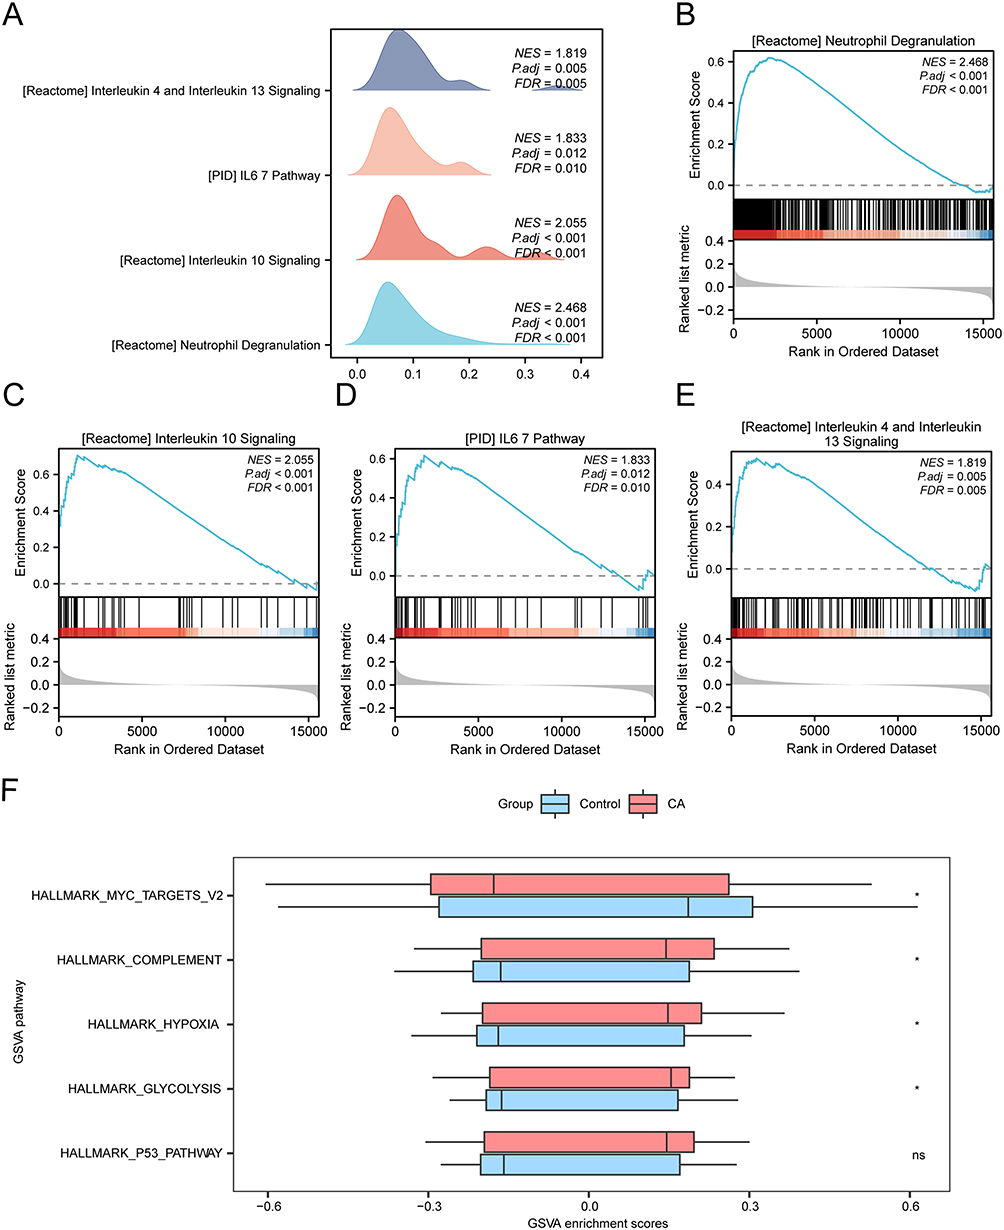 |
Figure 5 GSEA and GSVA analysis of GSE20681. (A) GSEA of data set GSE20681 shows four biological function mountain maps. (B–E) GSEA showed that all genes were significantly enriched in Neutrophil Degranulation (B), Interleukin 10 Signaling (C), Il67 Pathway (D), Interleukin 4 and Interleukin 13 (E). (F) Group comparison maps of the results of GSVA between CA and Control groups in dataset GSE20681. The screening criteria for gene set enrichment analysis (GSEA) were adj.P-value < 0.05 and FDR value (Q-value) < 0.25, and the P-value correction method was Benjamini-Hochberg (BH). The screening criteria for GSVA was P-value < 0.05. * means P-value < 0.05; ns represented P-value ≥ 0.05, which had no statistical significance. Abbreviations: GSEA, gene set enrichment analysis; CA, coronary atherosclerosis; GSVA, gene set variation analysis. |
Moreover, GSVA was further performed on all genes in dataset GSE20681, the logFC ranked Top 10 positive enrichment and negative enrichment pathways with P-value < 0.05 were screened. The results showed that the four pathways glycolysis, complement, and hypoxia were statistically and significantly enriched in CA samples, while myc targets v2 were enriched in the controls (Figure 5F, Table 4, Supplementary Table 5 and Supplementary Figure 3A).
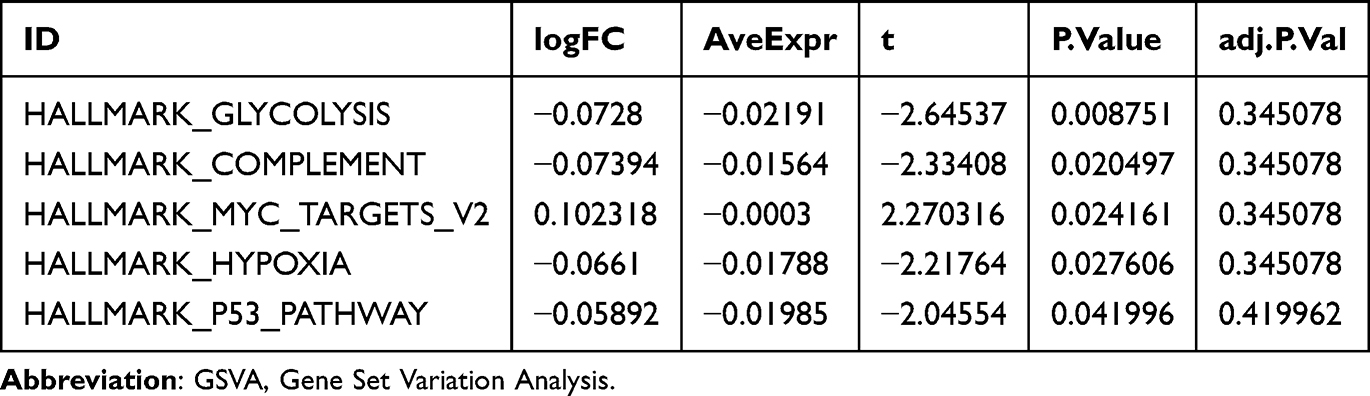 |
Table 4 Results of GSVA Analysis of CA Samples in GSE20681 |
Identification of NETDEGs Traits Connected to CA
To determine the diagnostic value of the NETDEGs, logistic regression was performed, and a logistic regression model was constructed based on the expression of the six genes in GSE20681 data set. The results showed that the six NETDEGs were statistically significant in the Logistic regression model (P-value < 0.05). In addition, the SVM model was constructed based on the expression of the six NETDEGs and SVM algorithm, the number of genes with the lowest error rate (Figure 6A) and the highest accuracy (Figure 6B) analysis result showed that the SVM model had the highest accuracy when the number of genes was 4 (MMP9, ERN1, MGAM and G0S2)., The four genes included in the SVM model were selected, and the LASSO Operator regression analysis was used to construct the diagnostic model of CA. The results showed that three of the four NETDEGs, including MMP9, ERN1, and G0S2, were identified as the prognostic traits (Figure 6C and D, Supplementary Table 6).
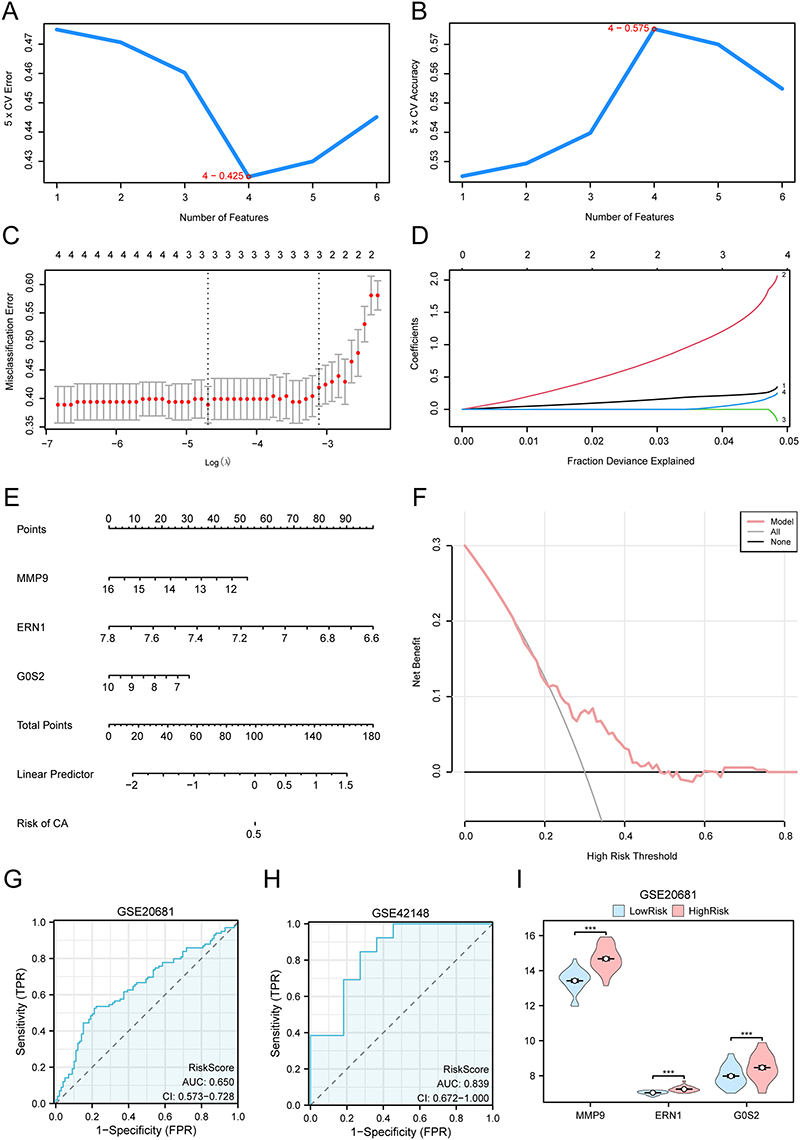 |
Figure 6 Construction of diagnostic model of CA. (A and B) The number of genes with the lowest error rate (A) and the number of genes with the highest accuracy (B) obtained by SVM algorithm are visualized. (C and D) Diagnostic model diagram (C) and variable locus diagram (D) of LASSO regression model. (E) Nomogram of Key Genes in dataset GSE20681 in a diagnostic model of CA. (F) The CA diagnostic model is based on the DCA map of Key Genes in the dataset GSE20681. (G and H) risk score ROC curve in data sets GSE20681 and GSE42148. (I) Grouping comparison diagram of Key Genes in the High- and Low-risk groups of the CA group. *** represents P-value < 0.001, which is highly statistically significant. When AUC > 0.5, it indicates that the expression of molecules is the trend to promote the occurrence of events, and the closer the AUC is to 1, the better the diagnostic effect is. AUC has low accuracy at 0.5–0.7, and AUC has certain accuracy at 0.7–0.9. Light red represents the High-risk group and light blue represents the Low-risk group. Abbreviations: SVM, support vector machine; LASSO, least absolute shrinkage and selection operator; CA, coronary atherosclerosis; DCA, decision curve analysis; ROC, receiver operating characteristic; AUC, area under the curve; TPR, true positive rate; FPR, false positive rate. |
A Nomogram based on the expression of the three prognostic traits was used to further verify the value of CA diagnostic model. The results showed that the expression level of ERN1 had significantly higher utility in the diagnostic model of CA than other variables (Figure 6E). The utility of G0S2 expression in the diagnostic model was significantly lower than that of other variables (Figure 6E). Decision curve analysis (DCA) was used to evaluate the clinical utility of the diagnostic model in dataset GSE20681, and the results showed that the line of the model was stably higher than that all positive and all negative in a certain range, and the net benefit of the model was greater, and the effect of the model was better (Figure 6F). In addition, the R package pROC was used to draw the ROC curve based on the risk score in the GSE20681, and the results showed that the expression level of risk score in dataset GSE20681 showed a low accuracy among different groups (0.5 < AUC < 0.7). As the validation set, we chose GSE42148 and used the three genes to construct the CA diagnostic model, and the results showed that GSE42148 data set showed a certain accuracy with different groups (0.7 < AUC < 0.9) (Figure 6G and H). The CA samples in GSE20681 dataset were then divided into High-risk and Low-risk groups according to the median expression value of risk score of the CA diagnostic model. The differential results showed that the expression levels of the three prognostic traits between the two subgroups were extremely statistically significant (P-value < 0.001) (Figure 6I).
The Biological Pathway Alteration Linked to the Risk Diagnostic Model
To determine the difference of the biological pathways between the two risk groups in dataset GSE20681, GSEA was used to investigate the association between the expression of all 19,749 genes and the biological processes, cellular components, and molecular functions involved in two different risk groups. The results showed that that all genes in the High-risk group were significantly enriched in Neutrophil Degranulation, Il-17 Signaling Pathway, Erythropoietin and Phosphoinositide 3 Kinase Pi3K, Il5 Signaling Pathway and other inflammatory response-related signaling pathways (Figure 7A–E, Table 5 and Supplementary Table 7).
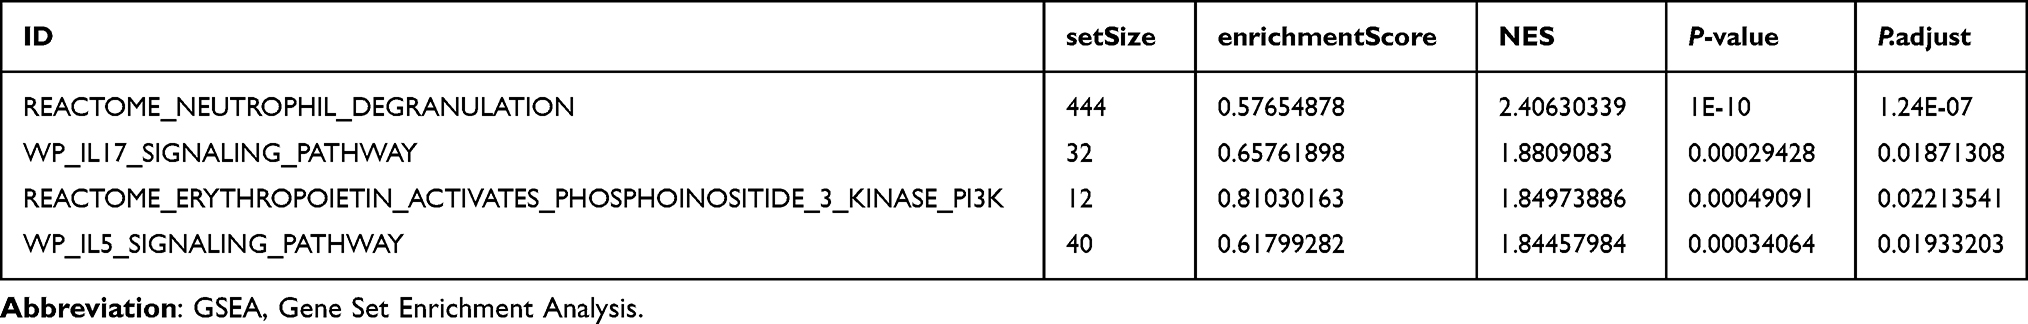 |
Table 5 Results of GSEA Analysis Between Low- and High-Risk Subgroups in GSE20681 |
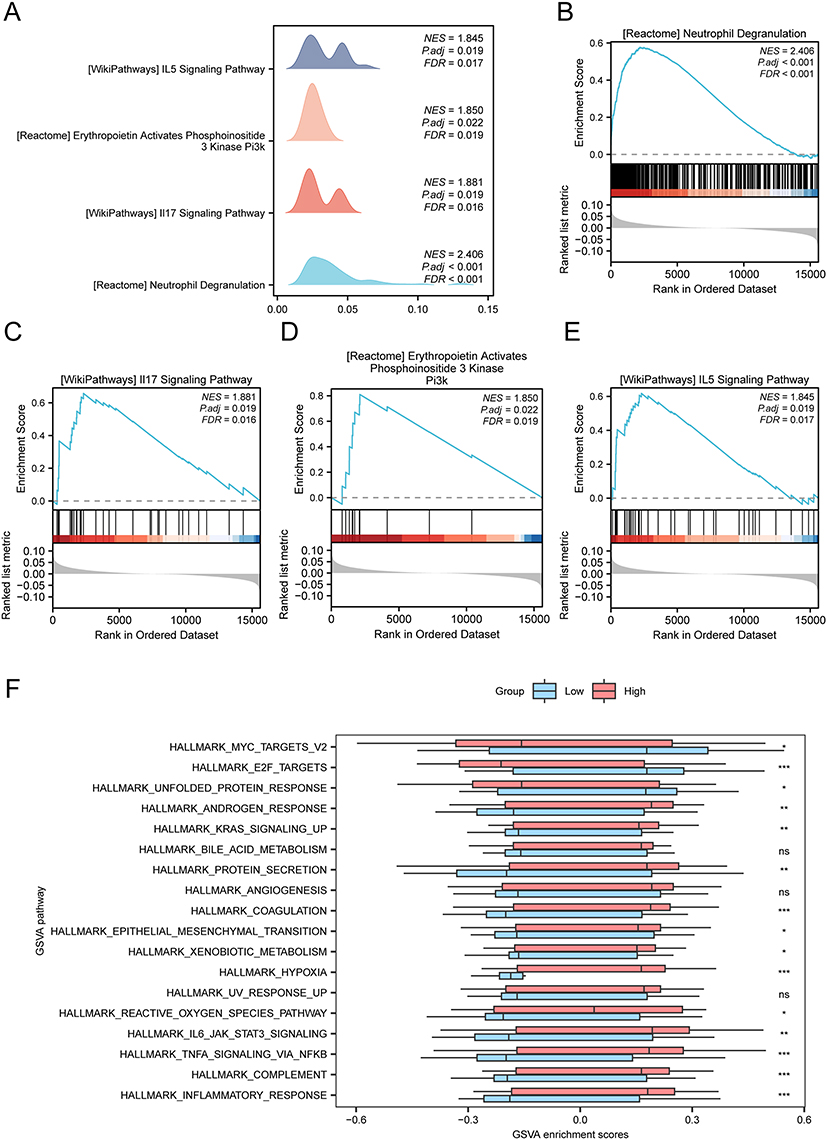 |
Figure 7 GSEA and GSVA enrichment analysis based on high or low risk scores. (A) GSEA of data set GSE20681 shows four biological function mountain maps. (B–E) GSEA showed that all genes were significantly enriched in Neutrophil Degranulation (B) Il-17 Signaling Pathway (C) Erythropoietin Activates Phosphoinositide 3 Kinase Pi3K (D) Il5 Signaling Pathway (E). (F) The group comparison maps of the results of GSVA between CA and Control groups in dataset GSE20681. ns represented P-value ≥ 0.05, which had no statistical significance. * means P-value < 0.05, which is statistically significant; ** means P-value < 0.01, which is highly statistically significant; *** represents P-value < 0.001, which is highly statistically significant. The heat map shows low concentrations in blue and high concentrations in red. The screening criteria for GSVA was P-value < 0.05. The screening criteria for gene set enrichment analysis (GSEA) were adj.P-value < 0.05 and FDR value (Q-value) < 0.25, and the P-value correction method was Benjamini-Hochberg (BH). Abbreviations: GSEA, gene set enrichment analysis; CA, coronary atherosclerosis; GSVA, gene set variation analysis. |
To explore the difference of h.all.v7.4.symbols.gmt gene set between High-risk and Low-risk groups, GSVA was performed on all genes in dataset GSE20681. Positive enrichment pathways with P-value < 0.05 and logFC ranking Top 10 and negative enrichment pathways with Top 10 were screened (Table 6, Supplementary Figure 3B and Supplementary Table 8). Subsequently, the difference was verified based on the Mann–Whitney U-test, and then the group comparison diagram showed that 15 pathways, including hypoxia, coagulation, inflammatory response, TNFa signaling via NFkb, complement, il6 jak stat3 signaling, E2F targets, androgen response, protein secretion, reactive oxygen species pathway, epithelial mesenchymal transition, MYC targets v2, bile acid metabolism, unfolded protein response, and KRAS signaling up, were statistically significant between the two risk groups (P-value < 0.05) (Figure 7F).
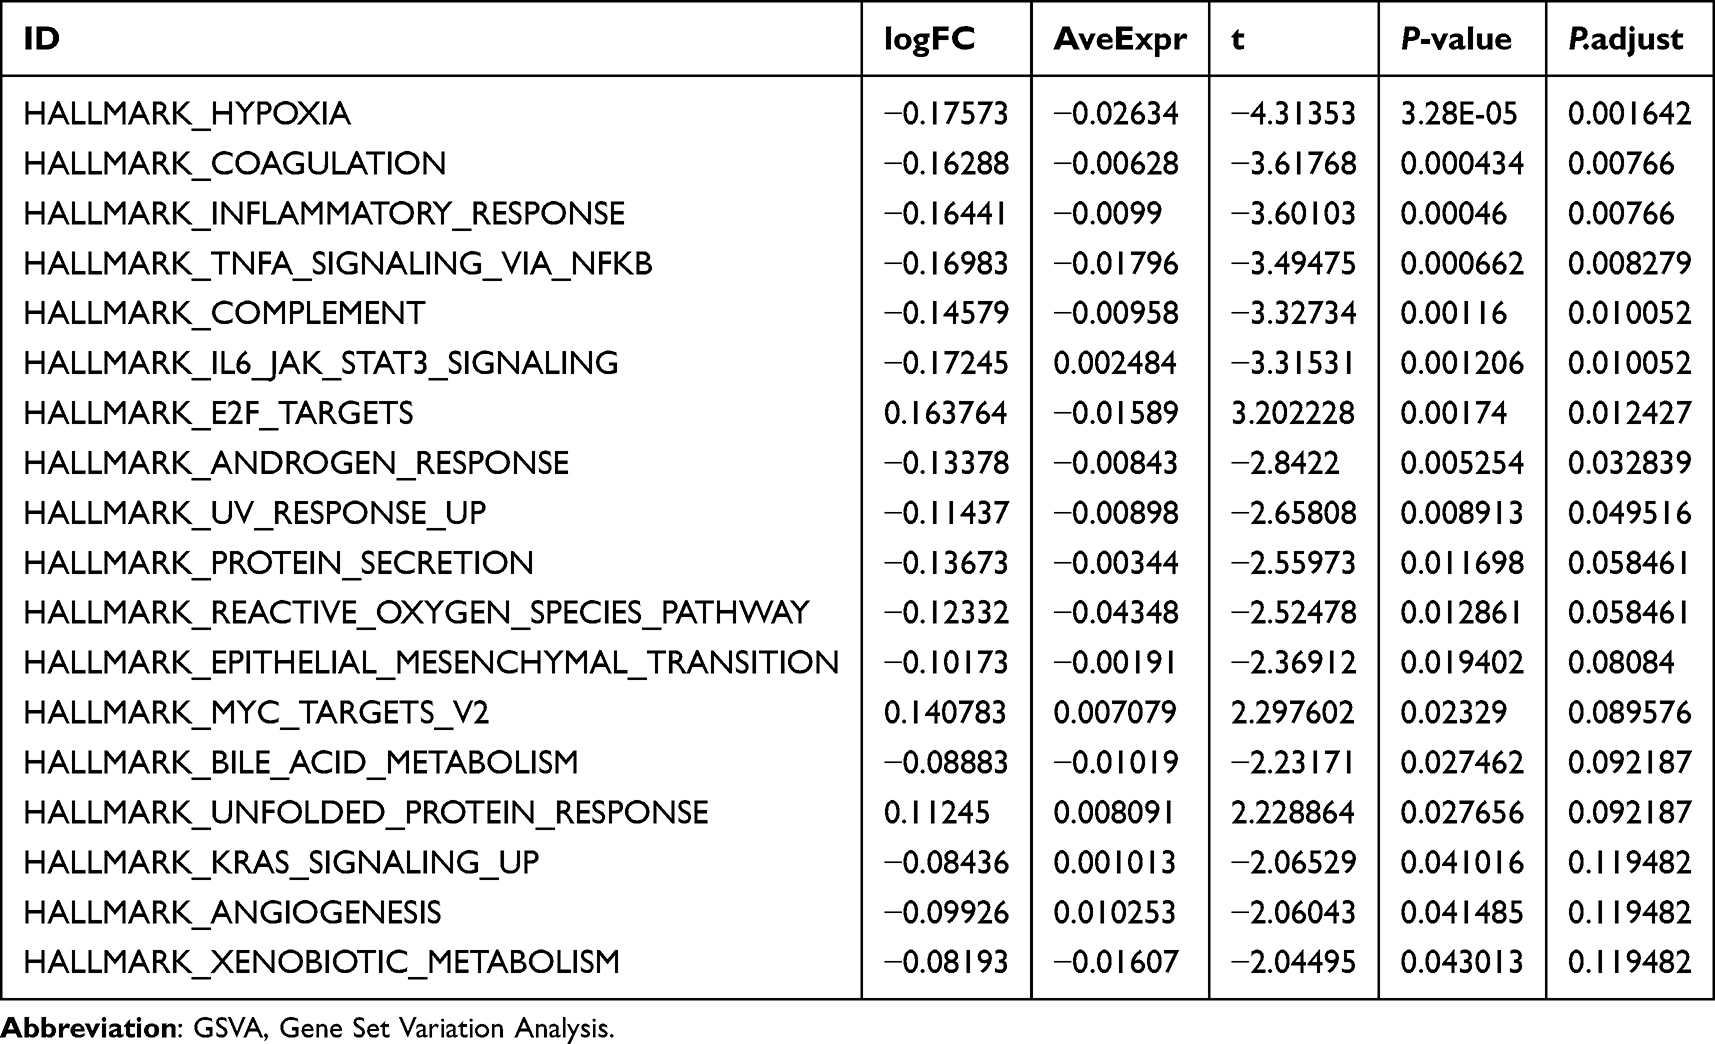 |
Table 6 Results of GSVA Analysis Between Low- and High-Risk Subgroups in GSE20681 |
Immune Infiltration Comparison Between the Two Risk-Group
The immune infiltration of CA samples in the two risk-groups was firstly analyzed using ssGSEA algorithm, and the expression matrix of the samples in dataset GSE20681 was used to calculate the immune infiltration abundance of 28 immune cells. The group comparison plot showed that 13 of the 28 immune cells had statistically and significant differences (P-value < 0.05) (Figure 8A and Supplementary Table 9). Among them, the infiltration proportion of Activated B cell, Activated CD4+ T cell, Activated CD8+ T cell, Effector memory CD8+ T cell, Immature B cell, Type 1 T helper cell, CD56dim natural killer cell were higher in the samples of Low-risk group than them in the samples of High-risk group, while Eosinophil, Immature dendritic cell, Macrophage, Monocyte, Neutrophil, Plasmacytoid dendritic cell were more infiltrated in the samples of the High-risk group (Figure 8A). The correlation results showed that the three prognostic traits were strongly correlated with immune cells infiltration (Figure 8B and C). MMP9 had the strongest positive correlation with Neutrophil both risk groups (R-value = 0.568, P-value < 0.05) (Figure 8B and C). G0S2 also had a strong and positive correlation with the infiltration of Neutrophil in the Low-risk group (Figure 8B).
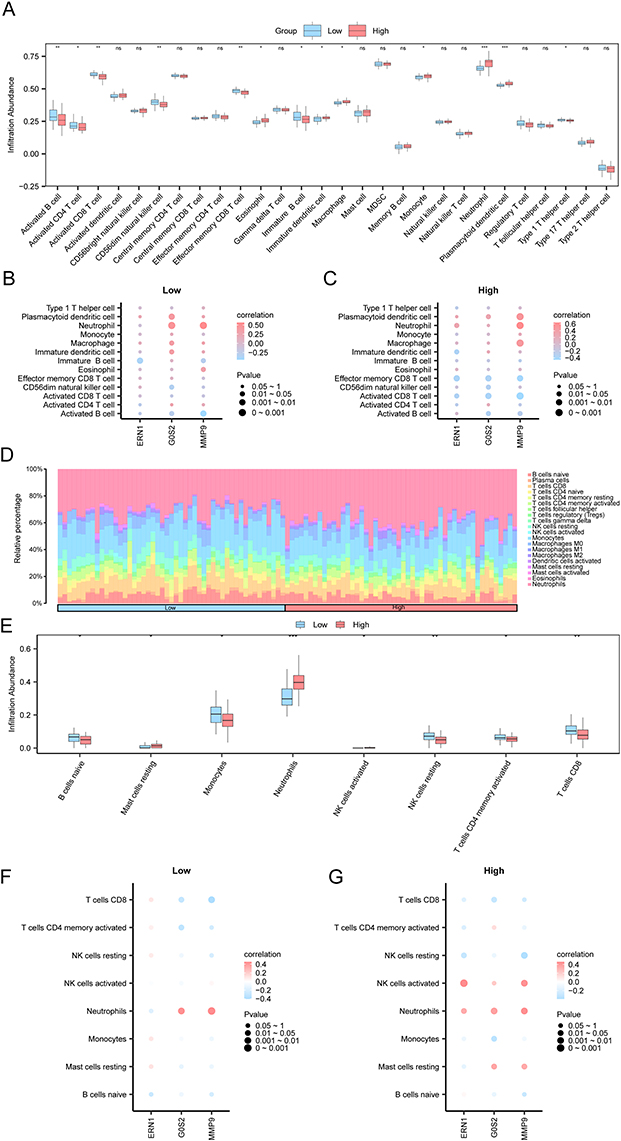 |
Figure 8 Immune infiltration analysis by ssGSEA algorithm and CIBERSORT of Key Genes. (A) The grouping comparison diagram of immune cells in the Low Risk and High Risk groups of dataset GSE20681. (B and C) Correlation bubble maps of the abundance of immune cell infiltration and Key Genes in the Low-risk (B) and High-risk (C) groups of CA. (D) The proportion of immune cells in a CA sample. (E) Grouping of immune cells in a CA sample. (F an G) Bubble map of correlation between the abundance of immune cell infiltration and Key Genes in a CA sample. ns represented P-value ≥ 0.05, which had no statistical significance. * means P-value < 0.05, which is statistically significant. ** means P-value < 0.01, which is highly statistically significant. *** represents P-value < 0.001, which is highly statistically significant. The absolute value of the correlation coefficient (R-value) is a weak correlation between 0.3 and 0.5. Light red is the High-risk group and light blue is the Low-risk group. Red is a positive correlation, blue is a negative correlation, and the depth of the color indicates the strength of the correlation. Abbreviations: CA, coronary atherosclerosis; ssGSEA, single-sample gene-set enrichment analysis. |
CIBERSORT algorithm was further used to analyze the difference in the immune infiltration abundance of 22 immune cells in the two risk groups. The results showed that 20 types of immune cells were enriched in CA samples, respectively, including Naive B cells, Plasma cells, CD8+ T cells, Naive CD4+ T cells, Resting Memory CD4+ T cells, Activated memory CD4+ T cells, Helper follicular T cells, Tregs, Gamma delta T cells, Resting NK cells, Activated NK cells, Monocytes, M0 Macrophages, M1 Macrophages, M2 Macrophages, Activated dendritic cells, Resting mast cells, Activated mast cells, Eosinophils, Neutrophils (Figure 8D and Supplementary Table 10). Among them, Resting mast cells, Neutrophils, and activated NK cells were highly infiltrated in high risk samples compared with the low risk samples, and Naive B cells, CD8+ T cells, Activated memory CD4+ T cells, Resting NK cells, Monocytes were highly filtrated in the Low-risk group (Figure 8E). The results of bubble correlation plots showed that among the CA samples, the strongest positive correlation was found between MMP9 and Neutrophils (R-value = 0.456, P-value < 0.05) (Figure 8F and G). In the High Risk group, ERN1 was showed to be strongest and positively correlated with Activated NK cells (R-value = 0.462, P-value < 0.05) (Figure 8G and Supplementary Table 11). G0S2 in whole blood samples was also positively correlated with systemic neutrophil activity, which may reflect the infiltrated proportion of neutrophils in CA samples in the Low-risk group (Figure 8F and Supplementary Table 12), which was consistent with the results of ssGSEA analysis.
The Potential Regulatory Mechanism of the Three Prognostic Traits
Subsequently, the potential regulatory mechanisms which regulate the expression of these three prognostic traits were analyzed. The TFs that bind to MMP9, ERN1, and G0S2 were obtained from ChIPBase database, and the mRNA-TF Interaction Network was constructed and visualized using Cytoscape software (Figure 9A and Supplementary Table 13), which contained two key genes (MMP9, ERN1) and 33 TFs. The miRNAs related to MMP9, ERN1, and G0S2 were obtained from ENCORI database, and the mRNA-miRNA Interaction Network was constructed and visualized using Cytoscape software (Figure 9B and Supplementary Table 14), which contained two Key Genes (ERN1 and G0S2) and 33 miRNAs. Moreover, the RNA-binding proteins (RBP) related to MMP9, ERN1, and G0S2 were predicted by StarBase database, and the mRNA-RBP Interaction Network was constructed and visualized by Cytoscape software (Figure 9C and Supplementary Table 15), which contained two Key Genes (MMP9, ERN1) and 41 RBPs.
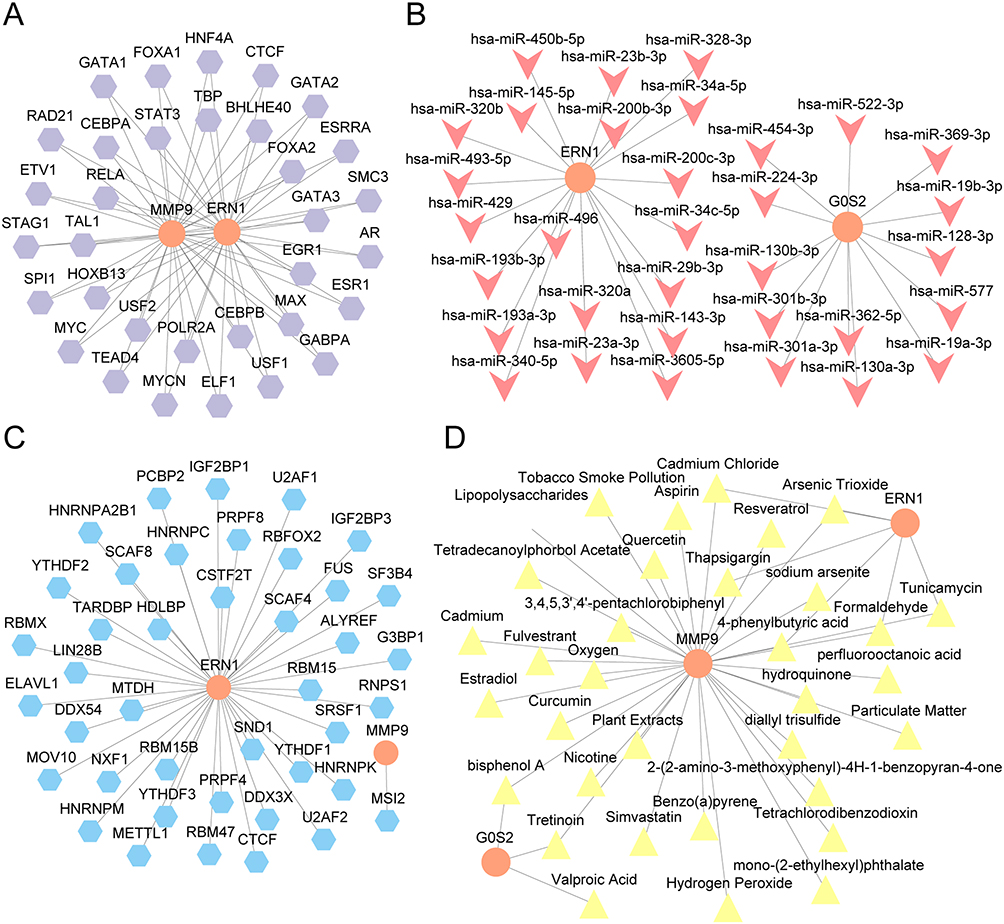 |
Figure 9 Analysis of mRNA-miRNA, mRNA-TF, mRNA-RBP, mRNA-Drug interaction network of Key Genes. (A) The mRNA-TF Interaction Network of key genes. (B) mRNA-miRNA Interaction Network of the key genes. (C) mRNA-RBP Interaction Network of the key genes. (D) The mRNA-Drug Interaction Network of the key genes. Abbreviations: TF, transcription factor; RBP, RNA-binding protein. |
The Potential Regulatory Mechanism of the Three Prognostic Traits
According to the previous results, the NETRGs, MMP9, ERN1, and G0S2 are found to be important in the regulation of CA pathogenicity by promoting cell inflammation. To identify the promising therapies for CA, the three-dimensional structures of the three proteins were analyzed (Supplementary Figure 4), and the potential drugs or molecular compounds related to these genes were identified using the CTD database. The mRNA-Drug Interaction Network was constructed, and the results showed that the three genes were targeted by 34 drugs or molecular components (Figure 9D and Supplementary Table 16). For example, MMP9 was the target of aspirin, resveratrol, and quercetin (Figure 9D and Supplementary Table 16), which all had antioxidant and anti-inflammatory effects. These indicate that these drugs might be the potential therapy for CA by targeting NET-related pathways.
Three Prognostic Traits Were Highly Expressed in CA Samples
In order to verify that these prognostic traits were the potential biomarkers in CA, the peripheral blood, which was obtained from ten normal people and ten CA patients, was collected, and the expression levels of the three prognostic traits were detected. The results of qRT-PCR and Western blotting showed that MMP9, ERN1, and G0S2 were all highly expressed in the peripheral blood of CA patients compared with the normal people (Figure 10), which was consistent with the result of GEO database. These indicate that the enhanced expression levels of these genes might be important for the development of CA, and could be a potential biomarker of this disease.
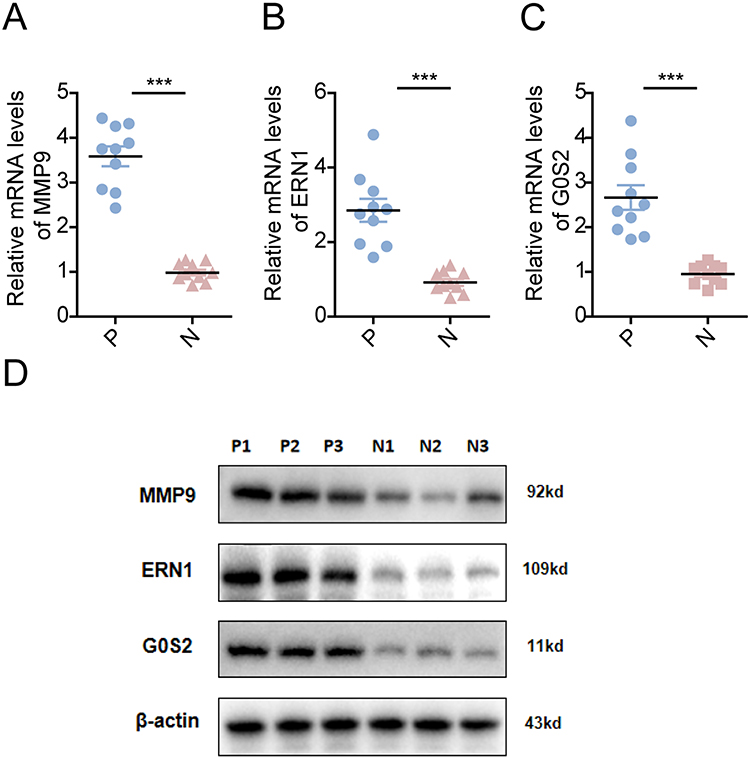 |
Figure 10 Three prognostic traits were highly expressed in CA samples. (A–C) qRT-PCR shows the mRNA expression levels of MMP9 (A), ERN1 (B), G0S2 (C) in CA patients samples. The statistic analysis was performed using t-test, *** represents P-value < 0.001, which is highly statistically significant. (D) Western blotting shows the protein levels of MMP9, ERN1, G0S2 in CA patients samples. Abbreviations: P, CA patients; N, normal people. |
Discussion
With the increasing aging of the population and the improvement in living standards, the morbidity of CA is increasing every year.1–3 CA could cause coronary atherosclerotic heart disease and lead to angina pectoris, myocardial infarction, myocardial fibrosis and sudden coronary death, which is the main reason of death. The treatment of CHD mainly includes lifestyle changes, drug therapy and surgery. Drug treatment is the basis of treatment but they all have their own side effects.5–8 Currently diagnostic tests for CA include blood tests, electrocardiograms, exercise stress tests, coronary CT angiography and coronary angiography, but there are no specific biomarkers for realize the early diagnosis and prognosis assessment of CA. Further studies are needed to identify specific biomarkers of CA to enable the early diagnosis and prognosis assessment of CA. The pathogenesis of CA includes the theory of lipid infiltration, the theory of injury-response response, the role of arterial SMC and the theory of chronic inflammation but the pathogenesis of CA has not been thoroughly elucidated. Overactivation of NETs can also lead to thrombosis.14,35 NETs can promote thrombosis through different mechanisms, such as the negatively charged surface of NETs, which can activate the endogenous coagulation pathway; tissue factor (TF) on NETS, which can activate the exogenous coagulation pathway; and histones, which can activate platelets, inhibit thrombin, and promote platelet aggregation and thrombosis. Interactions between thrombus and endothelial cells can lead to the formation of atherosclerotic plaque.14 A series of inflammatory factors are also risk factors for AS and cardiovascular disease. Therefore, NETs may play a vital role in AS pathogenesis.
Key Findings
In this study, a total of 543 genes were identified as highly expressed genes, and 343 genes were identified as de-expressed genes in dataset CA, which are thought to be important for the disease progression. Among them, six genes (MMP9, G0S2, MGAM, PLAUR, VNN3, ERN1) were screened out to be the NETDEGs, which had a significant correlation, especially MGAM and MMP9, indicating that these NETDEGs are in a network of proteins that regulate each other and may play a coordinated role in the development of CA disease.
According to the ROC curve based on the expression levels of the six NETDEGs in dataset GSE20681, the expression levels of ERN1, G0S2, VNN3, PLAUR, MGAM and MMP9 showed high accuracy in the classification of CA and normal samples, indicating that the six NETDEGs might be the biomarkers for achieve the early diagnosis and prognosis assessment of CA. One study showed the transcript level of G0S2 and the expression of proteins involved in the inflammatory response were increased in coronary atherosclerosis.63 G0S2 could binds the adipose triglyceride lipase (ATGL) and inhibits its enzymatic activity to attenuate lipolysis and promote the release of diacylglycerol (DG) and free fatty acid (FFA), further leading to the accidence of CA.64,65 Another Meta analysis showed MGAM increased in CA datasets.66 Ninj1 [nerve injury-induced protein], the substrate of MMP9, could regulate macrophage inflammation and monocyte recruitment to mediate anti-inflammatory effects, protect the body from CA. The high expression of MMP967 could promote the decomposition of Ninj1 promoting an inflammatory response to contribute to CA, consistent with our study.68 Furthermore, MMP9 is encoded by CA risk gene69 and was a proatherogenic proteases.70 It participates in the transition from a stable to an unstable atherosclerotic lesion.71,72 ERN1 participates in endoplasmic reticulum (ER) stress response to activate autophagy, further leading to CA.73–75 ERN1, VNN3 and PLAUR are genes involved in inflammation, that may contribute to the formation of atherosclerotic plaques. Therefore, these six genes have the potential to be biomarkers to conduct early diagnosis and prognosis assessment and the effective therapeutic targets for CA.
According to the network maps of GO and KEGG enrichment, MMP9 and ERN1 were significantly correlated to the bioprocess of cell apoptosis and the of lipid and atherosclerosis pathways. MMP9 is encoded by CA risk gene69 and is a proatherogenic proteases.70 It could participate in the transition from a stable to an unstable atherosclerotic lesion71,72 and could promote the decomposition of Ninj1 promoting inflammatory response to contribute to CA.68 In a pathological state, ERN1 participates in ER stress response to activate autophagy and further leads the formation of atherosclerotic plaque.73–75Therefore, MMP9 and ERN1 may contribute to the pathogenesis of AS by involving in lipids and atherosclerosis and the cell apoptotic pathway. Combined with the GSEA and GSVA results, we found that all genes in CA were significantly enriched in inflammatory factor-related signaling pathways, which was consistent with the above results. Therefore, the inflammation may play an indispensable role in AS pathogenesis.
After the combination analysis of logistic regression model, SVM model, and LASSO Operator regression analysis, three genes (MMP9, ERN1, and G0S2) were identified to be the prognostic traits, based on which the disease samples were divided into high- and Low-risk subgroups. The immune infiltration analysis showed that 13 of the 28 immune cells had statistical and significant differences and the infiltration proportion of Activated B cell, Activated CD4+ T cell, Activated CD8+ T cell, Effector memory CD8+ T cell, Immature B cell, Type 1 T helper cell, CD56dim natural killer cell were higher in the samples of Low-risk group than them in the samples of High-risk group, while Eosinophil, Immature dendritic cell, Macrophage, Monocyte, Neutrophil, Plasmacytoid dendritic cell were more infiltrated in the samples of the High-risk group. The correlation results showed that the three prognostic traits had a strong correlation with immune cell infiltration and MMP9 had the strongest positive correlation with Neutrophil in both risk groups while G0S2 had a strong and positive correlation with the infiltration of Neutrophil in the Low-risk group. Neutrophils are derived from bone marrow and are important inflammatory cells. They could migrate from the bloodstream to sites of inflammation and induce inflammation.76 A study showed neutrophil aggregation increased in the patients with CA.77 Neutrophils could mediate the damage of the vascular and myocardial by degranulation78 and stimulated neutrophils could secrete proteolytic neutral proteases to promote the detachment of endothelial cells from vessel walls and the adherence of platelets to subendothelial collagen and fibronectin.79 The results showed that immune cells, especially neutrophils, participate in the pathogenesis of CA and MMP9 and G0S2 may interact with neutrophil to involved in inflammation leading to CA.
The molecular pathways that regulate the three prognostic traits were analyzed, including TFs, miRNAs, and RBPs, which further indicated that these genes are regulated via multiple pathways. Finally, the potential drugs or molecular compounds related to these genes were identified and the mRNA-Drug Interaction Network was constructed. The results revealed that the potential regulatory mechanisms and drug targets of MMP9, ERN1, and G0S2, which showed the potential pathogenesis and therapeutic agents of CA, providing a potential application in clinic. The mRNA-Drug Interaction Network showed that MMP9 was the target of aspirin, resveratrol, and quercetin, which all had antioxidant and anti-inflammatory effects. Aspirin is a typical antipyretic analgesic, non-steroidal anti-inflammatory drug, anti-platelet aggregation drug.80–82 It is used to reduce the incidence of myocardial infarction, transient cerebral ischemia or stroke in patients with CA. A series of studies have shown that resveratrol could exert protective effect on heart because it effect on reducing low-density lipoprotein (LDL), increasing high-density lipoprotein (HDL),83 reducing oxidative stress,84,85 preventing platelet aggregation and promoting coronary vasorelaxation,86,87 which could implement anti-atherogenic effect.88 Quercetin could inhibit the proliferation, migration, and inflammatory response of SMC by inhibiting the expression of fibroblast growth factor 2 (FGF2), which could anti-CA function and be potential drug for CA treatment.89 These results indicate that MMP9, ERN1, and G0S2 had the potential to be a biomarkers for achieve early diagnosis and prognosis assessment and as the therapeutic targets of CA. Aspirin, resveratrol, and quercetin are the potential drugs for CA.
Strength and Limitation
This study showed MMP9, ERN1, and G0S2 had the potential to be a biomarkers to achieve early diagnosis and prognosis assessment and be the therapeutic targets of CA and showed the potential mechanism to lead to CA. G0S2 can involved in inflammatory response63 and has a strong and positive correlation with the infiltration of Neutrophil. Therefore G0S2 might interact with neutrophil to involved in inflammation which leads to CA. The high expression of MMP967 could promote the decomposition of Ninj1 promote inflammation response68 and MMP9 is encoded by CA risk gene69 and it participates in the transition from a stable to an unstable atherosclerotic lesion.71,72 Furthermore, MMP9 also had the strongest positive correlation with Neutrophil and the interaction between it and Neutrophil can contribute to CA through inflammatory response. In a pathological state, ERN1 could participate in ER stress response to activate autophagy and further lead the formation of atherosclerotic plaque73–75 and contribute to the pathogenesis of AS by involved in lipid and atherosclerosis and cell apoptosis pathways. In addition, it involved in inflammation which leads to CA.
Although it provides biomarkers to conduct early diagnosis and prognosis assessment of CA and provides a potential mechanism of CA but the specific mechanism to leading to CA has not be clarified and CA patients are needed to verify the diagnose value of the three genes (MMP9, ERN1, and G0S2). However, further experiments are required to be done. First, only bioinformation analysis showed the potential mechanism of CA but not experiments were done to reveal the detailed mechanism of CA. Second, the research only constructed the model to conducted diagnosis and prognosis assessment but there is no large-scale patient cohort validation. Third, potential drugs or molecular compounds were only predicted with bioinformation but not experiments to verify their effects to treat CA.
Conclusion
Through the research, MMP9, ERN1, and G0S2 were identified for the diagnosis and prognosis assessment of CA and their potential mechanism to contribute to CA and potential drugs to treat CA were revealed. The above conclusions were further verified through qRT-PCR and Western blotting from the peripheral blood obtained from ten normal people and ten CAD patients. This study provides novel biomarker for the diagnosis and prognosis assessment of CA and to reveal novel mechanism leading to CA, which will promote the research progress of CA.
Highlights
- MMP9, ERN1, and G0S2 were identified as NET-related traits in CA.
- A three-gene prognostic model for CA has been developed.
- Therapeutic drugs forecast targeting NET-related traits.
Data Sharing Statement
The datasets presented in this study could be found in online repositories. The names of the repository/repositories and accession number(s) could be found in the article/Supplementary Material.
Ethics Statement
This study was approved by the Ethics Committee of Qingdao Traditional Chinese Medicine Hospital and informed consent was obtained from the patient (2022HC05LS001). This study was conducted in accordance with the principles of the Declaration of Helsinki.
Author Contributions
All authors made a significant contribution to the work reported, whether that is in the conception, study design, execution, acquisition of data, analysis and interpretation, or in all these areas; took part in drafting, revising or critically reviewing the article; gave final approval of the version to be published; have agreed on the journal to which the article has been submitted; and agree to be accountable for all aspects of the work.
Funding
This work was supported by National Natural Science Foundation of China (Grant No.82405384 to Ting Jiang).
Disclosure
The authors declare that they have no competing interests.
References
1. Malakar AK, Choudhury D, Halder B, et al. A review on coronary artery disease, its risk factors, and therapeutics. J Cell Physiol. 2019;234(10):16812–16823. doi:10.1002/jcp.28350
2. Steg PG, Ducrocq G. Future of the prevention and treatment of coronary artery disease. Circ J. 2016;80(5):1067–1072. doi:10.1253/circj.CJ-16-0266
3. Zhang Y, Li -J-J, Xu R, et al. Nogo-B mediates endothelial oxidative stress and inflammation to promote coronary atherosclerosis in pressure-overloaded mouse hearts. Redox Biol. 2023;68:102944. doi:10.1016/j.redox.2023.102944
4. Virani SS, Alonso A, Aparicio HJ, et al. Heart disease and stroke statistics-2021 update: a report from the American Heart Association. Circulation. 2021;143(8):e254–e743. doi:10.1161/CIR.0000000000000950
5. DeFilippis AP, Chapman AR, Mills NL, et al. Assessment and treatment of patients with type 2 myocardial infarction and acute nonischemic myocardial injury. Circulation. 2019;140(20):1661–1678. doi:10.1161/CIRCULATIONAHA.119.040631
6. Hausenloy DJ, Chilian W, Crea F, et al. The coronary circulation in acute myocardial ischaemia/reperfusion injury: a target for cardioprotection. Cardiovasc Res. 2019;115(7):1143–1155. doi:10.1093/cvr/cvy286
7. Hayes SN, Kim ESH, Saw J, et al. Spontaneous coronary artery dissection: current state of the science: a scientific statement from the American Heart Association. Circulation. 2018;137(19):e523–e557. doi:10.1161/CIR.0000000000000564
8. Stone PH, Libby P, Boden WE, et al. Fundamental pathobiology of coronary atherosclerosis and clinical implications for chronic ischemic heart disease management-the plaque hypothesis: a narrative review. JAMA Cardiol. 2023;8(2):192–201. doi:10.1001/jamacardio.2022.3926
9. Libby P. Inflammation in atherosclerosis. Nature. 2002;420(6917):868–874. doi:10.1038/nature01323
10. Libby P, Theroux P. Pathophysiology of coronary artery disease. Circulation. 2005;111(25):3481–3488. doi:10.1161/CIRCULATIONAHA.105.537878
11. Williams KJ, Tabas I. The response-to-retention hypothesis of atherogenesis reinforced. Curr Opin Lipidol. 1998;9(5):471–474. doi:10.1097/00041433-199810000-00012
12. Brinkmann V, Reichard U, Goosmann C, et al. Neutrophil extracellular traps kill bacteria. Science. 2004;303(5663):1532–1535. doi:10.1126/science.1092385
13. Zheng Z, Li Y-N, Jia S, et al. Lung mesenchymal stromal cells influenced by Th2 cytokines mobilize neutrophils and facilitate metastasis by producing complement C3. Nat Commun. 2021;12(1):6202. doi:10.1038/s41467-021-26460-z
14. Tu H, Ren H, Jiang J, et al. Dying to defend: neutrophil death pathways and their implications in immunity. Adv Sci. 2024;11(8):e2306457. doi:10.1002/advs.202306457
15. Honda M, Kubes P. Neutrophils and neutrophil extracellular traps in the liver and gastrointestinal system. Nat Rev Gastroenterol Hepatol. 2018;15(4):206–221. doi:10.1038/nrgastro.2017.183
16. Garcia-Romo GS, Caielli S, Vega B, et al. Netting neutrophils are major inducers of type I IFN production in pediatric systemic lupus erythematosus. Sci Transl Med. 2011;3(73):73ra20. doi:10.1126/scitranslmed.3001201
17. Cools-Lartigue J, Spicer J, Najmeh S, et al. Neutrophil extracellular traps in cancer progression. Cell Mol Life Sci. 2014;71(21):4179–4194. doi:10.1007/s00018-014-1683-3
18. Berger-Achituv S, Brinkmann V, Abed UA, et al. A proposed role for neutrophil extracellular traps in cancer immunoediting. Front Immunol. 2013;4:48. doi:10.3389/fimmu.2013.00048
19. Demers M, Krause DS, Schatzberg D, et al. Cancers predispose neutrophils to release extracellular DNA traps that contribute to cancer-associated thrombosis. Proc Natl Acad Sci U S A. 2012;109(32):13076–13081. doi:10.1073/pnas.1200419109
20. Zhou J, Stohlman SA, Hinton DR, et al. Neutrophils promote mononuclear cell infiltration during viral-induced encephalitis. J Immunol. 2003;170(6):3331–3336. doi:10.4049/jimmunol.170.6.3331
21. Cools-Lartigue J, Spicer J, McDonald B, et al. Neutrophil extracellular traps sequester circulating tumor cells and promote metastasis. J Clin Invest. 2013;123(8):3446–3458. doi:10.1172/JCI67484
22. Sangaletti S, Tripodo C, Vitali C, et al. Defective stromal remodeling and neutrophil extracellular traps in lymphoid tissues favor the transition from autoimmunity to lymphoma. Cancer Discov. 2014;4(1):110–129. doi:10.1158/2159-8290.CD-13-0276
23. Acuff HB, Carter KJ, Fingleton B, et al. Matrix metalloproteinase-9 from bone marrow-derived cells contributes to survival but not growth of tumor cells in the lung microenvironment. Cancer Res. 2006;66(1):259–266. doi:10.1158/0008-5472.CAN-05-2502
24. Coussens LM, Tinkle CL, Hanahan D, et al. MMP-9 supplied by bone marrow-derived cells contributes to skin carcinogenesis. Cell. 2000;103(3):481–490. doi:10.1016/S0092-8674(00)00139-2
25. Masson V, De La Ballina LR, Munaut C, et al. Contribution of host MMP-2 and MMP-9 to promote tumor vascularization and invasion of malignant keratinocytes. FASEB j. 2005;19(2):234–236. doi:10.1096/fj.04-2140fje
26. Maksimowicz T, Chyczewska E, Chyczewski L, et al. Activity and tissue localization of cathepsin G in non small cell lung cancer. Rocz Akad Med Bialymst. 1997;42(Suppl 1):199–216.
27. Bergers G, Brekken R, McMahon G, et al. Matrix metalloproteinase-9 triggers the angiogenic switch during carcinogenesis. Nat Cell Biol. 2000;2(10):737–744. doi:10.1038/35036374
28. Nozawa H, Chiu C, Hanahan D, et al. Infiltrating neutrophils mediate the initial angiogenic switch in a mouse model of multistage carcinogenesis. Proc Natl Acad Sci U S A. 2006;103(33):12493–12498. doi:10.1073/pnas.0601807103
29. Cedervall J, Zhang Y, Huang H, et al. Neutrophil extracellular traps accumulate in peripheral blood vessels and compromise organ function in tumor-bearing animals. Cancer Res. 2015;75(13):2653–2662. doi:10.1158/0008-5472.CAN-14-3299
30. Erpenbeck L, Schön MP. Neutrophil extracellular traps: protagonists of cancer progression? Oncogene. 2017;36(18):2483–2490. doi:10.1038/onc.2016.406
31. Wigerblad G, Kaplan MJ. Neutrophil extracellular traps in systemic autoimmune and autoinflammatory diseases. Nat Rev Immunol. 2023;23(5):274–288. doi:10.1038/s41577-022-00787-0
32. Papayannopoulos V. Neutrophil extracellular traps in immunity and disease. Nat Rev Immunol. 2018;18(2):134–147. doi:10.1038/nri.2017.105
33. Lee KH, Kronbichler A, Park DD-Y, et al. Neutrophil extracellular traps (NETs) in autoimmune diseases: a comprehensive review. Autoimmun Rev. 2017;16(11):1160–1173. doi:10.1016/j.autrev.2017.09.012
34. Mistry P, Nakabo S, O’Neil L, et al. Transcriptomic, epigenetic, and functional analyses implicate neutrophil diversity in the pathogenesis of systemic lupus erythematosus. Proc Natl Acad Sci U S A. 2019;116(50):25222–25228. doi:10.1073/pnas.1908576116
35. Clark SR, Ma AC, Tavener SA, et al. Platelet TLR4 activates neutrophil extracellular traps to ensnare bacteria in septic blood. Nat Med. 2007;13(4):463–469. doi:10.1038/nm1565
36. Elashoff MR, Wingrove JA, Beineke P, et al. Development of a blood-based gene expression algorithm for assessment of obstructive coronary artery disease in non-diabetic patients. BMC Med Genomics. 2011;4:26. doi:10.1186/1755-8794-4-26
37. Beineke P, Fitch K, Tao H, et al. A whole blood gene expression-based signature for smoking status. BMC Med Genomics. 2012;5:58. doi:10.1186/1755-8794-5-58
38. Zhang B, He M. Identification of potential biomarkers for coronary artery disease based on cuproptosis. Cardiovasc Ther. 2023;2023:5996144. doi:10.1155/2023/5996144
39. Taguchi K, Hamamoto S, Okada A, et al. Genome-wide gene expression profiling of randall’s plaques in calcium oxalate stone formers. J Am Soc Nephrol. 2017;28(1):333–347. doi:10.1681/ASN.2015111271
40. Davis S, Meltzer PS. GEOquery: a bridge between the Gene Expression Omnibus (GEO) and BioConductor. Bioinformatics. 2007;23(14):1846–1847. doi:10.1093/bioinformatics/btm254
41. Stelzer G, Rosen N, Plaschkes I, et al. The GeneCards suite: from gene data mining to disease genome sequence analyses. Curr Protoc Bioinf. 2016;54:
42. Qi L, Chen F, Wang L, et al. Deciphering the role of NETosis-related signatures in the prognosis and immunotherapy of soft-tissue sarcoma using machine learning. Front Pharmacol. 2023;14:1217488. doi:10.3389/fphar.2023.1217488
43. Leek JT, Johnson WE, Parker HS, et al. The sva package for removing batch effects and other unwanted variation in high-throughput experiments. Bioinformatics. 2012;28(6):882–883. doi:10.1093/bioinformatics/bts034
44. Ritchie ME, Phipson B, Wu D, et al. limma powers differential expression analyses for RNA-sequencing and microarray studies. Nucleic Acids Res. 2015;43(7):e47. doi:10.1093/nar/gkv007
45. Zhang H, Meltzer P, Davis S, et al. RCircos: an R package for Circos 2D track plots. BMC Bioinf. 2013;14:244. doi:10.1186/1471-2105-14-244
46. Yu G, Wang L-G, Han Y, et al. clusterProfiler: an R package for comparing biological themes among gene clusters. Omics. 2012;16(5):284–287. doi:10.1089/omi.2011.0118
47. Mi H, Muruganujan A, Ebert D, et al. PANTHER version 14: more genomes, a new PANTHER GO-slim and improvements in enrichment analysis tools. Nucleic Acids Res. 2019;47(D1):D419–d426. doi:10.1093/nar/gky1038
48. Kanehisa M, Goto S. KEGG: Kyoto encyclopedia of genes and genomes. Nucleic Acids Res. 2000;28(1):27–30. doi:10.1093/nar/28.1.27
49. Luo W, Brouwer C. Pathview: an R/Bioconductor package for pathway-based data integration and visualization. Bioinformatics. 2013;29(14):1830–1831. doi:10.1093/bioinformatics/btt285
50. Subramanian A, Tamayo P, Mootha VK, et al. Gene set enrichment analysis: a knowledge-based approach for interpreting genome-wide expression profiles. Proc Natl Acad Sci U S A. 2005;102(43):15545–15550. doi:10.1073/pnas.0506580102
51. Liberzon A, Subramanian A, Pinchback R, et al. Molecular signatures database (MSigDB) 3.0. Bioinformatics. 2011;27(12):1739–1740. doi:10.1093/bioinformatics/btr260
52. Hänzelmann S, Castelo R, Guinney J, et al. GSVA: gene set variation analysis for microarray and RNA-seq data. BMC Bioinf. 2013;14:7. doi:10.1186/1471-2105-14-7
53. Sanz H, Valim C, Vegas E, et al. SVM-RFE: selection and visualization of the most relevant features through non-linear kernels. BMC Bioinf. 2018;19:432. doi:10.1186/s12859-018-2451-4
54. Engebretsen S, Bohlin J. Statistical predictions with glmnet. Clin Clin Epigenet. 2019;11(1):123. doi:10.1186/s13148-019-0730-1
55. Wu J, Zhang H, Li L, et al. A nomogram for predicting overall survival in patients with low-grade endometrial stromal sarcoma: a population-based analysis. Cancer Commun. 2020;40(7):301–312. doi:10.1002/cac2.12067
56. Van Calster B, Wynants L, Verbeek JFM, et al. Reporting and interpreting decision curve analysis: a guide for investigators. Eur Urol. 2018;74(6):796–804. doi:10.1016/j.eururo.2018.08.038
57. Xiao B, Liu L, Li A, et al. Identification and verification of immune-related gene prognostic signature based on ssGSEA for osteosarcoma. Front Oncol. 2020;10:607622. doi:10.3389/fonc.2020.607622
58. Newman AM, Liu CL, Green MR, et al. Robust enumeration of cell subsets from tissue expression profiles. Nat Methods. 2015;12(5):453–457. doi:10.1038/nmeth.3337
59. Zhou KR, Liu S, Sun W-J, et al. ChIPBase v2.0: decoding transcriptional regulatory networks of non-coding RNAs and protein-coding genes from ChIP-seq data. Nucleic Acids Res. 2017;45(D1):D43–d50. doi:10.1093/nar/gkw965
60. Singh A. RNA-binding protein kinetics. Nat Methods. 2021;18(4):335. doi:10.1038/s41592-021-01122-6
61. Li JH, Liu S, Zhou H, et al. starBase v2.0: decoding miRNA-ceRNA, miRNA-ncRNA and protein-RNA interaction networks from large-scale CLIP-Seq data. Nucleic Acids Res. 2014;42(Database issue):D92–7. doi:10.1093/nar/gkt1248
62. Jumper J, Evans R, Pritzel A, et al. Highly accurate protein structure prediction with AlphaFold. Nature. 2021;596(7873):583–589. doi:10.1038/s41586-021-03819-2
63. Knapp M, Górski J, Lewkowicz J et al. The gene and protein expression of the main components of the lipolytic system in human myocardium and heart perivascular adipose tissue. Effect of coronary atherosclerosis. Int J Mol Sci. 2020;21(3).
64. Heier C, Radner FPW, Moustafa T, et al. G0/G1 switch gene 2 regulates cardiac lipolysis. J Biol Chem. 2015;290(43):26141–26150. doi:10.1074/jbc.M115.671842
65. Yang X, Lu X, Lombès M, et al. The G(0)/G(1) switch gene 2 regulates adipose lipolysis through association with adipose triglyceride lipase. Cell Metab. 2010;11(3):194–205. doi:10.1016/j.cmet.2010.02.003
66. Shi Y, Yang S, Luo M, et al. Systematic analysis of coronary artery disease datasets revealed the potential biomarker and treatment target. Oncotarget. 2017;8(33):54583–54591. doi:10.18632/oncotarget.17426
67. Ahmad Z, Blin J, Rampal L, et al. Association of LDLR, TP53 and MMP9 Gene polymorphisms with atherosclerosis in a Malaysian study population. Curr Probl Cardiol. 2023;48(6):101659. doi:10.1016/j.cpcardiol.2023.101659
68. Jeon S, Kim TK, Jeong S-J, et al. Anti-inflammatory actions of soluble Ninjurin-1 ameliorate atherosclerosis. Circulation. 2020;142(18):1736–1751. doi:10.1161/CIRCULATIONAHA.120.046907
69. Brænne I, Willenborg C, Tragante V, et al. A genomic exploration identifies mechanisms that may explain adverse cardiovascular effects of COX-2 inhibitors. Sci Rep. 2017;7(1):10252. doi:10.1038/s41598-017-10928-4
70. Wågsäter D, Zhu C, Björkegren J, et al. MMP-2 and MMP-9 are prominent matrix metalloproteinases during atherosclerosis development in the Ldlr(-/-)Apob(100/100) mouse. Int J Mol Med. 2011;28(2):247–253. doi:10.3892/ijmm.2011.693
71. Li T, Li X, Feng Y, et al. The role of matrix metalloproteinase-9 in atherosclerotic plaque instability. Mediators Inflamm. 2020;2020:3872367. doi:10.1155/2020/3872367
72. Sharifi MA, Wierer M, Dang TA, et al. ADAMTS-7 modulates atherosclerotic plaque formation by degradation of TIMP-1. Circ Res. 2023;133(8):674–686. doi:10.1161/CIRCRESAHA.123.322737
73. Hetz C. The unfolded protein response: controlling cell fate decisions under ER stress and beyond. Nat Rev Mol Cell Biol. 2012;13(2):89–102. doi:10.1038/nrm3270
74. Brenner C, Galluzzi L, Kepp O, et al. Decoding cell death signals in liver inflammation. J Hepatol. 2013;59(3):583–594. doi:10.1016/j.jhep.2013.03.033
75. Wang L, Wang M, Niu H, et al. Cholesterol-induced HRD1 reduction accelerates vascular smooth muscle cell senescence via stimulation of endoplasmic reticulum stress-induced reactive oxygen species. J Mol Cell Cardiol. 2024;187:51–64. doi:10.1016/j.yjmcc.2023.12.007
76. Lacy P. Mechanisms of degranulation in neutrophils. Allergy Asthma Clin Immunol. 2006;2(3):98–108. doi:10.1186/1710-1492-2-3-98
77. Ricevuti G, Mazzone A, De Servi S, et al. New trends in coronary artery disease: the role of granulocyte activation. Atherosclerosis. 1989;78(2–3):261–265. doi:10.1016/0021-9150(89)90232-3
78. Lagrand WK, Visser CA, Hermens WT, et al. C-reactive protein as a cardiovascular risk factor: more than an epiphenomenon? Circulation. 1999;100(1):96–102. doi:10.1161/01.CIR.100.1.96
79. Madjid M, Awan I, Willerson JT, et al. Leukocyte count and coronary heart disease: implications for risk assessment. J Am Coll Cardiol. 2004;44(10):1945–1956. doi:10.1016/j.jacc.2004.07.056
80. Maree AO, Fitzgerald DJ. Aspirin and coronary artery disease. Thromb Haemost. 2004;92(6):1175–1181. doi:10.1160/TH04-02-0127
81. Kasmeridis C, Apostolakis S, Lip GY, et al. Aspirin and aspirin resistance in coronary artery disease. Curr Opin Pharmacol. 2013;13(2):242–250. doi:10.1016/j.coph.2012.12.004
82. Bavry AA, Elgendy IY, Elbez Y, et al. Aspirin and the risk of cardiovascular events in atherosclerosis patients with and without prior ischemic events. Clin Cardiol. 2017;40(9):732–739. doi:10.1002/clc.22724
83. Do GM, Kwon E-Y, Kim H-J, et al. Long-term effects of resveratrol supplementation on suppression of atherogenic lesion formation and cholesterol synthesis in apo E-deficient mice. Biochem Biophys Res Commun. 2008;374(1):55–59. doi:10.1016/j.bbrc.2008.06.113
84. Berrougui H, Grenier G, Loued S, et al. A new insight into resveratrol as an atheroprotective compound: inhibition of lipid peroxidation and enhancement of cholesterol efflux. Atherosclerosis. 2009;207(2):420–427. doi:10.1016/j.atherosclerosis.2009.05.017
85. Li Y, CAO Z, ZHU H, et al. Upregulation of endogenous antioxidants and Phase 2 enzymes by the red wine polyphenol, resveratrol in cultured aortic smooth muscle cells leads to cytoprotection against oxidative and electrophilic stress. Pharmacol Res. 2006;53(1):6–15. doi:10.1016/j.phrs.2005.08.002
86. Olas B, Wachowicz B, Saluk-Juszczak J, et al. Effect of resveratrol, a natural polyphenolic compound, on platelet activation induced by endotoxin or thrombin. Thromb Res. 2002;107(3–4):141–145. doi:10.1016/S0049-3848(02)00273-6
87. Yang Y, Wang X, Zhang L, et al. Inhibitory effects of resveratrol on platelet activation induced by thromboxane a(2) receptor agonist in human platelets. Am J Chin Med. 2011;39(1):145–159. doi:10.1142/S0192415X11008713
88. Chu LM, Lassaletta AD, Robich MP, et al. Resveratrol in the prevention and treatment of coronary artery disease. Curr Atheroscler Rep. 2011;13(6):439–446. doi:10.1007/s11883-011-0202-3
89. Shi R, Liu Z, Yin J, et al. Quercetin relieves coronary atherosclerosis via regulating fibroblast growth factor 2. Cell Mol Biol. 2023;69(15):223–229. doi:10.14715/cmb/2023.69.15.38
 © 2024 The Author(s). This work is published and licensed by Dove Medical Press Limited. The
full terms of this license are available at https://www.dovepress.com/terms
and incorporate the Creative Commons Attribution
- Non Commercial (unported, 3.0) License.
By accessing the work you hereby accept the Terms. Non-commercial uses of the work are permitted
without any further permission from Dove Medical Press Limited, provided the work is properly
attributed. For permission for commercial use of this work, please see paragraphs 4.2 and 5 of our Terms.
© 2024 The Author(s). This work is published and licensed by Dove Medical Press Limited. The
full terms of this license are available at https://www.dovepress.com/terms
and incorporate the Creative Commons Attribution
- Non Commercial (unported, 3.0) License.
By accessing the work you hereby accept the Terms. Non-commercial uses of the work are permitted
without any further permission from Dove Medical Press Limited, provided the work is properly
attributed. For permission for commercial use of this work, please see paragraphs 4.2 and 5 of our Terms.